
Abstract
Introduction
S
Noninvasive imaging biomarkers of vascular renormalization during anti-angiogenic therapy in solid tumors are needed to predict treatment response and to avoid treatment failure. In this study, we demonstrated that a multi-modal imaging approach combining two novel techniques, redox magnetic resonance imaging (MRI) with nitroxides and metabolic MRI using hyperpolarized 13C pyruvate, with other physiologic imaging techniques can compensate for the limitations and uncertainty of individual imaging modalities and precisely identify the window of vascular normalization during anti-angiogenic therapy.
Anti-angiogenic therapy using anti-vascular endothelial growth factor (VEGF) agents is a treatment strategy that is used to prune aberrant tumor blood vessels and shutdown the delivery of nutrients and oxygen to starve tumors (15). However, a number of preclinical studies have shown that anti-angiogenic therapies can transiently “normalize” the aberrant tumor vessels (21). The vascular normalization causes a transient increase in blood perfusion and reduced hypoxia; the inclusion of concomitant chemotherapies and radiotherapies during this renormalization window results in a better response than monotherapy (1, 9, 26, 41). Although clinical evidence for the vascular normalization was provided in patients with rectal carcinoma and recurrent glioblastomas (5, 40), the benefit of the vascular normalization during anti-angiogenic treatment has been still considered limited because of relatively ephemeral window of vascular normalization (<1 week) and the lack of information on survival benefit. Recently, Sorensen et al. reported a breakthrough result from a clinical trial in which they observed that the judicious administration of cediranib increased tumor blood perfusion for more than 1 month in human glioblastoma; the increased perfusion was significantly associated with extended survival (36). These studies emphasized the use of noninvasive serial physiologic and metabolic imaging techniques to identify the transient “renormalization” window in which to combine radiotherapy and chemotherapy for an improved response.
A major challenge identified in the effort to optimize anti-angiogenic therapies is the development of noninvasive imaging biomarkers of the vascular normalization process in tumors (23). Conventional anatomic or vascular imaging is impractical or inefficient to identify the vascular normalization period. In the human glioblastoma studies reported by Sorensen et al., magnetic resonance imaging (MRI) with arterial spin labeling (ASL) was used to detect tumor perfusion changes during the vascular normalization period (36). ASL-MRI uses endogenous water as a tracer and provides absolute perfusion values, avoiding contrast agents to enable repeated measurements and comparisons between patients. A limitation of ASL-MRI for perfusion imaging is that a relatively small MRI signal change is induced by the spin labeling (usually a few percent), resulting in a significant number of patients being excluded due to technical imaging failures (10). To expand the application to tumors in various organs, robust metabolic and physiological imaging techniques that are capable of identifying tumor microenvironmental changes associated with vascular normalization are desirable.
In the present study, we evaluated two novel imaging techniques: (i) metabolic MRI using hyperpolarized 13C-labeled pyruvate and monitoring its products; and (ii) redox status MRI using the nitroxide 3-carbamoyl PROXYL, a redox-sensitive contrast agent. These techniques were able to probe tumor microenvironmental changes in response to anti-angiogenic treatment and to provide imaging biomarkers that are capable of identifying the tumor vascular renormalization period.
Results
Anti-angiogenic effect of sunitinib and tumor growth suppression in SCCVII tumor
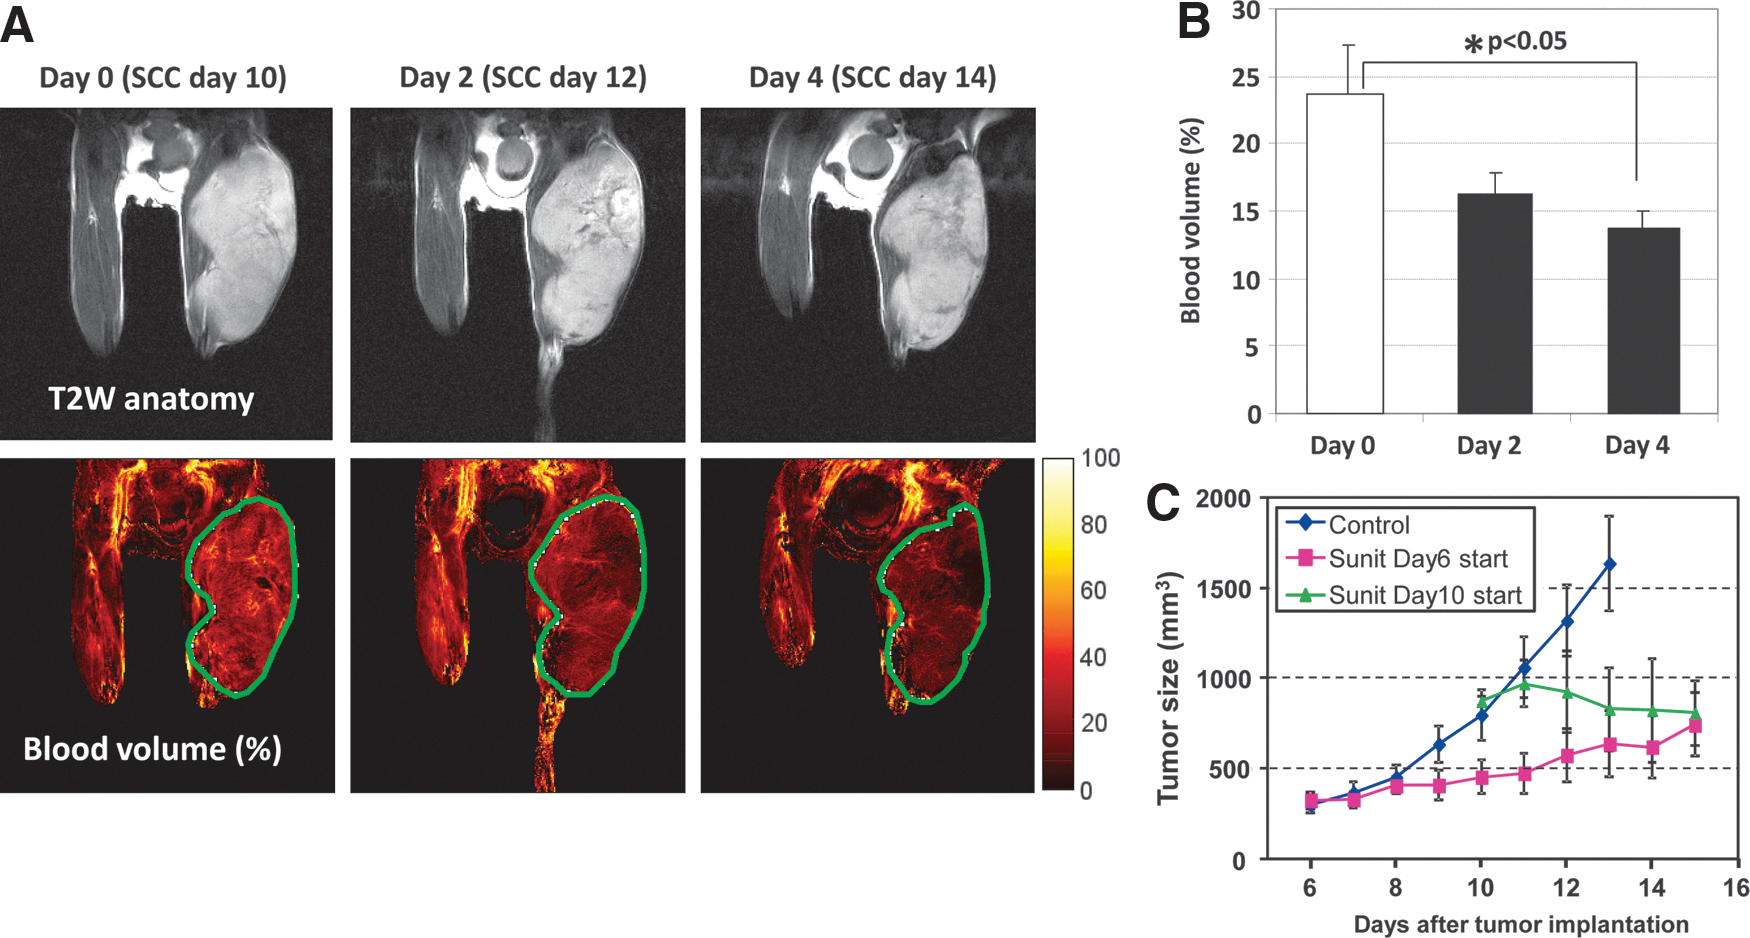
Sunitinib (SU11248) is an orally bio-available, small-molecule multiple receptor tyrosine kinase inhibitor currently in phase III clinical trials. Its targets include receptors for platelet-derived growth factor and VEGF. The anti-angiogenic effects of sunitinib were noninvasively evaluated by blood volume imaging with MRI using ultrasmall superparamagnetic iron oxide (USPIO) in subcutaneous SCCVII tumors in mice. Figure 1A shows the representative blood volume images of SCCVII tumors before and after daily sunitinib treatment. A reduction in tumor blood volume, a surrogate maker of microvessel density, was observed within 2 days of the initiation of sunitinib treatment, and reached statistical significance at 4 days (Fig. 1B). Sunitinib treatment suppressed tumor growth compared with nontreated control tumors, regardless of whether the treatment was initiated at different stages of tumor growth on day 6 or 10 (Fig. 1C). These results suggest that sunitinib treatment reduces microvessel density and suppresses the growth of SCCVII tumors, but the blood volume imaging did not provide information about the function or quality of the tumor blood vessels. It is still unclear whether the observed tumor growth suppression results from tumor starvation due to the hypo-vascularization induced by sunitinib.
Sunitinib treatment increases tumor Gd-chelate uptake in MRI study
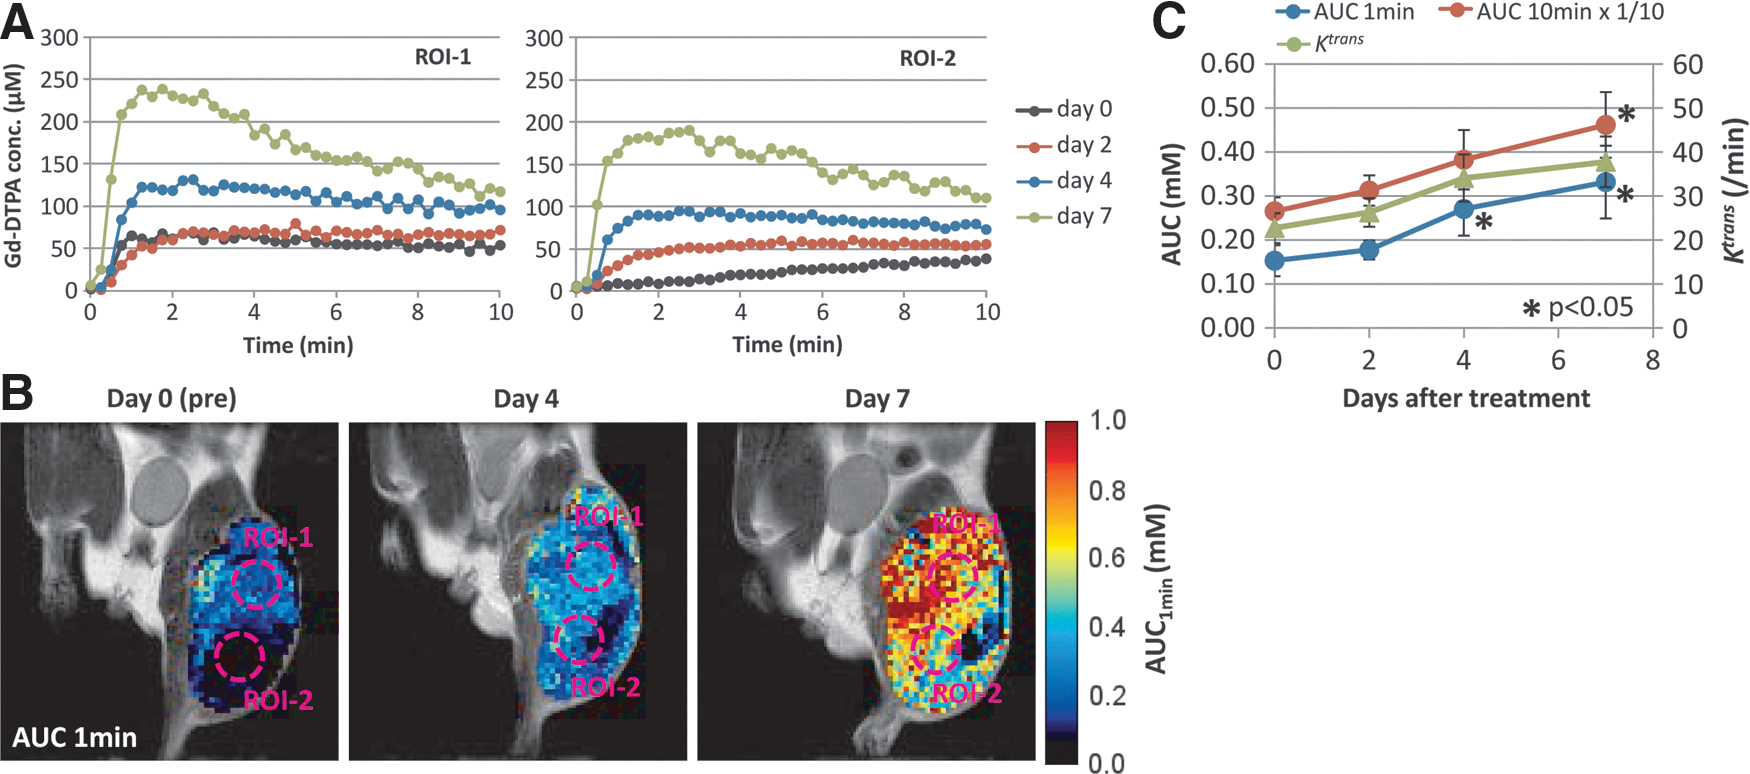
The increase in tumor blood perfusion after anti-angiogenic therapy is a direct evidence of the ongoing vascular normalization process. Of the clinically available imaging techniques, dynamic contrast-enhanced (DCE)-MRI using Gd-chelate complexes is the most widely used to show tumor perfusion changes in response to treatment. Figure 2A shows the kinetic curve of intravenously injected Gadolinium (III)-diethyltriaminepentaacetic acid (Gd-DTPA) in two representative tumor regions before and after 2–7 days of sunitinib treatment. The concentrations of tumor Gd-DTPA were estimated from signal intensity changes in the dynamic T1 weighted MRI images. The same two regions of interest were indicated on the images of the area under the curve of the Gd-DTPA concentration for the first 1 min after the Gd-DTPA injection (Fig. 2B). Gd-DTPA uptake significantly increased after 4 and 7 days of sunitinib treatments (Fig. 2C). The increase in Gd-DTPA uptake was significantly higher at early time points (<2 min) compared with later time points around 10 min. The results from this DCE-MRI study suggest that tumor blood vessels are normalized by sunitinib treatment, resulting in the improvement of tumor blood perfusion.
Sunitinib treatment transiently improves tumor oxygenation
Tissue partial pressure of oxygen (pO2) is determined by the local supply and tissue consumption of oxygen. An increase in tumor blood perfusion may result in improved tumor oxygenation that can be a surrogate imaging marker of the temporary vascular normalization window in tumor-bearing mice treated with sunitinib.
Electron paramagnetic resonance imaging (EPRI) is an imaging technique similar to MRI. EPRI detects unpaired electron spins of free radical species, whereas MRI detects nuclear spins such as water protons. Dipolar interactions between the exogenoustracer OX063 and paramagnetic oxygen molecules result in the broadening of the EPR spectral line width of OX063, which enables the mapping of the distribution of in vivo tissue oxygen concentrations quantitatively and serially.
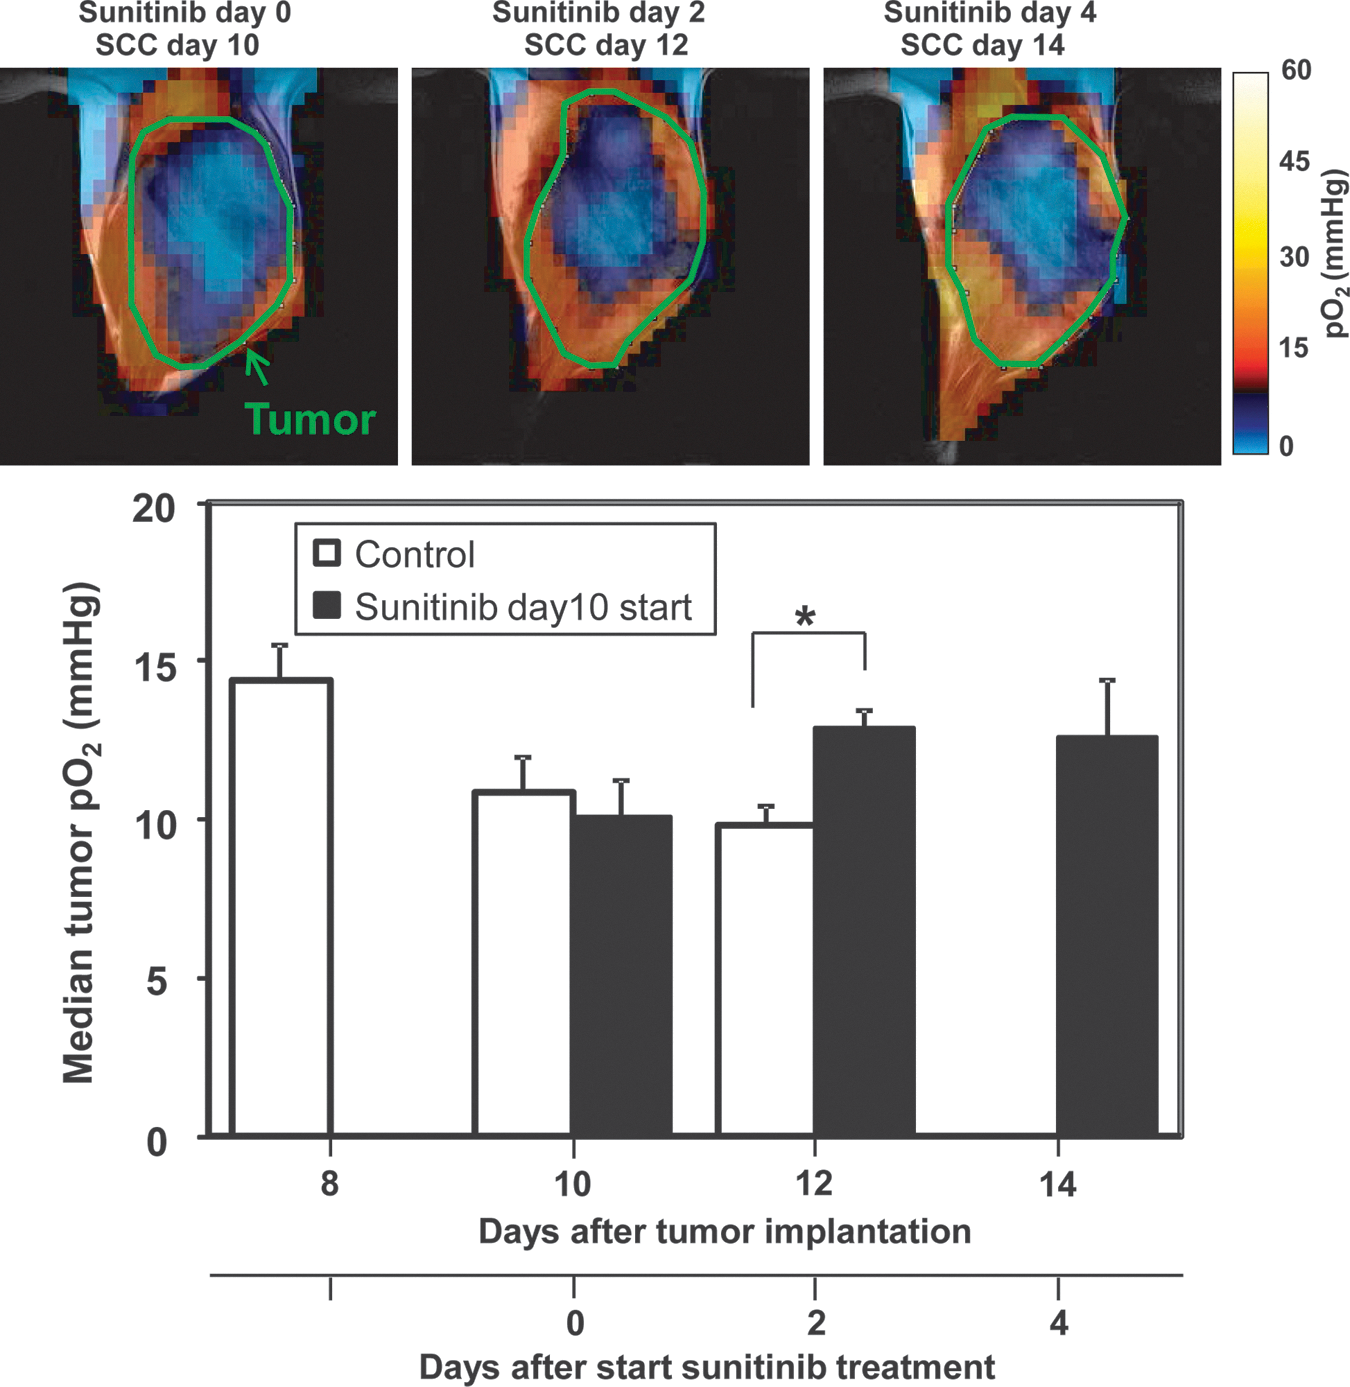
Figure 3 shows the representative EPR oxygen images of squamous cell carcinoma (SCC) tumors obtained before, 2 and 4 days after sunitinib treatment (upper panels). In the untreated control SCC tumors, the median pO2 in tumor regions gradually decreased, accompanied by an increase in tumor size (see Fig. 1C for tumor growth curve). Daily sunitinib treatments resulted in the suppression of tumor growth and a transient increase in median tumor pO2 at 2 and 4 days after the initiation of treatment (Fig. 3, lower panel). The transient increase in tumor oxygenation by sunitinib is consistent with the improvement of tumor perfusion during the vascular normalization window. However, a possible contribution of decreased tumor oxygen consumption, possibly due to cell death by the treatment, cannot be excluded from the results of EPR experiments.
Sunitinib suppresses conversion of pyruvate to lactate
Tumor microenvironmental changes affect gene expression and cell signaling pathways that are dependent on energy metabolism. The advent of metabolic MRI, using the hyperpolarization of endogenous 13C-labeled molecules to confer the 4 orders enhancement in sensitivity, has made it possible to image molecules involved in cellular energetics/redox processes and their breakdown products (16, 28, 33). This novel technique, known as hyperpolarized 13C MRI, has enabled the noninvasive imaging of pyruvate and its metabolites, which are chemically distinct and can be individually visualized using spectroscopic imaging sequences. While tumors predominantly convert pyruvate to lactate, this process may be sensitive to tumor oxygenation changes during anti-angiogenic treatments.
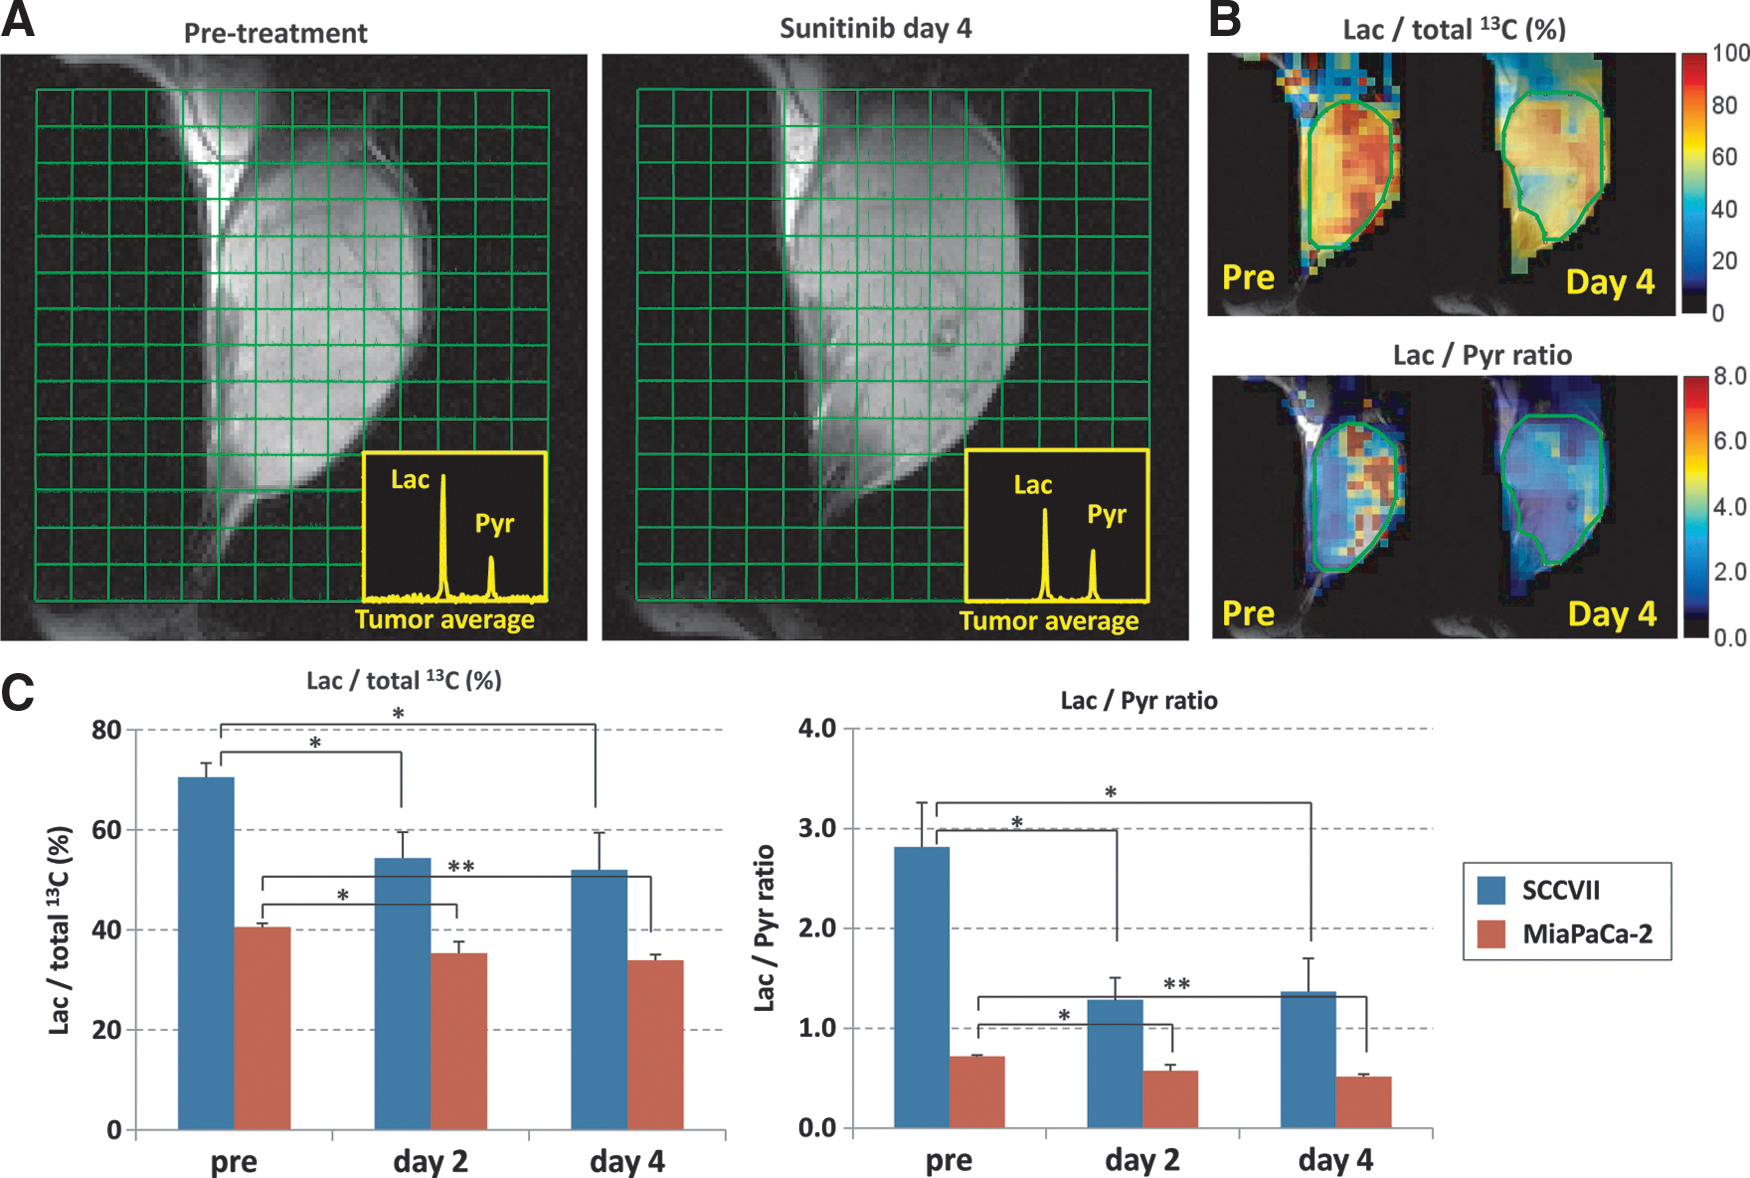
Figure 4A shows representative images of the 13C MRI obtained 30 s after the intravenous injection of hyperpolarized 1-13C-pyruvate into SCCVII tumor-bearing mice. The injected pyruvate is rapidly converted to lactate, and a strong lactate peak is observed in the tumor region. Sunitinib treatment suppressed the flux of pyruvate to lactate conversion at day 4 (Fig. 4A, right image). Parametrically generated lactate-to-pyruvate ratio maps can visually demonstrate the heterogeneous distribution of the lactate-to-pyruvate ratio and the region of response to sunitinib treatment (Fig. 4B). The quantitative analysis of the lactate peak and the lactate-to-pyruvate ratio in the SCCVII tumor regions showed a significant decrease in the flux of pyruvate-to-lactate conversion after 2 and 4 days of sunitinib treatment. A similar result was observed in human pancreatic tumor xenografts (MiaPaCa-2).
The redox couple of NADH/NAD+ is closely linked with the metabolic couple of pyruvate/lactate via lactate dehydrogenase (LDH). Tumor NADH/NAD+ ratios, measured in an independent set of mice (n=8 for each group), before treatment and after 2 and 4 days of sunitinib treatment were 0.183±0.009, 0.228±0.011, and 0.209±0.015, respectively. A tendency toward a transient increase in the NADH/NAD+ ratio after 2–4 days of sunitinib treatment (p<0.05 for before vs. 2 days after treatment) is consistent with the reduction in the metabolic flux of pyruvate-to-lactate conversion demonstrated by hyperpolarized 13C MRI. These results suggested that the hyperpolarized 13C MRI of pyruvate metabolism can be a surrogate imaging marker of the vascular normalization window.
Sunitinib induces an oxidative shift in tumor redox status
Nitroxyl radicals, well known as nitroxides, are relatively stable organic free radicals, which have an unpaired electron, and therefore provide T1 contrast in MRI (8, 20). In biological systems, a fraction of administered nitroxides will be reduced to the corresponding diamagnetic hydroxylamine form. Since this bioreduction of nitroxides is susceptible to the net redox status of the system (Fig. 5A), nitroxides serve as redox-sensitive T1 contrast agents for MRI; whereas Gd3+ contrast agents are redox inert, and their time-intensity curves reflect only perfusion and/or permeability. We investigated whether redox MRI using a nitroxide 3-carbamoyl-PROXYL could detect tumor microenvironmental changes during the sunitinib-induced tumor vascular normalization window.
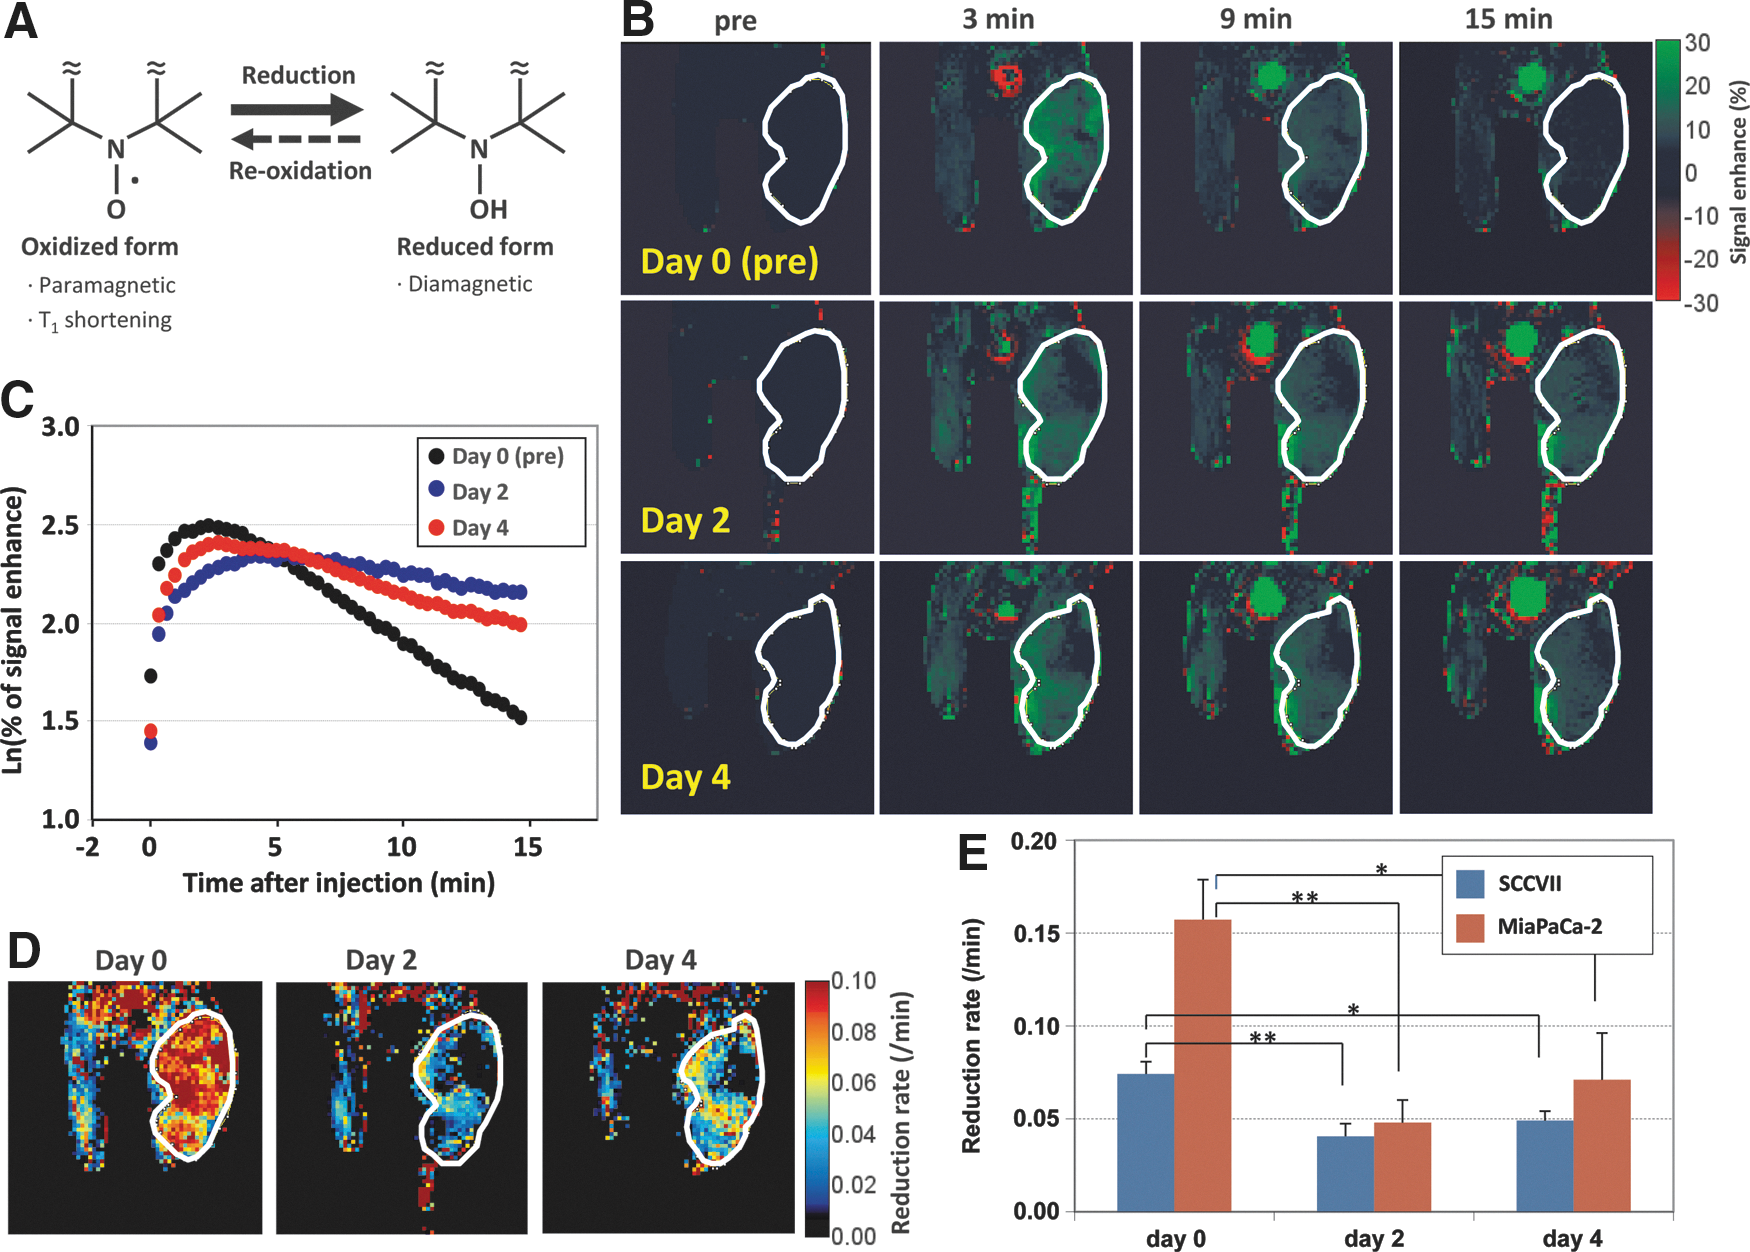
Immediately after the intravenous injection of 3-carbamoyl-PROXYL, an increase in 1H MRI signal intensity was observed (Fig. 5B). The signal enhancement reached a peak 1–5 min after the injection, and then gradually decreased with time (Fig. 5C). The decay of the MRI signal from nitroxide was faster in the tumor region compared with surrounding normal tissues because of the hypoxic and reductive microenvironment of the tumor, which is well described elsewhere (19). Logarithmic plots of the signal enhancement in tumor regions showed a linear decay after reaching the peak (Fig. 5C). The pixel-by-pixel calculation of the decay slope of the enhanced MRI signal intensity from the dynamic image data sets provides the reduction rate, that is, redox maps (Fig. 5D). The reduction rate in tumor regions significantly decreased after 2 and 4 days of sunitinib treatment compared with the rate at pretreatment (day 0) in both SCCVII and MiaPaCa-2 tumors, suggesting an oxidative shift in the tumor redox status during the vascular normalization window (Fig. 5E).
Discussion
Vascular imaging techniques, including angiography and blood volume imaging as a marker of microvessel density, provide evidence that anti-angiogenic therapy actually prunes tumor blood vessels, but little information is provided about the function of the remaining blood vessels (18, 26). Molecular imaging tracers that target molecules overexpressed on tumor blood vessels, including integrins and VEGF receptors (VEGFR), are also being developed for use in PET and SPECT imaging (4). Some of these tracers are in clinical trials, but further optimization is required. Morrison et al. used an integrin-targeted PET tracer (18F-AH111585) in mice bearing human lung adenocarcinoma Calu-6 tumors. The study showed that the VEGFR-2 inhibitor ZD4190 reduced the uptake of the tracer by 31.8% relative to pretreatment levels, whereas the microvessel density measured by CD31 immunostaining showed no difference between ZD4190-treated and control mice (30). Battle et al. reported the opposite tendency; sunitinib treatment reduced the microvessel density by ∼73% in U87 glioblastoma bearing mice, but only a 13%–17% decrease in 18F-AH111585 uptake was observed (6). Some VEGF-based tracers binding to VEGFR-1 and -2 are reported to affect host vasculature even at low concentrations (4). Clearly, further research is necessary to use these targeted vascular imaging tracers for monitoring the response to anti-angiogenic therapy.
Monitoring the distribution and leakage of exogenously administered tracers from blood vessels can help in assessing tumor perfusion and vascular permeability. These tracers diffuse from the blood circulation into the extravascular extracellular space at a rate determined by blood perfusion, vascular permeability, and surface area. The endothelial (volume) transfer coefficient Ktrans can be obtained from the pharmacokinetic modeling of the tracer-induced dynamic signal change. The interpretation of such kinetic information depends on the molecular size of the tracers (11, 29). Small tracers, such as 15O-labeled H2O in PET, can easily diffuse across the endothelial barrier, and their blood-to-tissue transfer rate sufficiently reflects the blood perfusion difference. In contrast, the endothelial transfer of large tracers is distinctly sensitive to the microvascular permeability difference. DCE-MRI with Gd-chelate complexes is a widely used MRI technique for perfusion imaging, especially in tumors. Gd-DTPA is a relatively small molecule that is used to probe blood perfusion differences but is not small enough to make the contribution from vascular permeability negligible. Therefore, the Ktrans of Gd-DTPA is sensitive to both tumor perfusion and permeability changes in response to anti-angiogenic treatments. The consensus from previous studies is that the usage of only early time points from the time intensity curves after a bolus injection of the Gd-chelate minimizes the effect of vascular permeability changes and primarily reflects the change in perfusion (7, 31). However, there can be uncertainties in unequivocally determining the contributions of perfusion and permeability to an MRI signal change.
EPRI is a method that can noninvasively provide quantitative oxygen images in living subjects (12 –14, 27). The information obtained from the serial and quantitative pO2 imaging experiments with EPRI was found to be useful in monitoring tumor microenvironmental changes during anti-angiogenic therapy, and it enables radiation therapy to be delivered during the vascular renormalization window for maximum effect (26, 34). Tissue oxygen concentration is determined by the balance of its supply and consumption. Improved tumor oxygenation does not always result from an increase in tumor perfusion. Ansiaux et al. reported that the anti-angiogenic drugs SU5414 and vandetanib increased tumor oxygenation by decreasing oxygen consumption (2, 3). It is possible that the contribution of such mechanisms or simply treatment-induced cell death and the resultant decrease in tissue oxygen consumption can influence the regional oxygen concentration. In addition, transversal relaxation time T2*-dependent EPR oximetry is susceptible to the self-relaxation of the tracer. The accuracy of pO2 values can, therefore, be partially affected by the distribution of the tracer concentration. Epel at al. recently reported the use of longitudinal relaxation time T1-based EPR oxygen imaging using the inversion-recovery spin echo method (14). Such T1-based EPR oximetry can minimize the effect of self-relaxation and may improve the accuracy of pO2 measurements during anti-angiogenic treatment. Collectively, although each of these imaging modalities provide useful biomarkers of the vascular normalization in tumors, it is necessary, at least in preclinical studies, to evaluate their individual capabilities comparatively for clinical translation.
In the present study, we investigated the changes in tumor physiology, metabolism, and redox status using the novel imaging techniques: (i) redox status imaging with MRI using a redox-responsive nitroxide contrast agent; (ii) metabolic MRI using 13C-labeled pyruvate, monitoring its conversion to lactate through tumor glycolysis and evaluated these biomarkers of tumor microenvironmental change to identify the vascular normalization window. The clearance rate of nitroxide from the body is sensitive to the net force of the bioreduction of nitroxide to its corresponding hydroxylamine form in addition to changes in basic pharmacokinetic parameters, such as distribution, renal excretion, and metabolism. The reducing force of nitroxide in the system is determined by the surrounding microenvironment, including the oxygen concentration, oxidative stress, the activity of redox-sensitive enzymes, and the local concentrations of oxidizing and/or reducing substrates (37). In this study, we observed that the rate constant of nitroxide clearance is significantly attenuated in tumors after 2–4 days of sunitinib treatment, suggesting a global oxidative shift in tumor redox environment as a result of improved tumor perfusion and oxygenation during the vascular normalization window. Tumor perfusion changes might directly affect the results of the redox MRI experiments. An increase in local perfusion could promote the washout of nitroxide from tumor tissue and result in an underestimation of the oxidative shift in redox status during the vascular normalization window.
Redox environmental changes affect gene expression and cell signaling pathways that regulate the energy metabolism of cells. The tissue redox state can be estimated by measuring the concentration ratio of a specific redox couple of metabolites (35). The redox potential or simply the concentration ratio of lactate-to-pyruvate has been traditionally used to estimate the redox potential of cells and tissues. Gudbjarnason and Bing compared the redox potentials of the lactate/pyruvate couple in arterial and coronary vein blood and found that the redox potential of heart muscle was ∼20 mV more negative under anoxia compared with under normoxic conditions (17). The pyruvate-to-lactate flux is related to the cytosolic NAD+/NADH couple as a result of the rapid equilibrium of the LDH reaction:
The recent development of the novel metabolic MRI technique using hyperpolarized 13C-labeled pyruvate enabled the noninvasive imaging of pyruvate-lactate flux in living creatures, including humans (16, 33). We have shown in this study that the conversion of pyruvate to lactate decreased in tumors after 2–4 days of sunitinib treatment, and it was accompanied by an increase in the NADH/NAD+ ratio, suggesting an attenuated glycolytic process. This observation is consistent with the pO2 imaging studies showing increased pO2 during this time window and a shift to a more oxidized environment suggested by redox MRI using nitroxides. In the hyperpolarized 13C MRI study, since the enhanced 13C NMR signal disappears within a few minutes after the dissolution process, the spectroscopic image has to be acquired quite rapidly. This constrains the available spatial resolution to typically 2–4 mm for experimental animals and 7–15 mm for humans. Even with such limited spatial resolution, we could observe the heterogeneous distribution of pyruvate-to-lactate flux within the tumor region. The feasibility of hyperpolarized 13C MRI to map tumor metabolic changes in response to anti-angiogenic treatment can potentially identify locations of ongoing vascular normalization in tumors and may confer useful information for designing the dose-mapping for intensity modulated radiation therapy.
In conclusion, two established preclinical imaging techniques (EPRI and redox-status MRI with nitroxides) lend validity to metabolic MRI using hyperpolarized 13C-pyruvate, a recently clinically implemented technique designed to detect the shift in tumor energy metabolism during the vascular normalization window induced by anti-angiogenic treatment with sunitinib.
Materials and Methods
Chemicals
Sunitinib malate was purchased from LC Laboratories. Gd-DTPA, and USPIO (Molday ION) were obtained from BioPAL, Inc. 1-13C-pyruvic acid was purchased from Cambridge Isotope Laboratories, Inc. and Isotec, Inc. The triarylmethyl EPR oxygen tracer OX063 (methyl-tris[8-carboxy-2,2,6,6-tetrakis[(2-hydroxyethyl]-benzo[1,2-d:4,5-d′]bis[1,3]dithiol-4-yl] trisodium salt) was obtained from GE Healthcare. 3-carbamoyl-PROXYL was purchased from Sigma.
Animal experiments
All animal experiments were conducted in compliance with the Guide for the Care and Use of Laboratory Animal Resources (National Research Council, 1996), and the experimental protocols were approved by the National Cancer Institute Animal Care and Use Committee. Female C3H/Hen mice and athymic nude mice were supplied by the Frederick Cancer Research Center, Animal Production.
Mouse squamous cell carcinoma SCCVII cells (obtained from Dr. T. Phillips, UCSF) and human pancreatic adenocarcinoma MiaPaCa-2 cells (obtained from ATTC) were authenticated in May 2013 by RADIL using a panel of microsatellite markers. Cells were routinely cultured in RPMI 1640 with 10% FCS. We established subcutaneous tumor models as previously described (27). Briefly, SCCVII and MiaPaCa-2 tumors were formed by injecting 3×10⁵ and 2×10⁶ cells subcutaneously into the right hind legs of female C3H/Hen mice and athymic nude mice, respectively. Sunitinib suspension was prepared by adding 12.5 mg of sunitinib malate into 1 ml of 0.5% methylcellulose/0.5% Tween 80 solution and stored at 4°C until use. Tumor-bearing mice were treated daily with the oral administration of 50 mg sunitinib per kg body weight at 6 or 10 days after tumor implantation.
In the imaging experiments, mice were anesthetized by isoflurane inhalation (4% for inducing and 1%–2% for maintaining anesthesia) and positioned prone with their tumor-bearing legs placed inside the resonator. During EPRI and MRI measurements, the breathing rate of the mouse was monitored with a pressure transducer (SA, Instruments, Inc.) and maintained at 60±15 breaths per min. Core body temperature was maintained at 36°C±2°C with a flow of warm air for EPRI and with a warm water pad for MRI.
EPRI for pO2
The technical details of the EPR scanner and oxygen image reconstruction were described in earlier reports (25, 27, 38). Parallel coil resonators tuned to 300 MHz were used for EPRI and MRI. After the animal was placed in the resonator, the triarylmethyl EPR oxygen tracer OX063 (1.125 mmol/kg bolus) was injected intravenously under isoflurane anesthesia. The repetition time was 8.0 μs. The free induction decay (FID) signals were collected following the radiofrequency excitation pulses under a nested looping of the x, y, and z gradients and each time point in the FID underwent phase modulation enabling 3D spatial encoding. Since FIDs last for 1 to 5 μs, it is possible to generate a sequence of T2* maps that is, EPR line width maps, which linearly correlate with the local concentration of oxygen and enable the pixel-wise estimation of pO2.
MRI for anatomy and blood volume
MRI scans were conducted using a 7T scanner (Bruker BioSpin MRI GmbH). T2-weighted anatomic images were obtained using a fast spin echo sequence [rapid acquisition with relaxation enhancement (RARE)] with an echo time of 13 ms, a repetition time of 2500 ms, a RARE factor of 8, and a resolution of 0.125×0.125 mm2. For the convenience of coregistration with EPRI, all MRI images had the same slice thickness of 2 mm and a field of view (FOV) of 2.8 cm with 14 slices. For blood volume calculation, spoiled gradient echo sequence images were collected before and 5 min after USPOI injection (1.2 ml/g body weight) with the following parameters: matrix=256×256; echo time=5.4 ms; and repetition time=250 ms. The percentage of tumor blood volume was estimated as previously described (18). The coregistration of EPRI and MRI images was accomplished using a code written in MATLAB (MathWorks) as previously described (27).
13C MRI of hyperpolarized 13C-labeled pyruvate metabolism
Samples of [1-13C] pyruvic acid (30 μl) containing 15 mM TAM and 2.5 mM gadolinium chelate ProHance (Bracco Diagnostics) were polarized at 3.35 T and 1.4 K in the Hypersense DNP polarizer (Oxford Instruments), according to the manufacturer's instructions. After 40–60 min, the hyperpolarized sample was rapidly dissolved in 4.5 ml of a superheated alkaline buffer composed of 40 mM 4-(2-hydroxyethyl)-1-piperazineethanesulfonic acid (HEPES), 30 mM NaCl, and 100 mg/L ethylendiaminetetraacetic acid (EDTA). NaOH was added to the dissolution buffer to a final pH of 7.4 after mixture with [1-13C] pyruvic acid. Hyperpolarized [1-13C] pyruvate solution (12 μl/g body weight) was intravenously injected through a catheter placed in the tail vein of each mouse. Due to the large injection volume, the injection was slowly administered over 12–14 s.
Hyperpolarized 13C MRI studies were performed on a 4.7T scanner (Bruker Bio-Spin MRI GmbH) using a 17-mm home-built 13C solenoid coil placed inside a saddle coil for 1H. The 13C two-dimensional spectroscopic images were acquired at 30 s after the start of pyruvate injection from a 28×28 mm FOV in an 8 mm coronal slice through the tumor with a matrix size of 16×16, a spectral width of 6010 Hz, repetition time (TR) 75 ms, and a 250 μs Gaussian excitation pulse with a flip angle of 5°. The total time required to acquire an image was 19.2 s.
DCE-MRI of Gd-DTPA uptake
DCE-MRI studies were performed on a 1.0T scanner (ICON; Bruker Bio-Spin MRI GmbH). T1-weighted fast low-angle shot (FLASH) images were obtained with TE=6 ms, TR=118 ms, a flip angle of 30°, four slices, 0.5×0.5 mm2 resolution, 15 s acquisition time per image, and 60 repetitions. Gd-DTPA solution (0.25 mmol/kg body weight) was injected through a tail vein cannula at 2 min after the start of the dynamic FLASH sequence. To calculate the local concentrations of Gd-DTPA, T1 maps were calculated from three sets of RARE images obtained with TR=500, 1000, and 2000 ms before running the FLASH sequence. The endothelial transfer coefficient Ktrans was calculated by fitting the dynamic MRI signal change to the standardized Tofts model (39).
Redox status MRI using 3-carbamoyl-PROXYL
The details of redox-sensitive MRI with nitroxides were previously reported (20, 24). Briefly, the redox MRI studies were performed on a 7.0T scanner (Bruker Bio-Spin MRI GmbH). T1-weighted FLASH images were obtained with TE=4 ms, TR=156 ms, a flip angle of 45°, 4 slices, 0.5×0.5 mm2 resolution, 20 s acquisition time per image, and 51 repetitions. 3-carbamoyl-PROXYL solution (0.75 mmol/kg body weight) was injected through a tail vein cannula at 2 min after the start of the dynamic FLASH sequence. The initial 2 min of data were averaged and used as a baseline signal level.
Tissue NADH and NAD+ assay
Tissue NADH and NAD+ concentration in snap-frozen tumors were determined using an NAD+/NADH quantification kit (BioVision) according to the manufacturer's guidance.
Statistics
Data were expressed as the means±standard error. The paired Student's t-test was used to compare the values before and after treatment in the same group of mice. NADH/NAD+ ratios, which required independent sets of mice, were analyzed using the independent Student's t-test after the confirmation of equal variance by an F-test. Welch's test was used to compare values between nontreated control groups and treated groups of mice. p<0.05 was considered significant.
Footnotes
Acknowledgments
This research was supported by the Intramural Research Program, Center for Cancer Research, National Cancer Institute, National Institutes of Health (NIH). Collaboration with Dr. Yasukawa was also supported by the Core-to-Core Program (Grant No. 19004) from the Japan Society for the Promotion of Science (JSPS).
Author Disclosure Statement
All authors have no conflicts of interest to disclose.