
Abstract
Introduction
P
Reactive oxygen species (ROS) and reactive nitrogen species (RNS) have been associated with pre-eclampsia (46, 57, 74). Mitochondrial mass (mitochondria being major sources of ROS/RNS) is increased in pre-eclamptic placentas (72). However, when cytotrophoblast cells are isolated from these defective placentas, the expression of mtDNA and nuclear respiratory factor 1 (NRF1) (linked to the mitochondrial mass) is abnormally low (43). Proteomics analysis of severe pre-eclamptic placentas revealed altered mitochondria-related pathways such as fatty acid oxidation (4), ROS generation, and oxidative stress (64).
In this study, we show that a unique transcription factor, storkhead box 1 (STOX1), induces opposite O2-dependent effects on reactive oxygen species (ROS) and reactive nitrogen species (RNS) production in vitro as well as in vivo in a murine model of pre-eclampsia. We show a striking predominance of RNS in STOX1 transgenic placentas, suggesting that NO is rapidly associated with ROS and generates ONOO−. This would deprive endothelial cells from the essential vasodilating action of NO, thereby giving a rationale to the systemic hypertension of mice with transgenic (pre-eclamptic) placentas. Nitroso-redox imbalance could be considered the causative element in pre-eclampsia-induced hypertension and other vascular diseases. These observations may have implications for human pathogenesis and therapeutics.
Overexpression of the storkhead box 1 (STOX1) transcription factor (71) induces transcriptome alteration, mimicking pre-eclampsia in choriocarcinoma JEG-3 cells, used as proxies for trophoblast cells (56), and induces a pre-eclampsia-like syndrome in vivo in a transgenic mouse model (18). Major transcriptome alterations in cells overexpressing STOX1 involve several cellular pathways, among which the mitochondrial function is highly represented (56). This prompted us to further investigate how STOX1 regulates the mitochondrial function and ROS/RNS balance. In the present study, STOX1 overexpression in transgenic placentas and trophoblast cells strongly altered the ROS/RNS metabolism and mitochondrial function. The novel transcription factor STOX1 appears as a major regulator of the nitroso-redox balance and mitochondrial homeostasis, possibly depriving the maternal vascular system of nitric oxide (NO), a major agent of endothelium health. In cells overexpressing STOX1, the major hypoxamir miR-210 (29) is virtually extinguished, suggesting that trophoblast cells become unable to adapt to low O2 concentration.
Results
STOX1 placentas display massive deregulation of genes involved in mitochondrial function
The transcriptomes of 16.5 days post fertilization (dpc) transgenic versus wild-type (WT) placentas were compared, using Gene Set Enrichment Analysis (GSEA, see Materials and Methods section). Among 962 gene groups or pathways analyzed, 373 were identified as significant (false discovery rate [FDR] <0.25). Strikingly, 12 out of 13 mitochondria-related pathways belonged to this group (p=6.6×10⁻⁵, with FDR ranging from 0.017 to 0.21). The list of pathways and gene groups is provided in Supplementary Table S1 (Supplementary Data are available online at
STOX1 overexpression in transgenic placentas induces altered mitochondrial mass and nitroso-redox imbalance
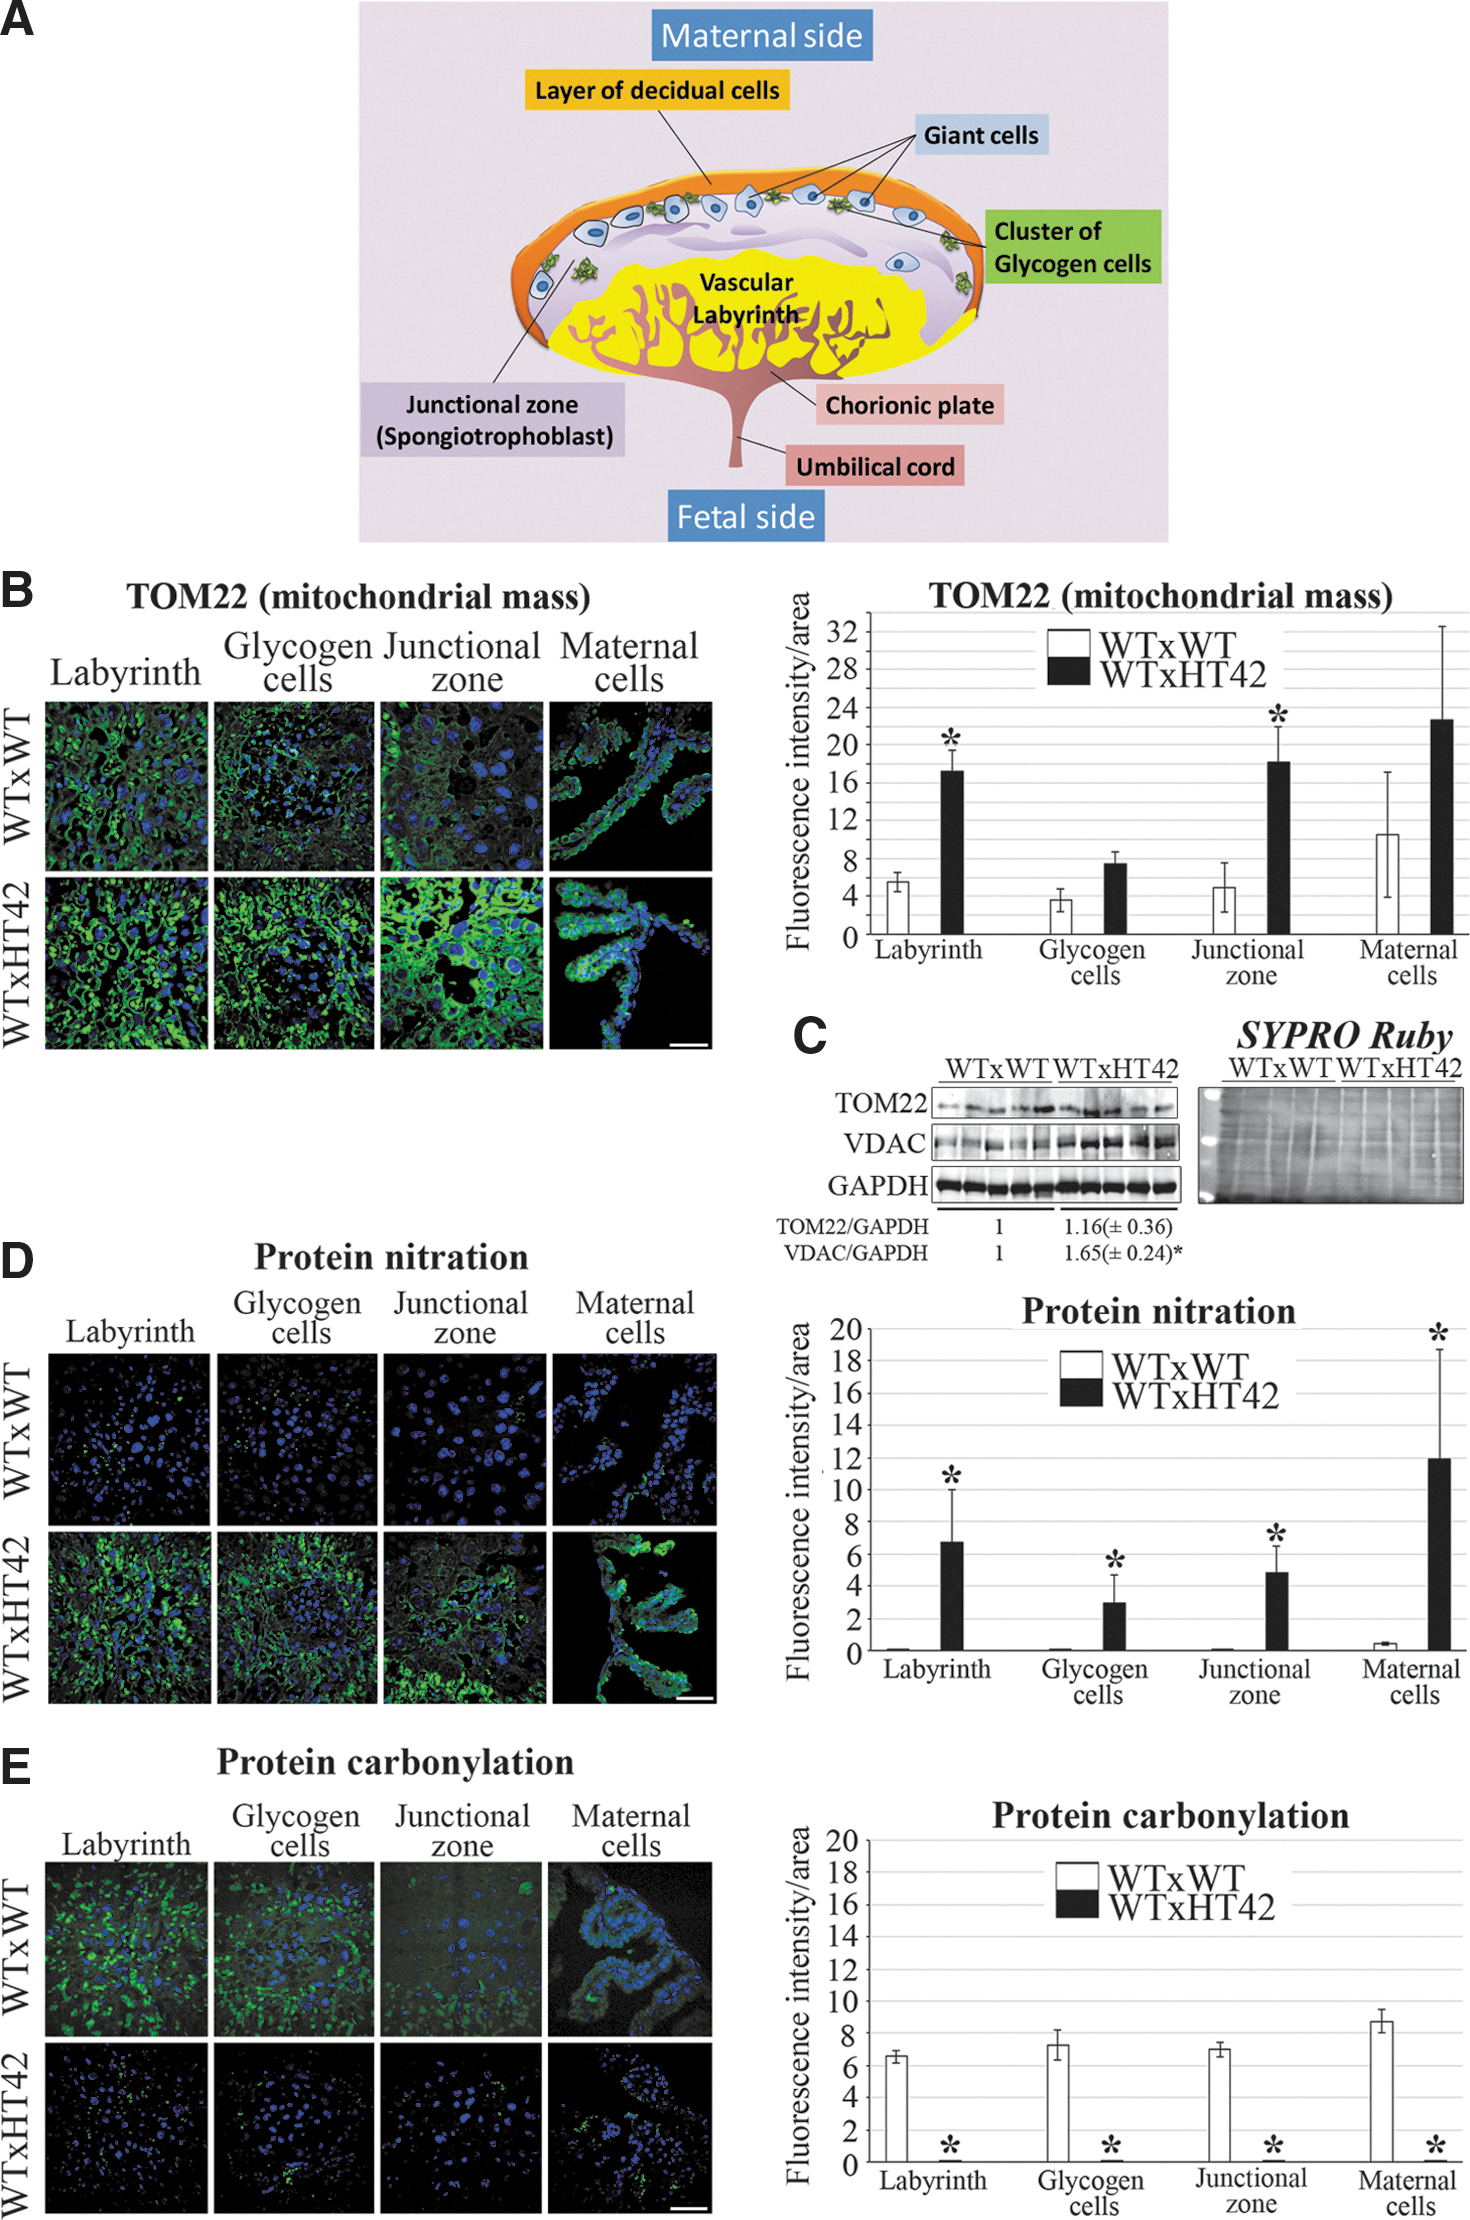
The mitochondrial mass, evaluated by the steady-state immunofluorescence of the outer membrane mitochondrial marker TOM22 (39), was significantly higher (approximately fourfold) in pre-eclamptic than in control placentas, at least in the Labyrinth and the Junctional zone (Fig. 1A, B), similar to what is observed in human pre-eclamptic placentas (43). TOM22 (and porine voltage-dependent anion channel [VDAC]) global increase in pre-eclamptic placentas was confirmed by Western blots (Fig. 1C). This result prompted us to analyze free radical production in placentas. For this, we evaluated the steady-state levels of protein oxidative adducts, either (ROS-dependent) carbonylation or (RNS-dependent) nitration (65, 69), using dinitrophenyl or 3-nitrotyrosine immunostaining, respectively. We observed a striking signal inversion between transgenic and nontransgenic placentas (Fig. 1D, E). Transgenic placentas displayed dramatically higher levels of nitrated proteins and lower levels of carbonylated proteins than controls, in each placental compartment. These in vivo results point to STOX1 as a crucial regulator of the nitroso-redox balance in the placenta.
STOX1 overexpression deregulates genes involved in the response to hypoxia, redox balance, nitric oxide, and energy metabolism
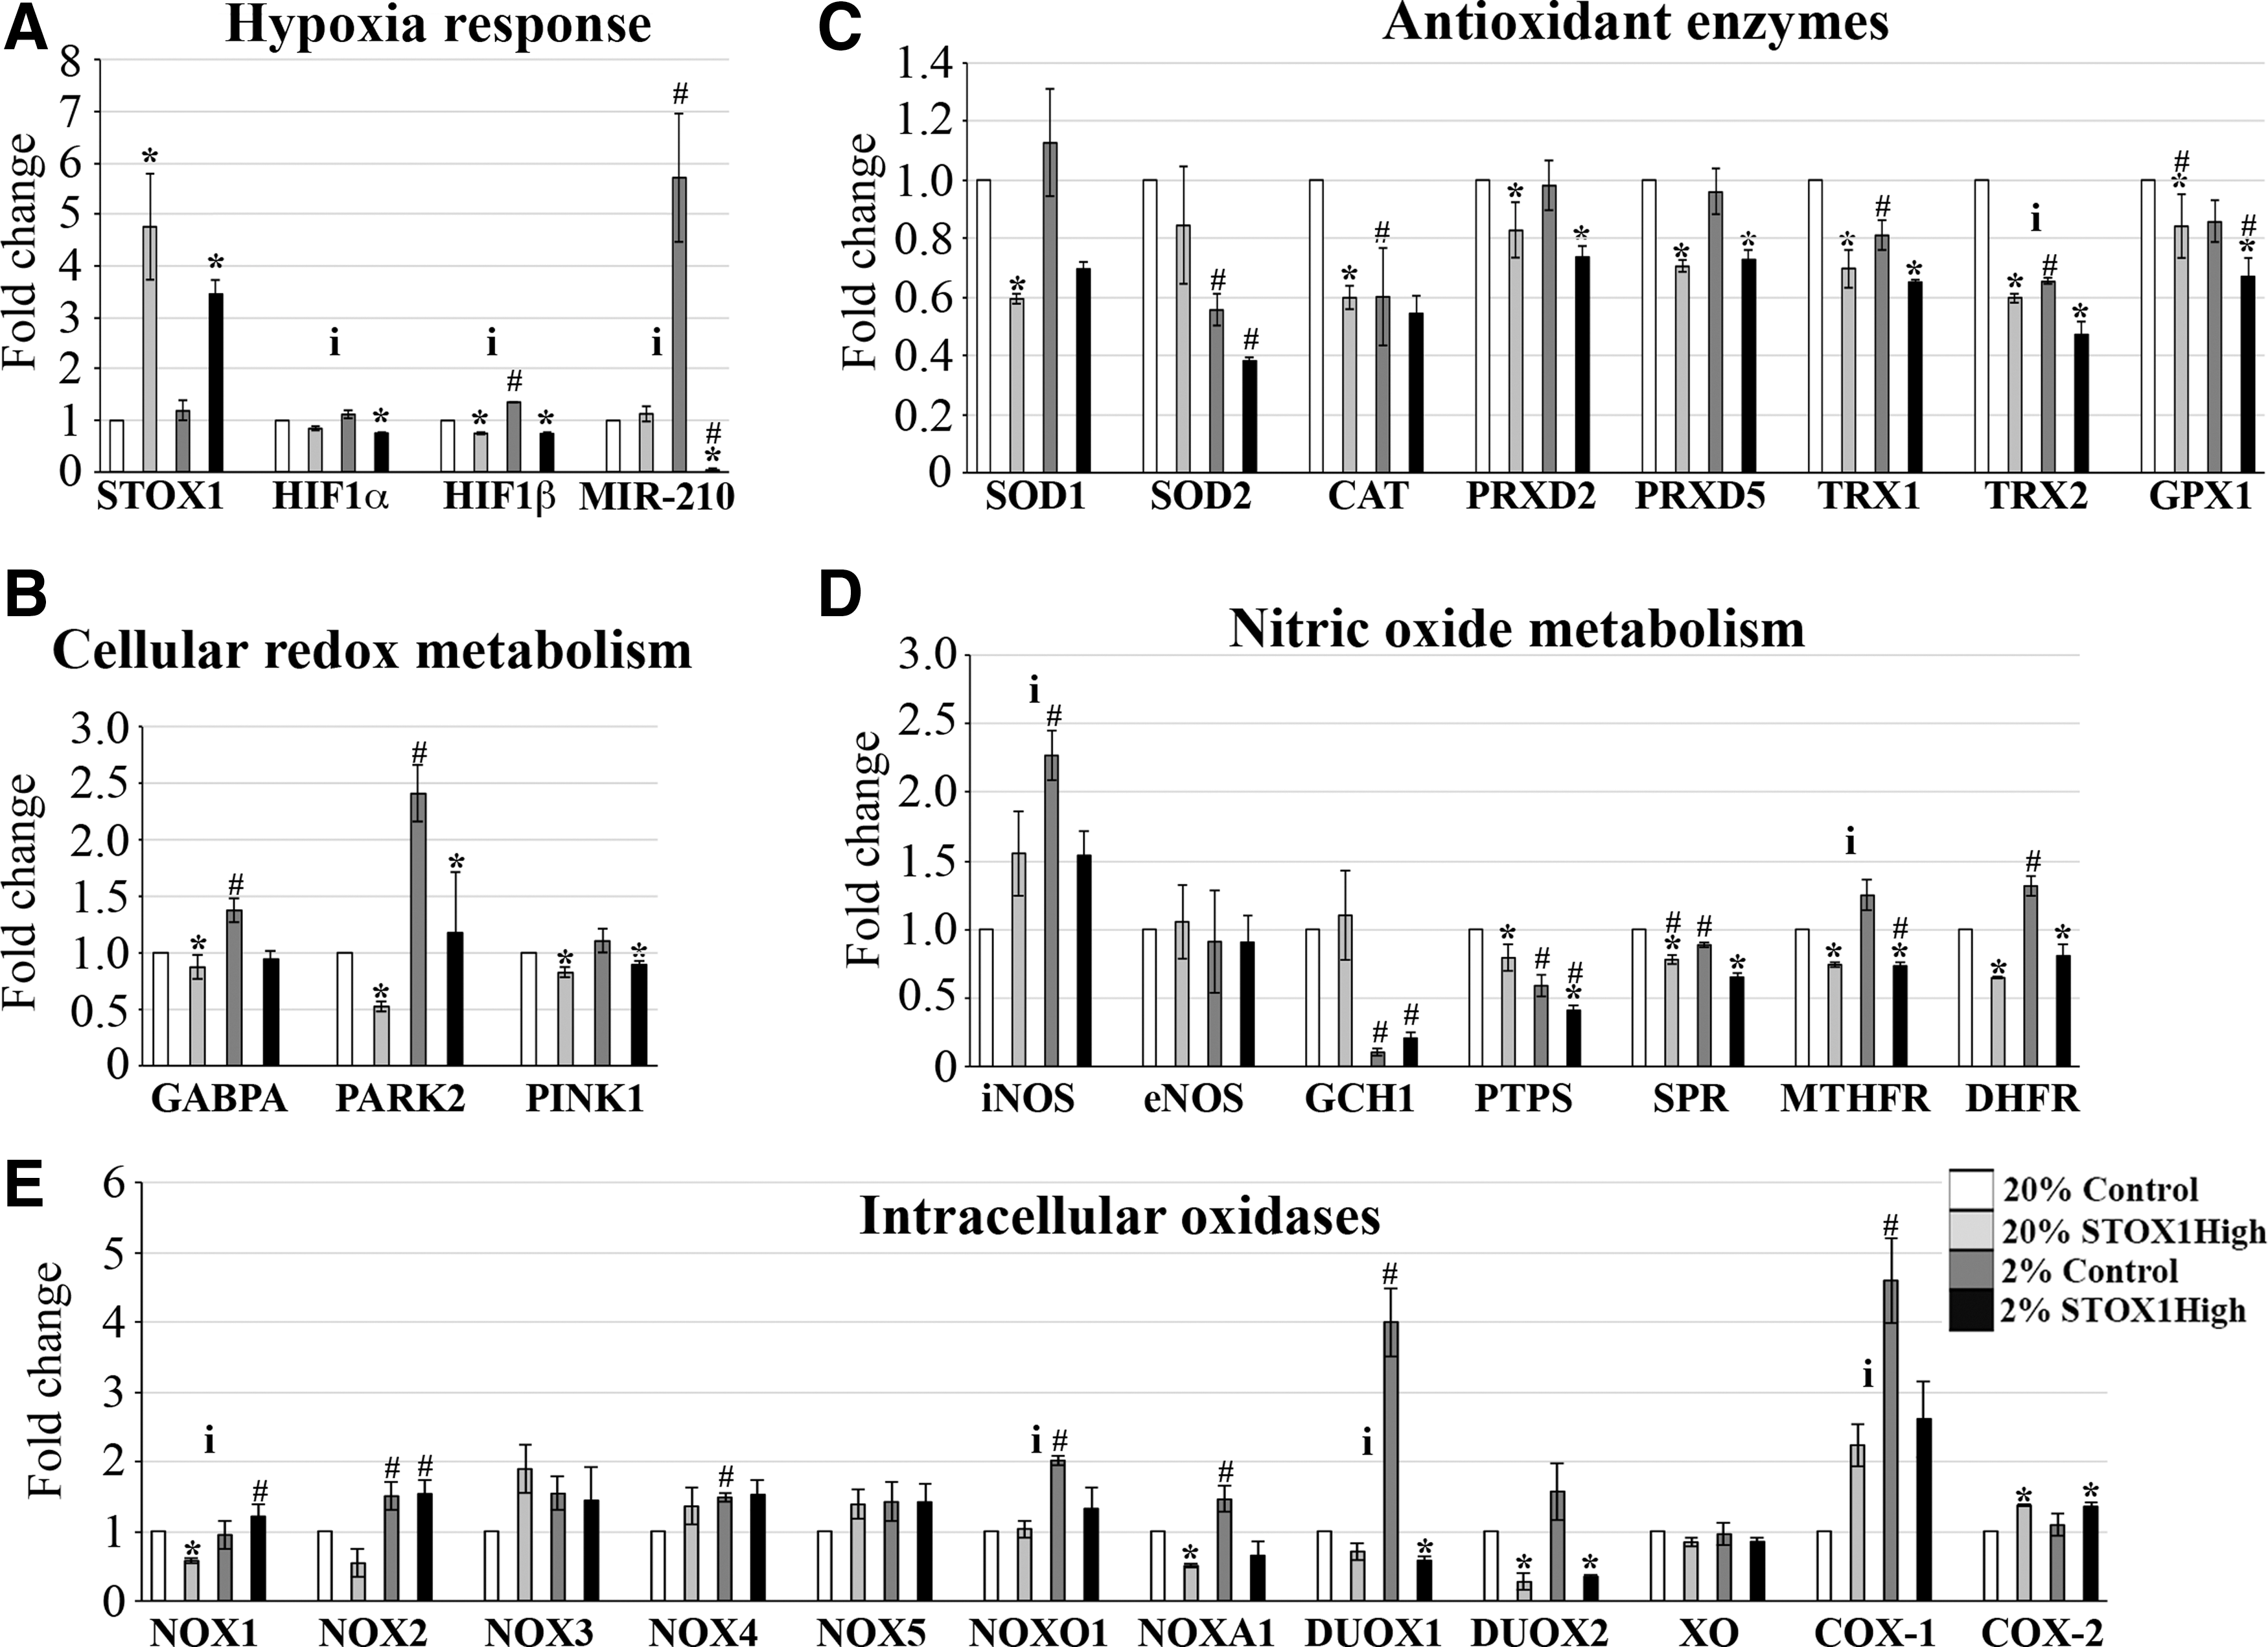
We then analyzed gene expression in JEG-3 trophoblasts [control and STOX1High, obtained in a previous study (56)] by RT-qPCR; primers are described in Supplementary Table S3. Since oxygen is a signaling molecule in trophoblasts (11), we cultivated both cell types at either 2% or 20% O2. Two percent O2 is compatible with oxygen concentrations of early gestation. Twenty percent O2, higher than natural oxygen concentrations, was, nevertheless, chosen to compare our results with most available studies based on trophoblasts cultivated at atmospheric pressure. STOX1High cells expressed STOX1 at a high level in both conditions (Fig. 2A).
STOX1High cells in hypoxia recapitulated metabolic alterations observed in pre-eclampsia, as decreased DNA damage response (DDR) (Supplementary Fig. S2A), and decreased expression of genes involved in cholesterol metabolism, SREBP1A, and SREBP1C (28) (Supplementary Fig. S2B).
At 2% O2, expression of the two crucial modulators of the hypoxia response HIF1α and HIF1β was moderately affected by hypoxia (Fig. 2A). The hypoxamir miR-210 levels were not altered in STOX1 overexpressing cells at 20% O2. Strikingly, however, at 2% O2 miR-210 expression increased by ∼6-fold in control cells and decreased by ∼30-fold in STOX1High cells compared with 20% O2, resulting in a dramatically reduced level (∼180-fold) of miR-210 in STOX1High cells under hypoxia.
We then examined the cellular redox metabolism. Expression levels of GABPA, encoding a factor involved in mitochondrial biogenesis (7), and Parkinson protein 2 (PARK2) encoding Parkin, a E3 ubiquitin-protein ligase important for antioxidant defence (76), were increased by hypoxia in control cells, which was not the case in STOX1High cells (Fig. 2B). Furthermore, STOX1 overexpression was associated with a decrease of PINK1 expression, a mitochondrial serine/threonine protein kinase that prevents oxidative damage (26). Accordingly, most sirtuins [known to be induced in response to hypoxia (23) and to inhibit HIF-mediated hypoxia response (30)], and their downstream effectors, FOXO1 and FOXO3a, which are activated in the presence of oxidative stress, were highly expressed in control cells in hypoxia (19); whereas their levels were reduced in STOX1High cells at a low O2 concentration (Supplementary Fig. S2C, D). Moreover, expression levels of antioxidant enzymes that constitute the main line of defence against nitrosative and oxidative stresses (73), such as superoxide dismutases SOD1 (CU/Zn-SOD) and SOD2 (Mn-SOD), peroxiredoxins PRDX2 and PRDX5, thioredoxins TRX1 and TRX2, and glutathione peroxidase GPX1, were lower in STOX1High compared with control cells at 2% O2 (Fig. 2C). In addition, at 2% O2 the hypoxia-induced expression of iNOS was repressed in STOX1High cells (Fig. 2D). STOX1 also reduced the expression of PTPS, SPR, DHFR, and MTHFR, encoding for enzymes involved in tetrahydrobiopterin (BH4) metabolism, which is indispensable for the transformation of
The expressions of intracellular oxidases, responsible for superoxide generation and oxidative stress (5), such as the NADPH oxidase organizer 1 (NOXO1), the NOX activator 1 (NOXA1), and the dual oxidases (DUOX1 and DUOX2), were no longer induced by hypoxia when STOX1 was overexpressed (Fig. 2E). In contrast, the expression of several NOXs was mildly induced by hypoxia, while it was rather insensitive to the STOX1 status. To note, we recently reported that pre-eclamptic plasma affects NOX4 expression in endothelial cells (10). Moreover, STOX1 inhibited hypoxia-induced expression of the cyclooxygenase-1 (COX-1), and induced COX-2 expression (Fig. 2E). Taken together, the expression of these genes indicates multiple levels of alteration of NO metabolic pathways on STOX1 overexpression, including hypoxia-dependent alterations.
In sum, under hypoxia, genes coding for enzymes implicated in free radical production are overall reduced after STOX1 overexpression; whereas the detoxifying machinery appears less active, raising questions on the physiological outcome and balance of these alterations.
STOX1 overexpression affects the mitochondrial mass
We assessed the mitochondrial mass by immunofluorescent staining of TOM22 and VDAC on fixed cells and by labeling living cells with MitoTracker Green™, a chemical dye that labels active mitochondria using the mitochondrial membrane potential (MMP) (1). These three distinct measurements showed that in control cells the mitochondrial mass was reduced in hypoxia (Fig. 3A, B and Supplementary Fig. S3, p>0.05, p=4.4×10⁻¹², and 7.5×10⁻²³, for TOM22, VDAC, and MitoTracker, respectively, comparing 20% O2 and hypoxia). On the contrary, in STOX1High cells, the mitochondrial mass increased about twofold in hypoxia (Fig. 3A and Supplementary Fig. S3; p=5.1×10⁻⁶, >0.05 and 2.1×10⁻¹⁵, for TOM22, VDAC, and MitoTracker, respectively comparing 20% O2 and hypoxia).
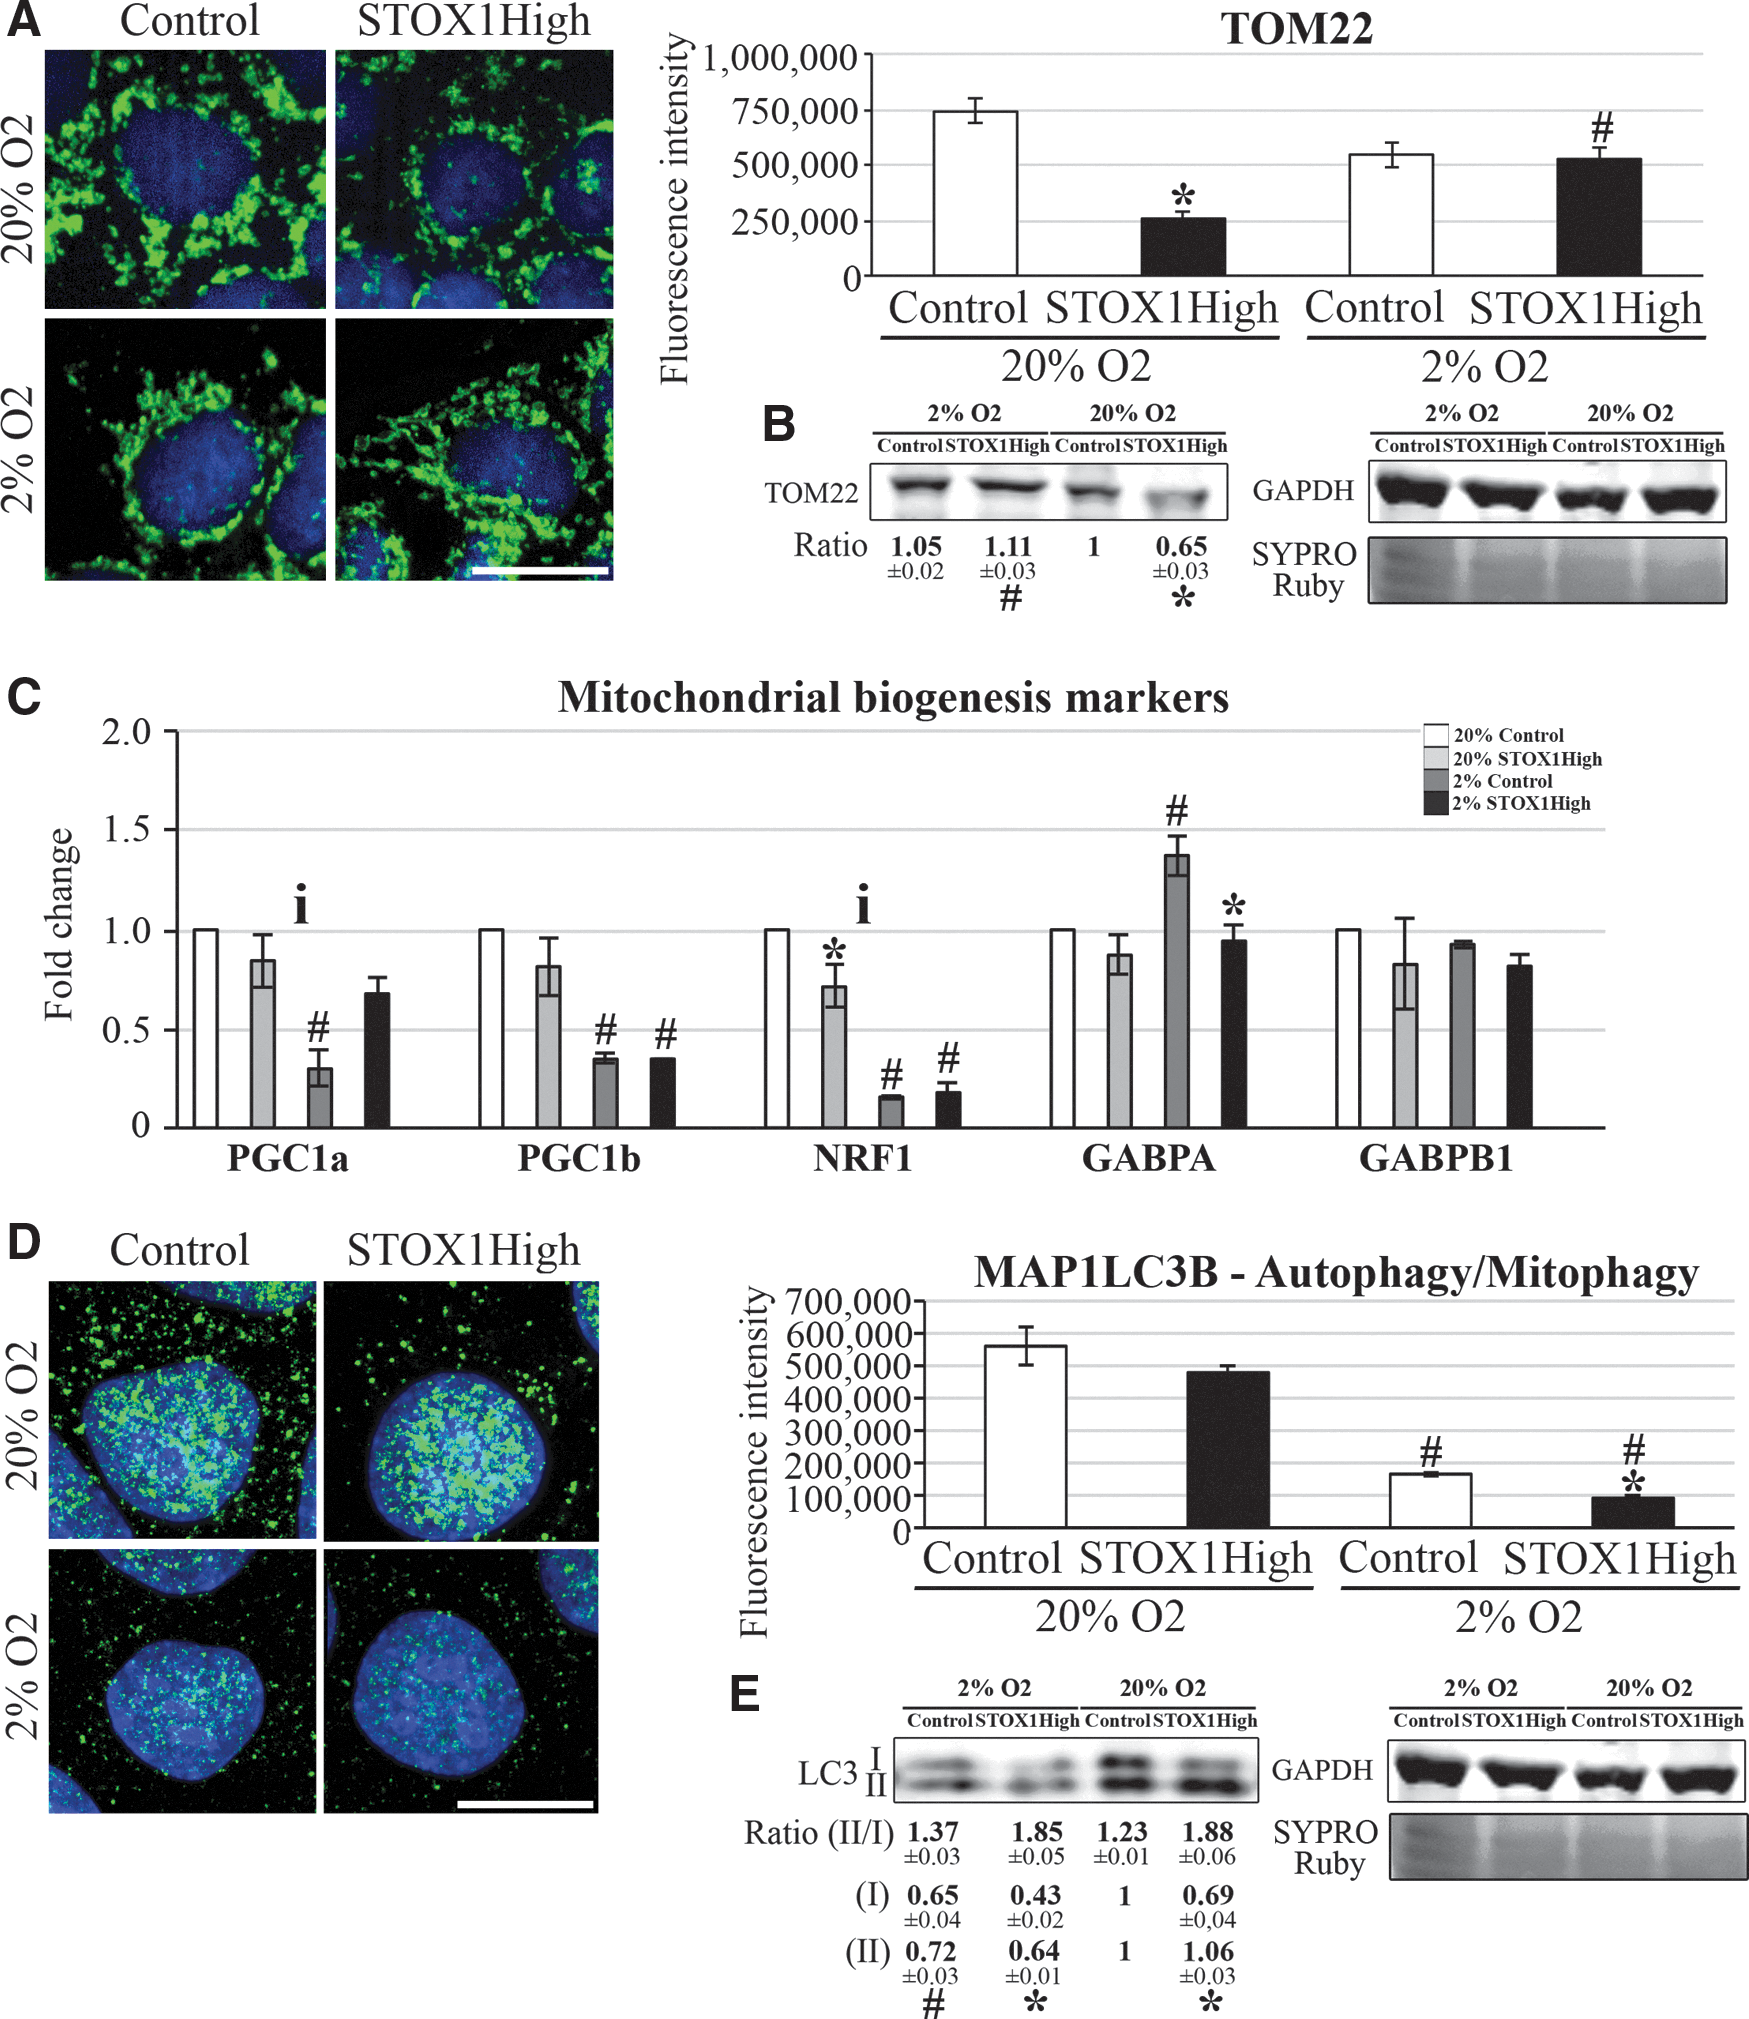
Consistently, control cells in hypoxia showed a reduced expression of master regulators of mitochondrial biogenesis, PGC1α, PGC1β, and NRF1 [but not GABPA (NRF2A) and GABPB1, Fig. 3C]. A similar decrease of PGC1β and NRF1 was also observed in STOX1High cells despite increased mitochondrial mass (see Fig. 3A and Supplementary Fig. S3), suggesting that in these cells the steady-state mitochondrial mass is not primarily dependent on organelle biogenesis.
The mitochondrial mass can be reduced by autophagy, a nonselective bulk degradation of cytoplasm and organelles, or by selective autophagy (mitophagy), which eliminates damaged mitochondria and may result in cell death (54). Immunofluorescence levels of MAP1LC3B (LC3B), an autophagy factor that comprises the inactive (LC3B-I) and the autophagosome-associated active (LC3B-II) forms, were reduced by hypoxia, and the decrease was larger in STOX1High cells than in controls (Fig. 3D). Interestingly, the ratio LC3B-II/LC3B-I, an indicator of autophagy activation (47), was significantly higher in STOX1High cells than in controls independently of the oxygen pressure [1.88±0.06 vs. 1.23±0.01 at 20% oxygen (p=2.7×10⁻⁴) and 1.85±0.05 vs. 1.37±0.03 at 2% oxygen (p=7.0×10⁻⁵); Fig. 3E].
Global mitochondrial fragmentation, which is required before the LC3B-II-mediated mitochondria engulfment into autophagosomes in mitophagy, increased under hypoxia but was not influenced by STOX1 overexpression (Supplementary Fig. S4A). Strikingly, at 20% O2, dynamin-related protein 1 (DRP1) (encoding a master regulator of mitochondrial fission, and inhibitor of autophagosome targeting of mitochondria) was ∼30-fold lower in STOX1High cells than in control cells. DRP1 reduction may compensate for decreased mitochondrial content in STOX1High cells. By hypoxia, DRP1 expression was reduced in control cells (approximately threefold), whereas it increased in STOX1High cells (approximately ninefold) (Supplementary Fig. S4B, C). DRP1 decrease and the apparent absence of mitochondrial fragmentation suggest the inhibition of mitophagy in STOX1High cells at 20% O2. These findings concur with decreased PARK2 expression in STOX1High cells (as shown above, in Fig. 2B, Expression of genes involved in cellular redox metabolism), PARK2 translocation to mitochondria being involved in mitophagy (76). Optic atrophy 1 (OPA1), a key regulator of mitochondrial fusion, was unaltered (Supplementary Fig. S4D, E).
In conclusion, a decrease of the mitochondrial mass in STOX1High cells at 20% O2 may depend on activated autophagy rather than mitophagy.
STOX1 overexpression affects mitochondrial function and energy metabolism
The MMP is the driving force for mitochondrial proteins import, substrates and ions transport, and, consequently, for mitochondrial activities (49). A decrease in oxygen pressure led to a 30% reduction of MMP measured by tetramethylrhodamine ethyl ester (TMRE) fluorescence in control cells (59) (Fig. 4A), which was consistent with a decrease in mitochondrial mass (as shown above, in Supplementary Fig. S3). Conversely, STOX1High cells display the highest MMP values in hypoxia. When normalized to the mitochondrial mass (TOM22), the MMP of STOX1High cells was always higher than control cells (hypoxia p=1.3×10⁻⁹, 20% O2 p=1×10⁻⁴, Fig. 4B), indicating more mitochondrial activity in STOX1High than in control cells.
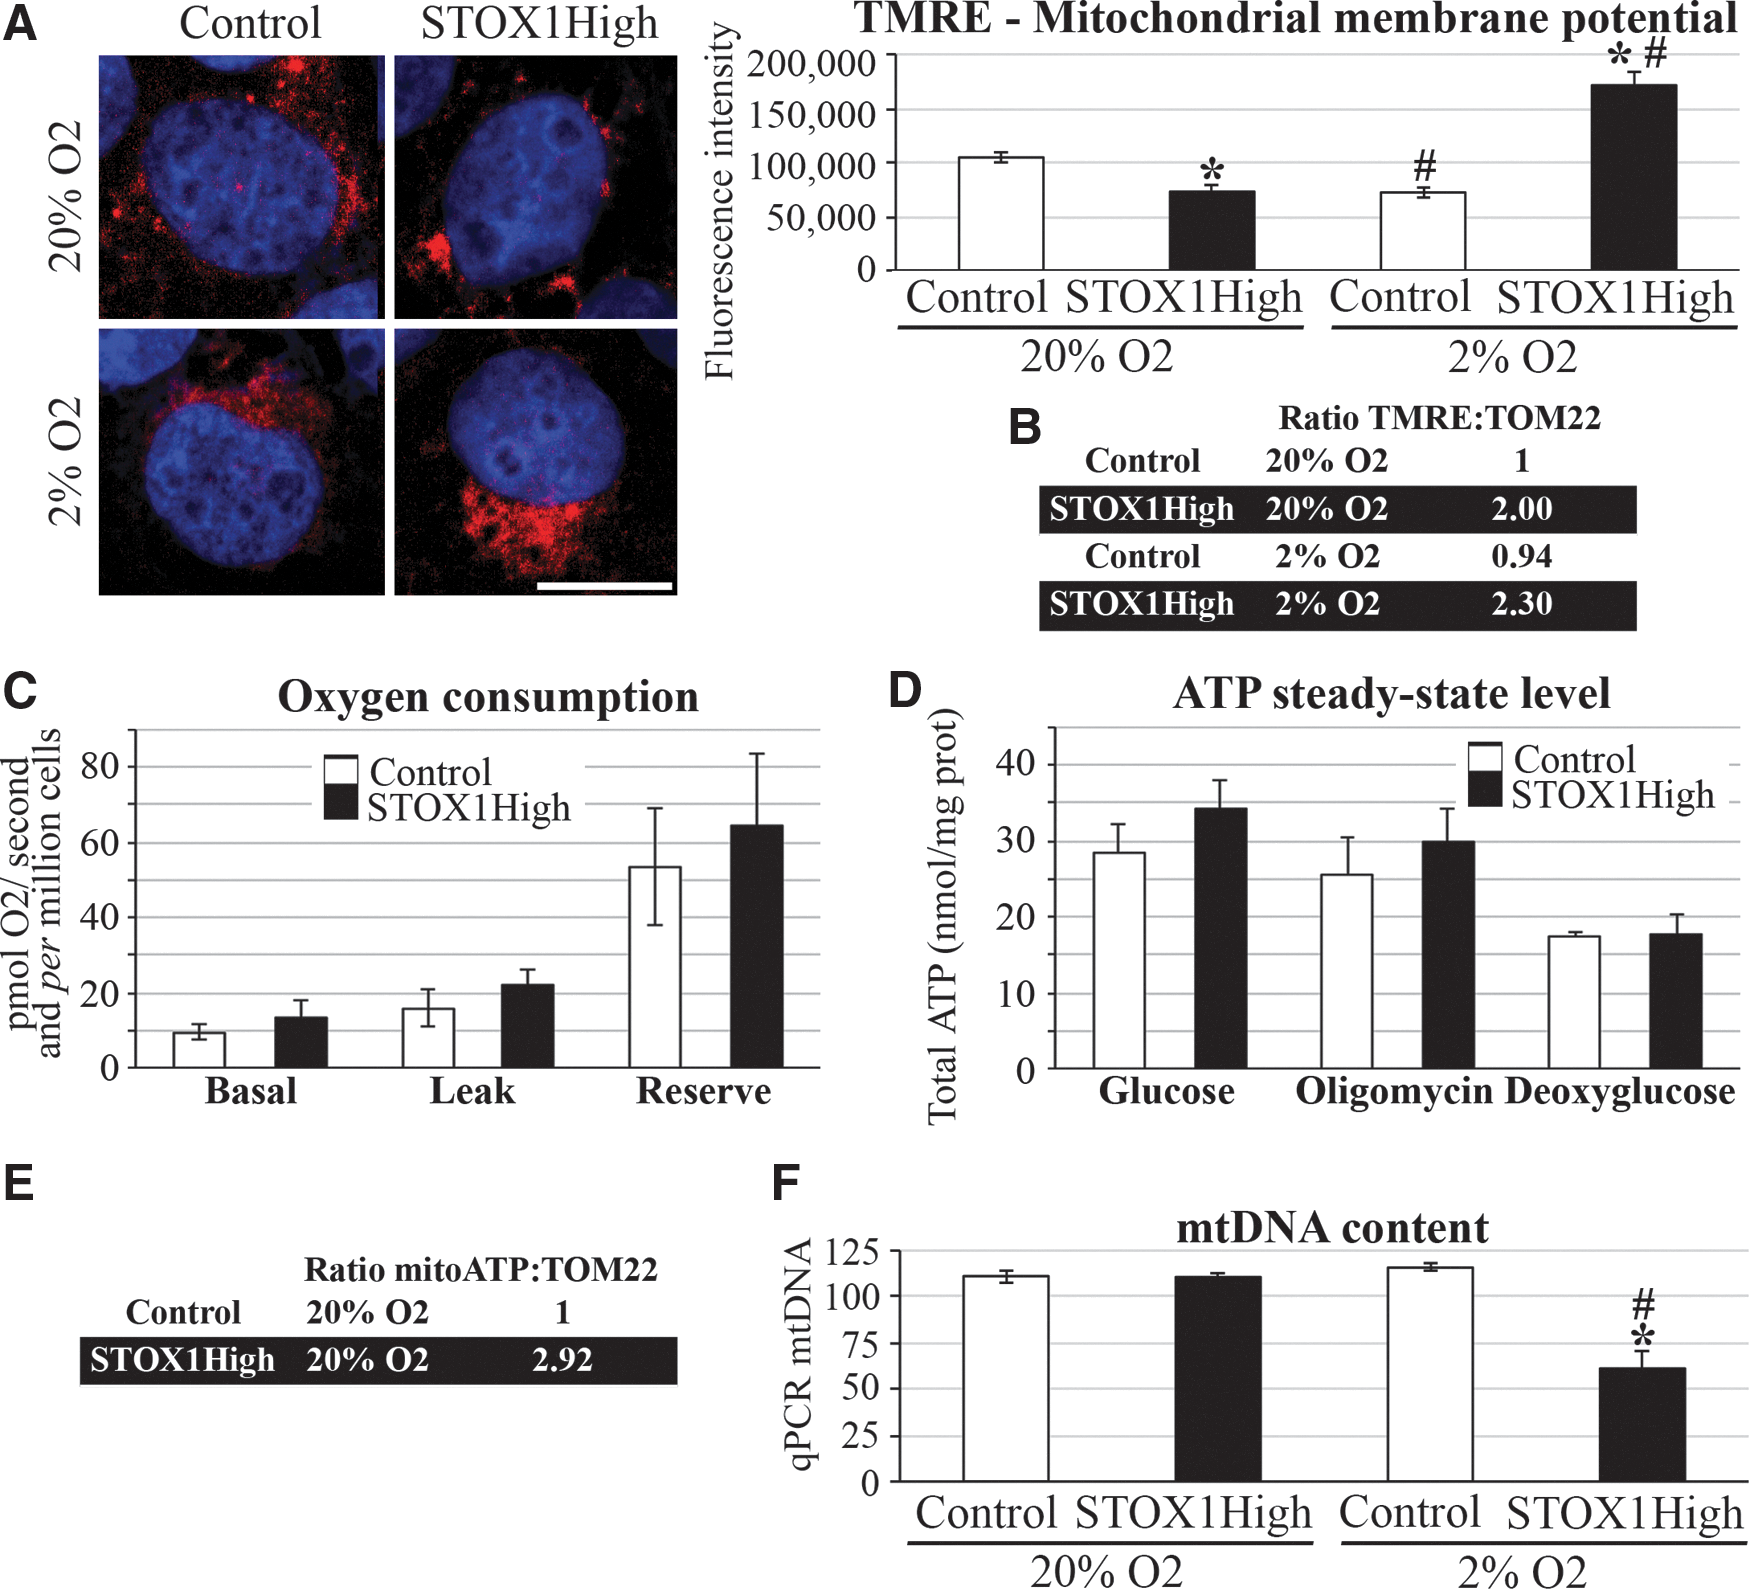
Global cellular oxidative phosphorylation capacity was assessed at 20% O2. STOX1High cells maintained normal respiration rate and cellular adenosine triphosphate (ATP) concentration (Fig. 4C, D). Consequently, ATP levels normalized to the mitochondrial mass (TOM22) are almost threefold higher in STOX1High than in control cells (Fig. 4E). Altogether, at both O2 concentrations, mitochondria appear more active in STOX1High than in control cells.
Compared with the other conditions, STOX1High cells at 2% O2 showed a 50% decrease of the mtDNA content (Fig. 4F), but increased levels of TFAM, a factor involved in mtDNA transcription, replication, and maintenance (Supplementary Fig. S5A–C), with an approximately fourfold higher ratio of TFAM/mtDNA. POLG, the DNA polymerase that replicates mtDNA, was affected by hypoxia (Supplementary Fig. S5D, E). Thus, STOX1High cells displayed higher levels of POLG relative to the mitochondrial mass than control cells (POLG/TOM22, 1.7-fold in hypoxia and 3.2-fold at 20% O2) (Supplementary Fig. S5F).
We also evaluated mtDNA maintenance using a novel validated imaging fluorescence in situ hybridization approach, mitochondrial transcription, and replication imaging protocol (mTRIP) to assess mtDNA initiation of replication (13, 14). The levels of mitochondrial replication marker (mREP) (a probe that signals the D-loop opening for mtDNA replication) per cell were similar in all situations (Supplementary Fig. S5G, H), as were the levels of a mixture of probes that target several mitochondrial RNAs (mTRANS; Supplementary Fig. S6A, B). mtDNA-encoded genes were expressed at normal levels in STOX1High cells in hypoxia (Supplementary Fig. S6C) despite lower mtDNA content. Taking into account the reduced TOM22 levels, STOX1High cells at 20% O2 displayed a two- to three-fold higher mREP and mTRANS signal per mitochondrial mass than control cells (Supplementary Figs. S5H and S6B).
The expression of key genes involved in mtDNA maintenance and mitochondrial transcription (Supplementary Fig. S6D, E) was not correlated with the levels of mtDNA transcription. Rather, the expression of these factors increased in control cells in hypoxia, but not in STOX1High cells, indicating a failure of STOX1High cells to adapt to hypoxia by varying the expression of mtDNA processing factors.
In summary, under hypoxia, STOX1High cells maintain mitochondrial mass despite an apparent lack of adaptation. These cells display reduced mtDNA content and increased MMP. At 20% O2, STOX1High cells maintain ATP production, O2 consumption, and mtDNA content despite reduced mitochondrial mass and MMP.
In support of the notion that hypoxia is associated with increased oxidative stress in our system, we observed alterations of key mitochondrial factors (immunofluorescence of TOM22, TFAM, POLG, and DRP1) comparable to those observed in hypoxia when STOX1High cells at 20% Oxygen were treated with H2O2 (Supplementary Table S5).
STOX1 overexpression induces nitroso-redox imbalance
We then analyzed oxidative stress in STOX1High cells in hypoxia and at 20% O2 using dihydrorhodamine 123 (DHR123) and 2′,7′-dichlorofluorescein diacetate DCFH-DA, two fluorescent probes with preferential sensitivity for RNS and ROS, respectively (22). In control cells, the DHR123 signal increased at higher oxygen pressure; whereas the reverse was observed with DCFH-DA (Fig. 5A, B). The profile was strictly opposite in STOX1High cells. The switch from ROS to RNS signal (or vice versa) is compatible with ROS and NO competitively targeting Cys residues (42). The specificity of ROS and RNS labeling by DCFH-DA and DHR123, respectively, was analyzed at 20% O2 and hypoxia in the presence of the RNS scavenger uric acid and the ROS inhibitor N-acetyl cysteine (NAC). We observed a systematic decrease of ROS and RNS labeling using the specific scavenger although, curiously, the decrease was not significant for NAC in hypoxia. It is possible that this cell line harbors resistance to NAC in hypoxia, although to our knowledge this has not been assessed. Altogether, these analyses confirm opposite ROS and RNS profiles in STOX1High versus control cells according to the oxygen pressure.
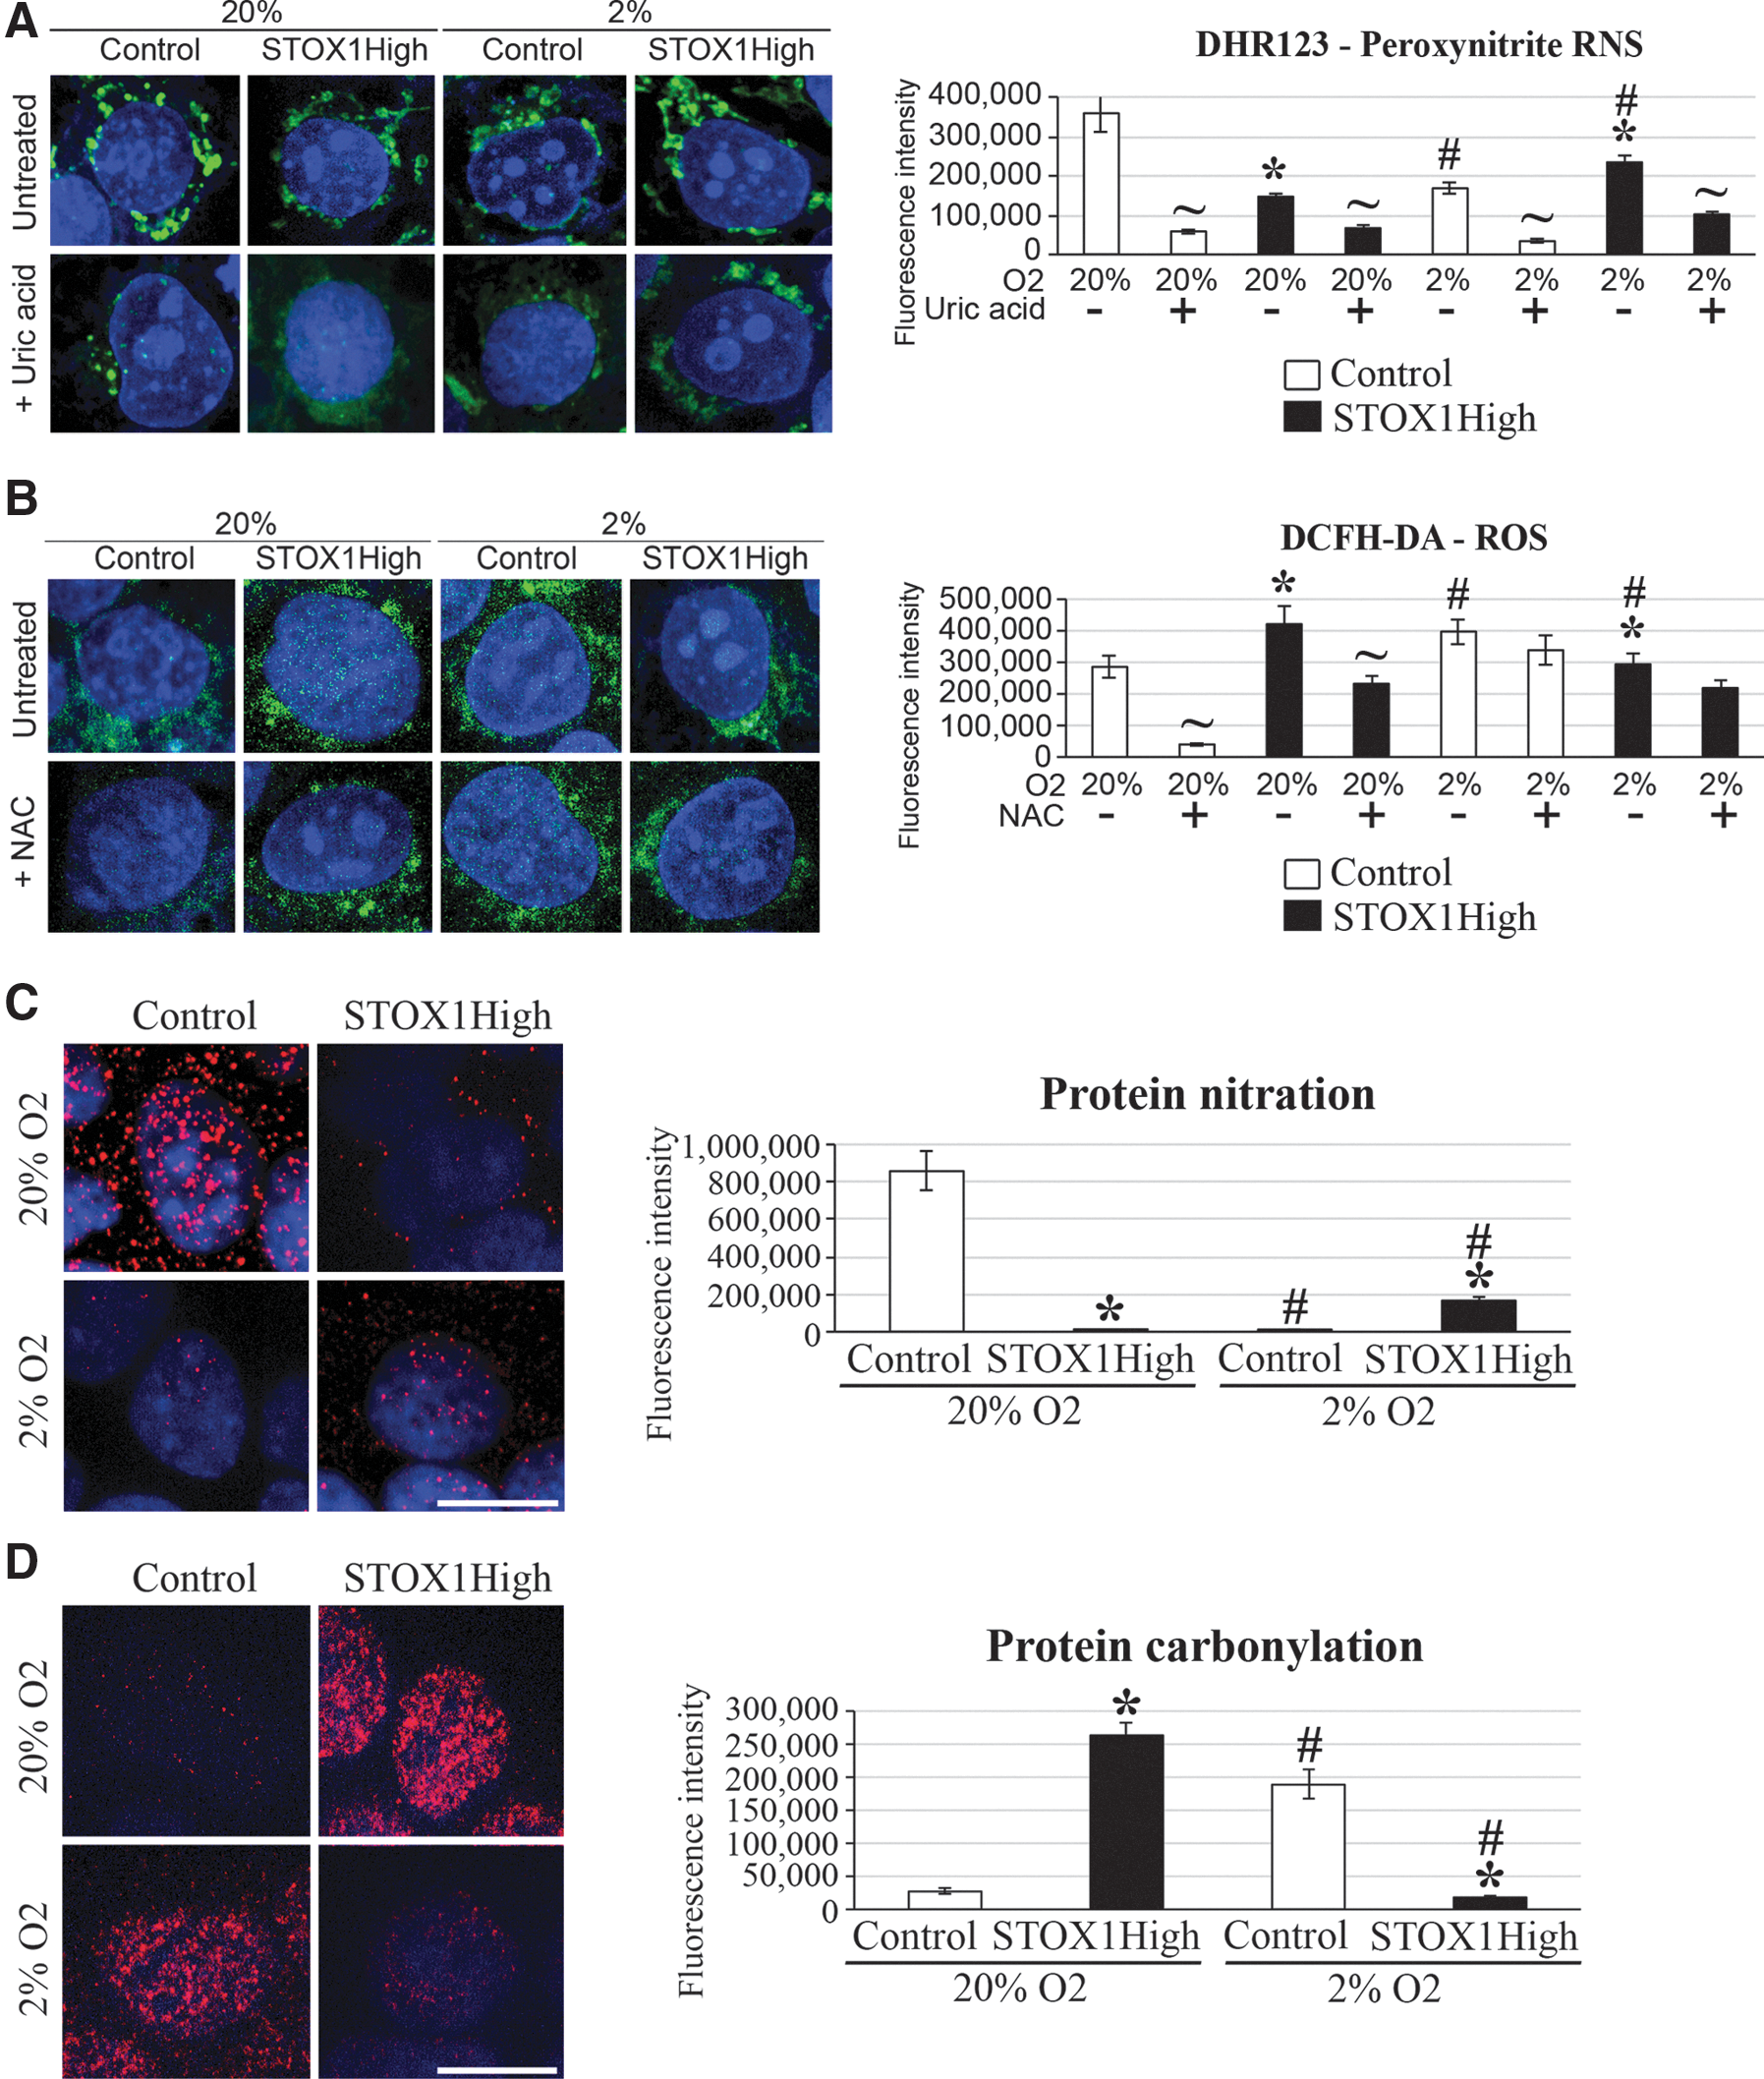
We then evaluated the steady-state levels of protein oxidative adducts, either nitration (due to RNS) or carbonylation (due to ROS) (65, 66) (Fig. 5C, D). STOX1High cells in hypoxia displayed a higher level of protein nitration and lower level of carbonylation than control cells, whereas the reverse pattern was observed at 20% O2. These results were confirmed by Western blot (Supplementary Fig. S7A, B). The nitroso-redox balance, thus, appears dependent on oxygen pressure, and it is strongly modified by STOX1 overexpression.
Discussion
In the present study, we uncover a novel function of the pre-eclampsia-associated transcription factor STOX1 as a master regulator of the oxygen-dependent nitroso-redox balance. Although after the discovery of this gene the role of STOX1 in pre-eclampsia has been questioned (31), the original study (71) and a more recent one (6) concur to observe an association between STOX1 and the familial forms of pre-eclampsia. Briefly, the original study (71) identified the more abundant STOX1 Y153H polymorphism in a subpopulation of Dutch where pre-eclampsia and gestational hypertension had a strong familial component. Moreover, the study of Berends et al. (6), focusing on a “familial” subpopulation of samples, observed an association between STOX1 and the forms of pre-eclampsia with a strong familial component. In contrast, this polymorphism was not found to be associated with the disease in other populations where the pre-eclampsia was sporadic (31, 37). Moreover, the imprinted status of STOX1 was questioned at the global placental level (31); whereas mono-allelic methylation and expression of this gene were detected in specific cell types of the placenta (extravillous column cytotrophoblasts) (70), and an independent study showed interindividual variation in the imprinting status of STOX1 (15). In agreement with the implication of STOX1 in pre-eclampsia, overexpression of STOX1 was observed in early placental biopsies in gestations, eventually progressing to pre-eclampsia [GSE12767 in Founds et al. (20)]. Furthermore, we induced pre-eclampsia-like symptoms in two independent mouse strains overexpressing STOX1 (TgSTOX13 and TgSTOX42) (18). In the present study, we focused on the strain harboring the most severe phenotype, TgSTOX42.
We show here that hypoxia affects trophoblasts in culture, and that STOX1 overexpression exacerbates this effect, thereby suggesting a double-hit model, where in excess of STOX1, trophoblasts do not adapt to hypoxic conditions. We found a striking down-regulation of miR-210 in JEG-3 hypoxic cells overexpressing STOX1. MiR-210 is increased in pre-eclampsia; our data, thus, suggest that STOX1 overexpression mitigates an adaptive process mediated by miR-210. STOX1 overexpression triggers a reduced expression of genes involved in DDR and cholesterol metabolism, two pathways that are altered in pre-eclampsia. However, the most striking effect is the imbalance of ROS and RNS induced by STOX1 overexpression in cells and placentas. The capture of NO by STOX1 overexpressing placentas is proposed here as a mechanism to explain increased blood pressure in pre-eclampsia, consistently with existing literature (34, 63). In human gestation, the blood flow in the placenta near term is around 600 ml/min, which is theoretically able to drive a rapid and strong decrease of NO in the whole maternal body during pre-eclampsia. Modulating the ROS/RNS balance could be considered an innovative strategy to treat pre-eclampsia, possibly by BH4 treatment or uric acid precursors (60). In this case, our mouse model is a potentially excellent platform for testing therapeutic approaches in the future.
An abundant literature exists on oxidant molecules associated with pre-eclampsia (48). RNS and ROS stresses are generally treated as a whole (17). It is widely assumed that the sites of peroxynitrite generation are spatially associated with the sources of superoxide production (such as mitochondria) in the context of hypoxia and inflammation (51). Peroxynitrite ions nitrate tyrosine residues and have been shown to be elevated in pre-eclampsia (45). Peroxynitrite is associated with biological toxic effects that are also found in pre-eclampsia (62) such as antioxidant depletion (68), deregulation of COXs (3), NOS uncoupling (58), lipid peroxidation (24), insulin resistance (52), imbalance of pro- and anti-inflammatory mediators (12), neuro-inflammatory disease/stroke (52), DNA damage (21), mitochondrial dysfunction (50), and renal injury associated with proteinuria and high plasma uric acid level (52). Nitrotyrosine strongly marks the vasculature of pre-eclamptic placentas (8). Recently, uric acid has been reported to mark hypertension and endothelial damage in pre-eclampsia (41). Thus, uric acid could be considered a physiological protective response against peroxynitrite accumulation, as it is a natural strong peroxynitrite scavenger that inhibits inflammation (27). Peroxynitrite also affects the BH4 pathway and produces a vicious circle of peroxynitrite generation.
Finally, nitrosative and oxidative stresses target mitochondria (53), which we analyzed by multiple approaches, especially integrative methods of quantitative immunofluorescence (13, 14). At low oxygen pressure, overexpression of STOX1 did not change the mitochondrial mass in the cells, which increased in transgenic placentas, suggesting that homeostatic processes at work in the organs are absent in the cells. This discrepancy is consistent with recent literature (43). Similarly, VDAC was found to be increased by proteomic analysis in the pre-eclamptic placenta (36), which is consistent with our data (Fig. 1C); whereas it was not altered in cells at low oxygen pressure and even reduced at high oxygen pressure.
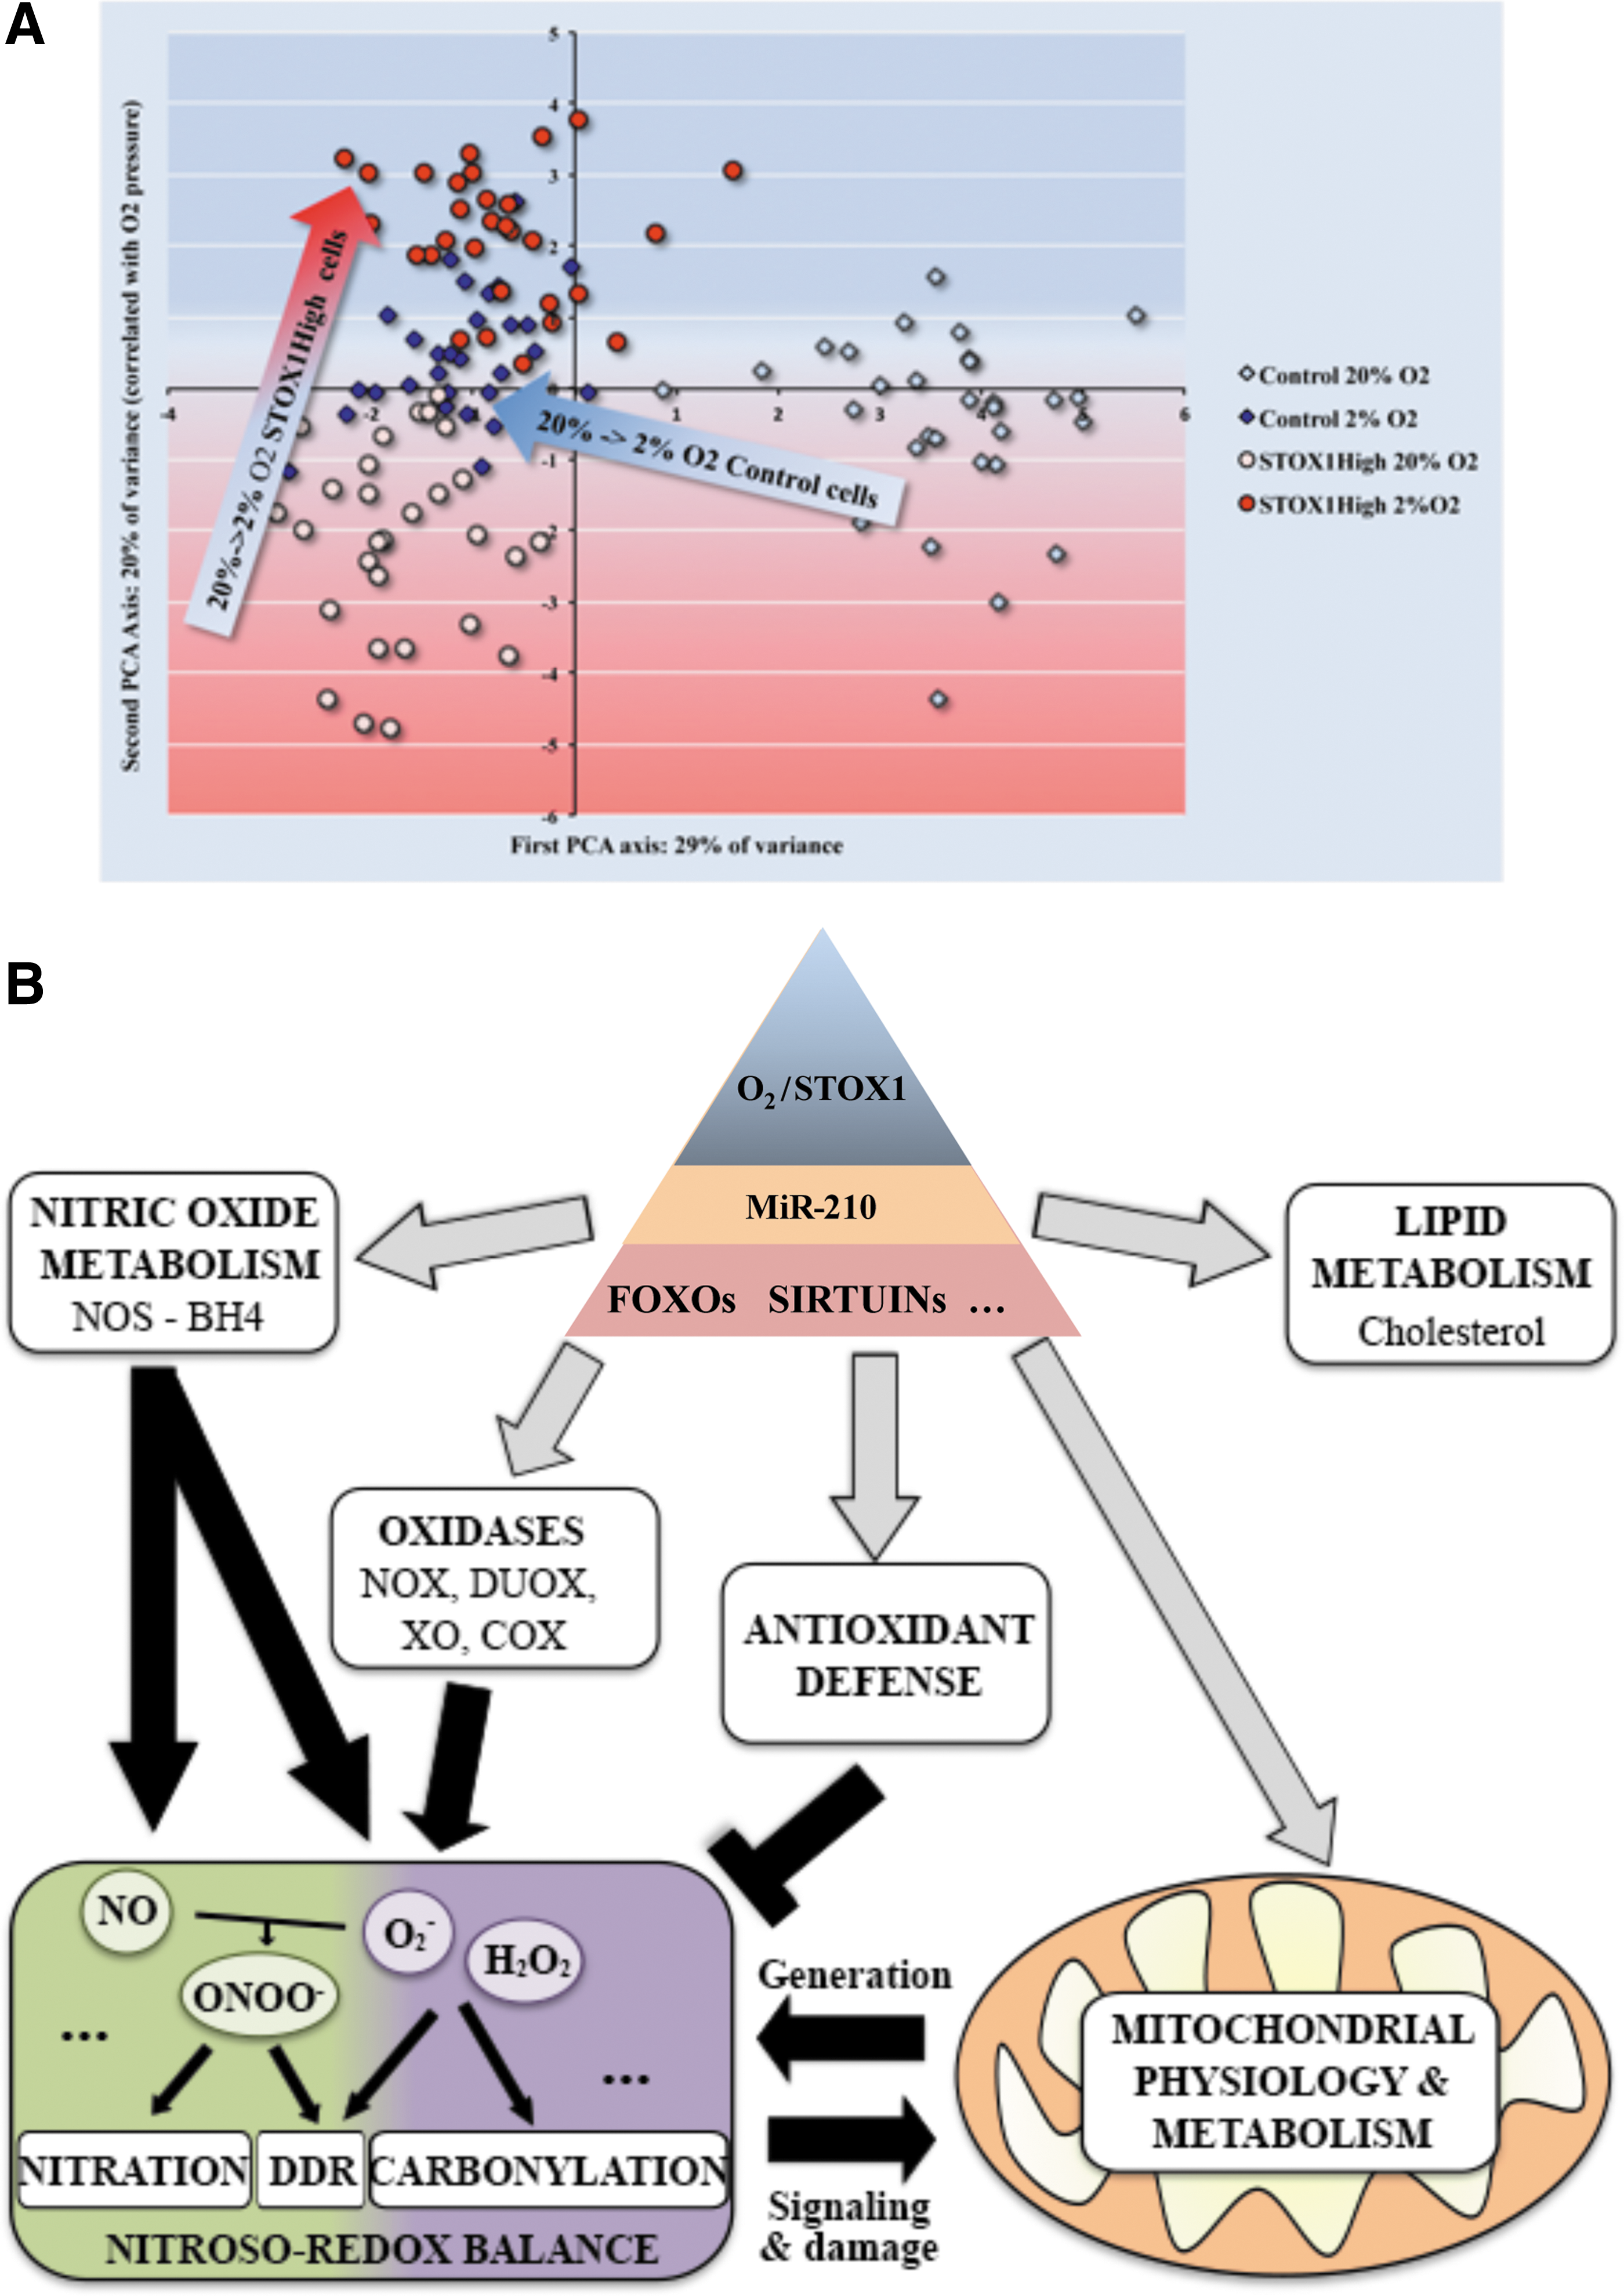
Views of the immunohistochemical alterations that characterize the control versus STOX1High cells are presented as a Principal Component Analysis in Figure 6A. Control cells at 2% O2 present intermediate features between STOX1High cells at 2% and 20% O2, suggesting that STOX1 overexpression interferes with oxygen sensors and somehow putting the cells in an artificial “hypoxic” state.
In agreement with these findings, and underscoring the misregulation of oxidative stress management when STOX1 is overexpressed, we observed comparable effects on mitochondrial factors in STOX1High cells grown either under hypoxia or at 20% O2 in the presence of the highly oxidizing factor H2O2. Moreover, in the presence of H2O2, STOX1High cells displayed a global increase of mitochondrial parameters; whereas it was the opposite for control cells.
In hypoxia, STOX1High cells contain a damaging and toxic cocktail with accumulation of peroxynitrite and relatively high level of ROS. The mtDNA content is reduced but appears highly protected by TFAM, and the mitochondrial mass is not affected, probably resulting from the balance between increased mitochondrial biogenesis (marker PGC1α) and increased level of the autophagy (LC3B-II/I). At high oxygen pressure, STOX1High cells have nearly the same damaging cocktail except that peroxynitrite levels decrease and the ROS levels increase. The mitochondrial mass is also dramatically reduced due to a strong increase of LC3B, which activates autophagy, and to DRP1 deficiency. However, to maintain stable total ATP level, the remaining mitochondria appear hyper-activated (increased membrane (Fig. 6B) potential, increased mtDNA replication, and transcription levels per mitochondrial mass unit). This led us to a model (Fig. 6B) presenting cellular and molecular bases of STOX1 effects in the context of mitochondrial function and pre-eclampsia.
Materials and Methods
Mouse placentas and microarray experiment
Four- to eight-month-old male and female mice with the FVB/N genetic background were used throughout this study, bred in the animal facility of Institut National de Recherche Agronomique (INRA, Jouy en Josas, France) in a controlled environment (light/dark cycle, temperature, free access to food and water) in accordance with local ethical regulations. RNA was extracted from placentas in TriZol™ following classical protocols at 16.5 dpc from three different mice of each group as previously described (18). Quality control of the RNA, preparation of the probes, and hybridization on Nimblegen Mouse Expression Arrays MM8 were performed at the genom'IC platform (Cochin Institute, Paris, France) according to standard protocols. Data from this experiment, fulfilling the Minimum Information About a Microarray Experiment (MIAME) criteria, were deposited in the functional genomics ArrayExpress database of the EMBL-EBI web server (accession number E-MTAB-1970). Data were analyzed using GSEA (
Cell culture and hypoxia
Modified JEG-3 cells (control cells, stably transfected with an empty pCMX vector, and STOX1High cells, stably transfected with a pCMX-STOX1A vector) (56) were grown in Dulbecco's modified Eagle's medium Glutamax (Life Technologies™, Carlsbad, CA) with 10% of heat-inactivated fetal calf serum (Life Technologies), 1% penicillin/streptomycin, and 1% of geneticin at 37°C in the presence of 5% CO2. Cells seeded overnight in wells containing glass dishes, on sterile glass slides, were placed in a Lwoff chamber at 37°C and exposed to an oxygen-depleted atmosphere for 24 h (2% O2, 5% CO2) or maintained at 37°C in a humidified normal atmosphere (20% O2, 5% CO2) for 24 h. The experiments were performed independently thrice, each in triplicate. When indicated, cells were grown in 20% O2 in the presence of 150 μm H2O2 for 24 h.
Reverse transcription quantitative polymerase chain reaction
Total RNA was isolated and reverse transcribed according to standard protocols. RT-qPCR was performed using LightCycler® 480 SYBR Green I Master containing FastStart Taq DNA Polymerase, and the rate of dye incorporation was monitored using a LightCycler 480 Instrument II and the LightCycler software (Roche, Basel, Switzerland) in the exponential phase of the PCR reaction. Each RT-qPCR was carried out in technical duplicates from a pool of three biological replicates, using TBP transcript levels for normalization. RT-qPCR CT values were analyzed using the 2−ΔΔCT method to calculate the fold expression (40). Primers used for amplifications are listed in Supplementary Table S3 with the corresponding references.
Quantification of miRNA-210 followed the protocol of Sdassi et al. (61). A polyA tail was added to RNA by Poly-A polymerase treatment (Life Technologies). After phenol-chloroform treatment in the presence of glycogen as a carrier, and isopropanol precipitation, reverse transcription was carried out from a universal primer 5′-CGAATTCTAGAGCTCGAGGCAGGCGACATGGCTGGCTAGTTAAGCTTGGTACCGAGCTCGGATCCACTAGTCCTTTTTTTTTTTTTTTTTTTTTTTTTTVN-3′. Quantitative PCR was performed using the Universal and miR-210-specific primers (5′-CGAATTCTAGAGCTCGAGGCAGG-3′ and 5′-CTGTGCGTGTGACAGCGGCTGA-3′, which is identical for humans and mice), using 5S RNA as a reporter gene.
mtDNA content analysis by qPCR
DNA was extracted under standard procedures. Quantitative PCR was performed in duplicates from three biological replicates using LightCycler 480 SYBR Green I Master containing FastStart Taq DNA Polymerase, LightCycler 480 Instrument II, and LightCycler software (Roche). The region tested on mtDNA was included in the 12S gene. 18S rRNA gene was used as a reference. The level of mtDNA was calculated using the ΔCT of average CT of mtDNA and nuclear DNA (ΔCT=CT nDNA–CT mtDNA) as 2ΔCT. Primers used for amplifications are listed in Supplementary Table S3.
Immunofluorescence, reagents, and antibodies
Cells seeded on slides were fixed with 2% paraformaldehyde (PFA) and permeabilized with 0.5% Triton X-100. Slides were incubated in blocking buffer (5% bovine serum albumin [BSA] in phosphate-buffered saline [PBS]) overnight at 4°C, then with the primary antibody for 1 h at room temperature (RT), and, finally, with the secondary antibody and 10 μg/ml of Hoechst 33342 for 1 h at RT. Atto488-conjugated anti-TOM22, anti-MAP1LC3B, and Hoechst 33342 were from Sigma-Aldrich (St Louis, MI); TFAM, Polγ, VDAC 1/2/3 (sc-98708), OPA1, DRP1, and GAPDH antibodies were from SantaCruz Biotechnology (Dallas, TX); and MitoTracker® Green FM, Alexa® Fluor 555, and Alexa® Fluor 488-conjugated secondary antibodies were from Life Technologies.
MMP was measured with 200 nM TMRE (Sigma-Aldrich) for 1 h at 37°C, 5% CO2, and 2% or 20% O2.
Immunohistochemistry of placentas was performed on WT or transgenic placentas (expressing the human STOX1 under the control of the cytomegalovirus promoter) (18). Mice were sacrificed near the end of gestation (E16.5). Four WT placentas from two (WT×WT) crosses and seven placentas from four (WT×TgSTOX42) crosses were analyzed for TOM22 immunofluorescence, and for protein nitration and carbonylation. Placental regions, ascertained by periodic acid Schiff staining of adjacent sections, were analyzed by immunostaining on slides from paraffin-embedded placentas (5 μm). Placental sections were dewaxed in 2% DishWasher Soap, 1×PBS for 5 min at 70°C, and then prepared according to the specific immunofluorescence procedure.
Detection of peroxynitrite, ROS, and protein oxidation and carbonylation
Peroxynitrite was detected after treatment of the cells at 10 μM of the cell-permeant nonfluorescent DHR123 (Sigma-Aldrich) oxidized in green fluorescent rhodamine in the presence of peroxynitrite. ROS (mainly O2− and H2O2) were detected after treatment with 10 μM of the cell-permeable nonfluorescent 2′,7′-dichlorodihydrofluorescin diacetate (DCFH-DA; Sigma), oxidized to form green fluorescent 2′,7′-dichlorofluorescein (DCF), in the presence of ROS (16).
Protein nitration was detected with the 3-nitrotyrosine-specific antibody (Ref: A21285; Life Technologies/Invitrogen). Protein carbonylation was detected by dinitrophenyl treatment, followed by labeling with the DNP-specific antibody using standard procedures (44). Slides were treated with 0.01% (100 μg/ml) 2,4-dinitrophenylhydrazine (DNPH) (Sigma-Aldrich) in 2 N HCl for 1 h at RT in the dark, washed seven times with PBS, blocked with 5% BSA in PBS overnight at 4°C, then treated with the primary anti-DNP antibody (Merck Millipore, Darmstadt, Germany) for 1 h at RT, and, finally, with the secondary antibody and 10 μg/ml of Hoechst 33342 for 1 h at RT. When mentioned, the cells were treated for 24 h with uric acid (300 μM final), or with NAC (2 mM final), both of which had been purchased from Sigma-Aldrich.
Mitochondrial transcription and replication imaging protocol
DNA probes (mREP and mTRANS) for the fluorescence in situ hybridization protocol called mTRIP were labeled by nick translation of PCR products, incorporating Atto550-dUTP (Atto550 NT Labeling kit; Jena Bioscience, Jena, Germany), as described (14). Forty nanograms of labeled probes were mixed with 400 ng of sonicated salmon sperm DNA (Sigma-Aldrich) in the hybridization buffer [50% formamide, 10% dextran sulfate, in 2×saline-sodium citrate (SSC) buffer pH 7.0], denatured at 80°C for 10 min, and then maintained at 37°C for 30 min. Cells seeded on slides were fixed with 2% PFA, permeabilized with 0.5% Triton X-100, incubated in 50% formamide/2×SSC pH 7.0 for 30 min at RT, and denaturated in 70% formamide/2×SSC for 4 min at 75°C. Hybridization was performed with 40 ng of probe for 16 h at 37°C. Slides were washed in SSC, and nuclei were counterstained with 10 μg/ml of Hoechst 33342.
Three-dimensional confocal acquisition, reconstruction, and quantification
Confocal acquisition was performed using an inverted laser-scanning confocal microscope Zeiss Axiovert 200 M with a spinning-disk Perkin-Elmer Ultraview RS Nipkow Disk, an Apochromat 63×/1.4 oil objective for fixed cells or an 25×oil objective for mice placenta section, and a Hamamatsu ORCA-II-ER camera (Imagopole, PFID; Institut Pasteur, Paris, France). Optical slices were taken every 200-nm interval along the z-axis covering the whole depth of the cell, at a resolution of 1.024/1.024 pixels. Three-dimensinal reconstruction was achieved using the IMARIS software (Bitplane, South Windsor, CT). Post-acquisition analysis and fluorescence quantification were done using a single-imaging frame collection and ImageJ 1.38×software. For each sample, 30 cells were analyzed from three independent experiments.
Oxygen consumption and total ATP steady-state level
High-resolution respirometry was performed on 106 intact cells per ml of culture medium at 20% O2 (38). Subsequent sequential additions were as follows: 0.5 μg/ml oligomycin to measure leaks, successive 1 μM doses of the protonophore carbonyl cyanide m-chlorophenyl hydrazone (cccp) up to the maximal respiration rate, and, finally, 1 mM KCN to evaluate nonrespiratory oxygen consumption. Reserve respiration was defined as the difference between maximal and basal respiration rate.
ATP steady-state level was measured by the ATP chemiluminescent assay (Roche, Mannheim, Germany) and normalized to the amount of cellular protein. Cells were incubated in the culture medium (basal) for 15 h with 1 μM oligomycin to inhibit mitochondrial ATP synthesis or without glucose but with 10 mM deoxyglucose to inhibit glycolysis.
Protein extraction and immunoblot
Cells were lysed in 50 mM Tris-HCl pH 7.5, 150 mM NaCl, 1% Triton X-100, 0.1% sodium dodecyl sulfate (SDS), 1 mM EDTA, and protease inhibitor cocktail. Thirty micrograms of protein, estimated by Bradford reactions (Sigma-Aldrich), were loaded for SDS-PAGE. After blotting, Hybond ECL nitrocellulose filters were probed with primary antibodies, then with IRDye secondary antibodies. Detection was performed using Odyssey Infrared Imaging system scanner and Odyssey application software v3.0 (LI-COR Biosciences, Lincoln, NE). OPA1, DRP1, and TFAM (Supplementary Fig. S5) were revealed from the same blot as well as GAPDH and the loading test by SYPRO Ruby (molecular weight, 92, 80, 28, and 37 kDa, respectively).
Protein bands were quantified, normalized to GAPDH, and then normalized to control cells grown at 20% O2. Since GAPDH may vary under hypoxia, a second normalization was done with SYPRO Ruby Protein Blot Stain according to the manufacturer's protocol (Life Technologies). Experiments were done in triplicate, and a representative Western blot was presented. For the carbonylated protein level (DNPH derivatization), the protein extracts were treated according to the protocol of OxyBlot Protein Oxidation Detection Kit (Merck Millipore).
Statistical analysis
Statistical tests were performed using StatistiXL, a package running as an Add-in to Windows versions of Microsoft's Excel spreadsheet program. The RT-qPCR experiments were analyzed by Full Factorial ANOVA. The detailed statistical results are given in Supplementary Table S4 for 81 genes analyzed. The effect of STOX1 is reported as “STOX1 status,” the effect of Oxygen (2% or 20%) as “Oxygen status,” and the possible interaction between the two factors as “Oxygen status*Stox1 status.” For immunohistochemistry and Western blots, Student's t-tests were performed. In the figures, significant effects of oxygen are represented with the symbol “#,” whereas significant effects of STOX1 overexpression are indicated with the symbol “*.” Significant interaction effects are indicated by “i.”
Multidimensional analyses (Principal Component Analysis) were performed on quantifications of fluorescent data, for building Figure 6A.
In this study, p<0.001 was considered significant for immunohistochemistry and Western blot experiments; p<0.01 for RT-qPCR and qPCR (for mitochondrial DNA content).
Footnotes
Acknowledgments
The authors thank the “Imagopole” (PFID) of Institut Pasteur. This work was supported by Agence Nationale de la Recherche (ANR 11 BSV2 025 02), Association pour la Recherche sur le Cancer (ARC SFI20111204038), and Association Française contre les Myopathies (AFM 16290). L.D. was a recipient of a PhD fellowship from the Ecole Normale Supérieure (Paris). A.D. was a PhD fellow from the Doctoral School GC2ID.
Author Disclosure Statement
The authors declare no conflict of interest.
Abbreviations Used
References
Supplementary Material
Please find the following supplemental material available below.
For Open Access articles published under a Creative Commons License, all supplemental material carries the same license as the article it is associated with.
For non-Open Access articles published, all supplemental material carries a non-exclusive license, and permission requests for re-use of supplemental material or any part of supplemental material shall be sent directly to the copyright owner as specified in the copyright notice associated with the article.