
Abstract
Introduction
N
Health-beneficial effects of pomegranate have been claimed due to its content of bioactive compounds. Punicalagin (PU) is one of the major ellagitannins found in pomegranate husk. We reported that PU could be the main active compound promoting mitochondrial functions, reducing oxidative stress, ameliorating inflammation, and thereby inhibiting high fat diet-induced obesity and associated fatty liver. Collected data indicated that PU from pomegranate could be an effective nutrient for preventing nonalcoholic fatty liver disease.
Fat accumulation within the liver during NAFLD is an indicator of disrupted lipid homeostasis that is usually controlled by sterol regulatory element-binding proteins (SREBPs). The SREBPs transcriptionally activate a cascade of enzymes that are required for endogenous cholesterol, fatty acid, triglyceride (TG), and phospholipid synthesis (10). Among the three SREBP isoforms, SREBP-1c is reported to contribute to hepatic lipogenesis and to NAFLD through transcriptional activation (24, 25). Meanwhile, NAFLD is characterized by the development of oxidative stress and changes in redox balance. Besides lipid metabolism alterations, it has been speculated that mitochondrial dysfunction, inflammation, and oxidative stress also may be closely associated with the progression of NAFLD (9, 13, 31, 37). Scott and Jamal (37) have demonstrated that hepatic mitochondrial dysfunction precedes the development of NAFLD in the Otsuka Long-Evans Tokushima Fatty (OLETF) rat model. Moreover, Vial et al. (48) have reported that the administration of a high-fat diet (HFD) in rats resulting in both decreased pools of mitochondrial quinine and profoundly altered mitochondrial lipid composition leads to the inhibition of fatty acid oxidation and the generation of mitochondrial reactive oxygen species (ROS). Increasingly, studies have raised the possibility that NAFLD might be a mitochondrial disease. However, mitochondrial function is regulated by several processes, including mitochondrial biogenesis, dynamics, and modification, as well as mitophagy (16, 18, 38, 47). Therefore, the precise mechanisms underlying the mitochondrial contribution to NAFLD still require further investigation.
Recently reported insights into the risk factors and the molecular pathogenesis of NAFLD suggest that lifestyle interventions aimed at decreasing obesity and metabolic dysfunction should be the first line of treatment (43). Therapeutic drug modalities targeted against one or more specific factors and/or molecules involved in the development of NAFLD (i.e., insulin resistance, free fatty acid (FFA) toxicity, and oxidative stress) might also slow the progression of this increasingly prevalent pediatric pathology (1). Meanwhile, natural antioxidants, cytoprotective agents, and dietary supplements, including vitamins D and E, omega-3 fatty acids, and coffee, have gained more attention and have already exhibited promising effects on NAFLD (2, 33, 36). The pomegranate fruit is used as a folk medicine for the treatment of various diseases such as ulcers, fever, diarrhea, and microbial infections (11). Currently, pomegranate juice is widely consumed, and more than 90 international patents cover the use of pomegranate juice and other derivatives as sources of health-promoting effects (5). Of the polyphenols found in pomegranates, punicalagin (PU) has the highest molecular weight and is the most abundant ellagitannin. It has been shown to have antioxidant and anti-inflammatory bioactivities (8, 20). However, no studies have reported its effects on NAFLD, a condition that is closely associated with oxidative stress and inflammation. Therefore, we speculated that PU may also have beneficial effects on HFD-induced obesity and NAFLD.
Results
The effects of HFD and pomegranate extract on body weight and food intake
An HFD rat model was used to investigate the potential effect of PU on obesity-associated NAFLD. Obesity was induced by the administration of an HFD over an 8-week period. Pomegranate extract (PE) was administered by oral gavage at dosages of either 50 or 150 mg/kg/day during the administration of the HFD. As shown in Table 1, the HFD significantly increased body weight. The high-dose PE treatment effectively reduced body weight and body weight gain without affecting food or energy intake (Table 1).
The values are the means±the SEM from 15 animals.
p<0.05 versus the normal control group.
p<0.05 versus the HFD-fed group.
p<0.01 versus the normal control group.
p<0.01 versus the HFD-fed group.
HFD, high-fat diet.
The effects of HFD and PE on serum parameters
The HFD-induced obesity model is usually accompanied by hyperlipidemia and impaired insulin sensitivity. In the current study, a significantly high level of fasting insulin was induced by HFD and effectively blocked by both low- and high-dose PE treatments; while only high-dose PE inhibited the increase of the homeostatic model assessment–insulin resistance (HOMA-IR) index induced by HFD (Table 2). Both the HFD-induced increase in leptin and the decrease in adiponectin levels were restored significantly by both low- and high-dose PE treatments (Table 2). In addition, the serum TGs as well as total and low-density lipoprotein cholesterol (LDL-C) levels increased by HFD were also normalized through PE supplementation (Table 2). The HFD elicited no effect on high-density lipoprotein cholesterol (HDL-C), whereas both low- and high-dose PE treatments significantly increased its serum levels (Table 2).
The values are the means±the SEM from at least 14 animals.
p<0.01 versus the normal control group.
p<0.01 versus the HFD-fed group.
p<0.05 versus the normal control group.
p<0.05 versus the HFD-fed group.
HDL-C, high-density lipoprotein cholesterol; HOMA-IR, homeostatic model assessment–insulin resistance; LDL-C, low-density lipoprotein cholesterol; TG, triglyceride.
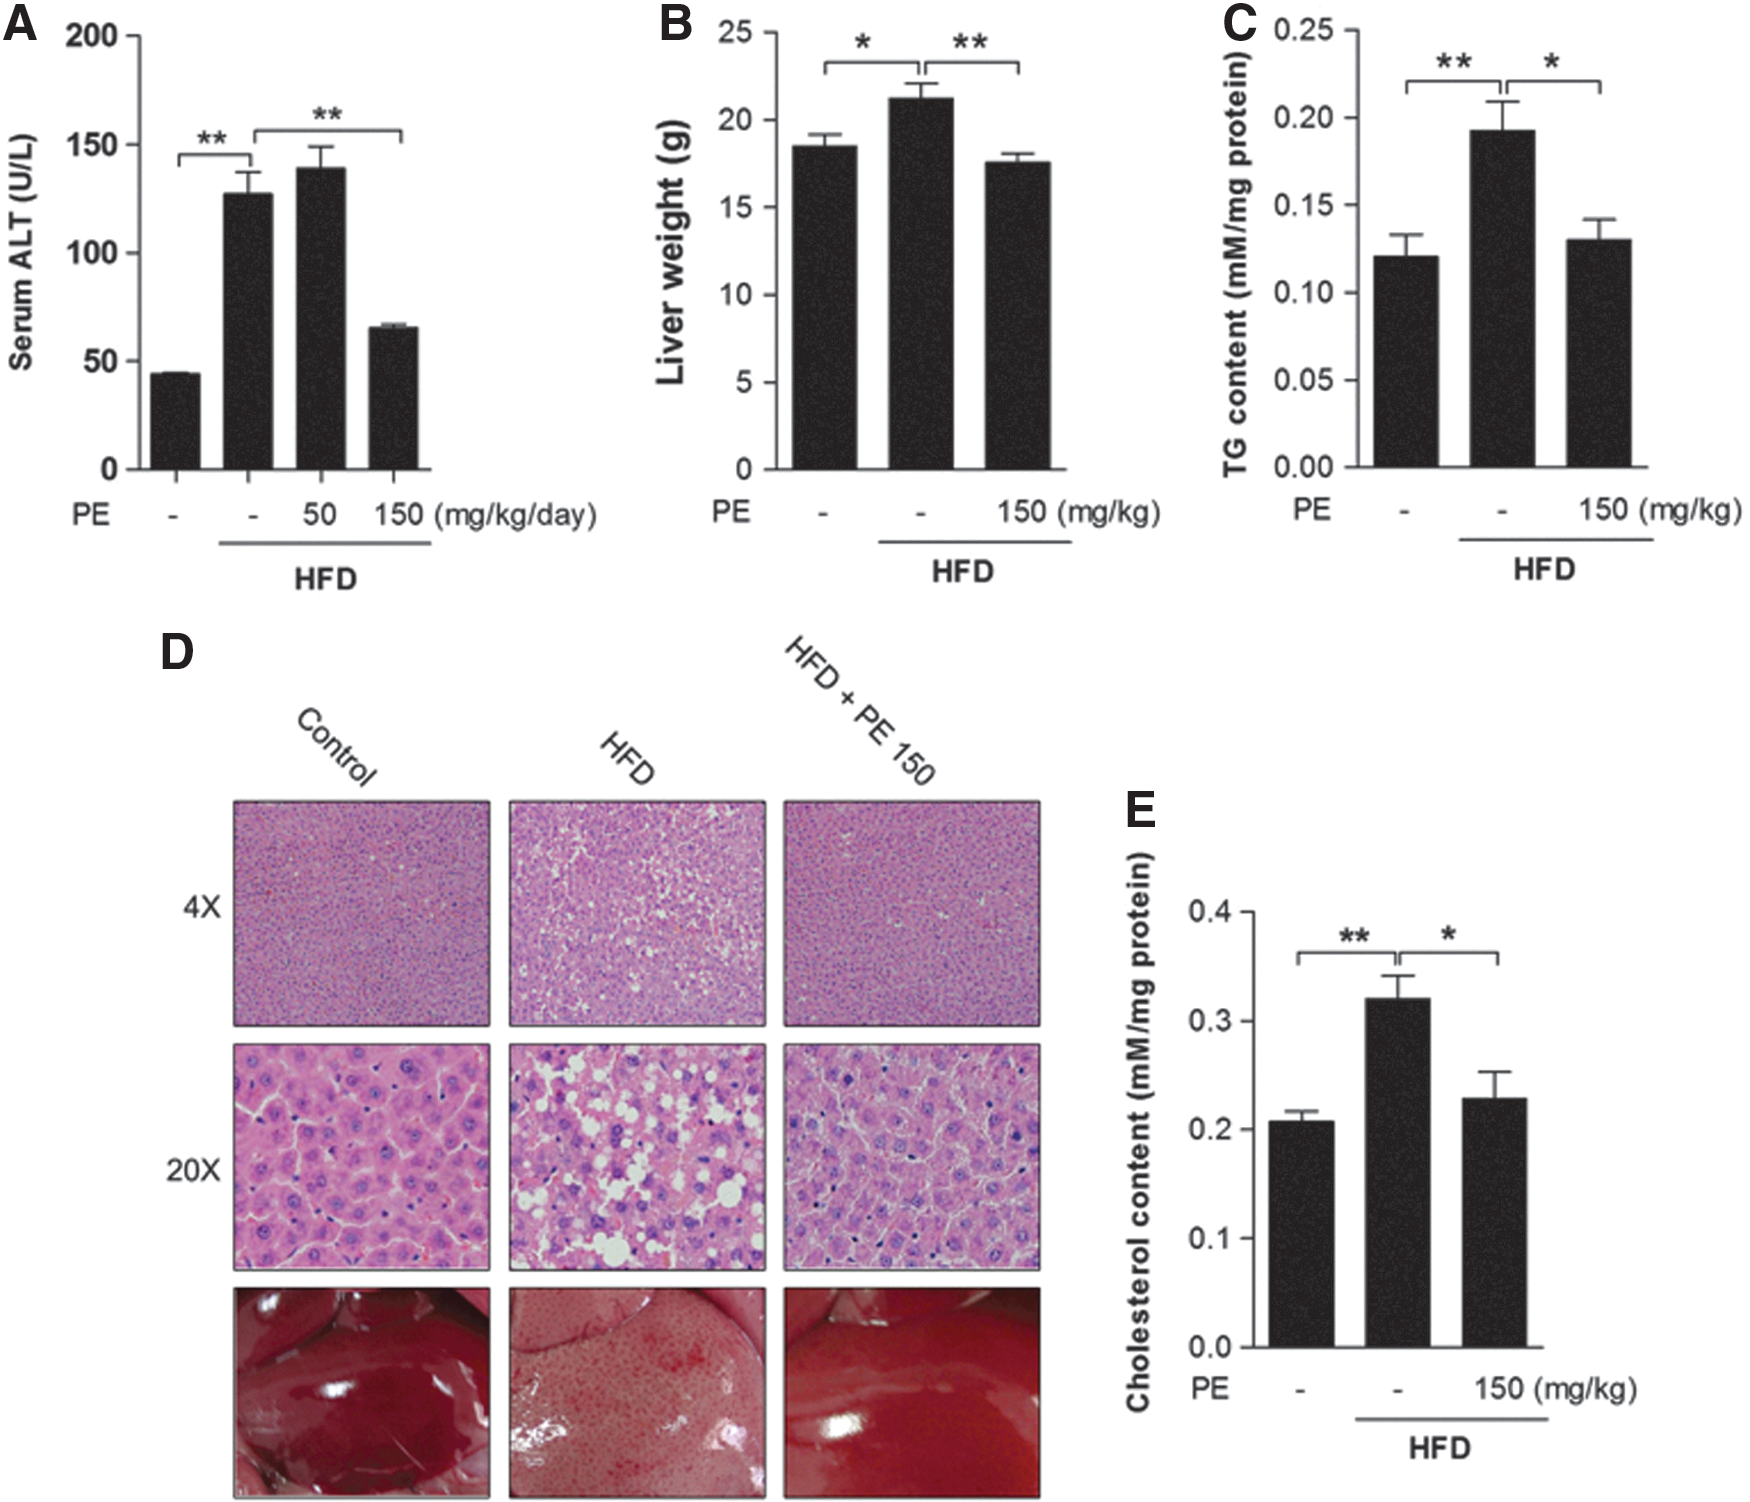
The effects of HFD and PE on liver TG and cholesterol content
As a major liver damage marker (21), alanine transaminase (ALT) was increased after HFD feeding, and it was significantly decreased only by high-dose PE (Fig. 1A). Since significant effects were exerted only by high-dose PE on serum TG and cholesterol levels, we chose only the high-dose PE-treated liver tissues for further analysis. Obviously, HFD increased liver weight, which was normalized by PE treatment (Fig. 1B). Hematoxylin-eosin (HE) staining revealed massive lipid accumulation in the HFD liver; this accumulation was eliminated by treatment with PE (Fig. 1D). HFD significantly increased liver TG (Fig. 1C) and cholesterol (Fig. 1E) contents, and these were effectively decreased by treatment with PE.
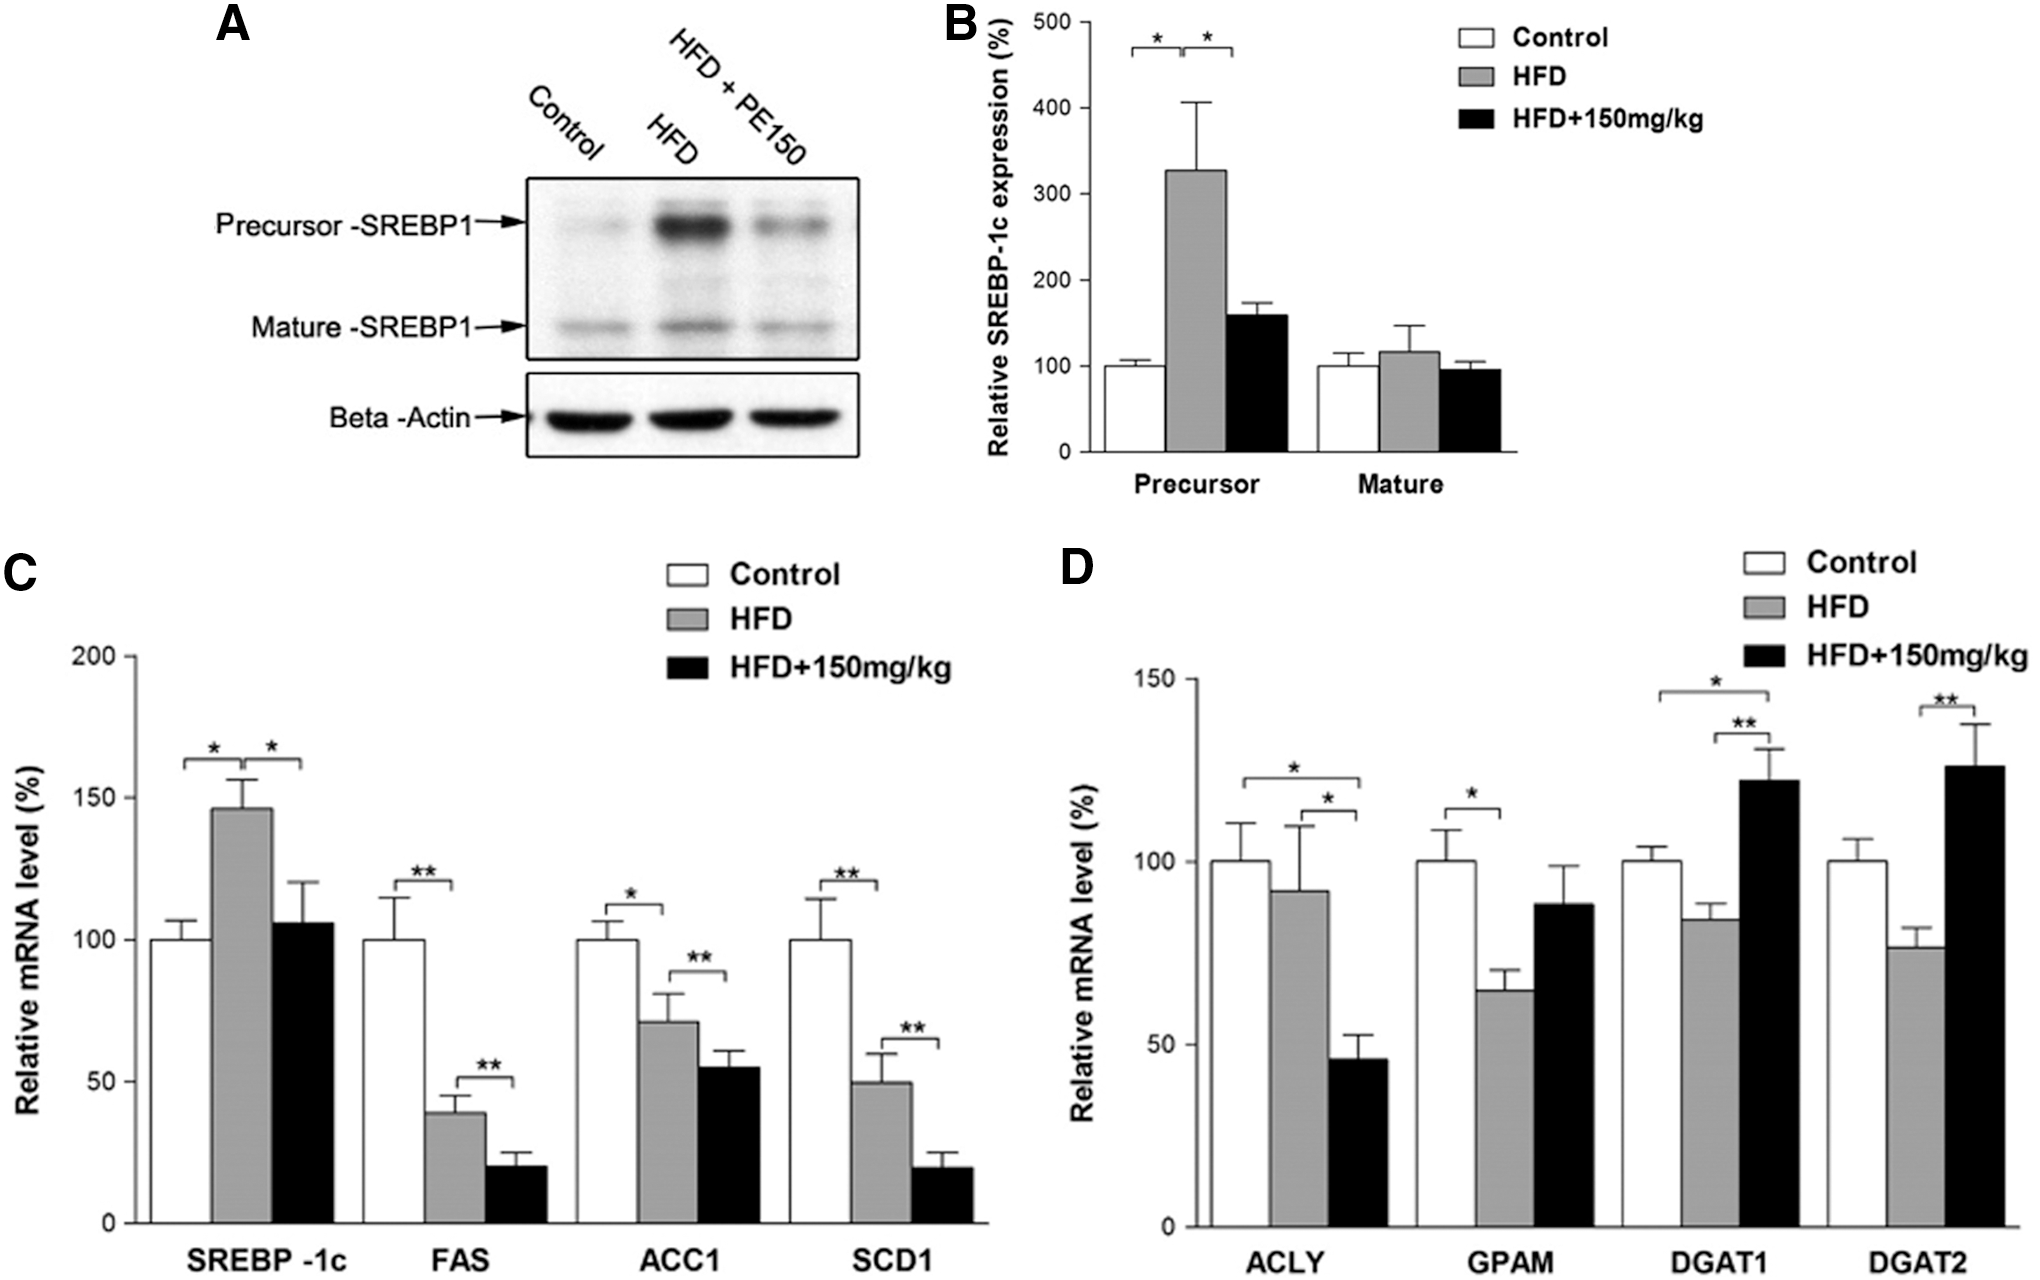
The effects of HFD and PE on SREBP-1c activation
Previous reports have indicated that SREBP-1c pathway activation may contribute to the progression of NAFLD. We, therefore, examined the involvement of the SREBP-1c pathway in HFD-induced NAFLD. Surprisingly, the SREBP-1c precursor protein was, indeed, increased by the HFD; whereas the mature form remained unaffected (Fig. 2A, B). The mRNA levels of SREBP-1c were increased; whereas its target genes FAS, ACC1, and SCD1 were decreased by the HFD (Fig. 2C). Moreover, when compared with the HFD group, the PE co-treated group exhibited significant decreases in all of these mRNA levels (Fig. 2C). In contrast, the HFD elicited no apparent effects on the lipid synthesis-related genes ATP citrate lyase (ACLY) and diacylglycerol acyltransferase (DGAT1, DGAT2), although it decreased GPAM mRNA levels (Fig. 2D). PE treatment significantly decreased ACLY and increased DGAT1 and DGAT2 mRNA levels (Fig. 2D).
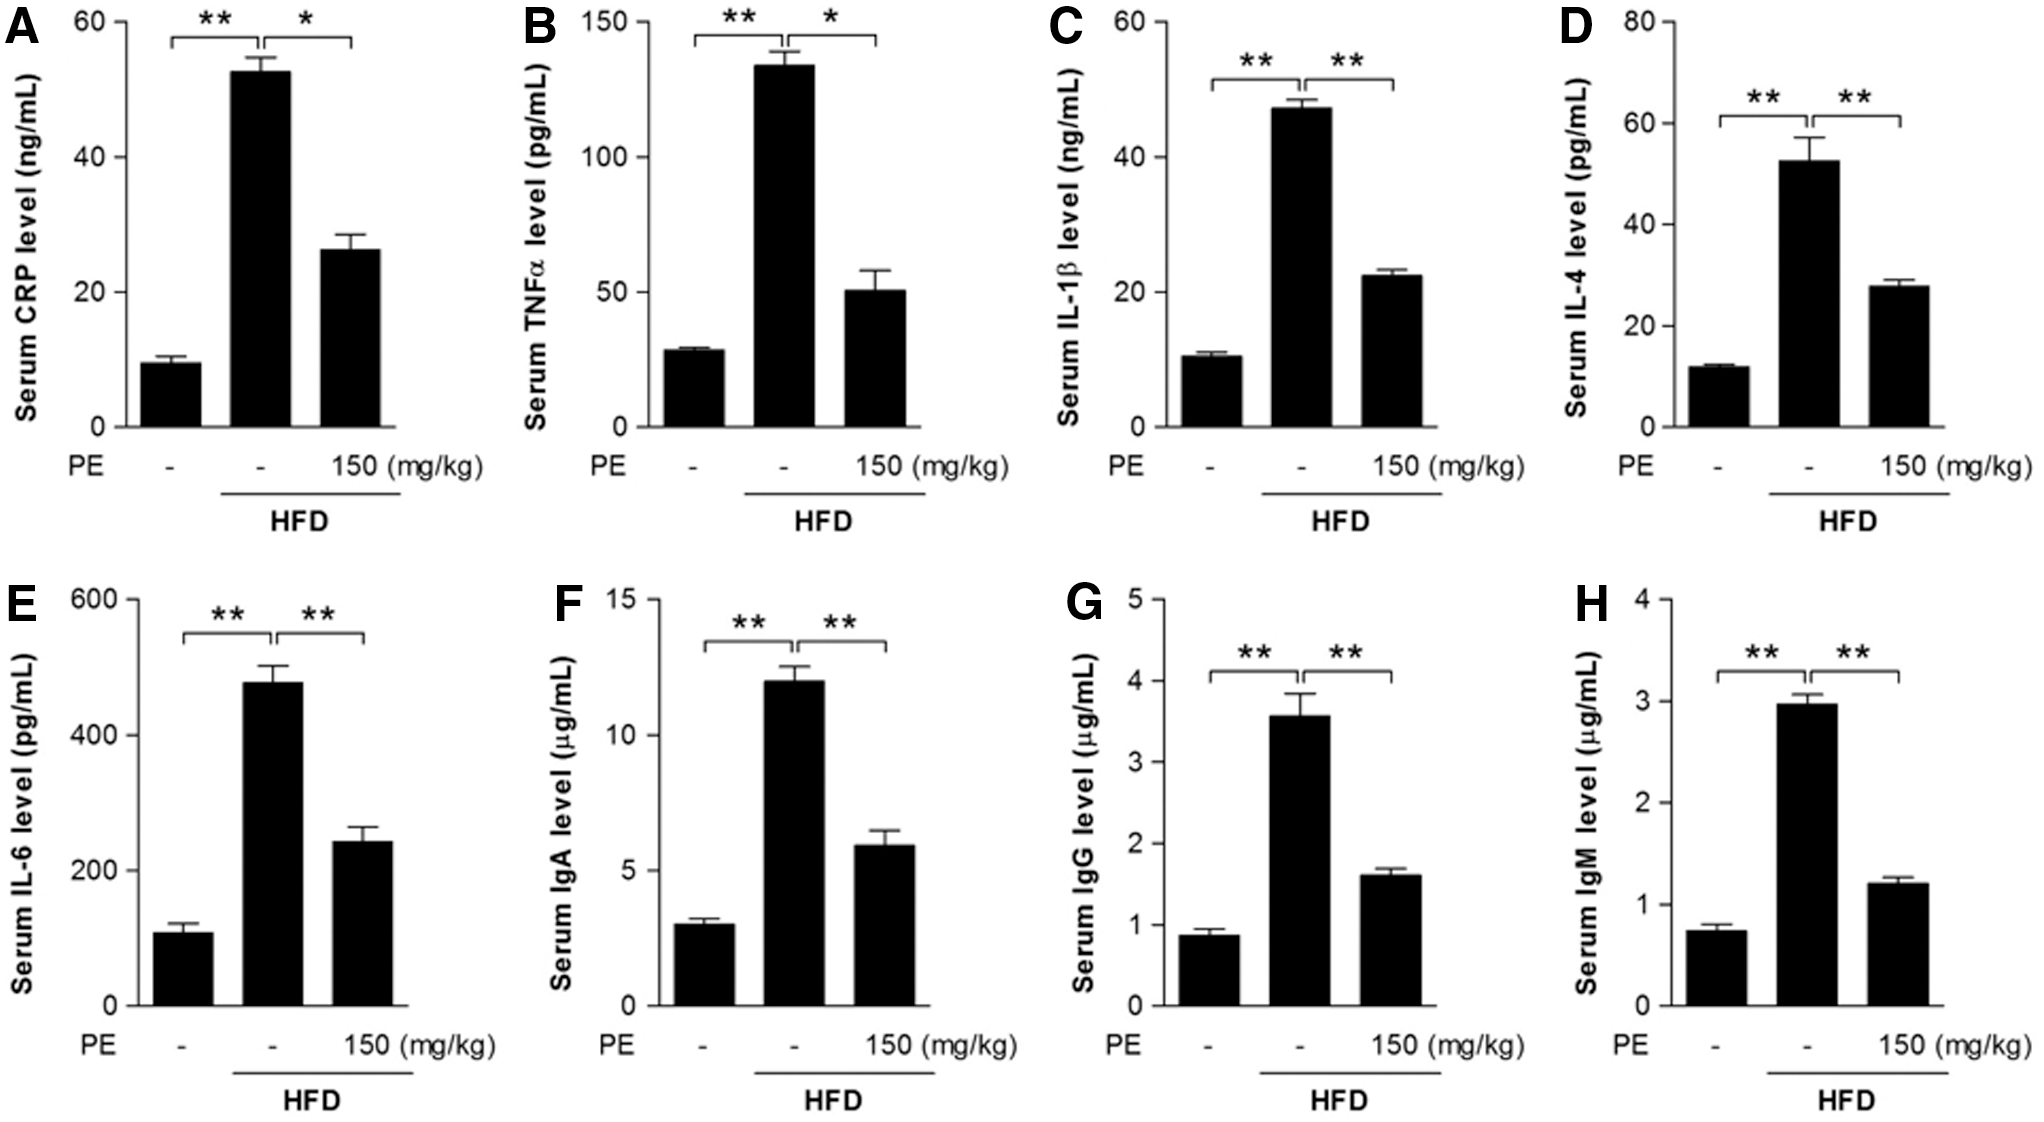
The effects of HFD and PE on inflammation
Inflammation may be closely associated with the progression of NAFLD (19, 22). Here, we found that C-reactive protein (CRP)—an acute-phase protein produced by the liver during inflammation—was significantly increased after HFD feeding (Fig. 3A). Serum levels of the inflammatory cytokines TNFα, IL-1β, IL-4, and IL-6, as well as immunoglobulins IgA, IgM, and IgG were increased after HFD feeding (Fig. 3B–H). As expected, PE supplementation successfully restored all these factors to normal levels (Fig. 3).
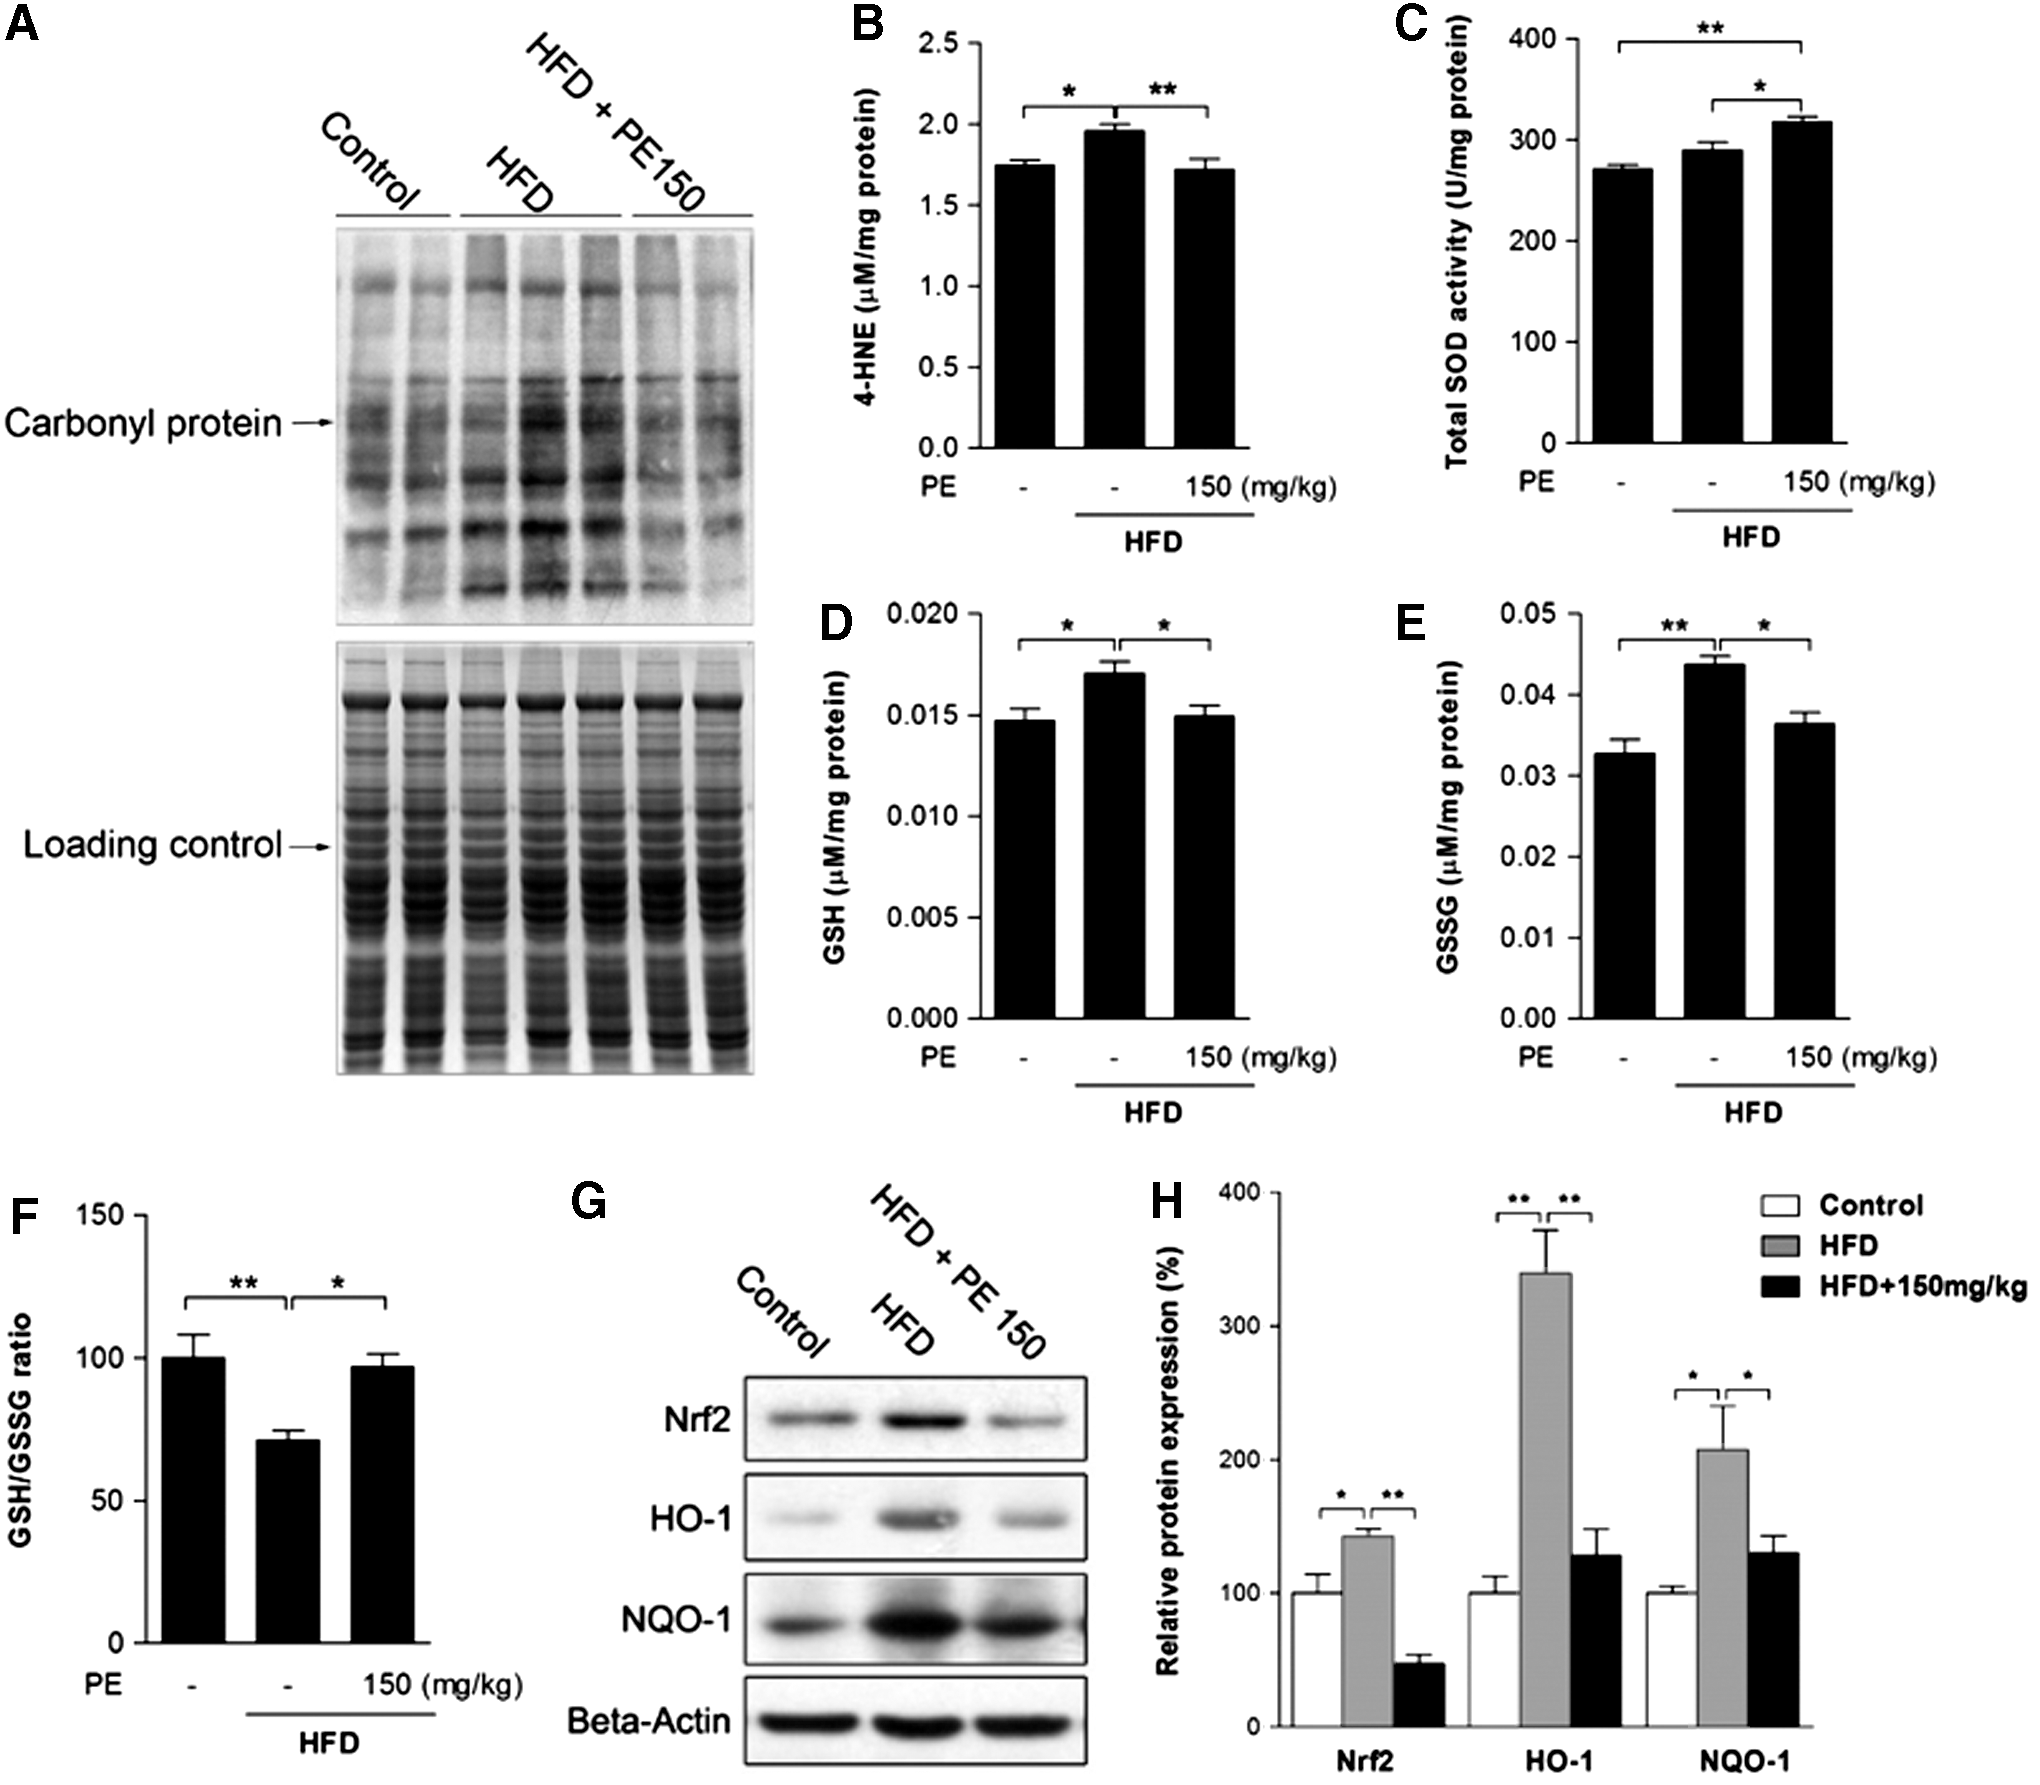
The effects of HFD and PE on liver oxidative status
Oxidative stress has been well established as a contributor to inflammation and the pathogenesis of NAFLD (42). The HFD group showed higher levels of protein oxidation and of the lipid peroxidation product 4-HNE, both of which were normalized by PE administration (Fig. 4A, B). Meanwhile, PE was found to increase liver superoxide dismutase (SOD) activity, thus possibly helping eliminate oxidative stress (Fig. 4C). In response to oxidative stress, liver-reduced glutathione (GSH) was increased by HFD feeding (Fig. 4D). However, the ratio between GSH and oxidized glutathione (GSSG) was decreased, as HFD also increased GSSG to a higher level (Fig. 4E, F). GSH production is regulated by Phase II enzymes, which are, in turn, regulated by Nrf2. Similar to GSH levels, nuclear factor (erythroid-derived-2)-like 2 (Nrf2) expression as well as that of its target genes HO-1 and NQO-1 were increased by HFD feeding (Fig. 4G, H). Nevertheless, PE treatment effectively eliminated activation of the Phase II enzyme system.
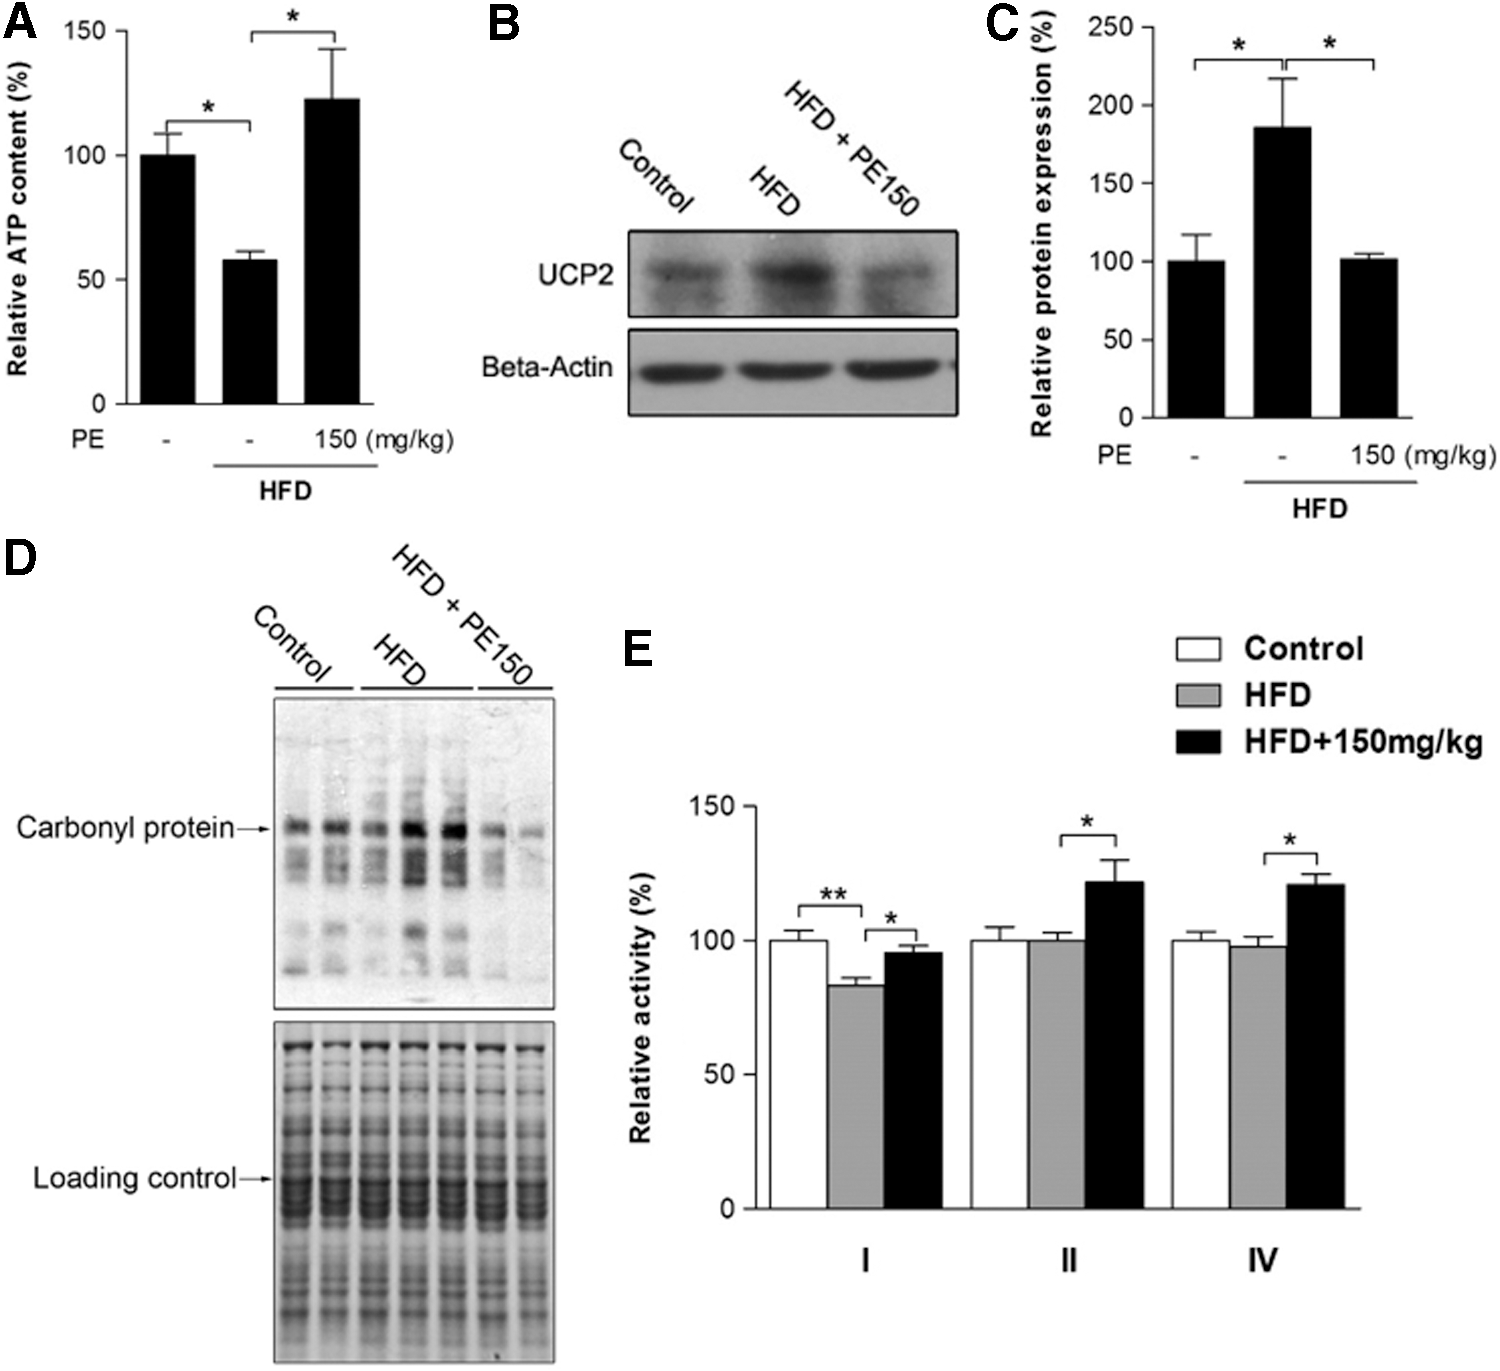
The effects of HFD and PE on mitochondrial status
To investigate the involvement of mitochondria in HFD-induced oxidative stress and NAFLD, we first measured liver ATP content: Significant ATP depletion was triggered by HFD feeding and efficiently improved through PE supplementation (Fig. 5A). Liver uncoupling protein 2 (UCP2) expression was up-regulated by HFD, which might lead to the depletion of cellular ATP reserves (Fig. 5B, C). Being the major source of ROS, mitochondria are also vulnerable targets. We then found that mitochondrial protein oxidation was obviously increased in the HFD group (Fig. 5D); as a result, mitochondrial complex I activity was decreased by HFD (Fig. 5E). PE supplementation substantially reduced both UCP2 expression and mitochondrial protein oxidation (Fig. 5B–D). Meanwhile, PE treatment not only restored complex I activity to basal levels but also significantly increased the activities of complexes II and IV (Fig. 5E).
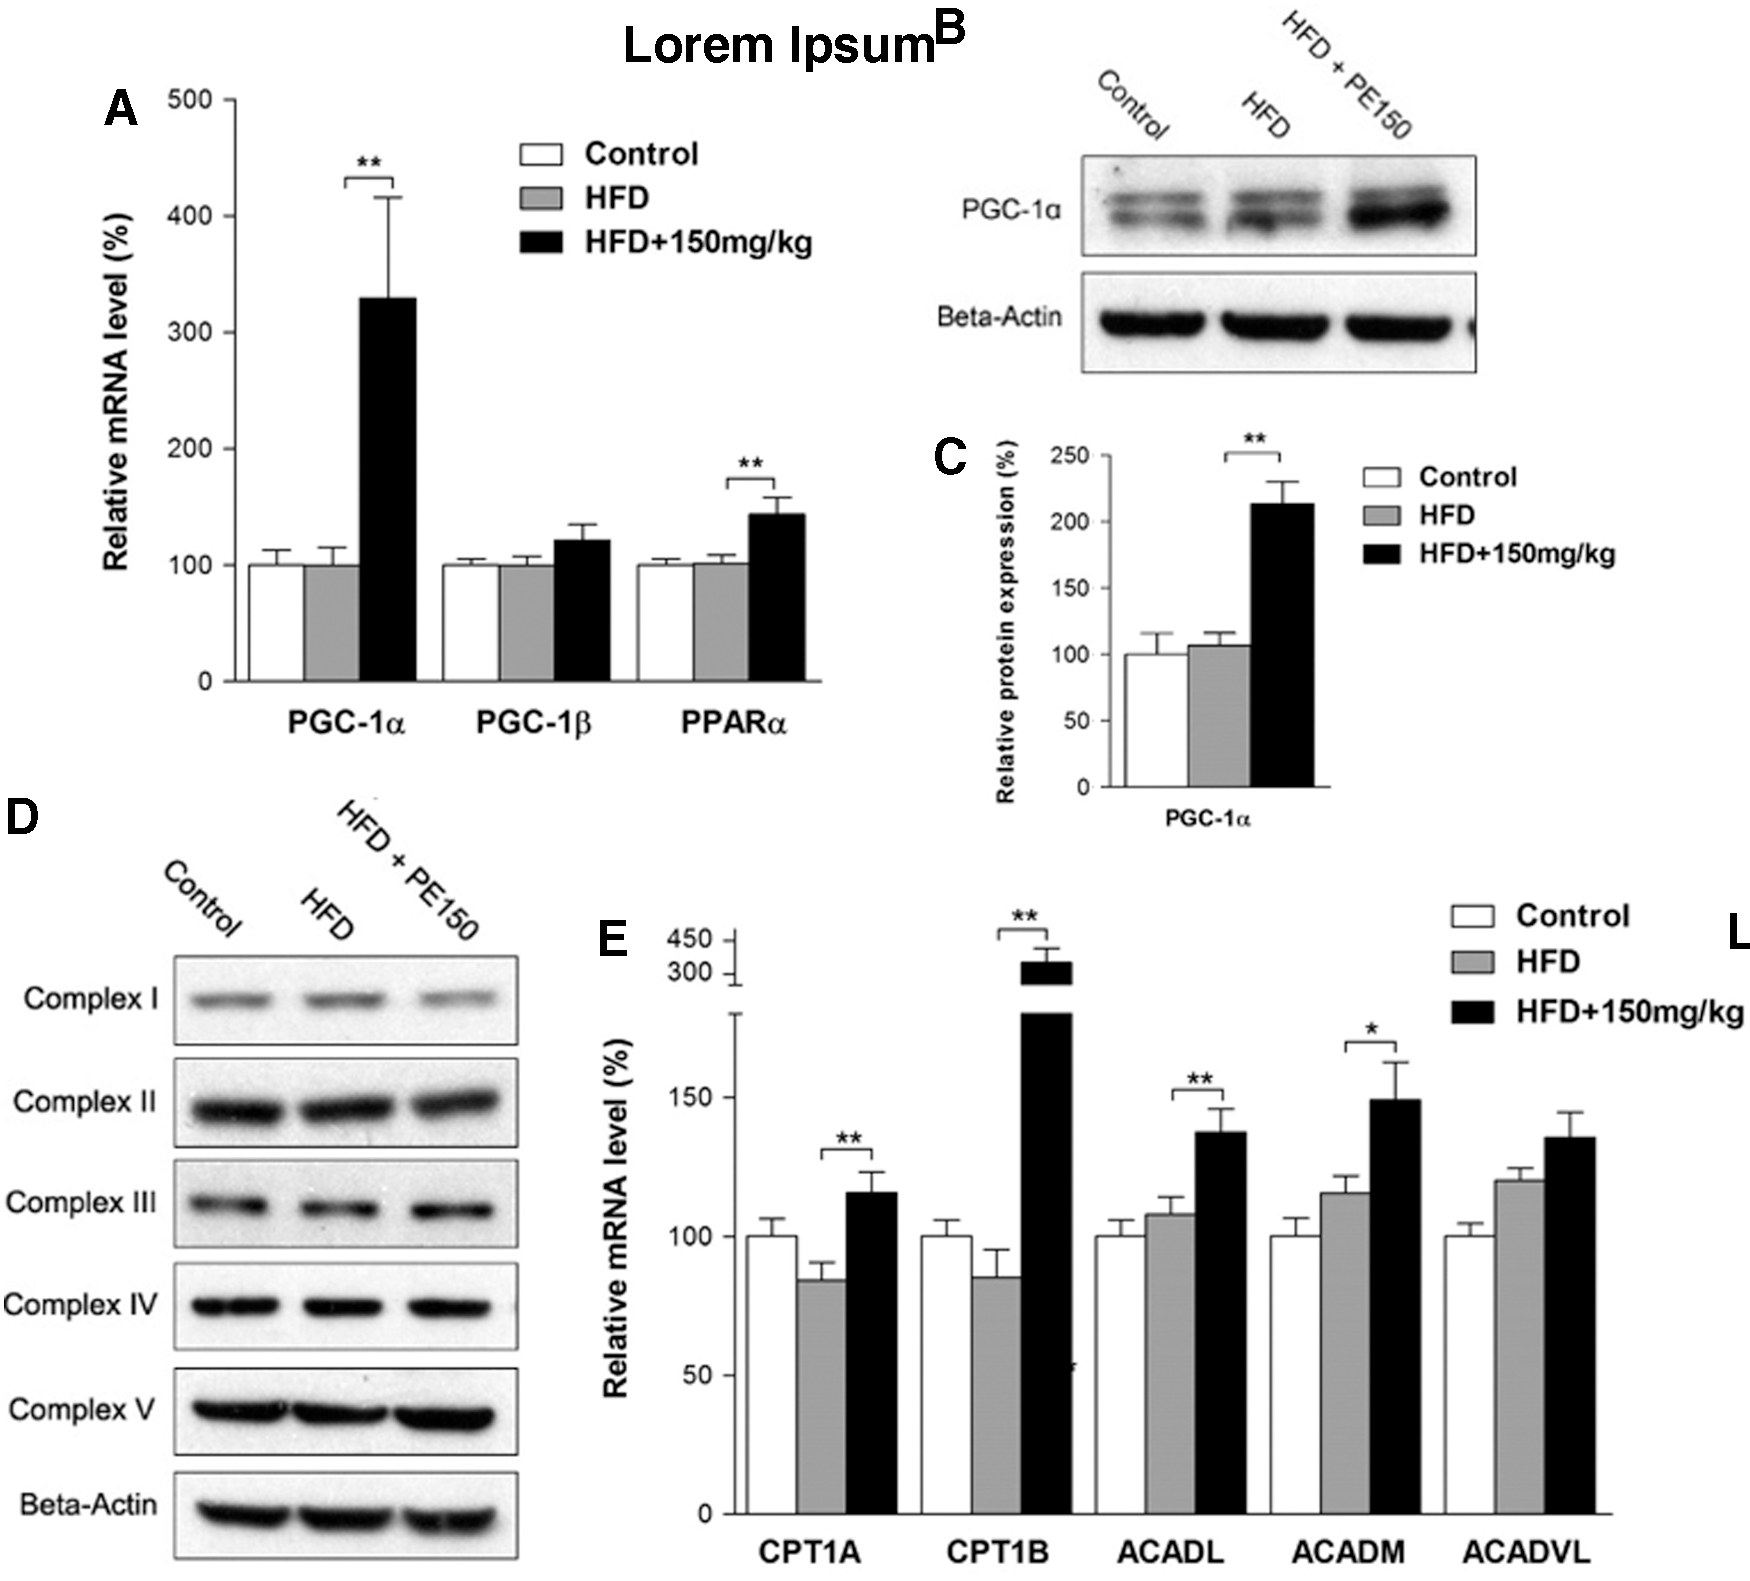
The effects of HFD and PE on beta-oxidation
Peroxisomal proliferator-activated receptor–gamma coactivator-1α (PGC-1α) is a well-known regulator of mitochondrial biogenesis and lipid beta-oxidation. Our study found that PE significantly increased PGC-1α mRNA and protein levels compared with the HFD group (Fig. 6A–C), whereas PGC-1β was unaffected by either HFD or PE treatments. We also found that PE significantly increased the peroxisome proliferator-activated receptor α (PPARα) mRNA levels (Fig. 6A). Although mitochondrial content remained unchanged among the three groups as measured by mitochondrial complex subunits (Fig. 6D), the lipid beta-oxidation-related genes CPT1A, CPT1B, ACADL, and ACADM were significantly induced by PE treatment compared with the HFD group (Fig. 6E).
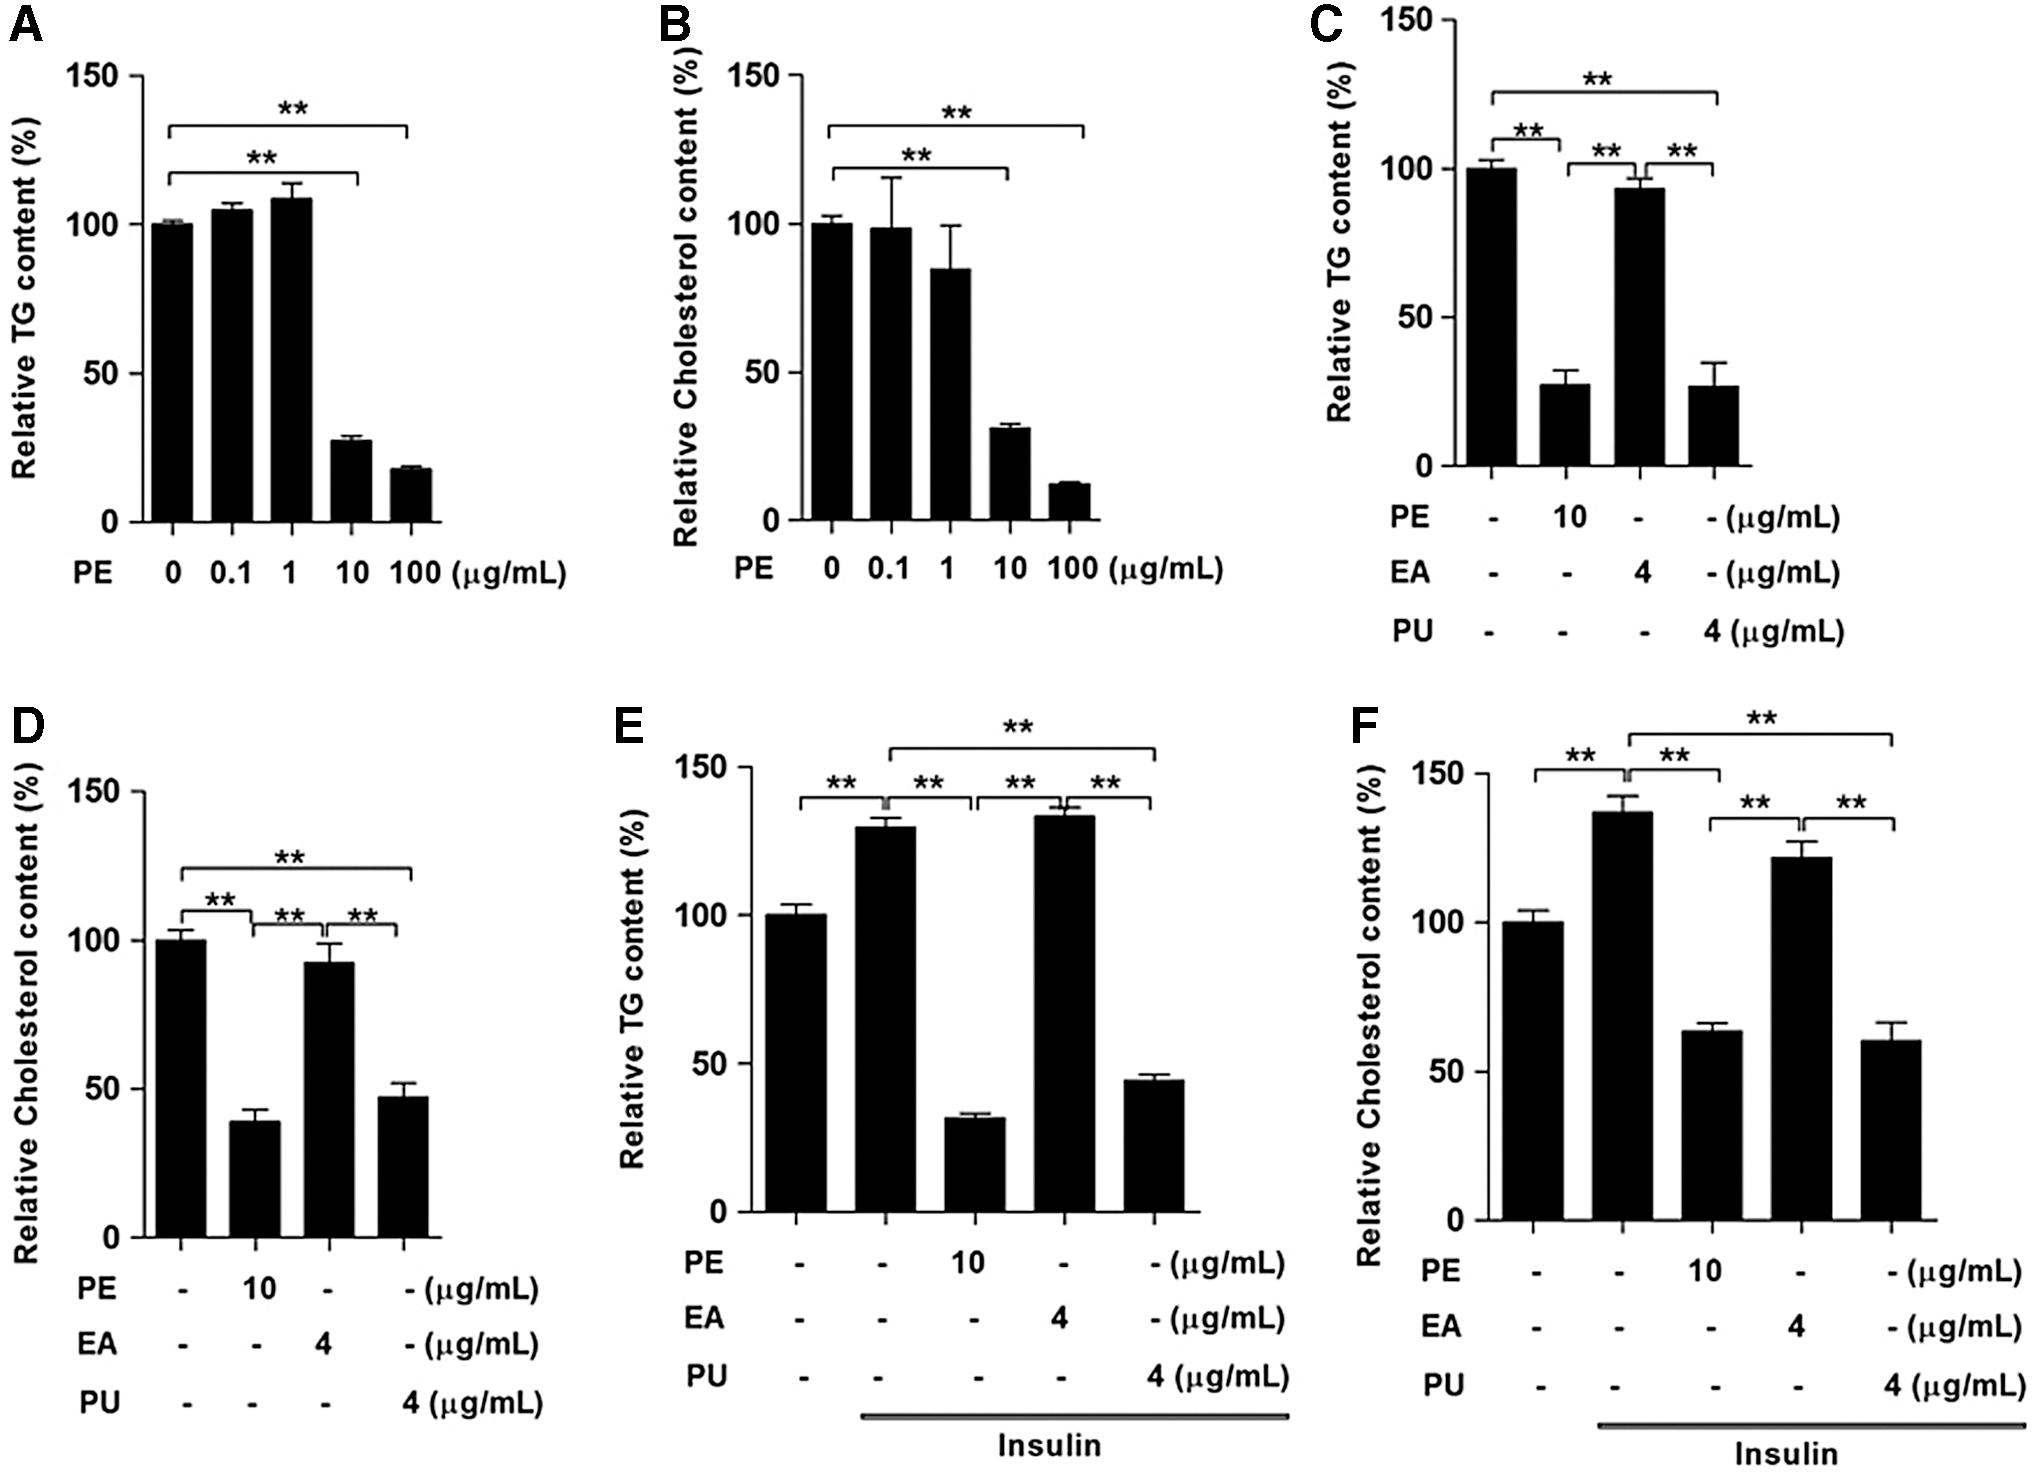
The effects of PE, PU, and ellagic acid on the lipid content of HepG2 cells
To further confirm that PU is the main active component affecting lipid metabolism, we first treated HepG2 cells with two doses of PE for 24 h and found that both concentrations of PE at 10 and 100 μg/ml significantly reduced TG (Fig. 7A) and cholesterol content (Fig. 7B). Since the PE contained 40% PU, we compared the effects of 4 μg/ml PU and 4 μg/ml ellagic acid (EA) with 10 μg/ml PE. The results indicated that PU and PE elicited similar effects on TG (Fig. 7C) and cholesterol content (Fig. 7D), whereas EA had no obvious effects. Furthermore, during insulin stimulation, both PU and PE elicited similar effects on decreasing cellular TG (Fig. 7E) and cholesterol content (Fig. 7F).
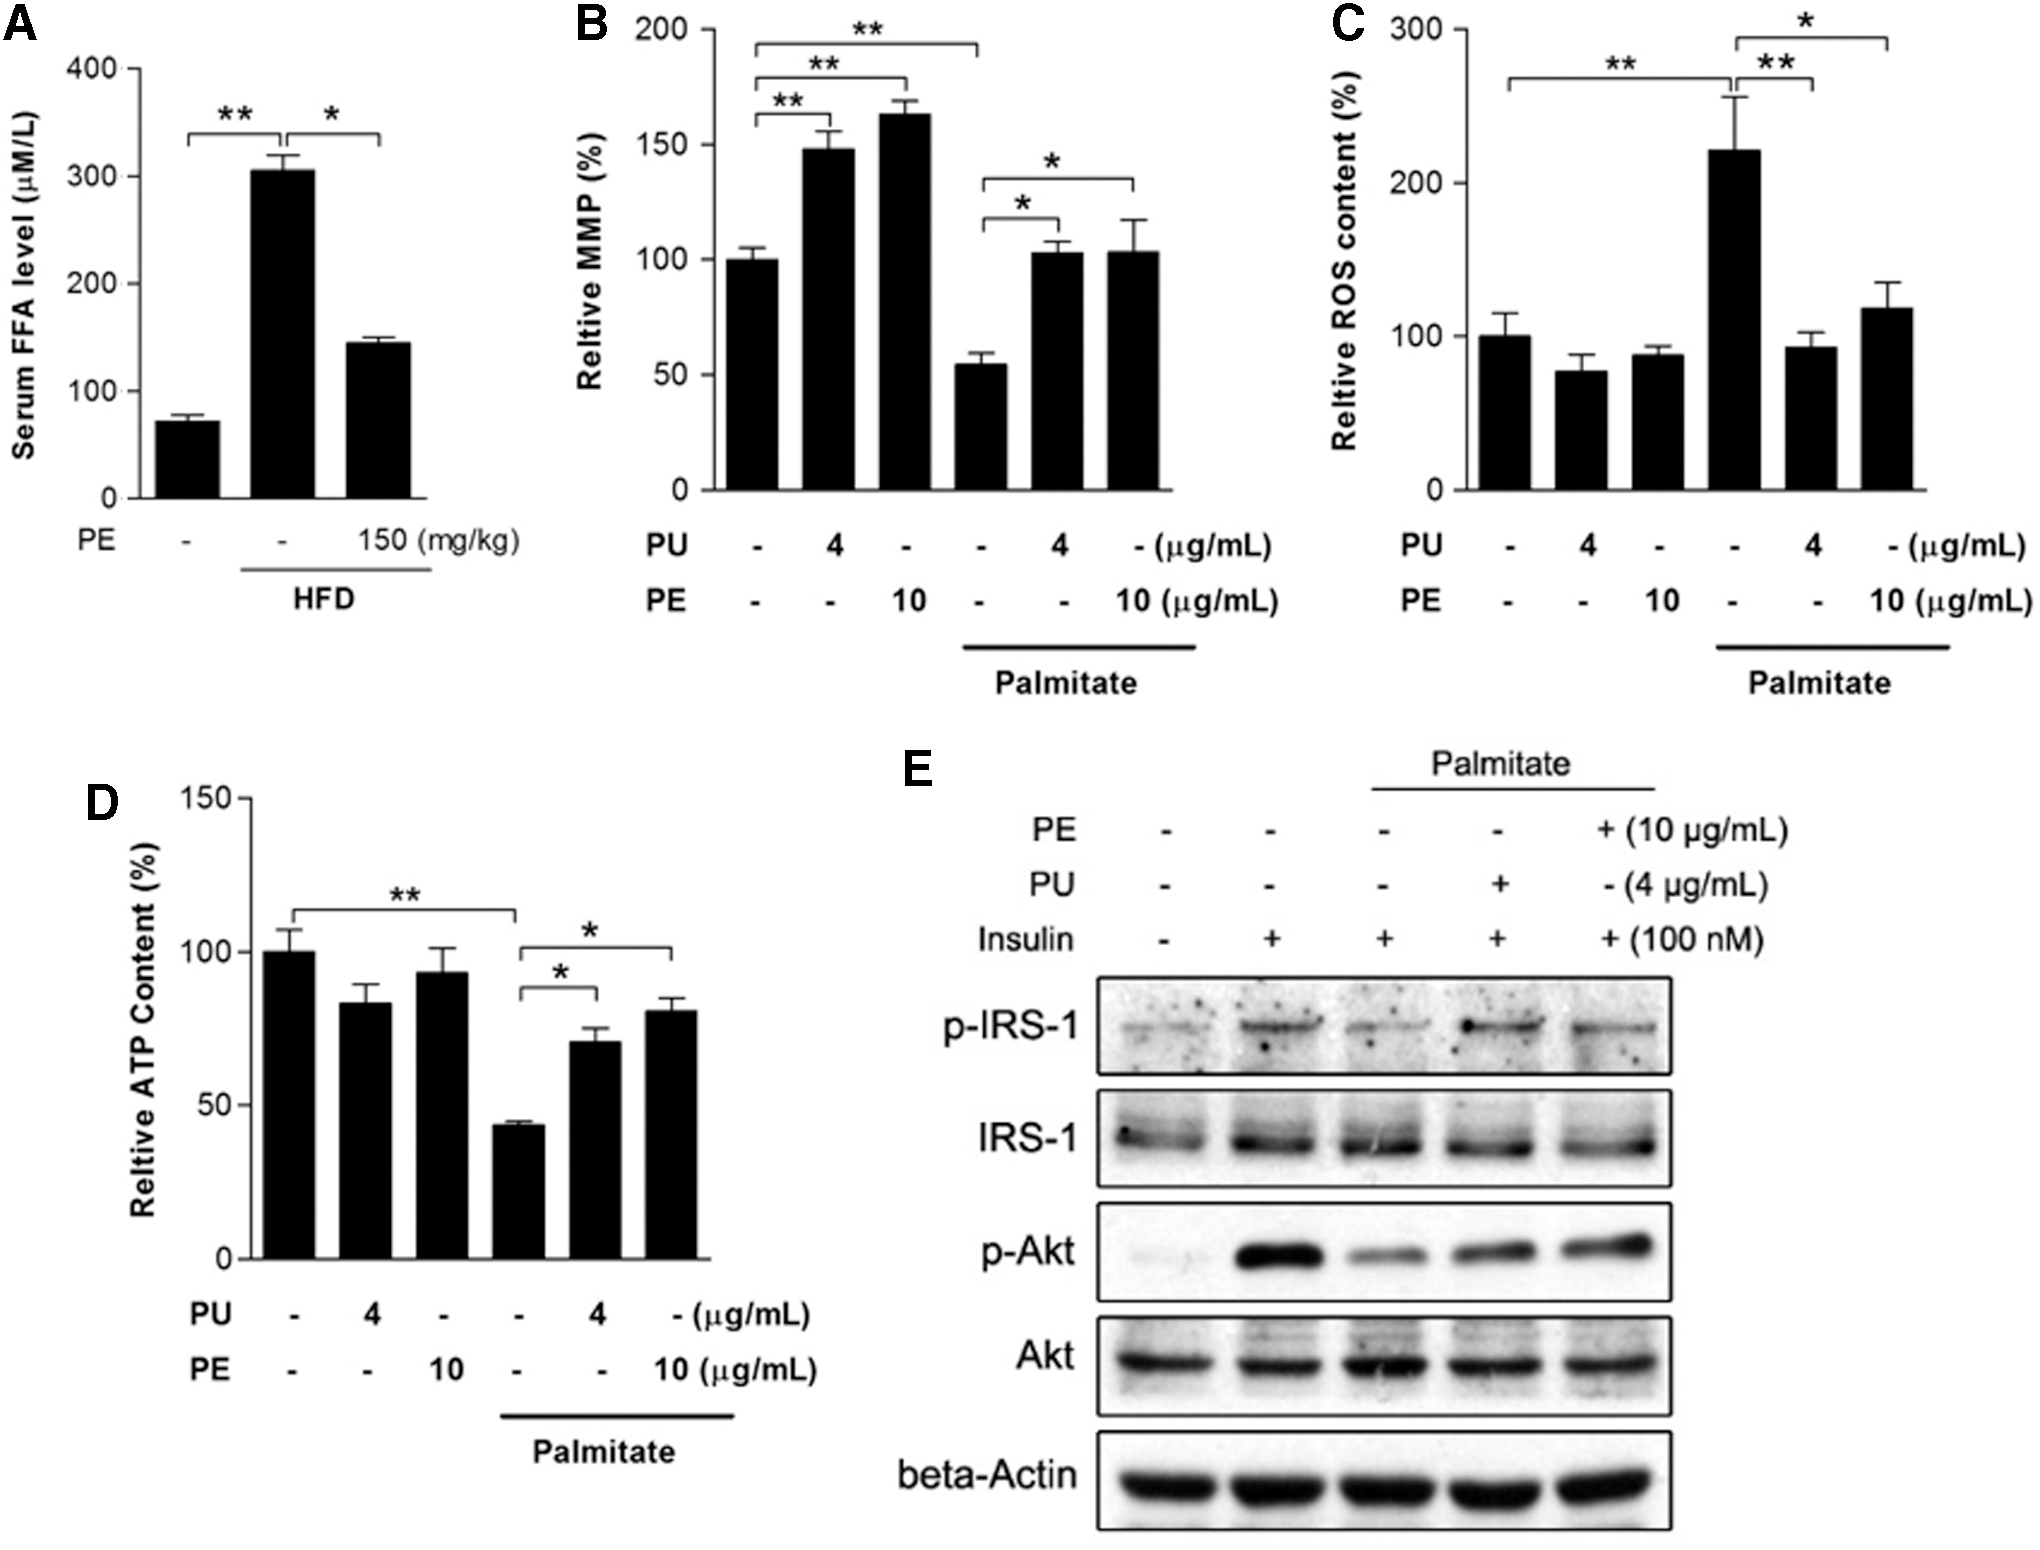
PU and PE protect against palmitate-induced mitochondrial dysfunction and insulin resistance
It is well accepted that FFA-induced lipotoxicity plays a pivotal role in the pathogenesis of NAFLD. An increased serum FFA level was observed in HFD rats, which was significantly inhibited by PE (Fig. 8A). To better understand the protective effects of PE against FFA and to elucidate whether PE's protective effects on liver mitochondrial function was the consequence of amelioration of inflammation and adipokine secretion, we used an in vitro HepG2 model with palmitate treatment as an FFA challenge. After a 24 h treatment, palmitate induced significant mitochondrial dysfunction, including mitochondrial membrane potential (MMP) loss, burst of ROS production, and ATP depletion (Fig. 8B–D). As expected, pretreatment with either PU or PE effectively restored mitochondrial function. Meanwhile, palmitate inhibited insulin signal transduction by decreasing p-IRS-1 and p-Akt levels under insulin stimulation (Fig. 8E), and the inhibition was diminished by PU and PE pretreatment.
Discussion
NAFLD is the most common chronic liver disease in the world, and it is closely associated with metabolic pathologies. The alarming epidemics of diabetes and obesity have fueled an increasing prevalence of NAFLD (44). Therefore, an HFD-induced obesity model was developed to study fatty liver formation. Current therapeutic treatment recommendations include weight loss and the reversal of other components of metabolic pathologies (27, 45), and here, we reported that PU from PE exerted beneficial effects on HFD-induced metabolic disorders, including obesity, hyperlipidemia, and fatty liver.
Toxicity evaluation indicated that a 6% PU content in the rat diet (4.8g of PU/kg/day) during 37 days did not provoke tissue alterations (5). In this study, we used pomegranate husk extract containing 40% PU, the highest extract concentration available on the market. Nontoxic doses of PE, 50 and 150 mg/kg/day (containing 20 and 60 mg/kg/day PU, respectively), were administered concurrently with the HFD for 8 weeks. In a previous study, PU was detected at concentrations around 30 μg/ml after daily intake from 0.6 to 1.2 g (6). In the current study, after PE gavage (150 mg/kg), serum PU concentration increased time dependently and reached 17.5 μg/ml at 2 h (Supplementary Fig. S1; Supplementary Data are available online at
With regard to lipid biosynthesis, SREBP-1c-activated lipogenesis has been suggested to contribute to NAFLD (14, 24, 29). The SREBP-1c precursor is cleaved into small fragments, which translocate into the nucleus and activate lipogenesis-related genes, such as FAS, ACC1, and SCD1 (23, 32, 35). Unlike other studies, we found that the HFD increased SREBP-1c mRNA and immature protein levels, while the mature SREBP-1c protein levels remained unaffected. The latter result may help in understanding the decrease in SREBP-1 target gene levels, and it implies that the HFD-induced NAFLD is independent of the activation of lipogenesis in our study. Similar results were also observed in other studies: Yasari et al. noticed decreased SCD1 mRNA and increased SREBP-1c mRNA after 8 weeks of HFD (50), and Song et al. reported decreased ACC1 protein expression and increased SREBP-1c mRNA in rat hepatocyte steatosis (39). In the methionine- and choline-deficient diet-induced fatty liver model, liver SCD1 expression was most significantly down-regulated (17). In sum, all these studies make apparent the necessity for a further investigation of SREBP-1c-associated target genes in diet-induced fatty liver progression. Nevertheless, PE treatment still significantly inhibited lipogenesis compared with the HFD group. Moreover, PE sharply decreased the expression of ACLY, which is a key lipogenic enzyme that catalyzes acetyl-CoA production for fatty acid biosynthesis. Down-regulation of ACLY has been proved to efficiently reduce hepatic steatosis (49). Since both lipogenesis and acetyl-CoA production were sharply inhibited, increased expression of DGAT1 and DGAT2 in the PE-treated group might be a compensatory response. Nevertheless, PE treatment still reduced liver TG content to control levels.
In addition to the activation of lipogenesis, inflammation and mitochondrial dysfunction-induced oxidative stress have also been shown to be major factors for the development of NAFLD (15, 28, 37). As expected, the HFD-induced increased levels of inflammatory cytokines and immunoglobulins were completely normalized by PE. Moreover, PE efficiently prevented liver oxidative damage and eliminated Nrf2 activation. As a major source of ROS production, the involvement of mitochondria in NAFLD pathogenesis is inevitable. ATP—the major product of mitochondrial oxidative phosphorylation—was decreased in HFD liver; its decrease may be attributable to the increase in UCP2 (7). Meanwhile, the HFD-induced increase in mitochondrial protein oxidation and the decrease in complex I activity might contribute to the impairment of mitochondrial respiration and the reduction in ATP production. Moreover, reduced complex I activity may induce the generation of mitochondrial ROS, which, in turn, can exacerbate oxidative stress (26, 46). Interestingly, in addition to restoring all these changes to normal levels, PE was found to increase complex II and IV activities, suggesting that the effects of PE on mitochondrial function are ameliorative.
The absorption, transport, and breakdown of lipids might represent alternative mechanisms used to reduce the lipid content of the blood and the liver. With regard to lipid breakdown, the carnitine palmitoyltransferase 1 (CPT1)-catalyzed transfer of long-chain fatty acids into mitochondria is the key step during beta-oxidation. PGC-1α has been identified to be a regulator of CPT1 expression (30). Unlike PGC-1α, PPARα has been reported to regulate CPT1 expression via a different gene element (40). Our data clearly showed that PE treatment stimulated the expression of PPARα and PGC-1α as well as beta-oxidation-related genes, thereby likely increasing fatty acid breakdown and energy production. Unlike previous reports, the increased PPARα was not associated with increased UCP2 expression. Indeed, UCP2 can be induced by several factors in addition to PPARα activation, including TNFα and ROS. Previous studies have indicated that PPARα activation up-regulates UCP2 expression in hepatocytes by increased transcription involving unknown proteins. However, neither ROS nor TNFα production is the major cause of UCP2 up-regulation induced by PPARα activators (34). Therefore, it is possible that PPARα-mediated up-regulation of UCP2 expression was disrupted by unknown factors. Moreover, the HFD-induced increase in expression of UCP2 was mediated by other factors such as TNFα.
Previous studies have indicated that PU might not be absorbed intact into the blood stream but rather is hydrolyzed to EA over several hours in the intestine (20). However, a previous report has confirmed the direct absorption of PU as well as its presence in plasma (6), which was also confirmed in our study (Supplementary Fig. S1). Therefore, to further determine whether PU is the main active component of liver lipid metabolism, HepG2 cells were used for in vitro analysis. Similar to in vivo results, PE treatment significantly decreased the TG and cholesterol content in HepG2 cells. Interestingly, on measuring the effects of PE compared with equivalent amounts of PU and EA, we found that the effects of PU and PE on lipid metabolism were similar, regardless of insulin stimulation. In contrast, EA elicited no effect, suggesting that PU might be the main active component in PE. Moreover, both PE and PU exhibited excellent protection against palmitate-induced mitochondrial dysfunction and insulin resistance. From this, we inferred that mitochondria were the primary target of PE and that its protection of liver mitochondrial function might not be the consequence of ameliorating inflammation and oxidative stress. Taken together, our study demonstrated that as the major active component of PE, PU is a promising therapeutic nutrient for the treatment of metabolic disorders, particularly NAFLD. Further investigation regarding PE's effects on the absorption and excretion of lipids remains of investigative interest.
Materials and Methods
Chemicals
Anti-PGC-1, anti-SREBP1, anti-Nrf2, anti-NOQ1, anti-HO-1, anti-IRS-1, anti-p-IRS-1, anti-p-Akt, anti-Akt, and anti-UCP2 antibodies were purchased from Santa Cruz Biotechnology; anti-Drp1 and anti-OPA1 antibodies were purchased from BD Biosciences; the Reverse Transcription System kit was purchased from Promega; SYBR green was purchased from Takara; the tissue TG and cholesterol assay kits were purchased from Beyotime; polymerase chain reaction (PCR) primers were synthesized by Baiaoke Biotech; PE containing 40% PU was produced by Tianjin JF-Natural; antibodies against complex I, II, III, IV, V subunits, TRIzol, and other reagents were purchased from Invitrogen.
Animals and experimental design
Specific pathogen-free Sprague–Dawley (SD) male rats were purchased from a commercial breeder (SLAC). The rats were housed in a temperature (22°C–28°C)- and humidity (60%)-controlled animal room and maintained on a 12-h light/12-h dark cycle (light from 08:00 a.m. to 08:00 p.m.) with food and water provided during the experiments. Male rats weighing 180–200 g were used. After 1 week of acclimatization, the rats were randomly distributed into the following four groups: (i) control rats fed a standard chow (Control, 12% kcal fat content); (ii) rats fed an HFD (45% kcal fat content); (iii) rats fed an HFD and administered a daily oral gavage of low-dose PE (50 mg/kg/day); and (iv) rats fed an HFD and administered a daily oral gavage of high-dose PE (150 mg/kg/day). The major fat source was lard and the composition of HFD is listed in Supplementary Data (Supplementary Table S1). In total, 60 rats were used for the experiments. The body weight and food intake were measured twice weekly. After 8 weeks of feeding, the rats were fasted overnight and sacrificed. All of the procedures were performed in accordance with the United States Public Health Services Guide for the Care and Use of Laboratory Animals, and all efforts were made to minimize the suffering and the number of animals used in this study.
Blood sample preparation
After the rats were sacrificed, blood samples were obtained by cardiac puncture, and the serum was separated by centrifugation (3000 rpm, 10 min). The levels of TG, total cholesterol, LDL-C, HDL-C, and ALT were analyzed using an automated biochemistry analyzer (Hitachi Ltd.). Serum levels of CRP, insulin, adiponectin, leptin, TNFα, IL-1, IL-4, IL-6, FFA, IgA, IgG, and IgM were measured using commercial ELISA kits according to the manufacturer's standards and protocols (RD systems).
Histological analysis and measurement of cholesterol and TGs of the liver samples
After the rats were sacrificed, liver tissues were collected and the same liver lobe was divided into five parts for HE staining, protein analysis, mitochondria isolation, RNA isolation, and biochemical analysis. For HE analysis, liver samples were routinely embedded in paraffin, and cut sections were stained with HE. Images were acquired using an Olympus BX71 microscope. Cholesterol and TG measurements were performed using commercial assay kits (Biovison) according to the manufacturer's instructions. Briefly, the assay for TGs was initiated by hydrolysis of the TGs to FFAs and glycerol, which was subsequently measured by a coupled enzymatic system with a colorimetric readout at 570 nm. The assay for total cholesterol was initiated by the hydrolysis of cholesterol esters to free cholesterol, which was then oxidized and reacted with a sensitive cholesterol probe to produce color at 570 nm.
Isolation of liver mitochondria
Mitochondria were isolated as previously described (41). In brief, liver tissues were rinsed with saline, weighed, and placed in ice-cold isolation buffer containing 0.25 M sucrose, 10 mM Tris, and 0.5 mM EDTA, at a pH of 7.4. The tissues were sheared and minced carefully, rinsed to remove residual blood, and then homogenized in 2.5 vol of isolation buffer. The homogenates were increased to 8×initial vol with isolation buffer and centrifuged at 1000 g for 10 min; the supernatant fraction was decanted and saved. The pellet was washed once with 2 vol of isolation buffer, and the total supernatant fractions were combined and centrifuged at 10,000 g for 10 min. The mitochondrial pellet was washed twice using isolation buffer, and the protein concentration was determined using the BCA protein assay kit. Freshly isolated mitochondria were either used immediately for biochemical assays or stored at −80°C.
Evaluation of oxidative stress
Protein carbonyls in total proteins were assayed using the Oxyblot protein oxidation detection kit (Cell Biolabs). Protein carbonyls were labeled with 2,4-dinitrophenylhydrazine and detected by Western blot. The lipid peroxidation product 4-HNE was analyzed with a commercial ELISA kit following the manufacturer's standards and protocols (RD systems). GSH, GSSG, and SOD activity was measured using commercial assay kits (Beyotime) according to the manufacturer's instructions.
Assays for mitochondrial complex activities
NADH-ubiquinone reductase (complex I), succinate-CoQ oxidoreductase (complex II), and cytochrome C oxidase (complex IV) activities were measured spectrophotometrically using conventional assays as previously described (41, 51).
Western blot analyses
Samples were lysed with Western and IP lysis buffer (Beyotime). The lysates were homogenized, and the homogenates were centrifuged at 13,000 g for 15 min at 4°C. The supernatants were collected, and the protein concentrations were determined with a BCA protein assay kit. Equal aliquots (20 μg) of the protein samples were separated by 10% SDS-PAGE gels, transferred to pure nitrocellulose membranes (PerkinElmer Life Sciences), and blocked with 5% nonfat milk in TBST buffer. The membranes were incubated with anti-PGC-1, anti-SREBP1, anti-p-IRS-1, anti-IRS-1, anti-p-Akt, and anti-Akt (1:1000); anti-Complex I, II, III, IV, or V; or anti-β-actin (1:10,000) at 4°C overnight. Then, the membranes were incubated with anti-rabbit or anti-mouse antibodies at room temperature for 1 h. Chemiluminescent detection was performed using an ECL Western blotting detection kit.
Real-time PCR
Total RNA was extracted from 30 mg of tissue using TRIzol reagent (Invitrogen) according to the manufacturer's protocol. The OD260/OD280 ratio was measured to control for the quality of the RNA. For each sample, 2 μg of RNA was reverse transcribed into cDNA. Quantitative PCR was performed using a real-time PCR system (Eppendorf). The reactions were performed using SYBR Green Master Mix (TaKaRa) with gene-specific primers (Supplementary Table S2).
HepG2 cell culture
HepG2 cells were grown in Dulbecco's modified Eagle's medium that was supplemented with 25 mM glucose, 10% fetal calf serum, 100 U/ml penicillin G sodium, and 100 μg/ml streptomycin sulfate, in 10 cm2 plates at 37°C in 5% CO2. The experiments were initiated once the cells reached 70% confluence. The cells were treated with PE, PU, and EA at the indicated doses for 24 h with or without insulin stimulation. Then, the cellular TG and cholesterol levels were analyzed using a commercial kit (Beyotime).
Liver tissue and HepG2 cells ATP measurement
ATP was measured in samples from fresh liver tissue or treated HepG2 cells with an ATP bioluminescent assay kit (Sigma), as previously described (30). Briefly, tissue or HepG2 cells were lysed with 0.5% Triton X-100 in 100 mM glycine buffer, pH 7.4. Supernatants were collected after centrifugation at 14,000 g for 10 min at 4°C. Forty-microliter samples were then transferred to an appropriate bioluminescence plate. Luciferase activity was measured after the addition of 160 μl reaction solution, when ATP is consumed and light is emitted as firefly luciferase that catalyzes the oxidation of D-luciferin.
JC-1 assay for MMP
MMP was measured in live HepG2 cells using the lipophilic cationic probe 5,5′,6,6′-tetrachloro-1,1′,3,3′-tetraethyl- benzimidazolyl-carbocyanine iodide (JC-1). After treatment, cells were washed with PBS once after JC-1 staining and scanned with a microplate fluorometer (Fluoroskan Ascent; Thermo Fisher Scientific, Inc.) at 488 nm excitation, and 535 and 590 nm emission, to measure green and red JC-1 fluorescence, respectively. Each well was scanned by measuring the intensity of each of 25 squares (of 1 mm2 area) arranged in a 5×5 rectangular array.
Determination of ROS generation
The generation of intracellular ROS was determined by the fluorescence of 2′, 7′-dichlorofluorescein (DCFH2-DA) (31). Briefly, DCFH2-DA at a final concentration of 10 μM was incubated with live cells in serum-free medium for 30 min, and cells were washed twice with cold PBS buffer. After incubation, cells were lysed with lysis buffer (10 mM Tris, 150 mM NaCl, 0.1 mM EDTA, 0.5% Triton X-100, and pH7.5) and centrifuged at 13,000 g for 5 min at 4°C. The supernatant was collected, and fluorescence intensity was measured using a microplate fluorometer (Fluoroskan Ascent; Thermo Fisher Scientific, Inc.) at wavelengths of 488 nm (excitation) and 535 nm (emission). Cellular oxidant levels were expressed as the relative DCF fluorescence per microgram of protein (BCA method).
Statistical analysis
Normal distribution was assessed by the Shapiro–Wilk test (SPSS, Inc.). All of the data are reported as the means±SEM. Statistical analysis was performed using one-way analysis of variance followed by a least significant difference (LSD) post hoc analysis. In all of the comparisons, the level of significance was defined as p<0.05.
Footnotes
Acknowledgments
The authors are supported by the National Natural Science Foundation of China (81201023, 31370844), the 973 program for young scientists (No. 2014CB548200), Tianjin Applied Basic and Frontier Tech Major Project (12JCZDJC34400) and Tianjin higher Education Sci-tech Development Project (20112D05), a UC Davis Center for Human and Nutrition Pilot Award (CHNR08-318), National “Twelfth Five-Year” Plan for Science & Technology Support (2012BAH30F03), the Fundamental Research Funds for the Central Universities, 985 and 211 projects of Xi'an Jiaotong University, and Nestle Research Center, Switzerland. The authors thank Edward Sharman at the University of California at Irvine for a critical reading and language editing of this article.
Author Disclosure Statement
No competing financial interests exist.
Abbreviations Used
References
Supplementary Material
Please find the following supplemental material available below.
For Open Access articles published under a Creative Commons License, all supplemental material carries the same license as the article it is associated with.
For non-Open Access articles published, all supplemental material carries a non-exclusive license, and permission requests for re-use of supplemental material or any part of supplemental material shall be sent directly to the copyright owner as specified in the copyright notice associated with the article.