
Abstract
Introduction
S
The acute cardioprotective effects of statins are well-known yet appear to be independent of cholesterol levels. Several studies have implicated phophoinositide 3-kinase (PI3K), protein kinase B (Akt), and endothelial nitric oxide synthase (eNOS) upregulation in the mechanism of cardioprotection [reviewed in Ludman et al. (30)], which is consistent with the notion that signaling through Akt and mammalian target of rapamycin (mTOR) is generally regarded as a prosurvival pathway. In contrast, others have reported that acute statin administration upregulates phosphatase and tensin homolog (PTEN), which would antagonize the Akt/mTOR signaling pathway (11, 54). PTEN does so by dephosphorylating phosphatidylinositol (3,4,5)-triphosphate (PIP3), effectively blunting Akt activation. Therefore, it seems likely that statin-mediated cardioprotection may have distinct mechanisms of action involving either the upregulation or downregulation of this pathway.
Cardioprotection by statins has been demonstrated in cardiomyocytes, isolated rat hearts, as well as in in vivo models, such as rodents, dogs, and swine (30). Furthermore, administration of statins are effective within days to hours before ischemia/reperfusion (I/R), as well as acute (intravenous [i.v.] injection) administration immediately before ischemia or at the onset of reperfusion (30). Interestingly, the acute use of statins before ischemic insult has been shown to provide cardioprotection without altering serum cholesterol levels, highlighting the non-lipid lowering cardioprotective potential of statins (28, 47). Statins have been reported to decrease superoxide production, in part through downregulation of nicotinamide adenine dinucleotide phosphate oxidase activity (8). Statins also are reported to improve mitochondrial function (26, 51), although they have deleterious effects in skeletal muscle (19, 27, 35, 36).
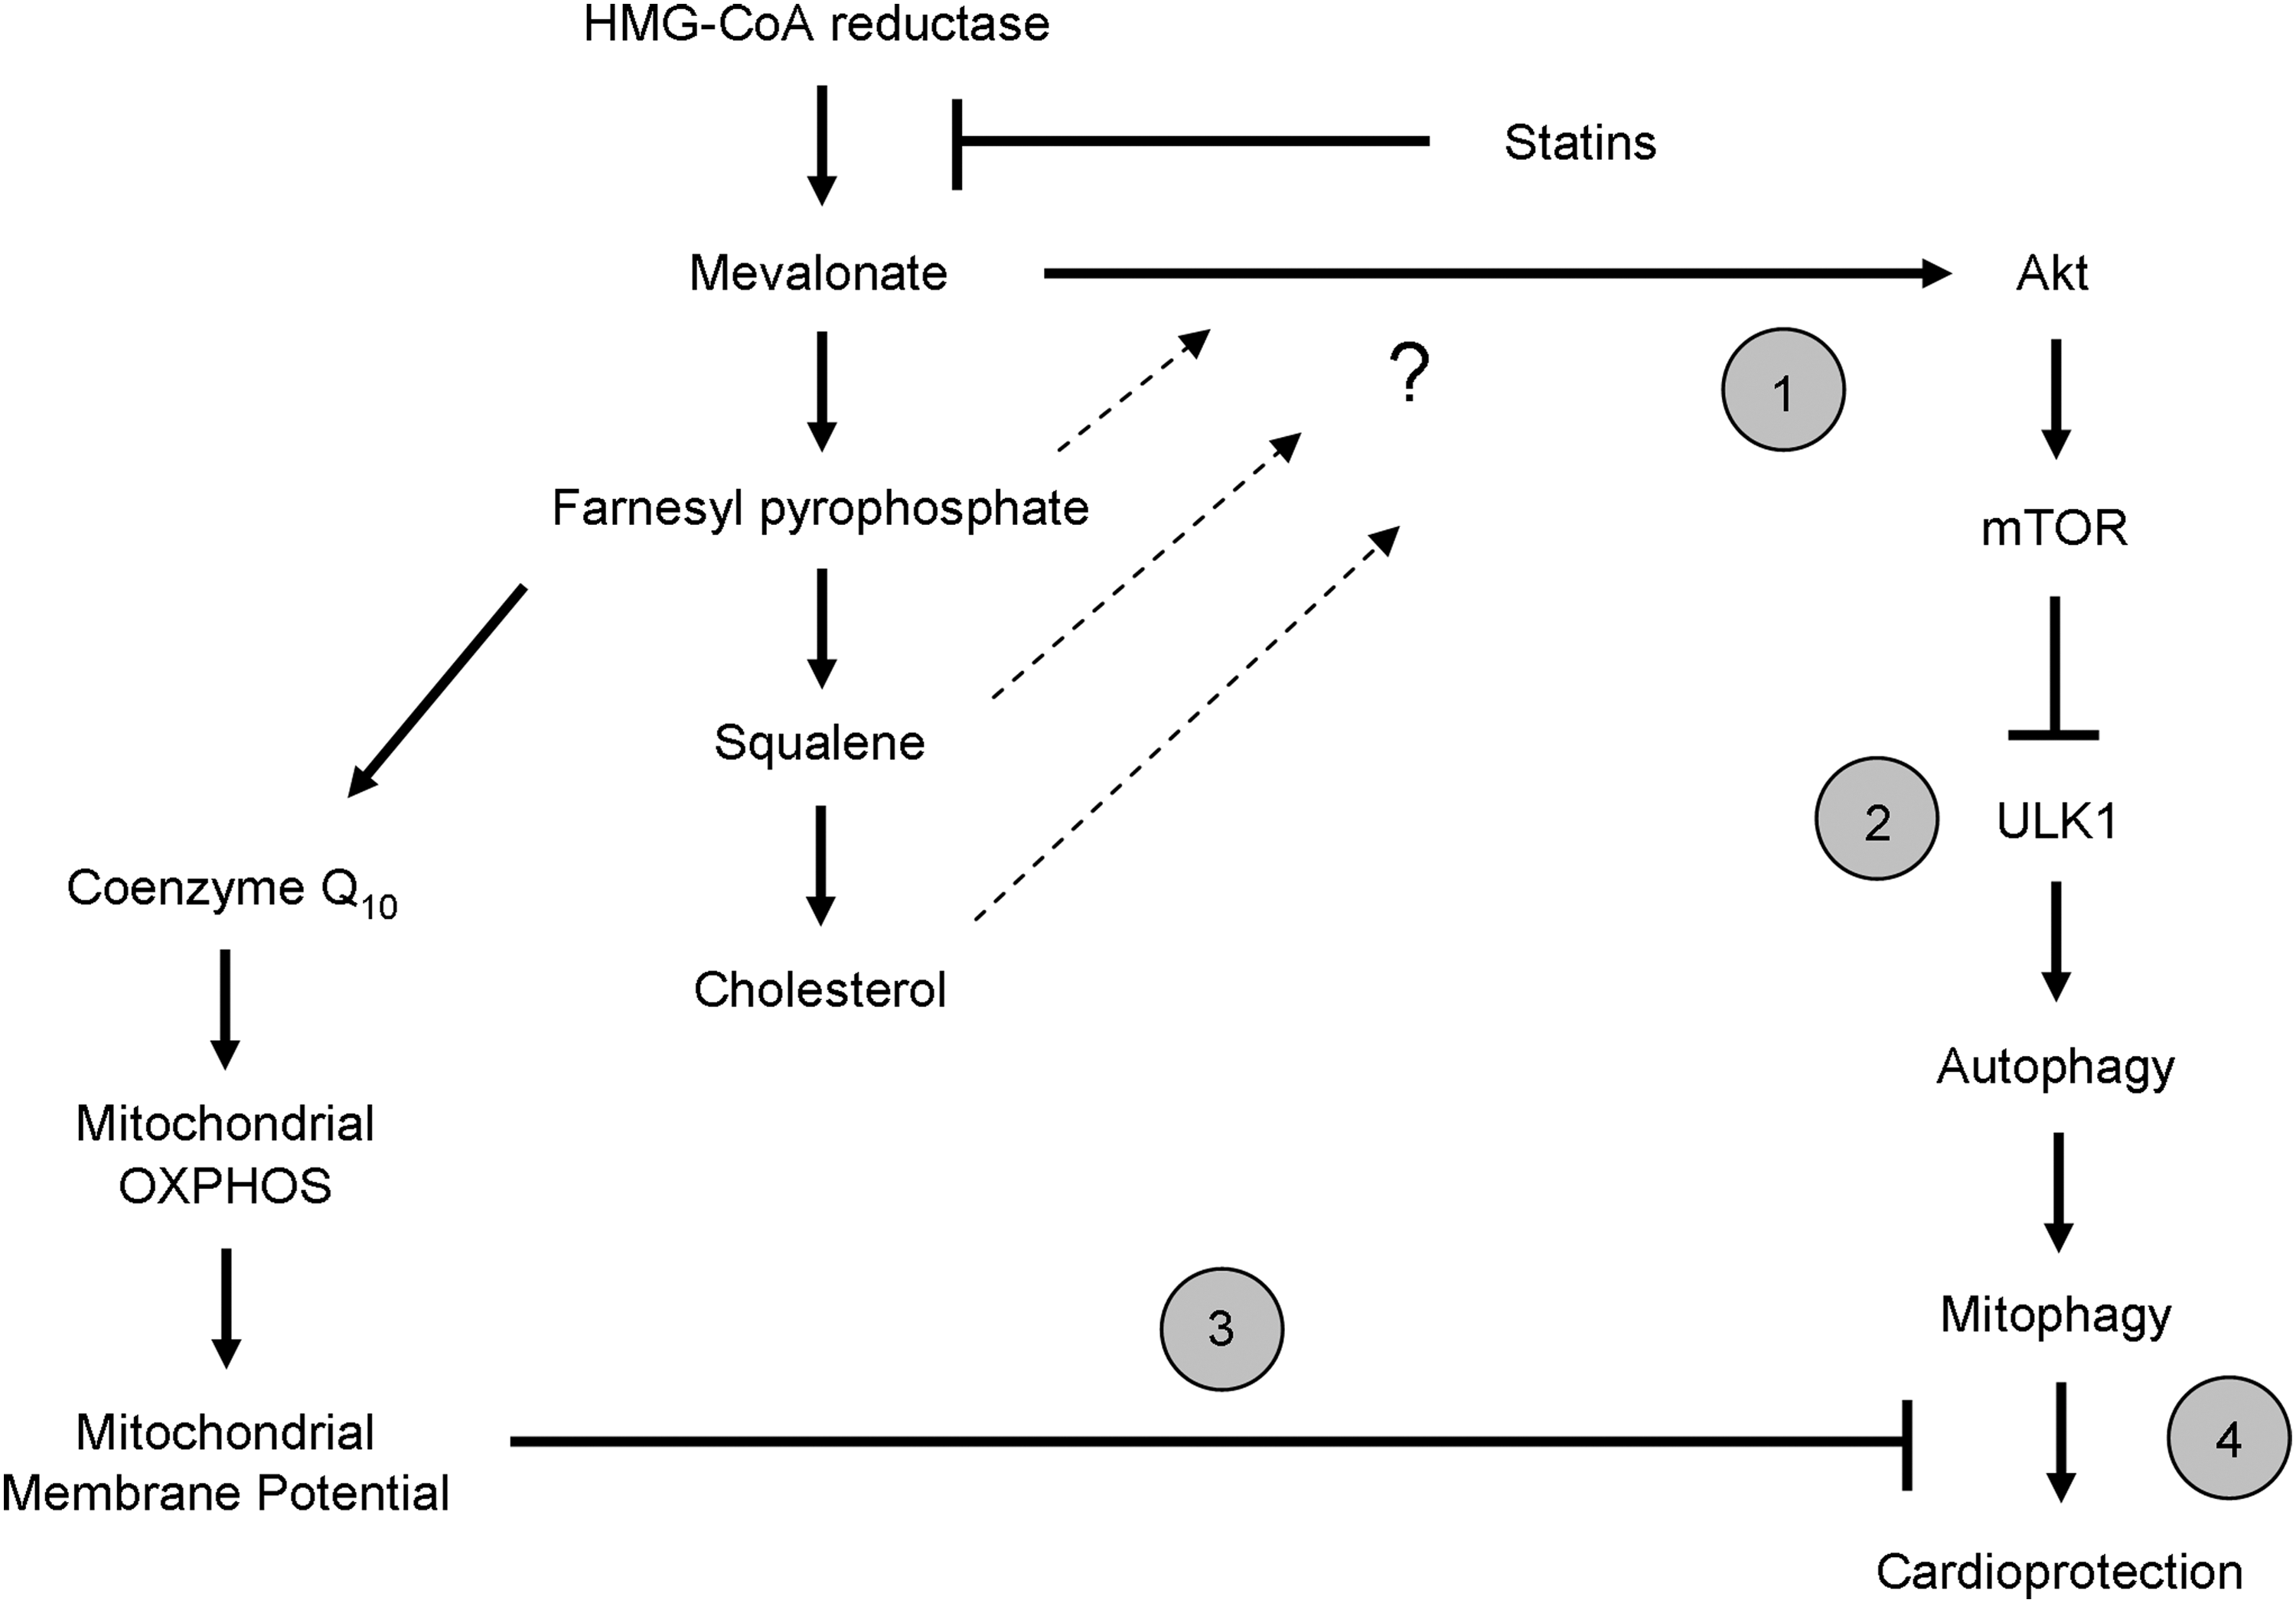
3-hydroxy-3-methylglutaryl coenzyme A reductase inhibitors improve outcome in patients hospitalized for acute myocardial infarction who are started immediately on statin therapy, independent of cholesterol levels. This study reveals a novel role for mitophagy in statin cardioprotection against ischemic injury. Statins trigger mitophagy mediated by the ubiquitin ligase Parkin and adapter protein p62/SQSTM1. Furthermore, statin-mediated CoQ depletion causes mitochondrial depolarization, triggering mitophagy, and limiting reactive oxygen species production. Infarct size reduction by acute statin administration in mice is abolished by coadministration of CoQ. The findings raise the question whether CoQ supplements might interfere with the cardioprotective benefits of statins mediated through mitophagy.
Our laboratory and others have demonstrated a role for autophagy in cardioprotection against I/R injury [reviewed in Gottlieb and Mentzer (13)]. Autophagy is a cellular housekeeping function responsible for the bulk degradation of large protein aggregates or damaged organelles. More recently, we reported that Parkin-dependent mitophagy is essential for cardioprotection by ischemic preconditioning (18). Several groups have shown that statins promote autophagy (1, 41, 59). However, the relationship between statin-induced cardioprotection and autophagy (and more interestingly, mitophagy) has not been established. Our previous findings led us to advance the novel hypothesis that statins mediate cardioprotection by stimulating mitophagy and remodeling the existing mitochondrial population in the heart. In this study, we aimed to elucidate the mechanisms governing statin-mediated cardioprotection, and to clarify the role of autophagy/mitophagy in this process.
Results
Simvastatin induces autophagy in HL-1 cells and hearts
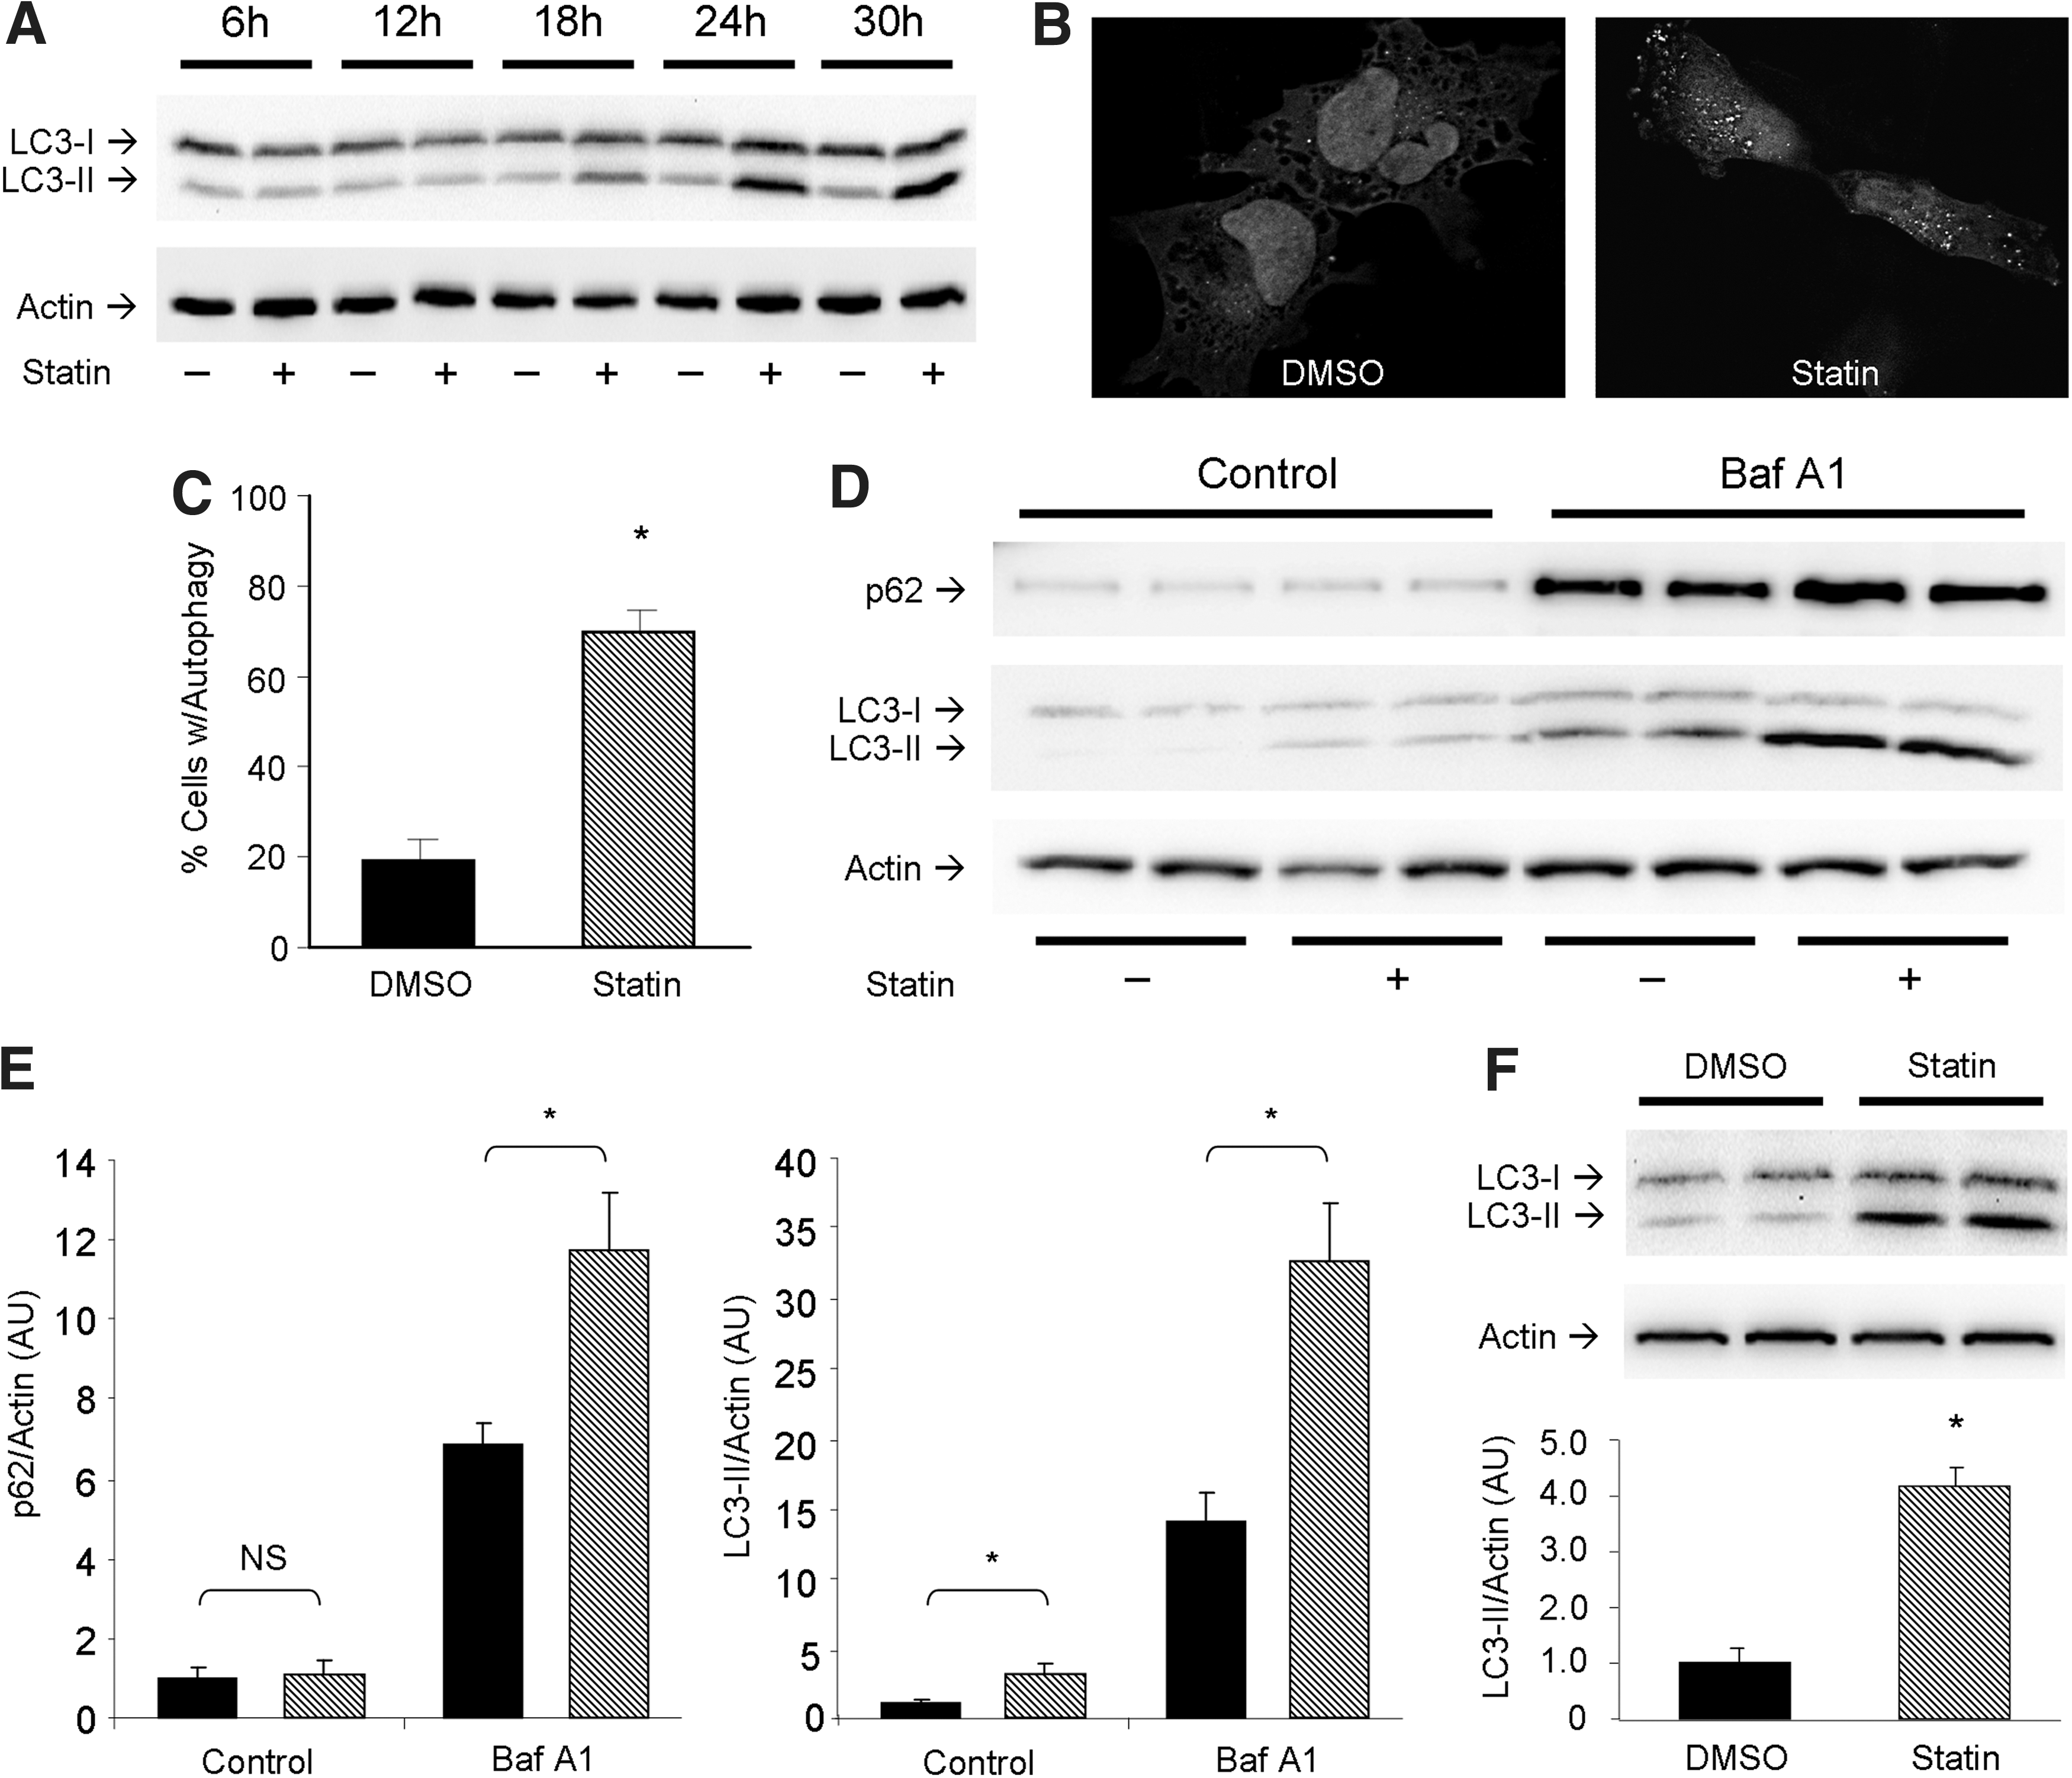
The ability of statins to induce autophagy has been demonstrated in several cell lines (1, 41, 59), but not in the context of cardiac in vitro and in vivo models. To test whether simvastatin induces autophagy in cardiac cells, we performed a time course experiment on HL-1 cardiomyocytes treated with 1 μM simvastatin from 6 to 30 h and assessed lipidation of microtubule-associated light chain 3 (LC3) via western blot (Fig. 1A). Further studies in vitro were examined after 24 h of statin treatment when LC3 conversion appeared to plateau. Cells expressing adenoviral-delivered LC3-green fluorescent protein (GFP) displayed increased autophagic puncta formation upon statin treatment compared to controls (Fig. 1B, C). To determine if statins increased autophagic flux, we used bafilomycin A1 to prevent lysosomal acidification and autophagosome/lysosome fusion, then examined levels of p62/sequestosome 1 (SQSTM1) and LC3-II. Statin-treated cells exhibited higher levels of p62/SQSTM1 and LC3-II than controls, an effect which was further increased by lysosomal blockade, indicating that statin treatment increased autophagic flux (Fig. 1D, E). To determine the effect of statins on autophagy in the heart, C57BL/6J mice received 20 mg/kg simvastatin (intraperitoneal [i.p.] injection) and hearts were harvested 4 h later. Western blot analysis for LC3-II showed that simvastatin potently upregulated autophagy in the heart (Fig. 1F). Simvastatin (20 mg/kg 4 h before harvest) reliably induced cardiac autophagy (Supplementary Fig. S1A; Supplementary Data are available online at
HMG-CoA reductase inhibition attenuates Akt/mTOR signaling and induces autophagy
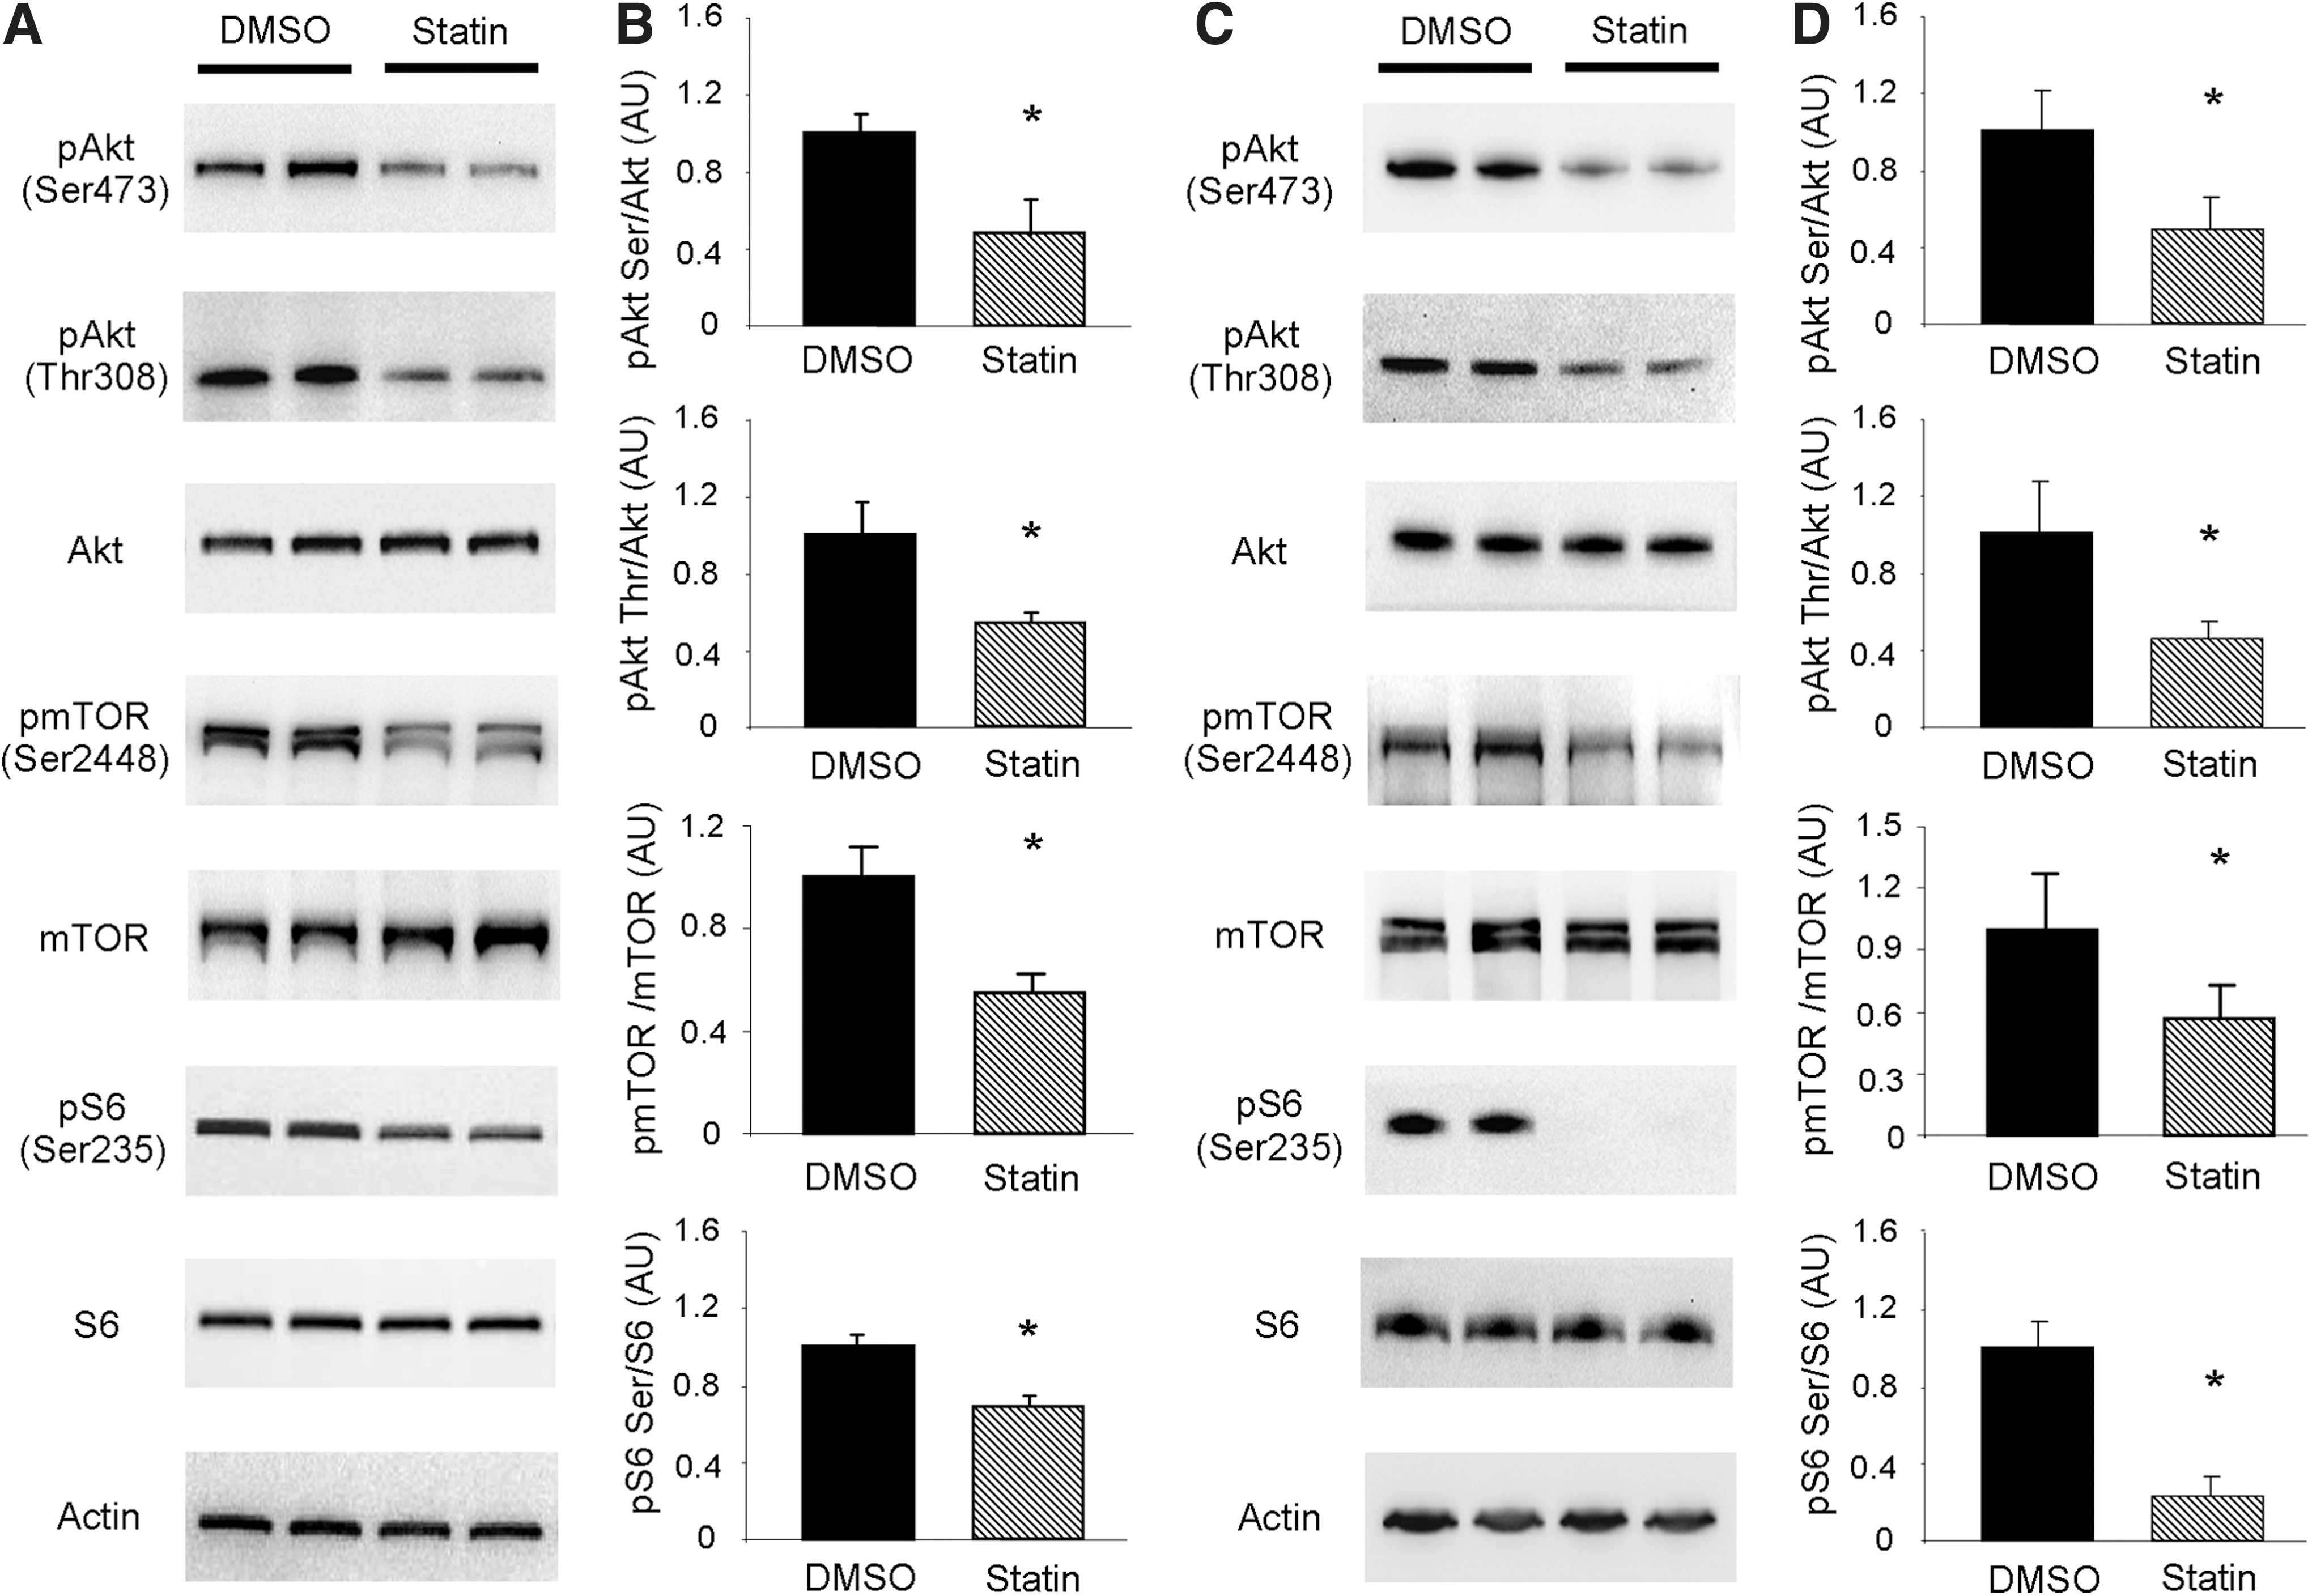
Given the significance of the Akt/mTOR signaling pathway in repressing autophagy, we sought to investigate if simvastatin attenuated mTOR signaling to allow upregulation of autophagy (Fig. 2A, B). To examine this possibility in vitro, we first examined the phosphorylation state of Akt in HL-1 cells. Simvastatin treatment resulted in diminished Akt phosphorylation at Ser473 and Thr308, indicative of decreased activity, which would be expected to attenuate downstream signaling by mTOR (15). Acute insulin stimulation of statin-treated cells revealed that the ability to phosphorylate Akt remained intact (Supplementary Fig. S2). We next investigated the phosphorylation of mTOR at Ser2448, which is targeted by Akt (38). Consistent with diminished Akt activation we observed decreased phosphorylation of mTOR at Ser2448 after simvastatin treatment. Finally, we examined the phosphorylation of ribosomal subunit protein S6 (S6) at Ser235/236, which is a downstream target of mTOR. In line with decreased mTOR activation, S6 phosphorylation at Ser235/236 was diminished in statin-treated cells. Similar results were obtained in the hearts of mice treated with simvastatin (Fig. 2C, D).
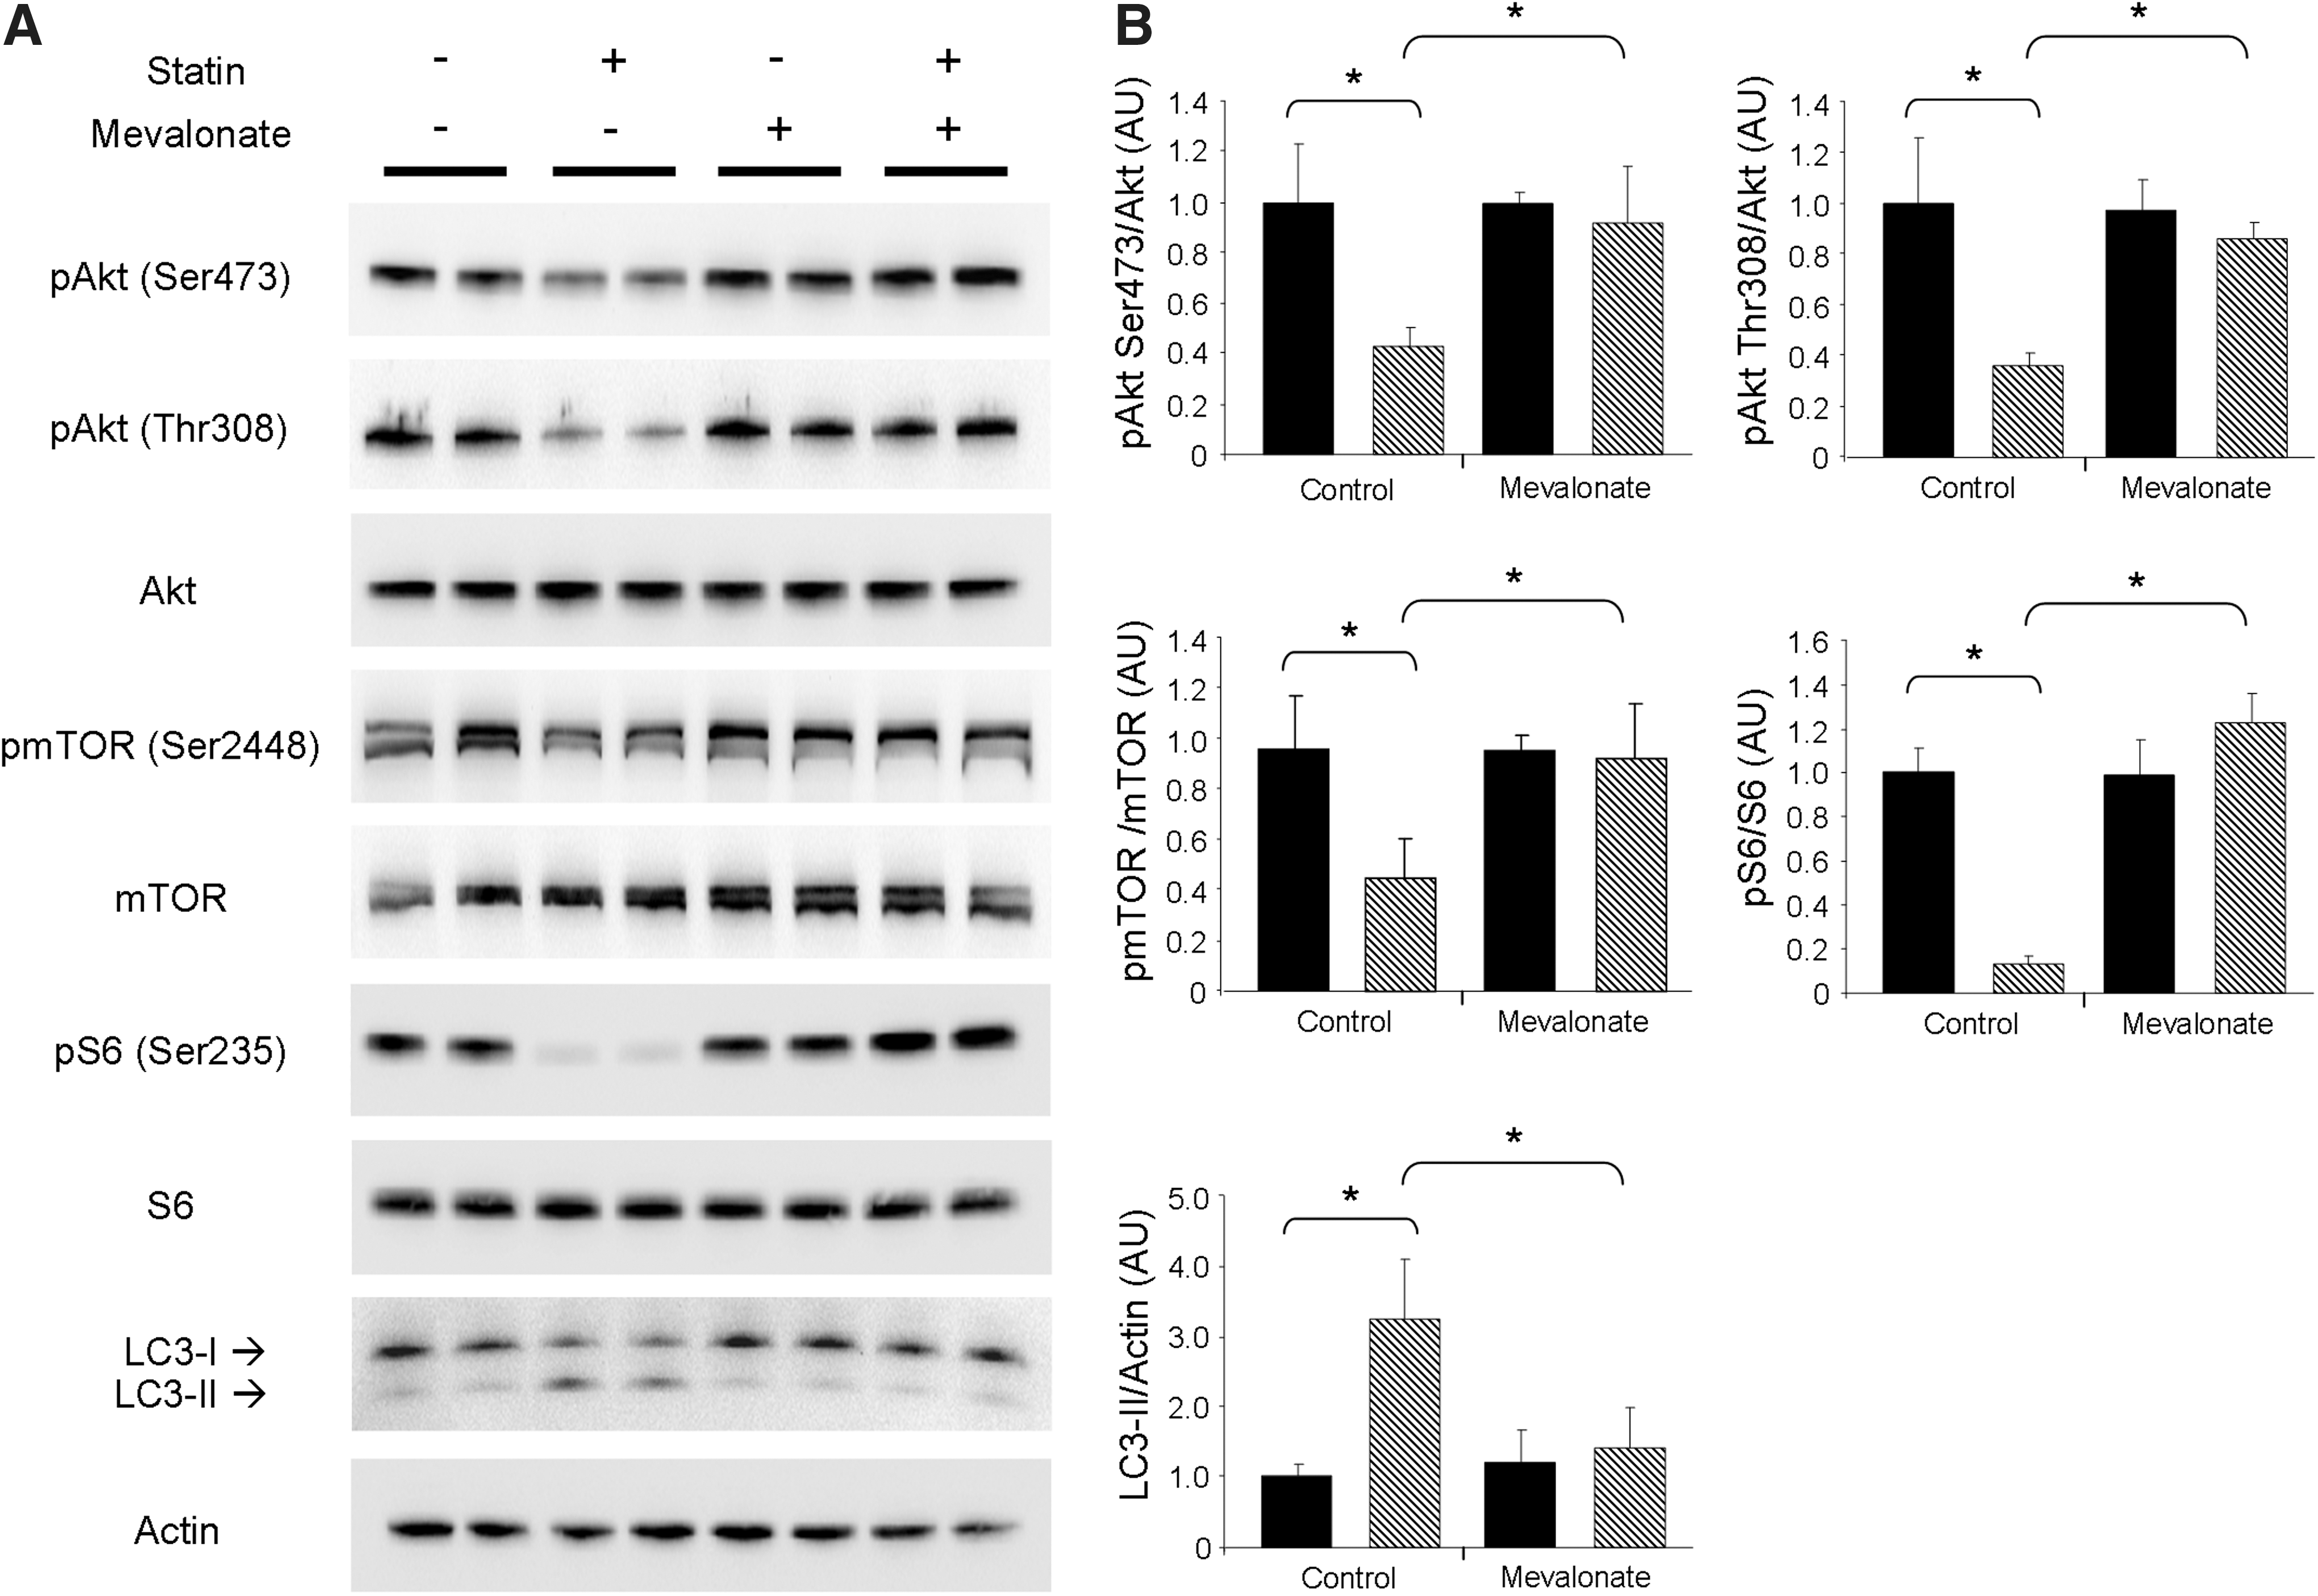
To confirm that the effects on Akt/mTOR cell signaling were due to the inhibition of HMG-CoA reductase rather than off-target effects, we supplemented HL-1 cells with 100 μM mevalonic acid, the product of HMG-CoA reductase, concurrently with simvastatin treatment. Supplementation with mevalonic acid prevented statin-mediated attenuation of Akt/mTOR signaling and blocked the induction of autophagy (Fig. 3A, B). These findings demonstrate that upregulation of autophagy by statins is specific to HMG-CoA reductase inhibition.
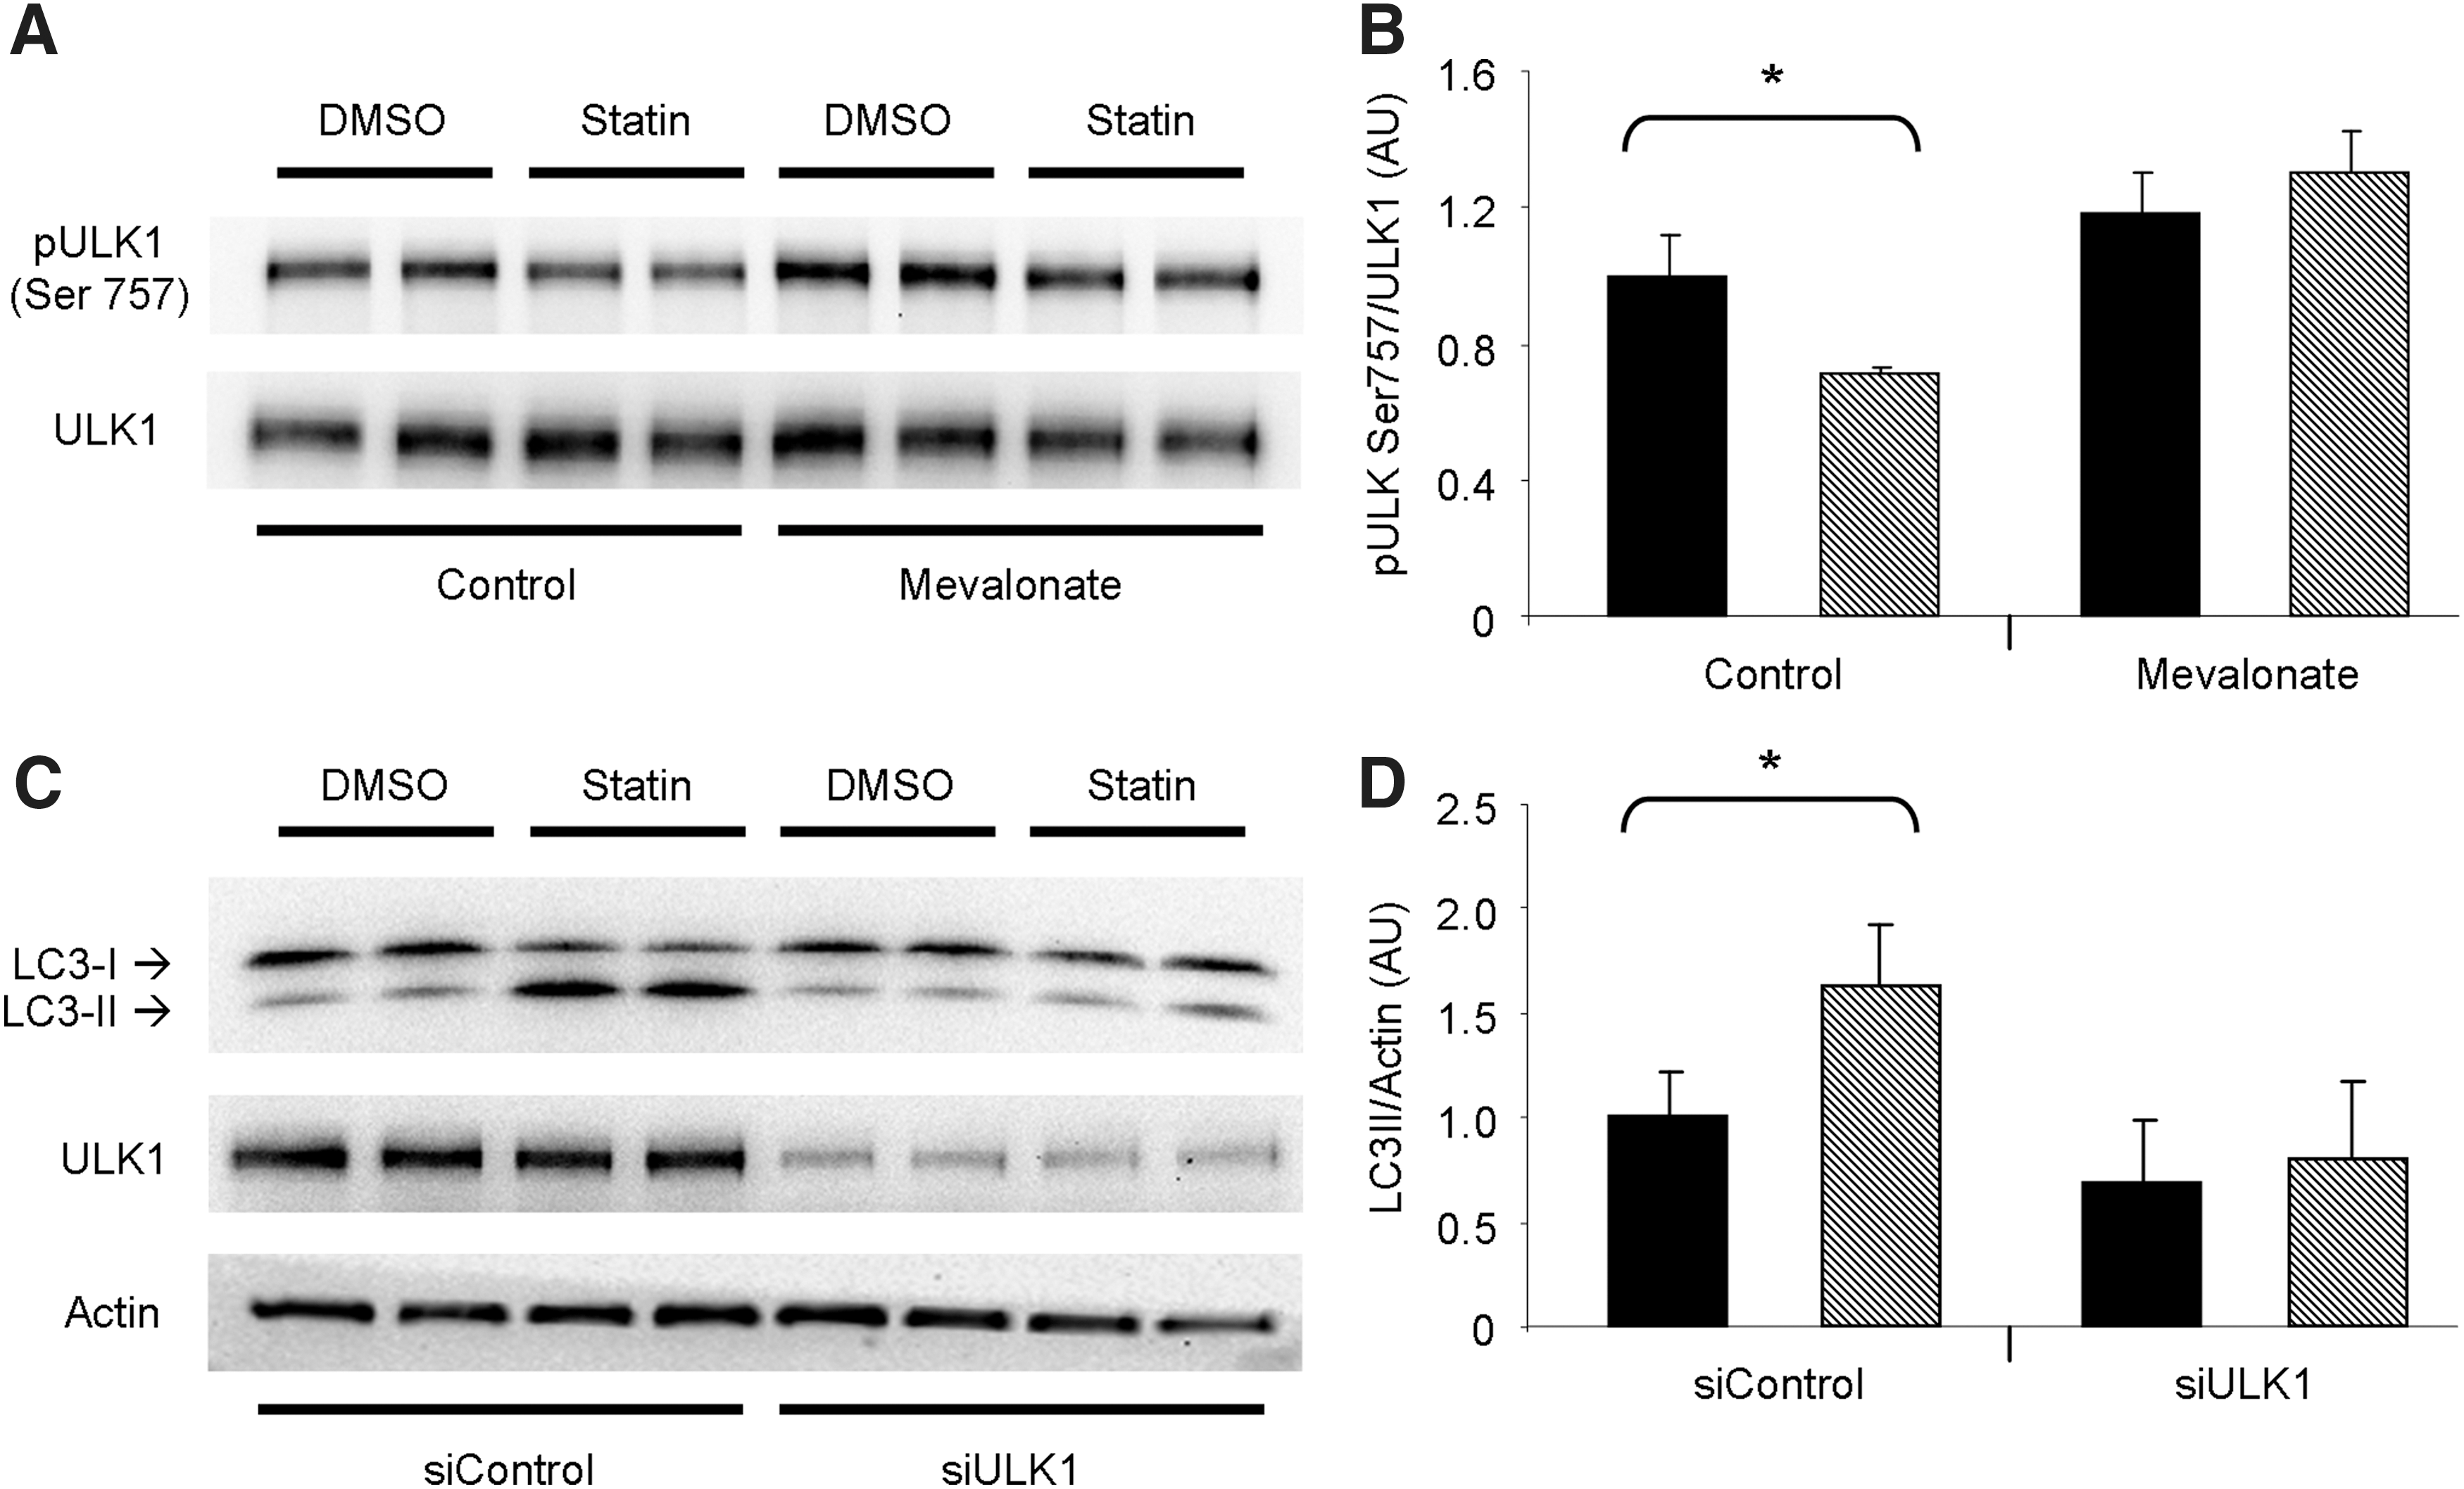
The initiation of autophagy is controlled by unc-51-like kinase 1 (ULK1), a proximal kinase critical for nucleation of the autophagosome. mTOR inhibits ULK1 activation through phosphorylation of its Ser757 amino acid site (22). We found that ULK1 was less phosphorylated at Ser757 in statin-treated HL-1 cells, consistent with the repressed Akt/mTOR signaling we observed. Furthermore, ULK1 phosphorylation was restored upon coadministration of mevalonic acid (Fig. 4A, B). To establish the requirement for ULK1 in statin-induced autophagy, we silenced ULK1 by ribonucleic acid interference (RNAi) before statin treatment. Silencing of ULK1 prevented statin-mediated upregulation of autophagy, indicating that ULK1 is critical to this process (Fig. 4C, D). These findings combined suggest that statin treatment promotes macroautophagy by alleviating the inhibitory effect of Akt/mTOR signaling on ULK1.
Statin-mediated mitophagy is blocked by coenzyme Q10
We previously reported that autophagy is essential for cardioprotection and that ischemic preconditioning involves Parkin-dependent mitophagy (18). Since statins also induce cardiac autophagy, we hypothesized that statins may confer cardioprotection through induction of mitophagy. Targeting the autophagosomal machinery to the mitochondria requires the loss of mitochondrial membrane potential leading to recruitment of Parkin and autophagy adaptors, such as p62/SQSTM1 (24).
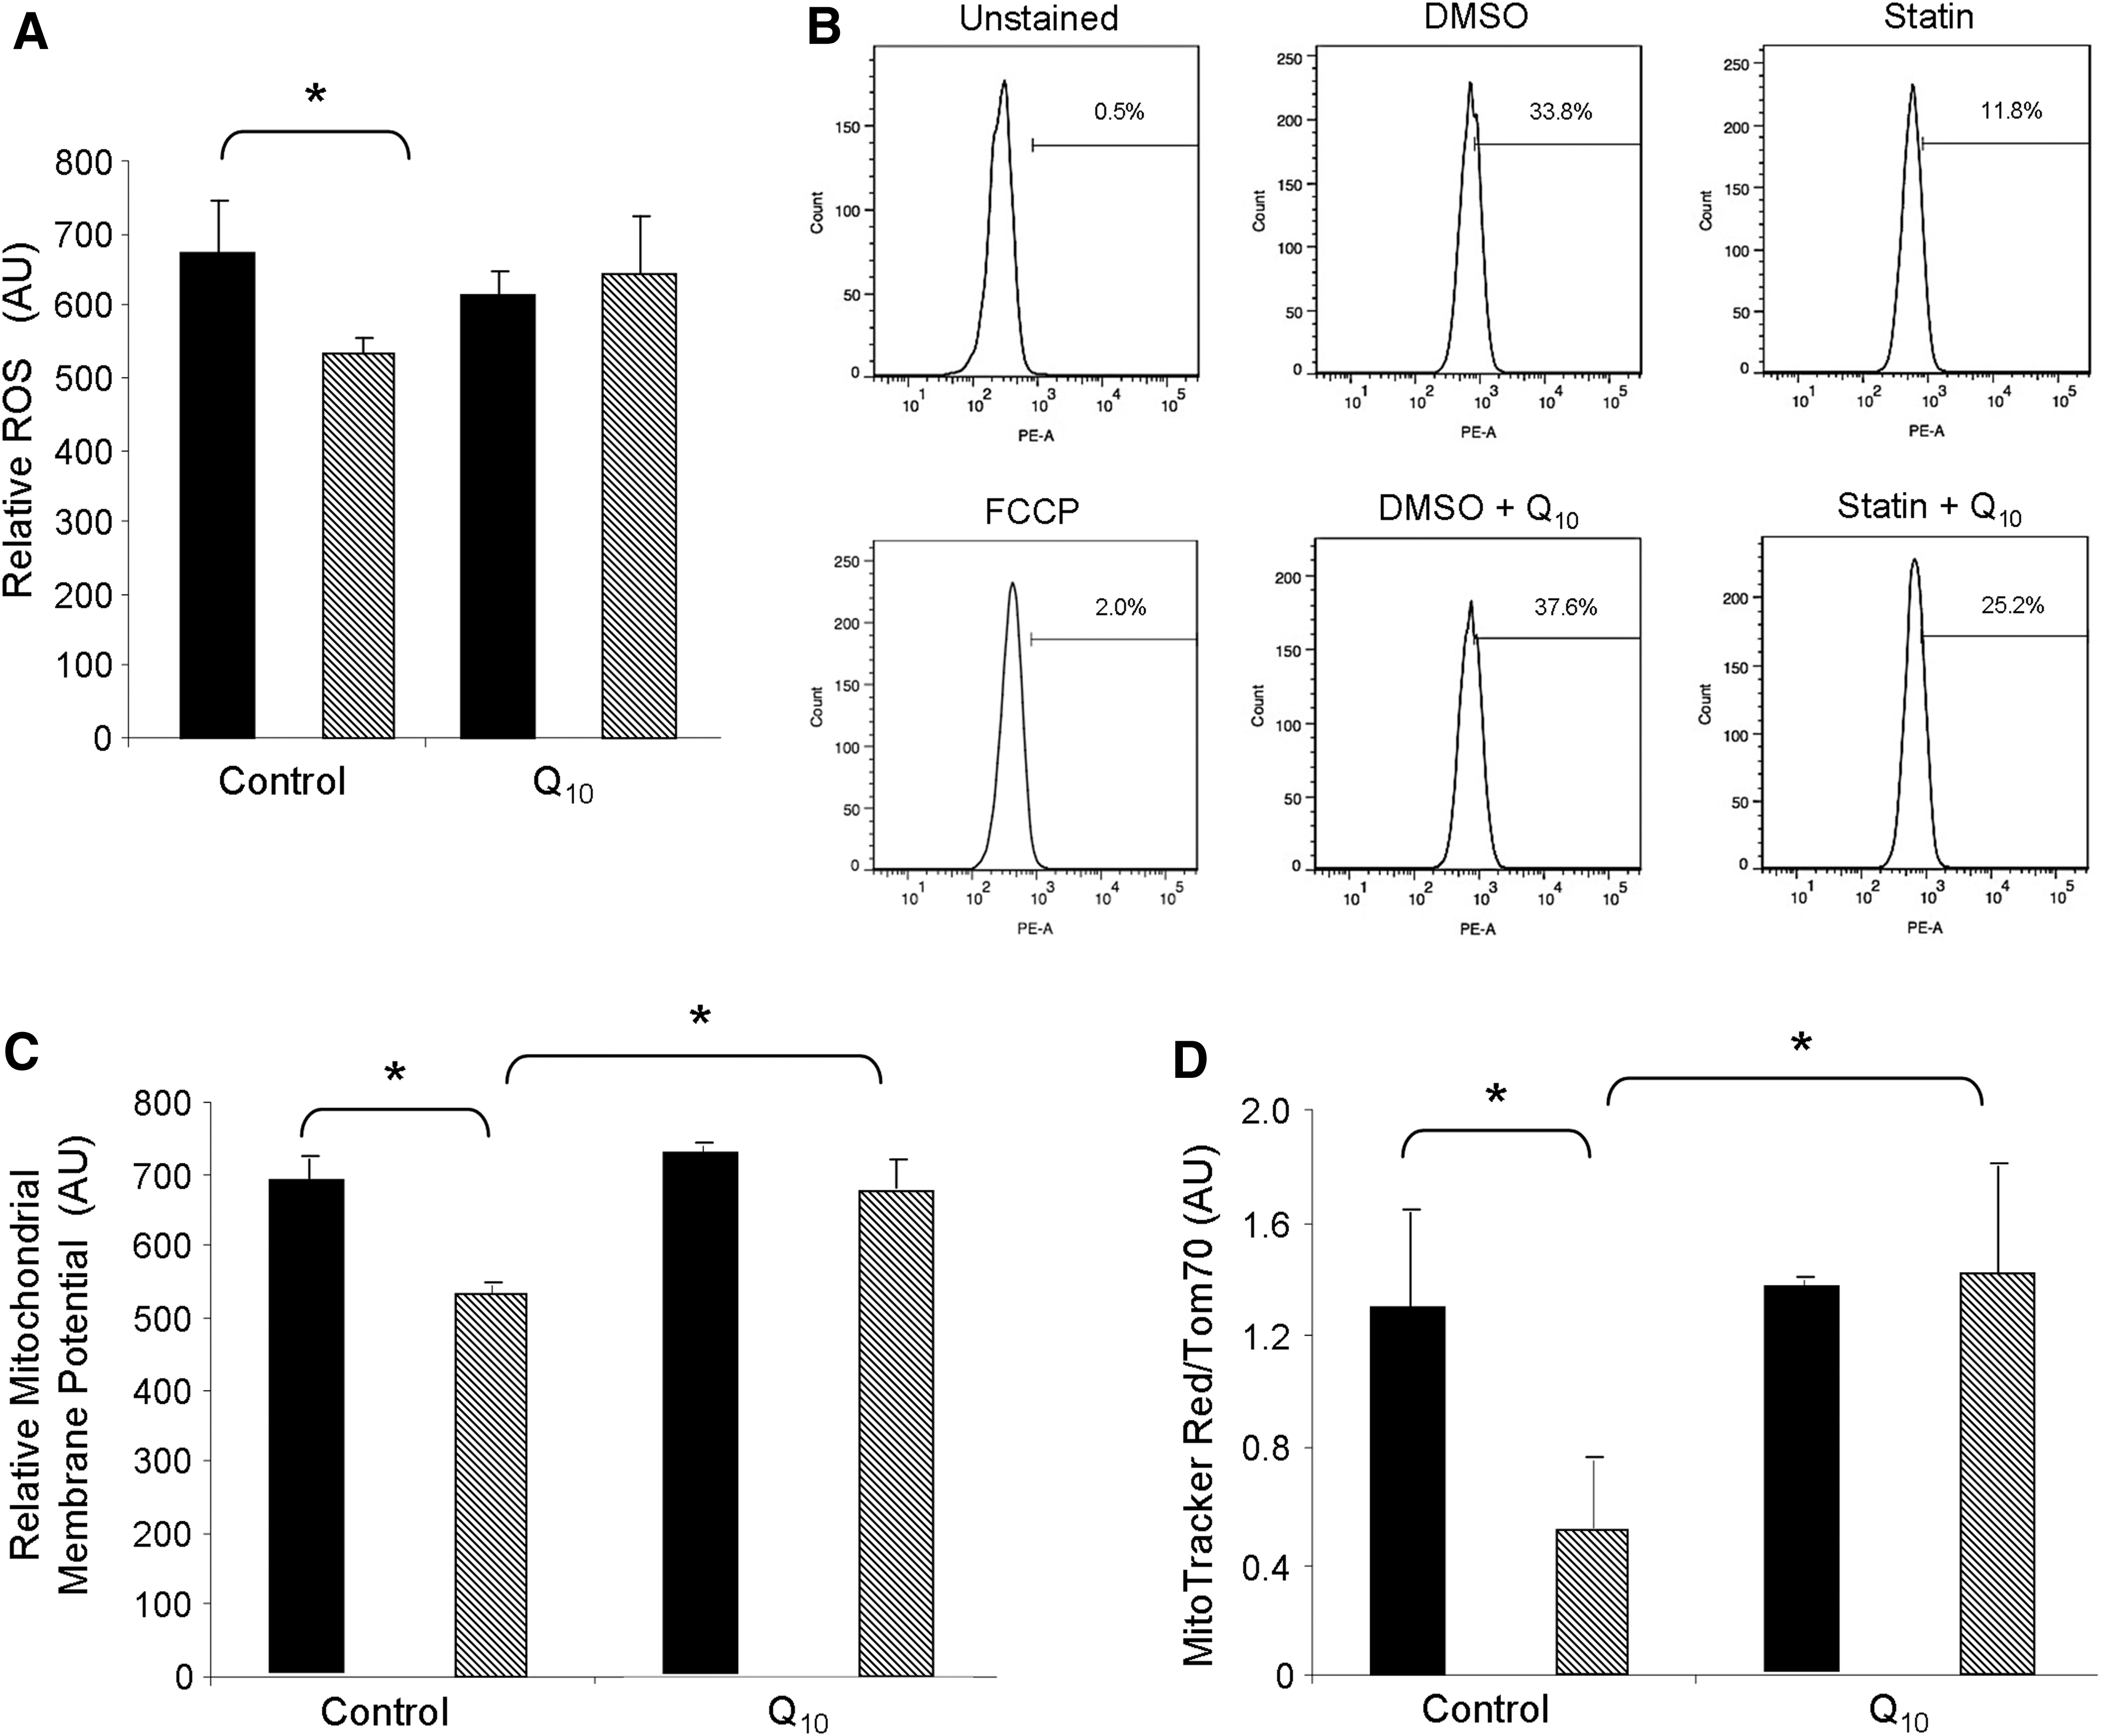
We hypothesized that statins promoted mitophagy through depletion of ubiquinone (aka CoQ or coenzyme Q10) which, like cholesterol, is synthesized from mevalonate (Fig. 8). Depletion of myocardial CoQ by simvastatin has been previously documented (21, 48). CoQ is a lipid component of the electron transport system that is required for transferring electrons from Complex I to Complex III, and thus, facilitates efficient mitochondrial oxidative phosphorylation essential for maintaining mitochondrial membrane potential (29). Loss of CoQ might lead to increased superoxide production from Complex I, yet some studies have reported decreased reactive oxygen species (ROS) production in statin-treated cells. We assessed the effect of simvastatin on ROS production in HL-1 cells using the H2O2-responsive fluorophore 2′,7′-dichlorodihydrofluorescein diacetate (H2DCFDA) (Fig. 5A). Surprisingly, simvastatin administration decreased ROS production in these cells, an effect that was reversed by coadministration of CoQ. One plausible explanation for decreased ROS production is mitochondrial uncoupling. To determine if statins lowered mitochondrial membrane potential, we loaded statin-treated cells with mitochondrial membrane potential-sensitive MitoTracker Red CMX Rosamine. Fluorescence-activated cell sorting (FACS) analysis revealed that statin administration decreased the average mitochondrial membrane potential of the entire cell population. Our findings are consistent with others who have also shown that statins diminish mitochondrial membrane potential (4, 20). Interestingly, statin-mediated reduction of mitochondrial membrane potential was attenuated by the concurrent addition of CoQ to the media during treatments (Fig. 5B, C). To determine whether reduced fluorescence intensity of cells stained with MitoTracker Red CMX Rosamine was due to mitochondrial depolarization or loss of mitochondrial mass, we performed ratiometric analysis of mitochondria membrane potential-sensitive MitoTracker Red relative to the mitochondrial marker translocase outer membrane 70 kDa subunit (Tom70), using fluorescence microscopy. Ratiometric imaging demonstrated that simvastatin induces mitochondrial depolarization even after normalizing to mitochondrial mass. Importantly, statin-mediated mitochondrial depolarization was blocked by CoQ supplementation (Fig. 5D and Supplementary Fig. S3), suggesting that statins may drive depolarization through depletion of mevalonate and eventually CoQ.
Parkin is a unique E3 ubiquitin ligase that has been shown to be crucial for targeting mitochondria for mitophagy (37). For mitophagy to occur, Parkin translocates to the mitochondria and labels target proteins with ubiquitin, leading to the specific degradation of mitochondria through autophagy (37). We monitored the subcellular redistribution of Parkin to the mitochondria to determine if statin-mediated cardioprotection involved mitophagy. We found that statin treatment of HL-1 cardiomyocytes resulted in translocation of Parkin to the mitochondria (Fig. 6A, B). p62/SQSTM1 is an adapter protein that is recruited to ubiquitin-labeled mitochondria (via Parkin), and promotes mitophagy by recruiting LC3 via its LC3 binding domain, thereby bringing the autophagy machinery to the ubiquitin-tagged mitochondrion (10). Immunostaining revealed that p62/SQSTM1 exhibited the same pattern of translocation as Parkin (Supplementary Fig. S4A, B). These results demonstrate that statin-mediated mitochondrial depolarization triggers translocation of Parkin and p62/SQSTM1 to the mitochondria.
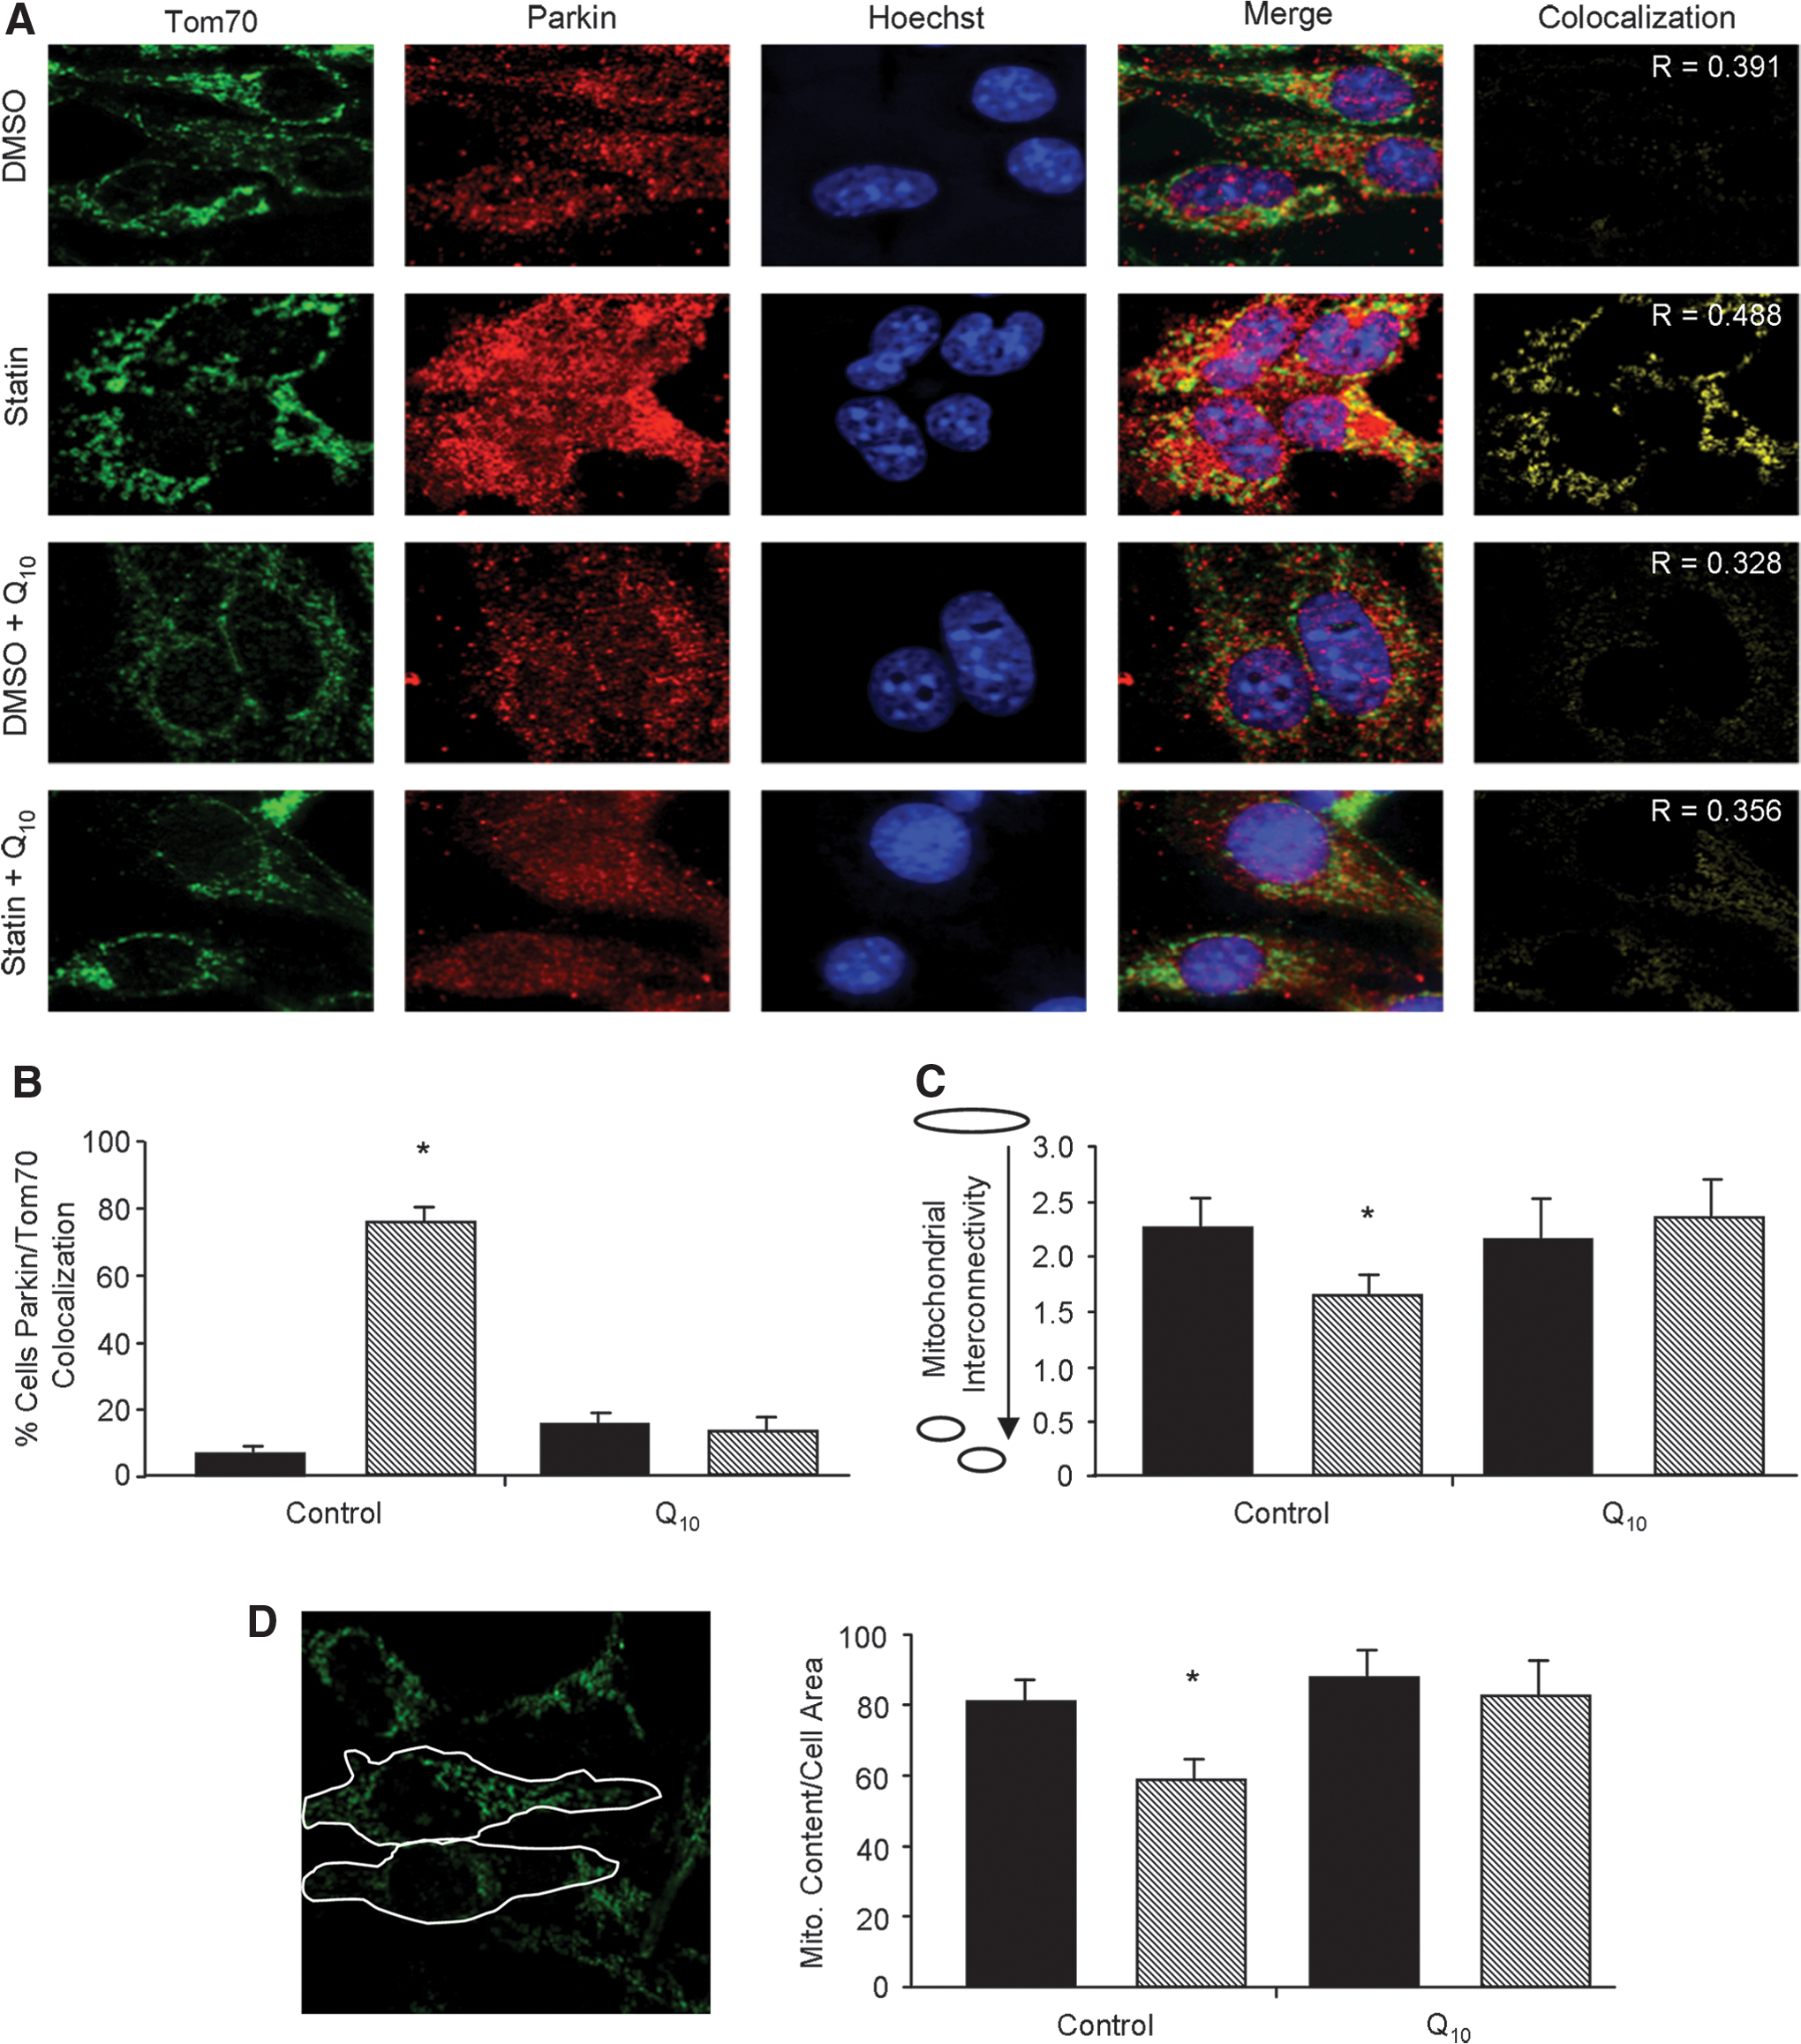
Mitochondrial fragmentation precedes engulfment by the autophagosome to complete mitophagy. Parkin translocation to the mitochondria results in ubiquitination of mitochondrial target proteins, such as mitofusins, leading to increased fragmentation of the mitochondria (52). To examine the effects of statins on mitochondrial morphology, we measured mitochondrial interconnectivity as described by Dagda et al. (6). We found that statin treatment resulted in fragmentation of the mitochondria, which was prevented by supplementation with CoQ (Fig. 6C). To directly assess whether statins induced mitophagy, we measured mitochondrial content per cell area by immunofluorescence microscopy. HL-1 cardiomyocytes treated with simvastatin exhibited a decrease in Tom70 (mitochondrial marker) fluorescence per unit cell area (Fig. 6D), which was also prevented by CoQ. Combined, these data suggest that depletion of CoQ compromises mitochondrial membrane potential, leading to the elimination of mitochondria through autophagy. Interestingly, we found that, while CoQ administration prevented statin-mediated mitophagy, it did not block statin's effects on Akt/mTOR signaling or induction of macroautophagy indicated by LC3-II protein levels (Supplementary Fig. S5A, B).
Statin cardioprotection via Parkin-mediated mitophagy is blocked by coenzyme Q10
To determine if Parkin was required for statin-mediated cardioprotection, we subjected vehicle control and statin-treated wild-type or Parkin-knockout mice to 20 min left coronary artery occlusion and 22 h reperfusion. Infarct size was then determined. Simvastatin pretreatment reduced infarct size by ∼50% in wild-type mice, but had no protective effect in Parkin-knockout mice (Fig. 7A, B, and Supplementary Fig. S6A). We observed a trend for total Parkin and p62/SQSTM1 levels to increase in the heart upon statin treatment. Importantly, simvastatin caused translocation of Parkin and p62/SQSTM1 to the heavy membrane fraction (mitochondria) obtained from hearts of treated mice (Supplementary Fig. S7A, B). These findings show that cardioprotection by simvastatin requires Parkin, and that its action to promote mitophagy may be key to cardioprotection.
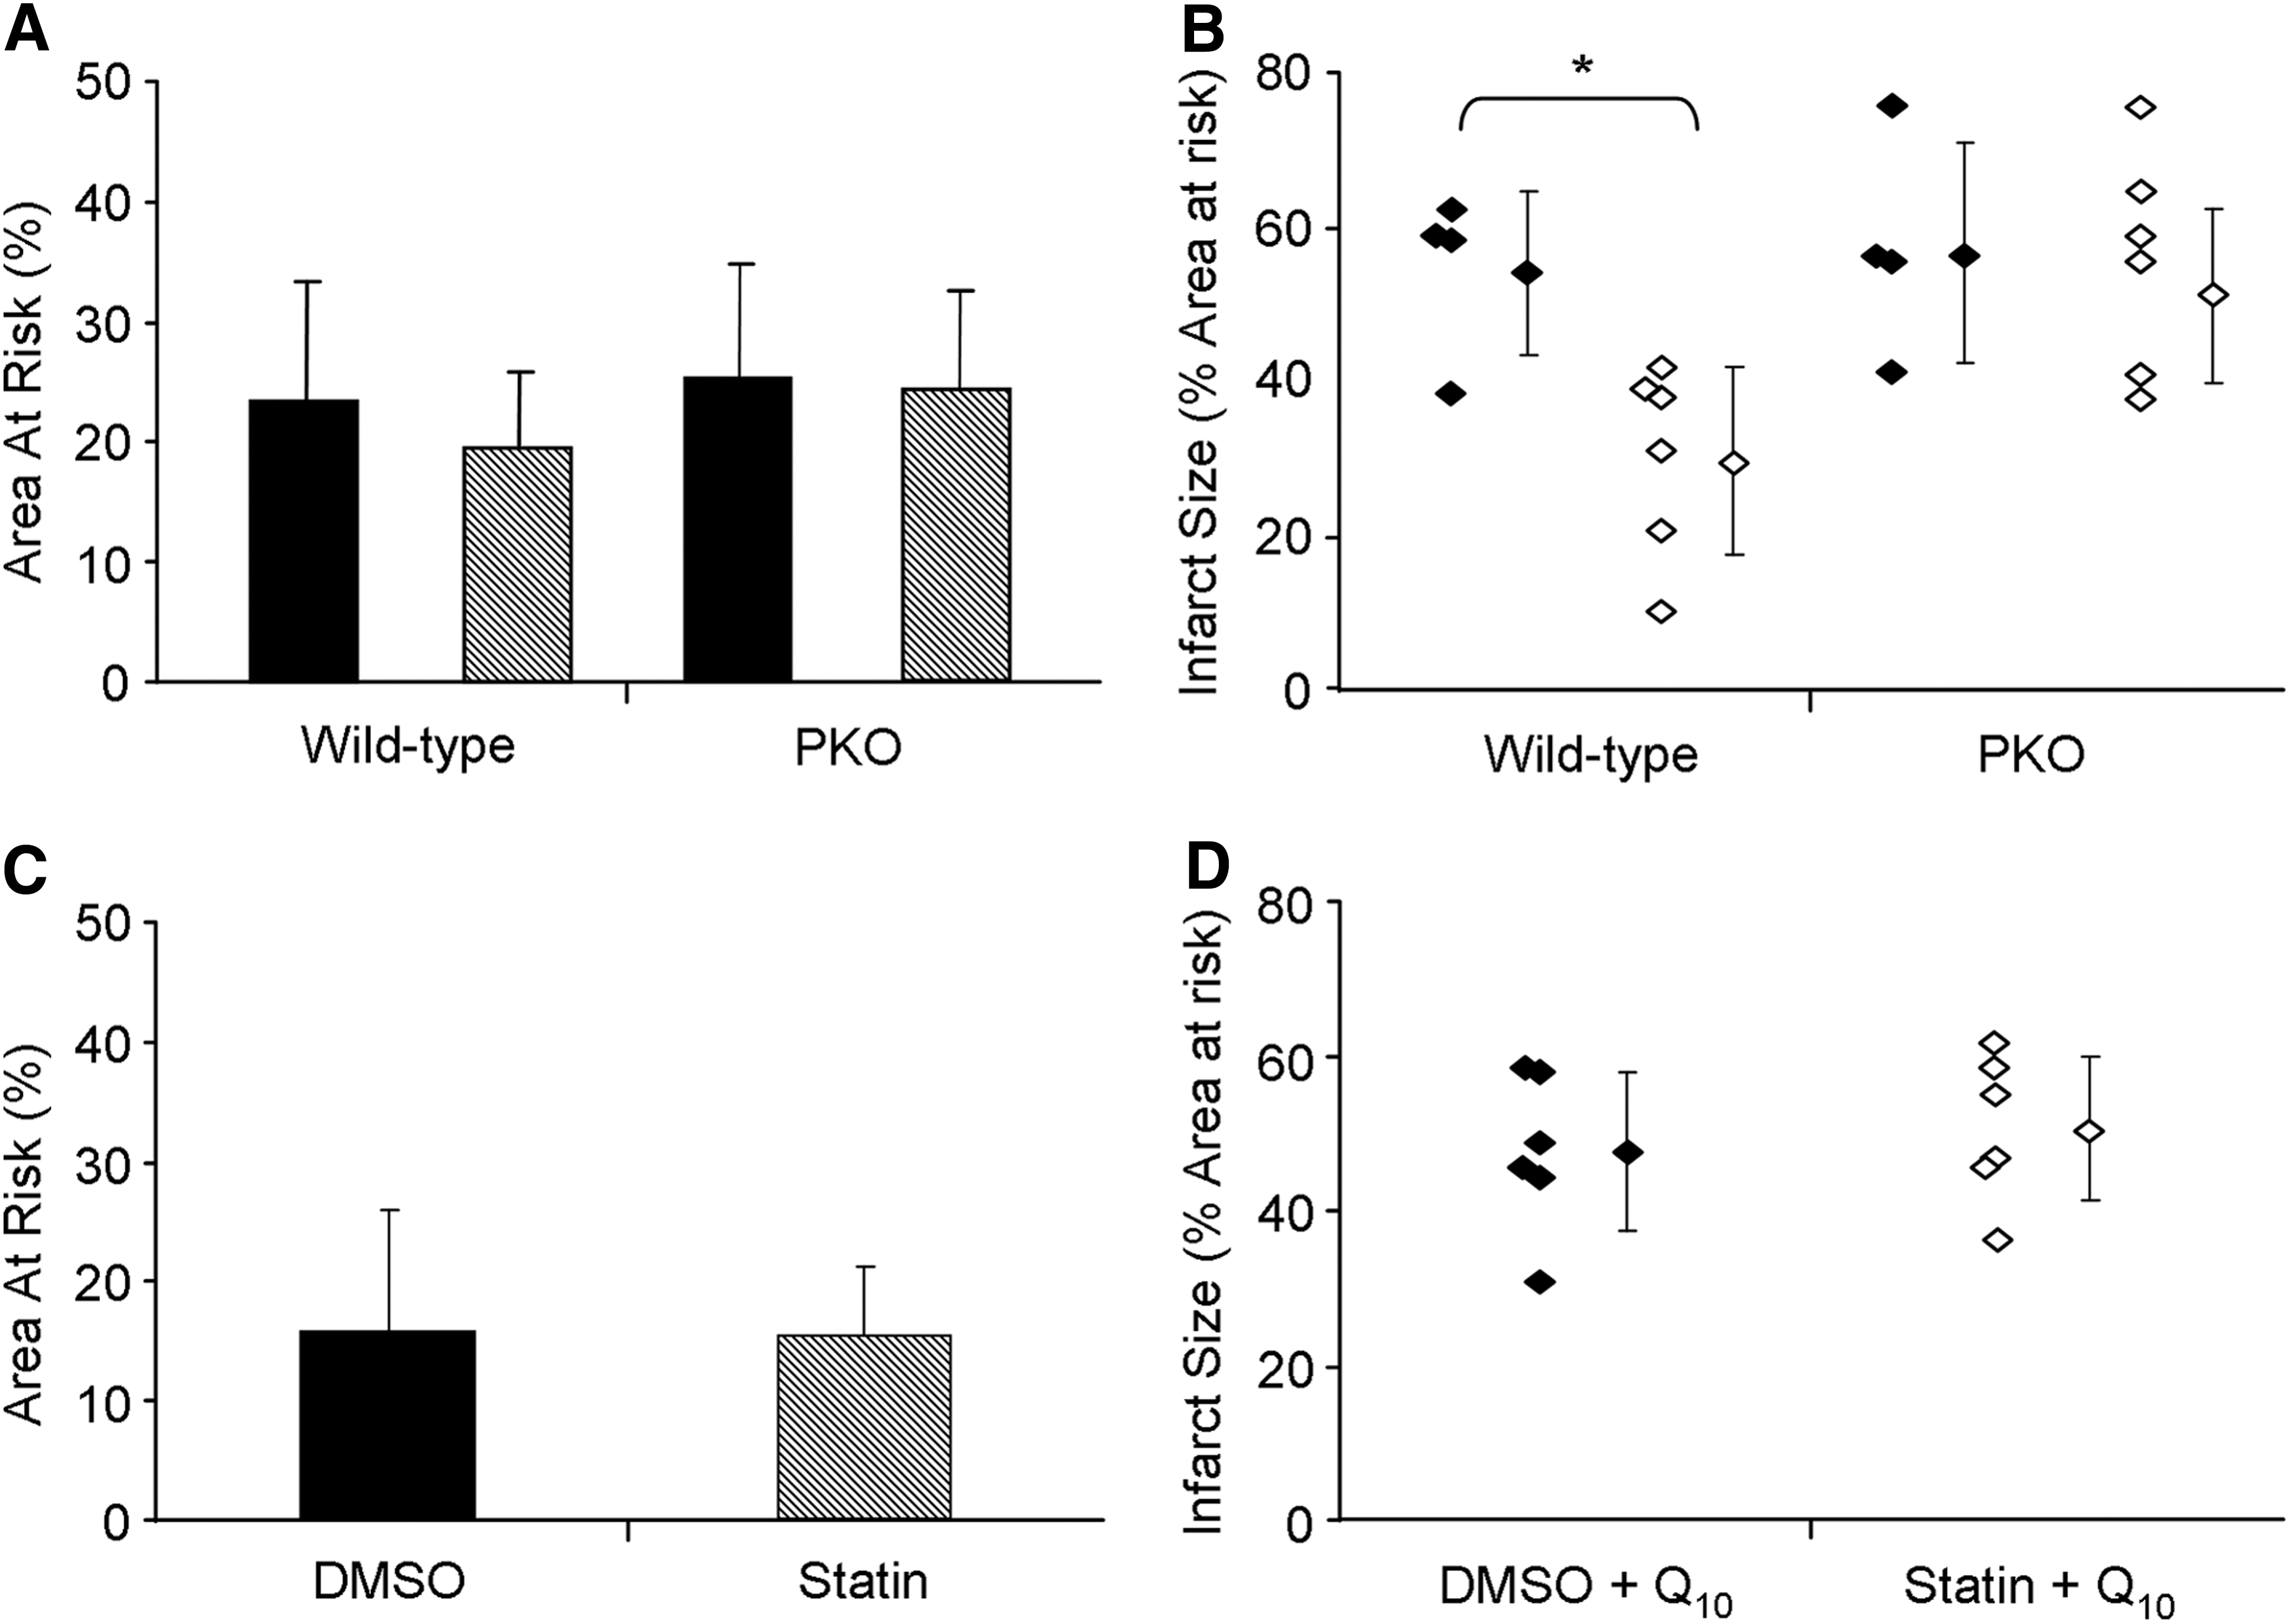
We have shown in vitro that the mechanism of statin-induced mitochondrial depolarization and mitophagy can be prevented by CoQ supplementation (Figs. 5 and 6D, and Supplementary Fig. S3). Therefore, to test our hypothesis that statin-induced cardioprotection occurs through CoQ depletion and mitophagy, we treated wild-type mice with simvastatin followed 1 h later with CoQ (10 mg/kg i.p.). Acute administration of CoQ (emulsified in intralipid) has been reported to transiently increase the level of this essential lipid in the heart (3). We found that CoQ supplementation abolished the cardioprotective effects of statin administration (Fig. 7C, D, and Supplementary Fig. S6B). These results suggest that CoQ replacement may interfere with statin-mediated mitophagy required for cardioprotection.
Taken together, these findings suggest a mechanism of cardioprotection in which statins (I) upregulate macroautophagy via suppression of Akt/mTOR signaling independent of CoQ, and (II) lower mitochondrial membrane potential through CoQ depletion to facilitate cardioprotective mitophagy (Fig. 8).
Discussion
Statins are widely used and are recognized to confer pleiotropic cardiovascular benefits (43, 44). Importantly, early initiation of statin therapy in patients hospitalized for acute myocardial infarction was associated with reduction of major adverse cardiac events, even in the absence of a change in serum cholesterol levels (28, 47). Furthermore, statins have been shown to be beneficial even in patients with normal cholesterol levels (45). Chronic statin administration (14 days treatment with pitavastatin) has been shown to be cardioprotective, and this was attributed to suppression of IκB kinase (IKK)/nuclear factor kappa light chain enhancer of activated B cells (NFκB), and increased phosphorylation of Akt and eNOS (32). A study of pigs fed a hypercholesterolemic diet for 10 days before acute myocardial infarction induction showed that postinfarction administration of rosuvastatin decreased infarct size at 7 days (56). They reported upregulation of protein kinase C, extracellular regulated kinase 2 (Erk2), and Akt in the hearts of statin-treated animals. In our study, acute administration of simvastatin (4 h before assessment) resulted in decreased phosphorylation of Akt and downstream targets mTOR and S6. Our findings are difficult to reconcile with previous reports linking Akt to cardioprotection (30), but the differences may be related to the duration of statin administration. Dephosphorylation of Akt in statin-treated C2C12 myotubes was previously described (35). Our studies further revealed the upregulation of autophagy through ULK1. Interestingly, CoQ supplementation did not reverse the inhibition of Akt, and mTOR, nor did it prevent statin-mediated macroautophagy, but specifically prevented mitochondrial depolarization, Parkin translocation, and mitophagy. Little is known about statin-mediated autophagy in the heart. Autophagy was not assessed in other studies of statin-mediated cardioprotection. Several studies have linked statins to autophagy in various cell lines (1, 41, 59) and tissues (33, 53, 60). While our model employed statin administration 4 h before I/R injury, others have shown that statins are cardioprotective when given at reperfusion. It is likely that clearance of damaged mitochondria is common to both preconditioning and postconditioning. This is based on the finding that chloramphenicol, which induces autophagy through effects on mitochondria, can be given at reperfusion and achieve infarct size reduction comparable to pretreatment (12, 46). Moreover, a recent publication demonstrated a role for Parkin in myocardial function after infarction (23). These reports and others (39) support the notion that adequate clearance of damaged mitochondria is essential to cardiac homeostasis after injury.
Statins have significant effects on mitochondria, including lower oxidative stress, diminished respiration, and in some cases reduced adenosine triphosphate (ATP) production and calcium handling (2, 7, 31). The effects of statins on cardiac mitochondria are unclear. Pravastatin was shown to mediate cardioprotection through mitochondrial ATP-sensitive potassium (mitoKATP) channels in a Langendorff model where the drug was infused 10 min before global no-flow ischemia (55). Opening of mitoKATP channels is known to cause mild mitochondrial depolarization; we previously showed that depolarization mediated by the uncoupler carbonyl cyanide 4-(trifluoromethoxy) phenylhydrazone (FCCP) was sufficient to trigger Parkin translocation and mitophagy (18). Consistent with this, we noted a decrease in mitochondrial membrane potential in statin-treated cells, which was prevented by coadministration of CoQ. If uncoupling, which would diminish ROS production, were sufficient for cardioprotection, then Parkin translocation would not be required for cardioprotection. Our findings demonstrate a requirement for Parkin and mitophagy, which are a response to mitochondrial depolarization mediated by statins and depletion of CoQ. We suggest that many cardioprotective agents may act through mitochondrial depolarization and induction of mitophagy.
CoQ has gained popularity as an antioxidant nutritional supplement. It was thought that supplementation might ameliorate statin myopathy, given that CoQ levels are reduced in skeletal muscle, but randomized clinical trials have failed to demonstrate a clear benefit. Skeletal muscle myopathy may be a consequence of disruption of isoprenoid metabolism rather than CoQ depletion (5). The antioxidant properties of CoQ might also interfere with induction of autophagy, as Atg4 is regulated by redox. Localized ROS prevents Atg4-mediated cleavage of CoQ from internal membranes; thus, facilitating formation of autophagosomes at the site of ROS-generating structures (such as mitochondria) (49). Antioxidants, such as N-acetylcysteine have been shown to suppress autophagy (58). While in our studies CoQ did not interfere with statin-induced LC3-II formation, it did prevent selective mitophagy.
Mitophagy is not without risk. Excessive depletion of mitochondria could contribute to an energetic crisis and heart failure, if replacement biogenesis cannot match mitophagy. In fact, statins trigger mitochondrial biogenesis (43). It may be that mitochondrial biogenesis is equally important to the durable benefit of cardioprotection, and work is underway to address this possibility. However, it raises the concern that in conditions where mitochondrial biogenesis is impaired, as in type 2 diabetes or advanced age, statin therapy might have adverse consequences. Indeed, statins have no benefit with respect to postinfarction mortality in the elderly (9). Although statin administration reduced Akt phosphorylation and mTOR signaling, it did not interfere with insulin's effect to stimulate Akt phosphorylation (Supplementary Fig. S2).
Our previous study of ischemic preconditioning revealed a requirement for Parkin-mediated mitophagy in mice (18). The present study demonstrates, for the first time, a role for mitophagy in cardioprotection by statins. In the setting of I/R, mitophagy may serve to eliminate damaged mitochondria before they can hydrolyze excessive amounts of ATP in a futile attempt to restore mitochondrial membrane potential, release proapoptotic factors, or trigger necrotic cell death. Removal of depolarized mitochondria could explain the decrease in ATP consumption by mitochondria from protected hearts after I/R (50), as well as attenuated ROS production. As statins also stimulate mitochondrial biogenesis, it is reasonable to imagine that the net effect is to improve mitochondrial function through accelerated turnover.
The therapeutic target of statins is inhibition of HMG-CoA reductase, the rate-limiting enzyme in cholesterol biosynthesis. The product of this enzyme is mevalonate, which is a precursor for three different products: cholesterol, isoprenoids (important for Ras signaling among other things), and CoQ. CoQ is essential for normal mitochondrial function, and statin-mediated depletion in skeletal muscle is widely recognized and often treated with oral supplements. Although CoQ levels were not measured in this study, it has been reported that chronic atorvastatin treatment caused CoQ depletion and mitochondrial dysfunction in heart tissue (25). Moreover, gavage of a single dose of the HMG-CoA reductase inhibitor monacolin K rapidly depleted CoQ from heart mitochondria (57). Our findings clearly indicate that the effects of statins to suppress mTOR signaling and induce autophagy are related to inhibition of HMG-CoA reductase, as mevalonate supplementation reversed the effects. Interestingly, while CoQ supplementation in cell culture prevented mitophagy, it had minimal effect on suppression of mTOR signaling or LC3 lipidation. Despite that, cardioprotection was lost after CoQ supplementation, suggesting that depletion of CoQ and consequent mitophagy are essential to acute cardioprotection by statins.
Whether CoQ replacement will abolish the cardioprotective benefits of statins in humans remains to be determined. In the CORONA study, CoQ levels were found to be lower in older patients with more advanced heart failure, and rosuvastatin also lowered CoQ levels (34). Interestingly, lipid-lowering response to atorvastatin was linked to CoQ levels, and depletion of CoQ was not simply a consequence of lowered lipoprotein levels, although the coenzyme is transported on low-density lipoprotein particles (40). To date, no study has been designed to test whether CoQ supplementation interferes with the benefits of statin therapy.
Materials and Methods
Animals
All animal procedures involving Parkin (Park2) gene knockout mice (Parkin−/− ) (cat# 007587) and control C57BL/6J mice (cat# 002448) were approved by the Institutional Animal Care and Use Committee at San Diego State University, and conform to the Guide for the Care and Use of Laboratory Animals. Mice were acquired from Jackson Laboratories.
Cell culture
HL-1 cardiomyocytes were maintained in Claycomb media (Sigma-SAFC Biosciences) as previously described (14). For western blot analysis, cells were plated in 60 mm tissue culture plates (Falcon). Cells for microscopy were plated on glass bottom plates (MatTek) and fixed 24 h after simvastatin treatment.
Statin, insulin, bafilomycin A1, mevalonate, or coenzyme Q10 supplementation in HL-1 cells
Cells were treated with 1 μM simvastatin (Toronto Research Chemicals) or vehicle control dimethyl sulfoxide (DMSO; Sigma) for 24 h. Where indicated, media was supplemented with 100 μM mevalonate (Sigma).
For autophagic flux experiments cells were first treated with 100 nM bafilomycin A1 for 2 h. Immediately after, cells were then treated with simvastatin for 24 h as described above.
Akt phosphorylation in response to insulin was tested in cell lysates obtained 30 min after addition of 100 nM insulin to cells that had been treated for 24 h with DMSO or 1 μM simvastatin.
Coenzyme Q10 was prepared in DMSO, and was added to a final concentration of 5 μM in cell medium. After all treatments, cells were washed with phosphate-buffered saline (PBS) and harvested in radioimmunoprecipitation assay (RIPA) buffer (50 mM Tris pH 8.0, 150 mM NaCl, 2 mM ethylene glycol tetraacetic acid [EGTA], 1 mM ethylenediaminetetraacetic acid [EDTA] disodium, 1% NP-40, 0.5% sodium deoxycholate, and 0.1% sodium dodecyl sulfate [SDS]) supplemented with protease inhibitor cocktail (Roche) and phosphatase inhibitors (20 mM sodium fluoride, 1 mM sodium orthovanadate) for western blot analysis. Cells were detached with a tissue culture cell scraper (Fisher) and mechanically lysed by passing through a 27.5 gauge needle. Lysates were centrifuged at 600 g for 5 min and postnuclear supernatants were used for protein western blot analysis.
In vivo statin and coenzyme Q10 treatment
Mice received 20 mg/kg simvastatin or equal volume of vehicle DMSO i.p. Four hours later, mice were sacrificed for tissue harvest, or anesthetized for surgical intervention (see In vivo I/R and Infarct Size Measurement section). Where used, coenzyme Q10 (first dissolved in ethanol, then emulsified in intralipid; Sigma) was delivered i.p. (10 mg/kg) 1 h after treatment with simvastatin.
Western blot analysis
For subcellular fractionation to obtain mitochondria-rich heavy membranes, tissues were homogenized in buffer containing 250 μM sucrose, 1 mM EDTA, and 10 mM 4-(2-hydroxyethyl)-1-piperazineethanesulfonic acid (HEPES) (pH 7.4). Fresh protease inhibitor cocktail (Roche) and phosphatase inhibitors (20 mM sodium fluoride, 1 mM sodium orthovanadate) were added immediately before use. Homogenates were spun down at 1000 g to eliminate nuclei and debris. Supernatants were then spun down at 7000 g to obtain the mitochondria-enriched heavy membrane pellet. The pellet was then resuspended in RIPA buffer with protease and phosphatase inhibitors (described above).
Protein samples from cell lysates or tissue homogenates were measured using the Bio-Rad DC protein assay kit. Equal amounts of protein were resolved on 10%–20% Tris-Glycine SDS-PAGE gels (Life Technologies) and transferred to nitrocellulose membranes. The membranes were blocked with 5% nonfat dry milk for 1 h then incubated with 1:500–1:1000 diluted primary antibodies against LC3, pAkt Ser473, pAkt Thr308, total Akt, pS6 Ser235/236, total S6, pmTOR Ser2448, total mTOR, pULK1 Ser757 (Cell Signaling Technologies), total ULK1, and actin (Sigma) at 4°C overnight. Membranes were washed with Tris-buffered saline (TBS—150 mM NaCl, 100 mM Tris-HCl, pH 7.4) with 0.1% Tween-20 at room temperature and incubated with appropriate horseradish peroxidase-conjugated goat anti-mouse or goat anti-rabbit secondary antibodies (1:2500). Blots were developed using SuperSignal West Dura Extended Duration Substrate (Thermo-Pierce), and immunoreactive bands were visualized using the ChemiDoc XRS system (Bio-Rad). Densitometry was performed using ImageJ software.
Immunofluorescence
Cells were fixed with 4% paraformaldehyde for 10 min and washed three times, 5 min per wash with 1×PBS. Cells were then blocked/permeabilized for 15 min in TBS (150 mM NaCl, 100 mM Tris-HCl, pH 7.4) supplemented with 5% horse serum, 5% goat serum, 0.2% bovine serum albumin, and 0.3% Triton X-100. After three washes of 5 min each in TBS, cells were incubated 1 h at 37°C with 1:200 anti-Tom70 polyclonal rabbit antibody (Calbiochem), 1:200 anti-Parkin mouse monoclonal antibody (Santa Cruz Biotechnologies), or 1:200 anti-p62/SQSTM1 mouse monoclonal antibody (Santa Cruz Biotechnologies). After three washes of 5 min each with TBS, cells were incubated with either goat anti-rabbit AlexaFluor-488-conjugated (Life Technologies) or goat anti-mouse Texas Red-conjugated (Abcam) secondary antibodies for 30 min at room temperature in the dark. Cells were washed three times 5 min each followed by incubation for 10 min with 1:10,000 Hoechst 33342 nuclear stain (Life Technologies). Cells were washed as described above and stored at 4°C in the dark immersed in 1×PBS.
Cell imaging and analysis
Cells were imaged on a Nikon TE300 fluorescence microscope equipped with a cooled charge-coupled device camera (Orca-ER). Images were deconvolved using Autodeblur Software. NIH ImageJ software was used for image analysis and formatting.
Colocalization of Parkin or p62/SQSTM1 (red) to the mitochondria (Tom70-green) was analyzed by overlaying the red and green channels. Colocalization in the merged images was highlighted by thresholding the pixels in the yellow section of the HUE color spectrum using the Threshold Color plugin in ImageJ. In addition, the Threshold Color plugin was used to score cells positive for colocalization with a scoring criterion of greater than 20% of colocalized Parkin or p62/SQSTM1 to the mitochondria for colocalization positive cells. Quantification of colocalization by the Pearson's correlation coefficient was conducted using ImageJ software colocalization plugin. The plugin thresholds the two images to be analyzed and excludes background signal to calculate the Pearson correlation coefficient based on pixel intensities.
Assessment of mitochondrial fission was performed via calculation of mitochondrial interconnectivity from cells stained with Tom70. After acquisition and deconvolution, the image was analyzed using the ImageJ plugin Mitochondrial Morphology (6). The Tom70 signal was subjected to threshold and inversion to prevent nonspecific analysis of background signal and to achieve higher image definition. The plugin then directly analyzed the processed Tom70 fluorescent signal using the ImageJ Particle Analysis function. The mitochondrial interconnectivity was calculated as the ratio of area to perimeter per cell. Cells with high mitochondrial fission have low area-to-perimeter values.
Ratiometric signal intensity analysis of MitoTracker Red normalized to Tom70 was measured using ImageJ software. The signal intensities for both channels (red/green) were subjected to threshold and the background signal excluded, followed by calculation of the ratio of red normalized to green fluorescence.
ROS and mitochondrial membrane potential measurement
For ROS measurements HL-1 cells were treated with 10 μM H2DCFDA for 30 min at 37°C after simvastatin and/or coenzyme Q10 administration. Live cells were then analyzed by FACS as described below. Mitochondrial membrane potential was investigated using MitoTracker Red CMX Rosamine (Life Technologies). After statin treatment, HL-1 cells were incubated in media containing 50 nM MitoTracker Red CMX Rosamine in media for 30 min. Cells were then rinsed with PBS and trypsinized to lift cells. Cells were again rinsed with PBS and fixed in 4% paraformaldehyde for 10 min. Fixation solution was then washed out with PBS before FACS analysis. For ROS or mitochondrial membrane, potential measurements cells were analyzed for fluorescence intensity by flow cytometry (10,000 events) using a FACS Canto (Becton Dickinson), or by fluorescence microscopy for ratiometric analysis (see above). Data was analyzed using FlowJo software with the assistance of the San Diego State University Flow Cytometry Core Facility. ROS production is proportional to fluorescence of activated H2DCFDA. Mitochondrial membrane potential is proportional to the incorporation of MitoTracker Red CMX Rosamine into the mitochondria.
GFP-LC3 viral infection of HL-1 cells
Cells were infected with adenoviral GFP-LC3 using a multiplicity of infection of 5 for 16 h followed treatment with simvastatin or DMSO vehicle control. After 24 h, cells were fixed and imaged for autophagic puncta detection using a Nikon TE300 fluorescence microscope. Images were deconvolved using Autodeblur Software and formatted with ImageJ. Cells were scored positive for autophagy if they contained at least 20 autophagic puncta.
Gene silencing of ULK1
Gene silencing was performed using Effectene (Qiagen) transfection kit according to manufacturer's recommendation. Cells were transiently transfected using 50 nM of RNAi complex (Santa Cruz Biotechnologies) targeting murine ULK1 for an initial period of 10 h followed by a recovery period in RNAi free media for 10 h. After recovery, transient transfection of ULK1 RNAi was repeated for 4 h before treating with simvastatin. Silencing efficiency was confirmed by western blot.
In vivo I/R and infarct size measurement
Four hours after treatment with simvastatin or DMSO vehicle control, mice were subjected to I/R as previously described (17, 18). Briefly, 10–12-week-old Parkin knockout and control mice were anesthetized with an i.p. injection of ketamine (10 mg/kg) and xylazine (1 mg/kg). Isoflurane anesthesia was used throughout the procedure. Pressure-controlled ventilation (Harvard Apparatus) was maintained at a rate of 140 bpm and a pressure of 9 cm H2O. Mice underwent left coronary artery ligation for 20 min, after which the ligature was released but left in place. The chest was closed and the animals were allowed to recover. Twenty-two hours later, mice were reanesthetized, and the coronary artery was reoccluded, while Evans Blue dye was injected. The heart was then excised, sliced into transverse 1 mm thick slices and stained with 1% triphenyl tetrazolium chloride (Sigma) for determination of area at risk and infarct size.
Statistical analysis
Student's t-test was used to determine statistical significance with p-values less than 0.05 accepted as significant. Error bars indicate the standard deviation. For fluorescent colocalization analysis, we used the Pearson's correlation coefficient, which employs a linear regression to determine the linear equation describing the relationship between intensities of two channels.
Footnotes
Acknowledgments
We would like to extend our appreciation to the San Diego State University Flow Cytometry Core Facility for their expert assistance. This study was supported by NIH P01HL112730-01, NIH 5R01HL060590-14, 5R01HL034579-26, and 5R01AG033283-05 (to RAG). G.H. is supported by SDSU MBRS/IMSD Program 2R25GM058906-09A2.
Author Disclosure Statement
Authors have nothing to disclose.
Abbreviations Used
References
Supplementary Material
Please find the following supplemental material available below.
For Open Access articles published under a Creative Commons License, all supplemental material carries the same license as the article it is associated with.
For non-Open Access articles published, all supplemental material carries a non-exclusive license, and permission requests for re-use of supplemental material or any part of supplemental material shall be sent directly to the copyright owner as specified in the copyright notice associated with the article.