
Abstract
Introduction
T
Apelin and its receptor APJ are now considered potential peripheral targets in the treatment of cardiovascular diseases, obesity, and type 2 diabetes (7). In contrast, recent studies have suggested that central apelin plays a role in the transition from the normal to diabetic state. First, apelin expression is increased in the hypothalamus of obese/diabetic mice (42). Second, acute and chronic intracerebroventricular (icv) injections of a high quantity of apelin (similar to that observed in obese/diabetic mice) in fasted normal mice induce type 2 diabetes symptoms such as hyperinsulinemia, hyperglycemia, glucose intolerance, and insulin resistance (11). This result suggests that hypothalamic apelin may control liver glucose metabolism, thereby controlling glucose release via glycogenolysis and/or gluconeogenesis in fasted state. Reinforcing this hypothesis, we clearly demonstrated that central apelin exerts its glycemic effect by targeting the ventromedial hypothalamic nuclei (11), a region whose electrical stimulation triggers the activation of hepatic glycogenolysis and gluconeogenesis via the ANS (44, 49).
Central apelin is known to control glycemia in a dose-dependent manner. In the brain, a slight physiological increase of apelin stimulates a hypothalamic nitric oxide (NO) pathway, which results in an increase in peripheral glucose utilization. On the contrary, a high increase in central apelin, similar to that observed in obese/diabetic mice, provoked fasted hyperglycemia in normal mice. We demonstrate that central apelin participates in the establishment of a type 2 diabetes state by modulating the release of reactive oxygen species in the hypothalamus. Consequently, the autonomic nervous system provokes an over-activation of glycogenolysis and gluconeogenesis in the liver, resulting in fasted hyperglycemia.
One molecular target of apelin actions is the reactive oxygen species (ROS) such as hydrogen peroxide (H2O2). Finely balanced mitochondrial ROS (mROS) production may be at the core of proper metabolic maintenance, and unbalanced mROS production, which is largely documented, might be an important trigger of metabolic disorders (15, 23). Data from literature demonstrate that apelin increases the production of ROS in neuronal cells culture (57). In the brain, hypothalamic hyperglycemia increases mROS hypothalamic production, which, in turn, stimulates peripheral hyperinsulinemia, thereby supporting the implication of brain mROS in the control of glucose homeostasis (24). Under metabolic dysfunction, mitochondria are considered the principal source of H2O2 (2), and an elevated mitochondrial H2O2 emission is a primary cause of insulin resistance (2, 15).
Thus, unraveling the hypothalamic apelin to liver axis involved in the onset of type 2 diabetes appears to be of major importance. However, the downstream molecular pathways and functional effects of hypothalamic apelin on the liver remain to be established. Given the well-established role of central apelin in the control of glycemia, we tested here the possibility that hypothalamic apelin positively regulates hepatic glucose production. To address this hypothesis, we used pharmacological and genetic approaches to increase hypothalamic level of apelin in normal and high-fat diet (HFD) obese/diabetic mice. These experiments allowed us to examine whether the increased levels of hypothalamic apelin is sufficient to modify hypothalamic ROS/H2O2 production and, consequently, hepatic glucose release via ANS.
Results
Antioxidants counterbalanced icv apelin-induced fasted-hyperglycemia in mice
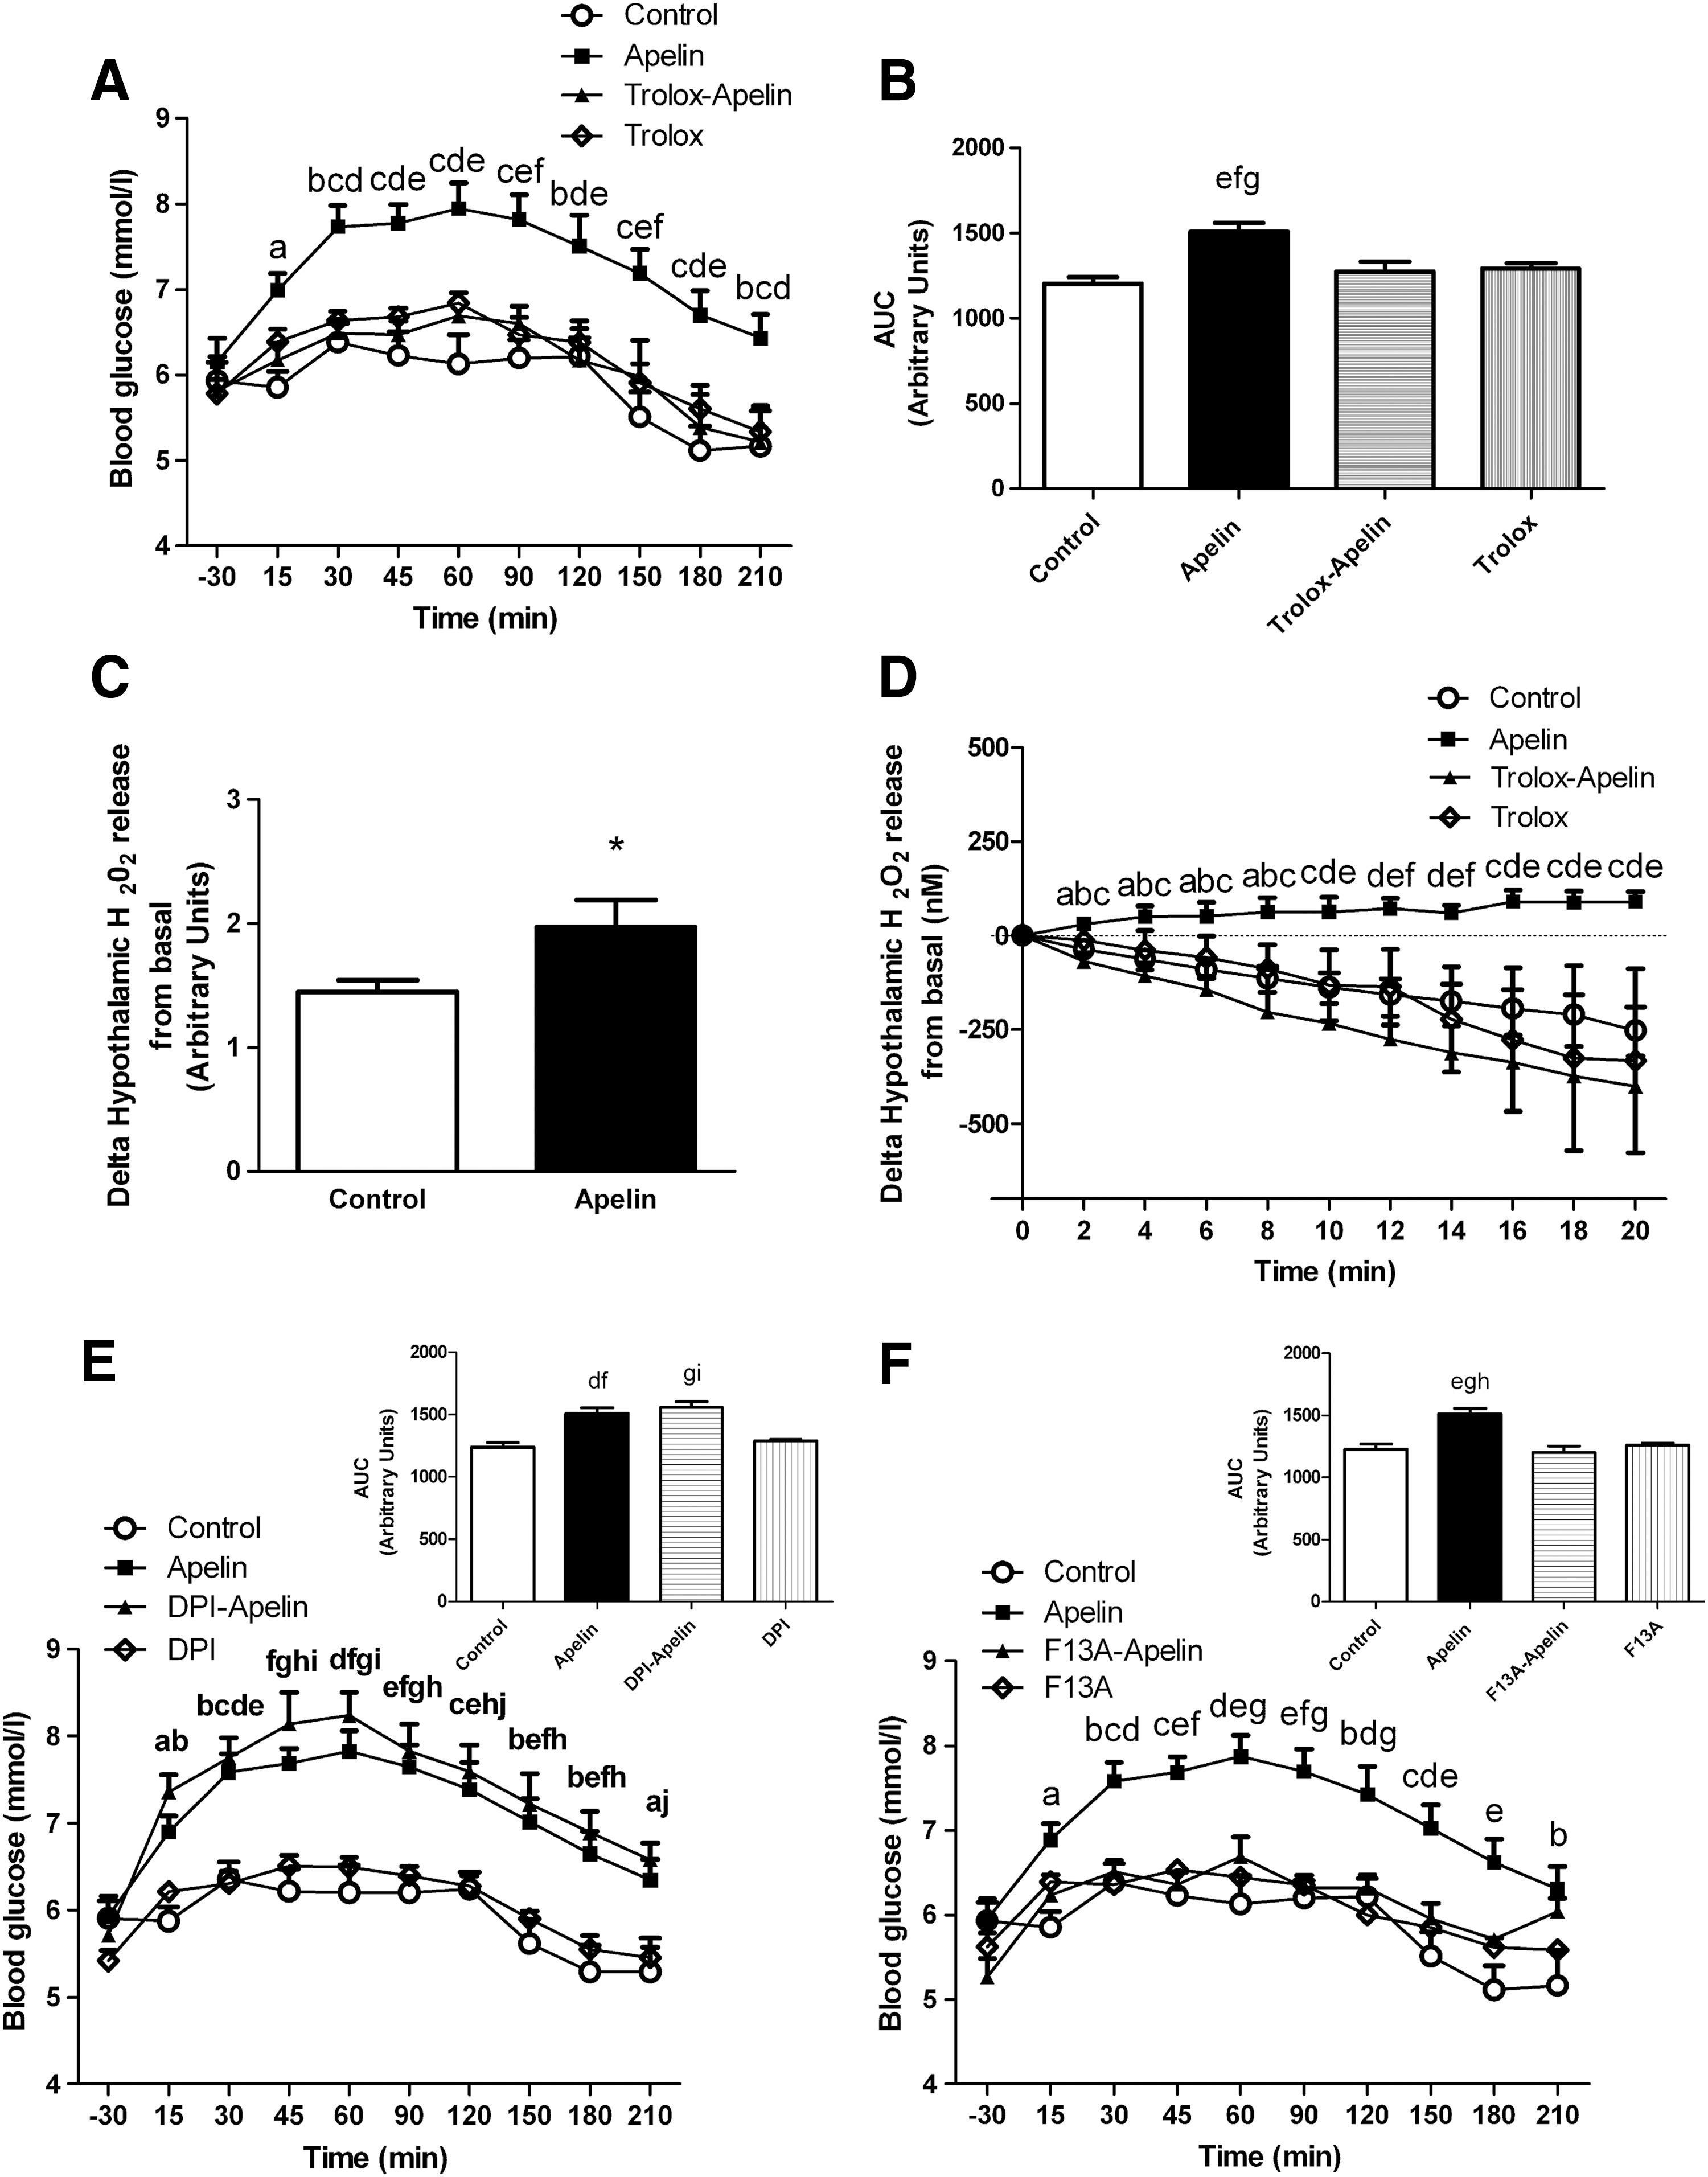
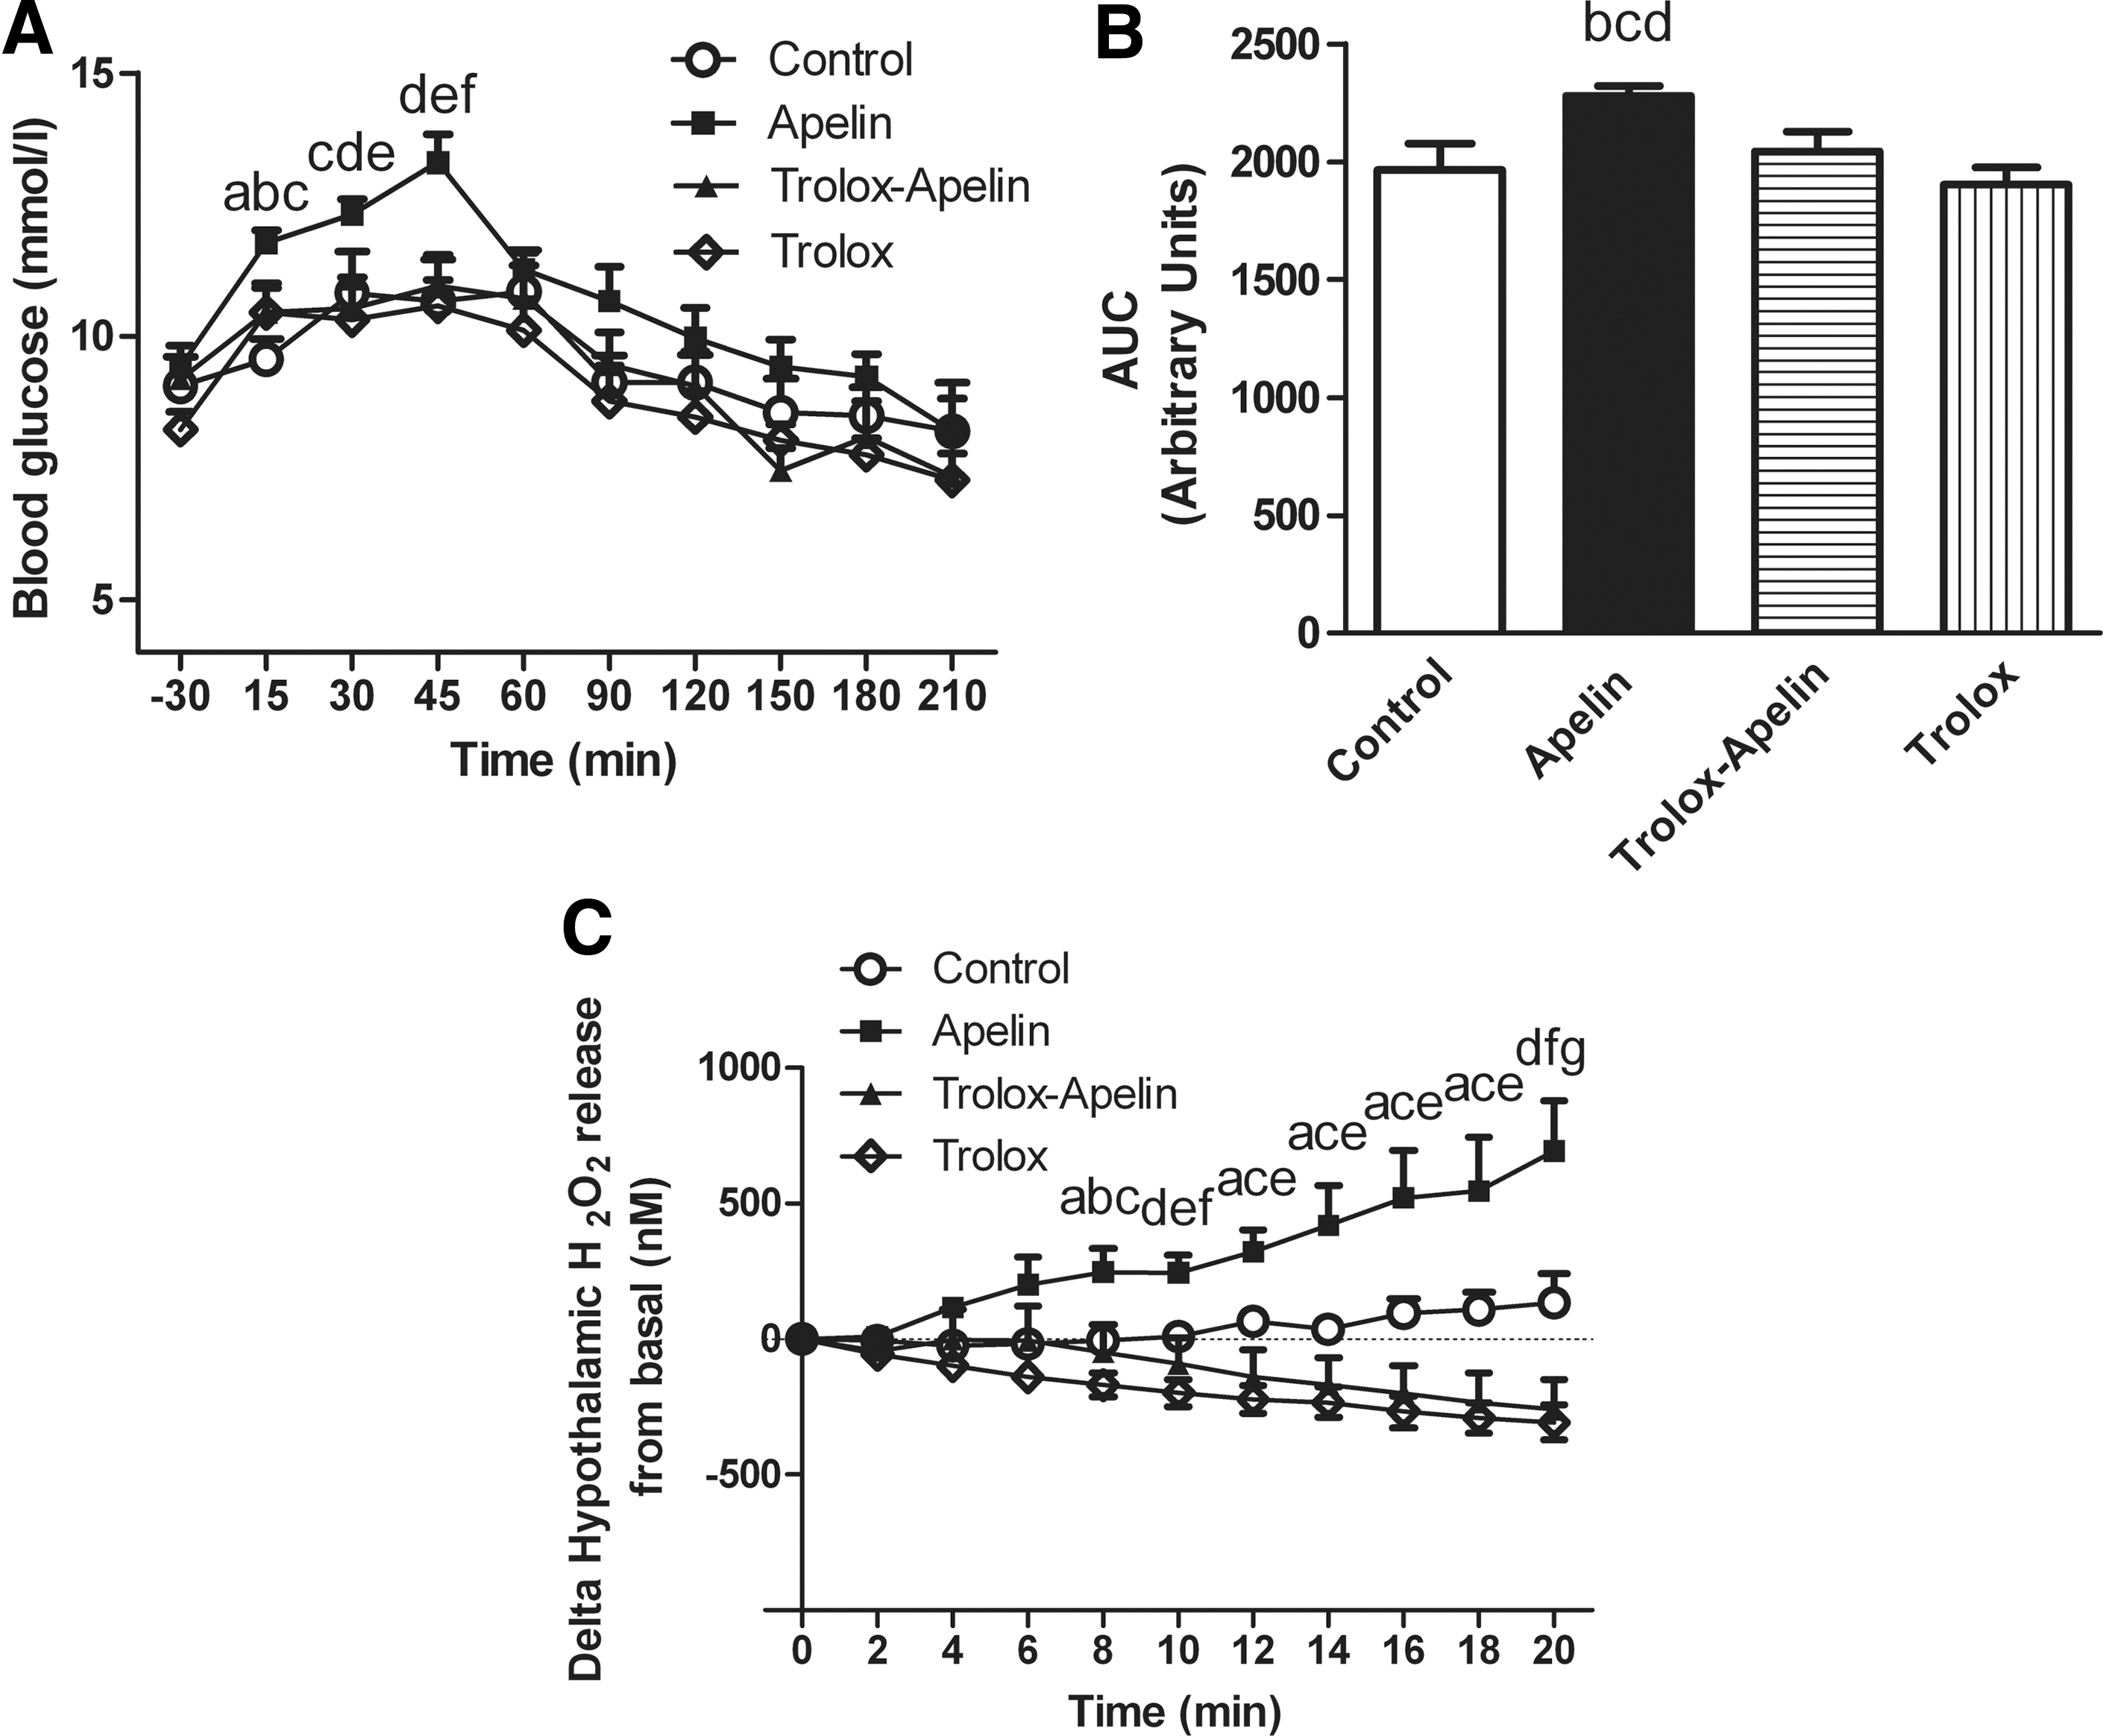
We confirmed here that acute apelin icv injection provoked fasted hyperglycemia in normal mice (Fig. 1A) (11). Since ROS are potential targets of apelin action, we injected icv apelin in mice previously treated with an antioxidant, trolox at 1 mM. At this concentration, trolox is able to prevent hyperinsulinemia generated by glucose-induced hypothalamic ROS production (8). Treatment with icv trolox completely prevented apelin-induced hyperglycemia (Fig. 1A, B). All icv conditions did not modify food intake during re-feeding (Supplementary Fig. S1A; Supplementary Data are available online at
Apelin stimulates hypothalamic ROS production in mice
The implication of ROS/H2O2 in the control of glucose metabolism in normal and physiopathological states is well established (15). To determine whether hypothalamic apelin requires an H2O2-dependent signaling pathway, our first approach used an indirect method of detection of H2O2 release by hypothalamus in response to apelin. We demonstrated that apelin significantly increased H2O2 release (Fig. 1C). Based on this result, we developed for the first time in hypothalamic explants a method using specific amperometric probes that was highly and specifically sensitive to H2O2 in order to detect its release in real time (54). As observed in Figure 1D, apelin rapidly increased hypothalamic H2O2 release from 2 to 20 min. This effect was completely blunted by trolox, thereby demonstrating the existence of an hypothalamic apelin/H2O2 signaling pathway (Fig. 1D). It is well established that the majority of hypothalamic ROS implicated in rapid signaling pathway have a mitochondrial origin (3). Data from literature show that hypothalamic NADPH oxidase is implicated in the control of energy homeostasis (i.e., food intake) via ROS production (19). To test whether NADPH oxidase could be a major enzymatic target of hypothalamic apelin action, we tested the effect of icv diphenyleneiodonium (DPI), an inhibitor of NADPH oxidase, on glycemia. icv DPI injection failed to counterbalance hyperglycemia induced by icv apelin (Fig. 1E).
Central apelin controls glycemia via APJ receptor
Nowadays, there is only one known apelin receptor called APJ. To determine the specificity of icv apelin on glycemia, we treated mice with F13A, an APJ antagonist (26). Acute icv F13A injection blocked icv apelin-induced hyperglycemia (Fig. 1F).
Central apelin stimulates glycogenolysis and gluconeogenesis via hypothalamic ROS production and the ANS in mice
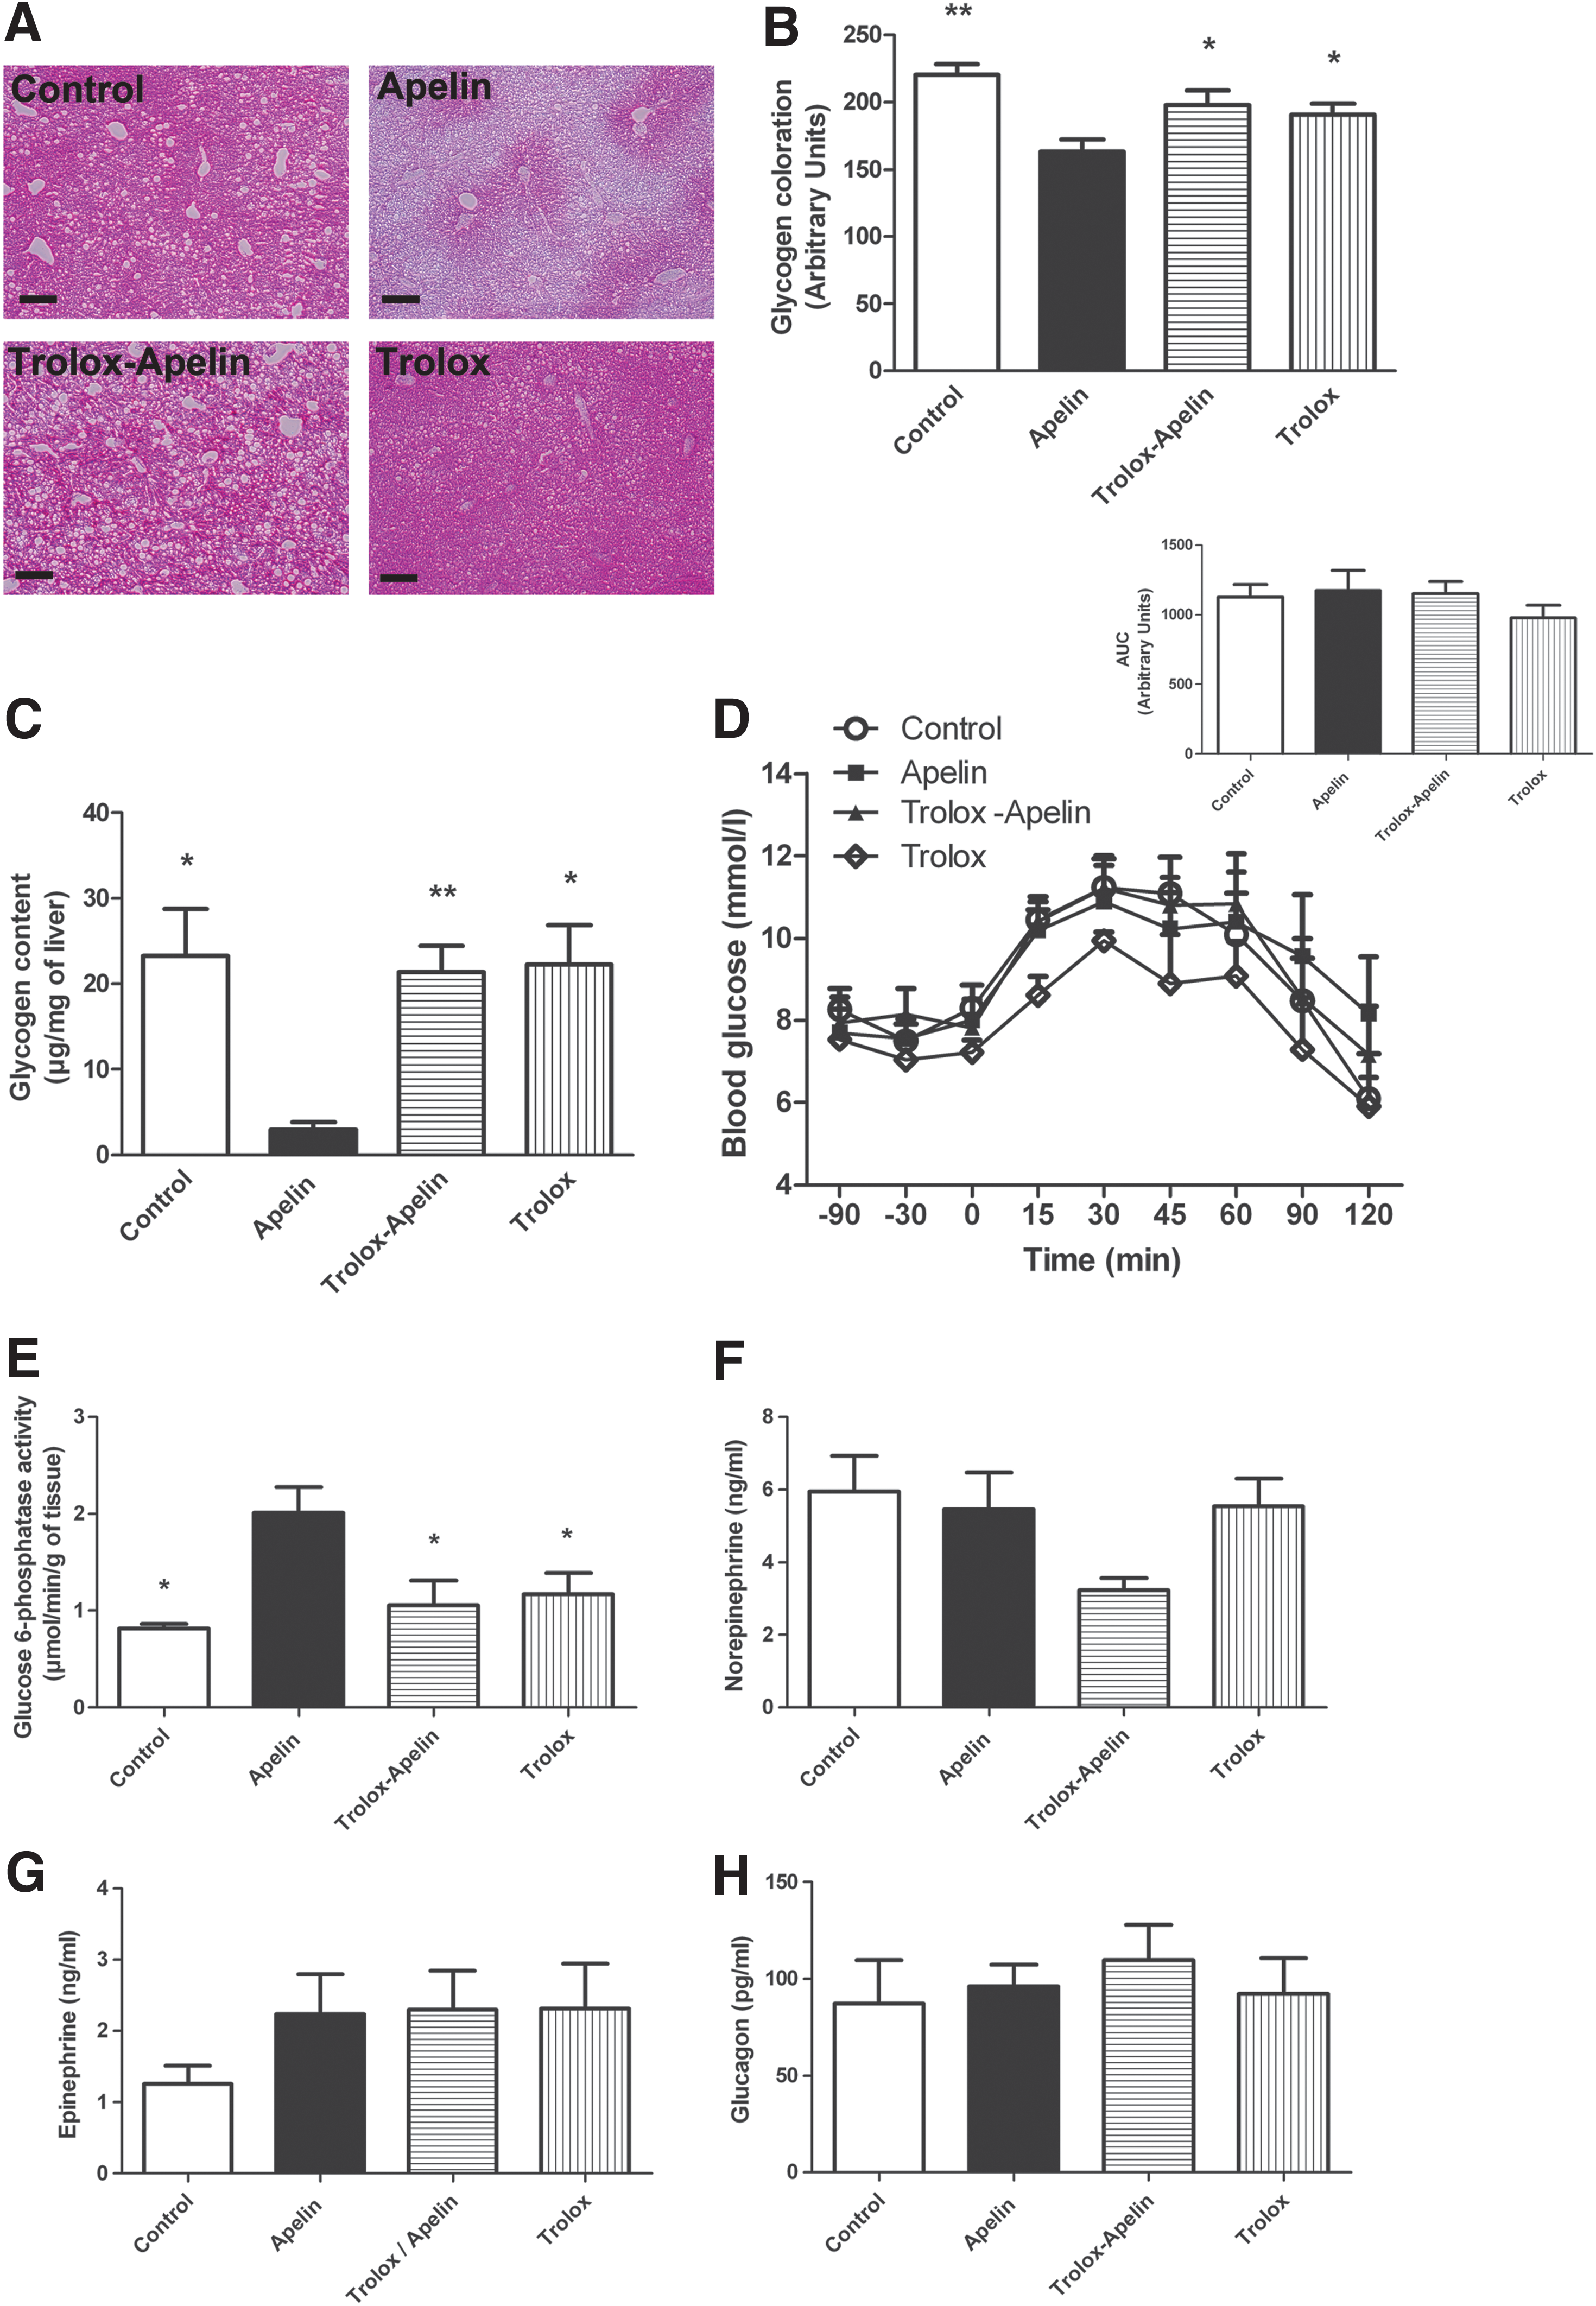
During fasting, the liver is the principal organ able to release glucose via the activation of glycogenolysis and/or gluconeogenesis. The brain, and more specifically the hypothalamus, contributes to the regulation of liver glucose metabolism during fasting via the ANS. To test whether hypothalamic apelin/ROS triggers fasted hyperglycemia by mechanisms involving the liver, we measured the consequence of icv apelin±trolox on glycogenolysis and gluconeogenesis in fasted mice. An acute icv injection of apelin decreased hepatic glycogen content as observed by histological (Fig. 2A, B) and biochemical (Fig. 2C) measurements. Consistent with the effect observed in the hypothalamus, trolox treatment abolished the activation of hepatic glycogenolysis in apelin icv-injected mice (Fig. 2A–C). Then, in response to an intraperitoneal pyruvate injection, apelin significantly increased glycemia, demonstrating an activation of liver gluconeogenesis (Fig. 2D). Similar to glycogenolysis, icv apelin effect on gluconeogenesis is blocked by icv trolox.
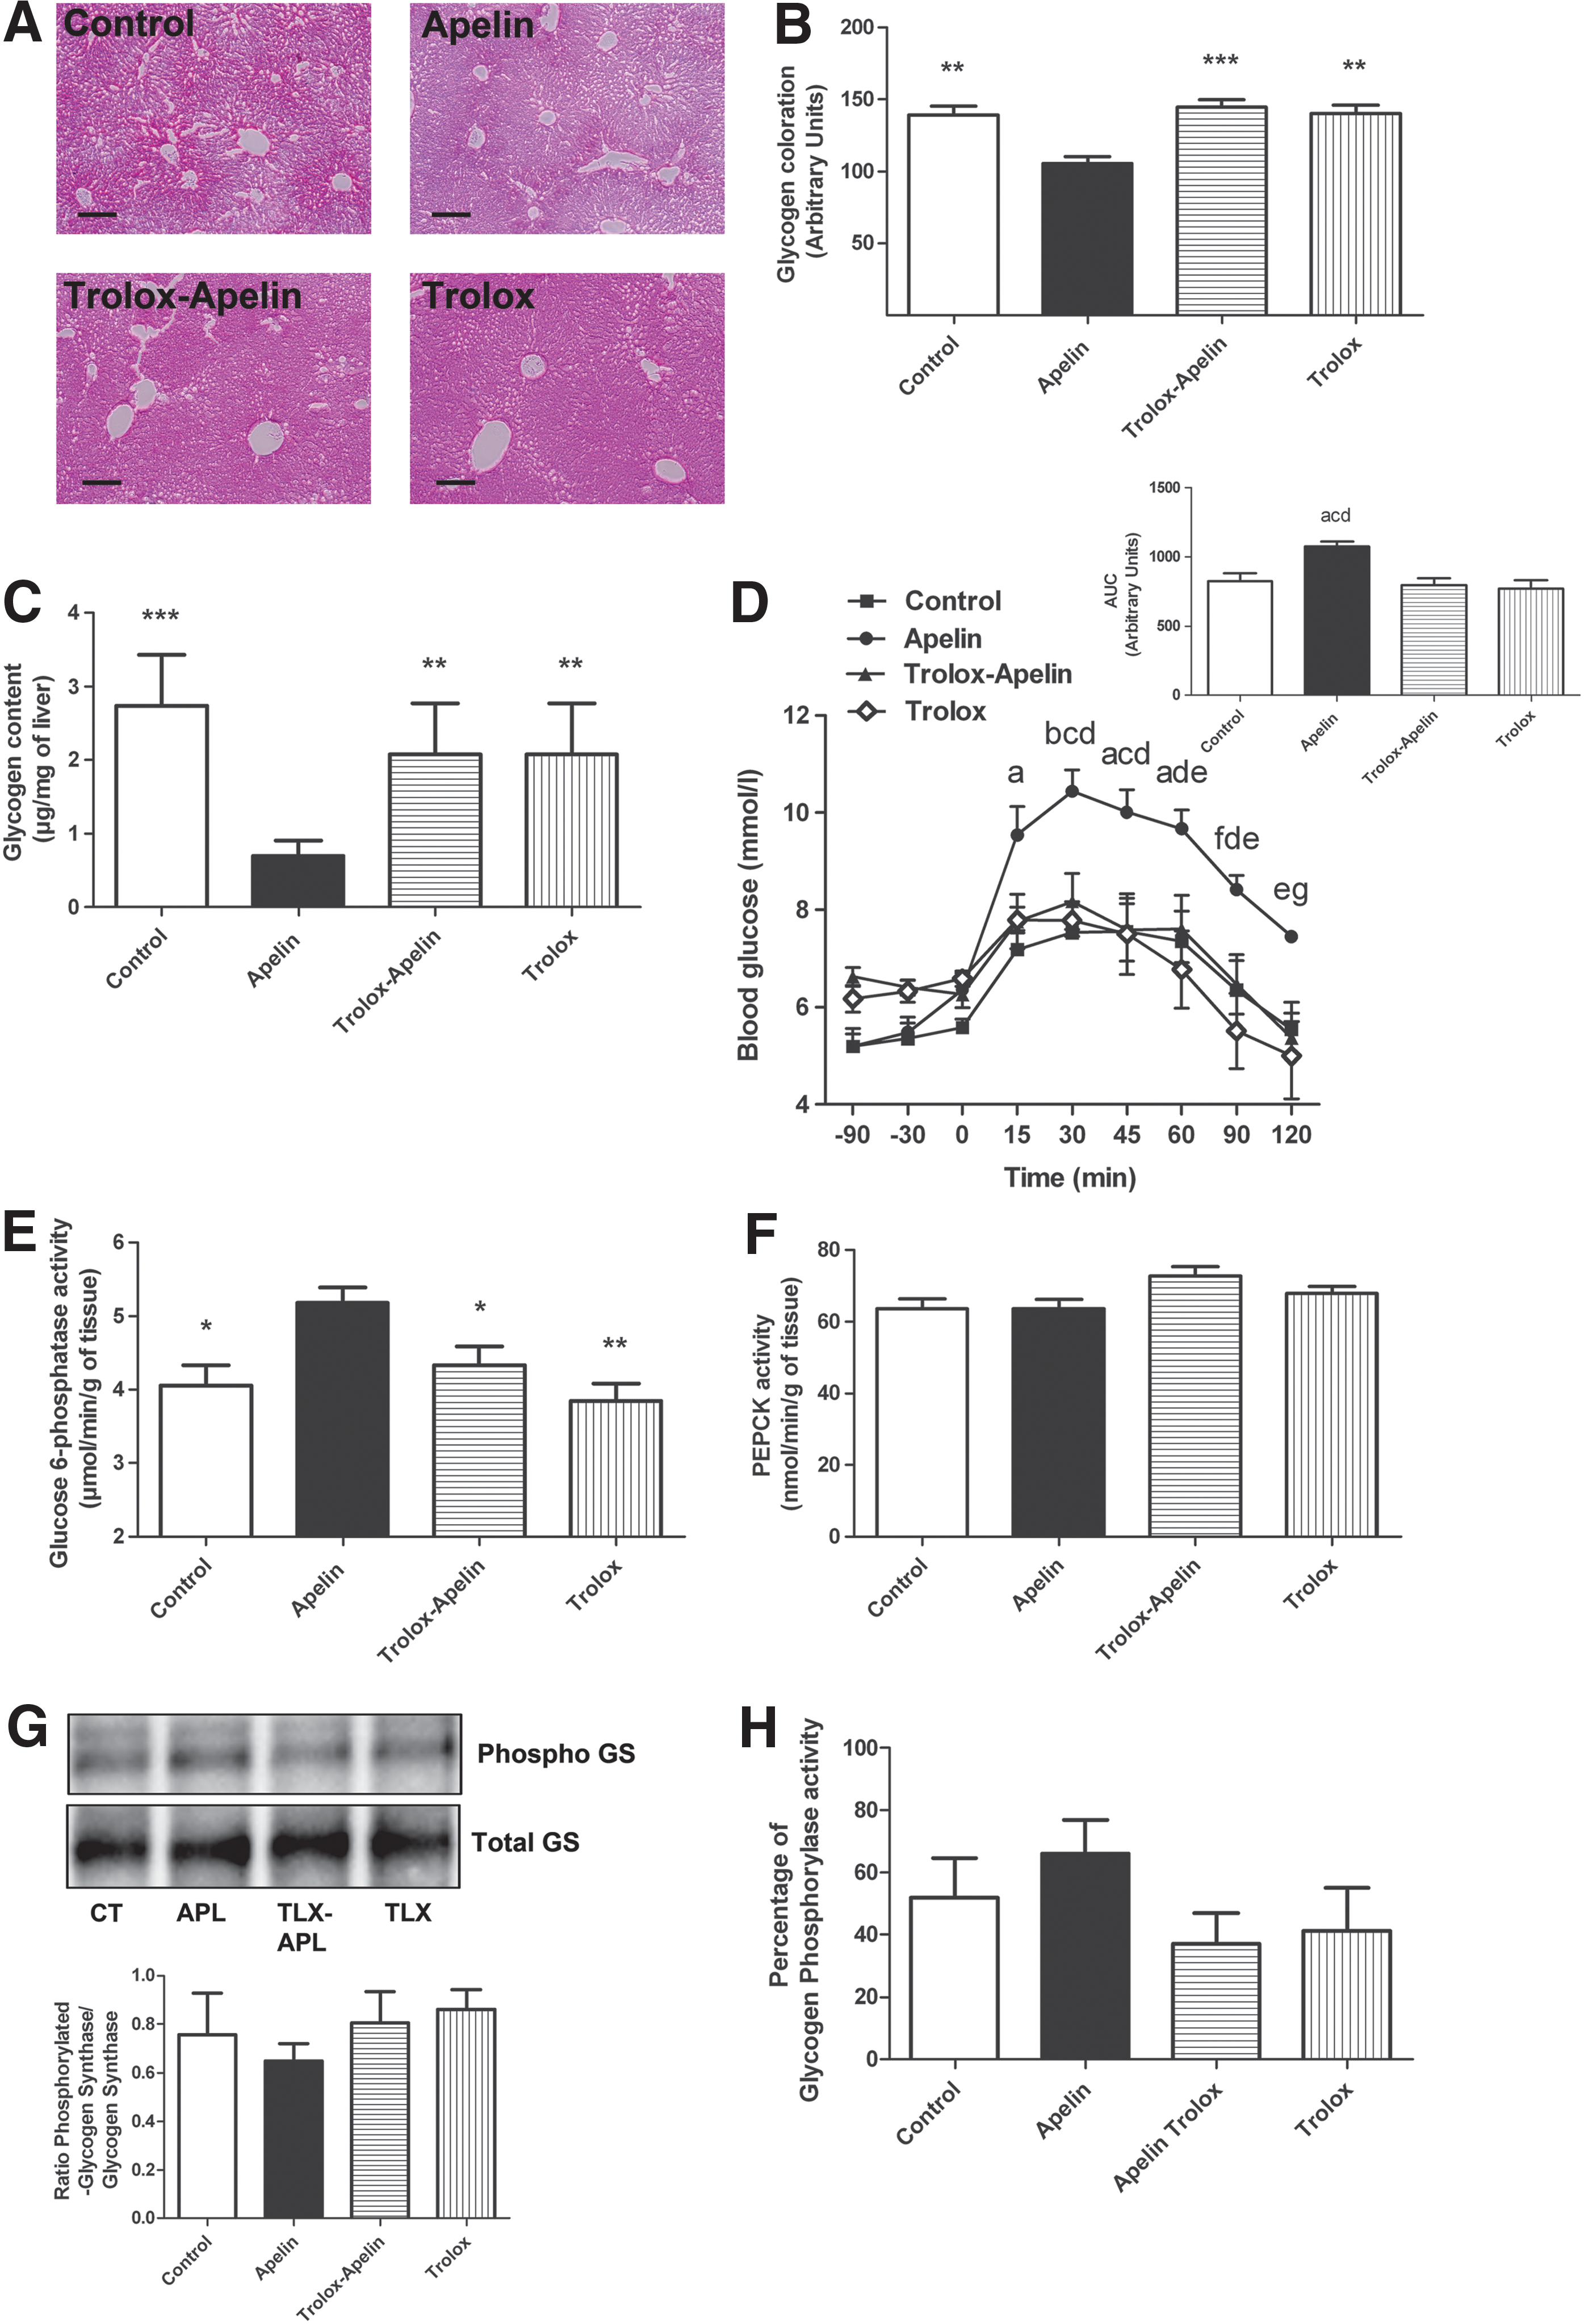
Numerous enzymes are implicated in the control of glycogenolysis and/or gluconeogenesis. Among them, the activity of glucose 6-phosphatase (G6Pase), a key enzyme that is known to stimulate glycogenolysis and gluconeogenesis (1), was significantly increased in the liver of icv apelin-treated mice (Fig. 2E). This effect was blocked by icv trolox. No significant variation of phosphoenolpyruvate carboxykinase (PEPCK), glycogen synthase, and glycogen phosphorylase activities was observed in all experimental conditions (Fig. 2F–H). The effects of icv apelin on glucose metabolism were not associated to the modification of plasma triglycerides (TG) (Supplementary Fig. S2A), free fatty acid (FFA) (Supplementary Fig. S2B), ketone bodies (Supplementary Fig. S2C), liver TG (Supplementary Fig. S2D), and lipid (Supplementary Fig. S2E) content.
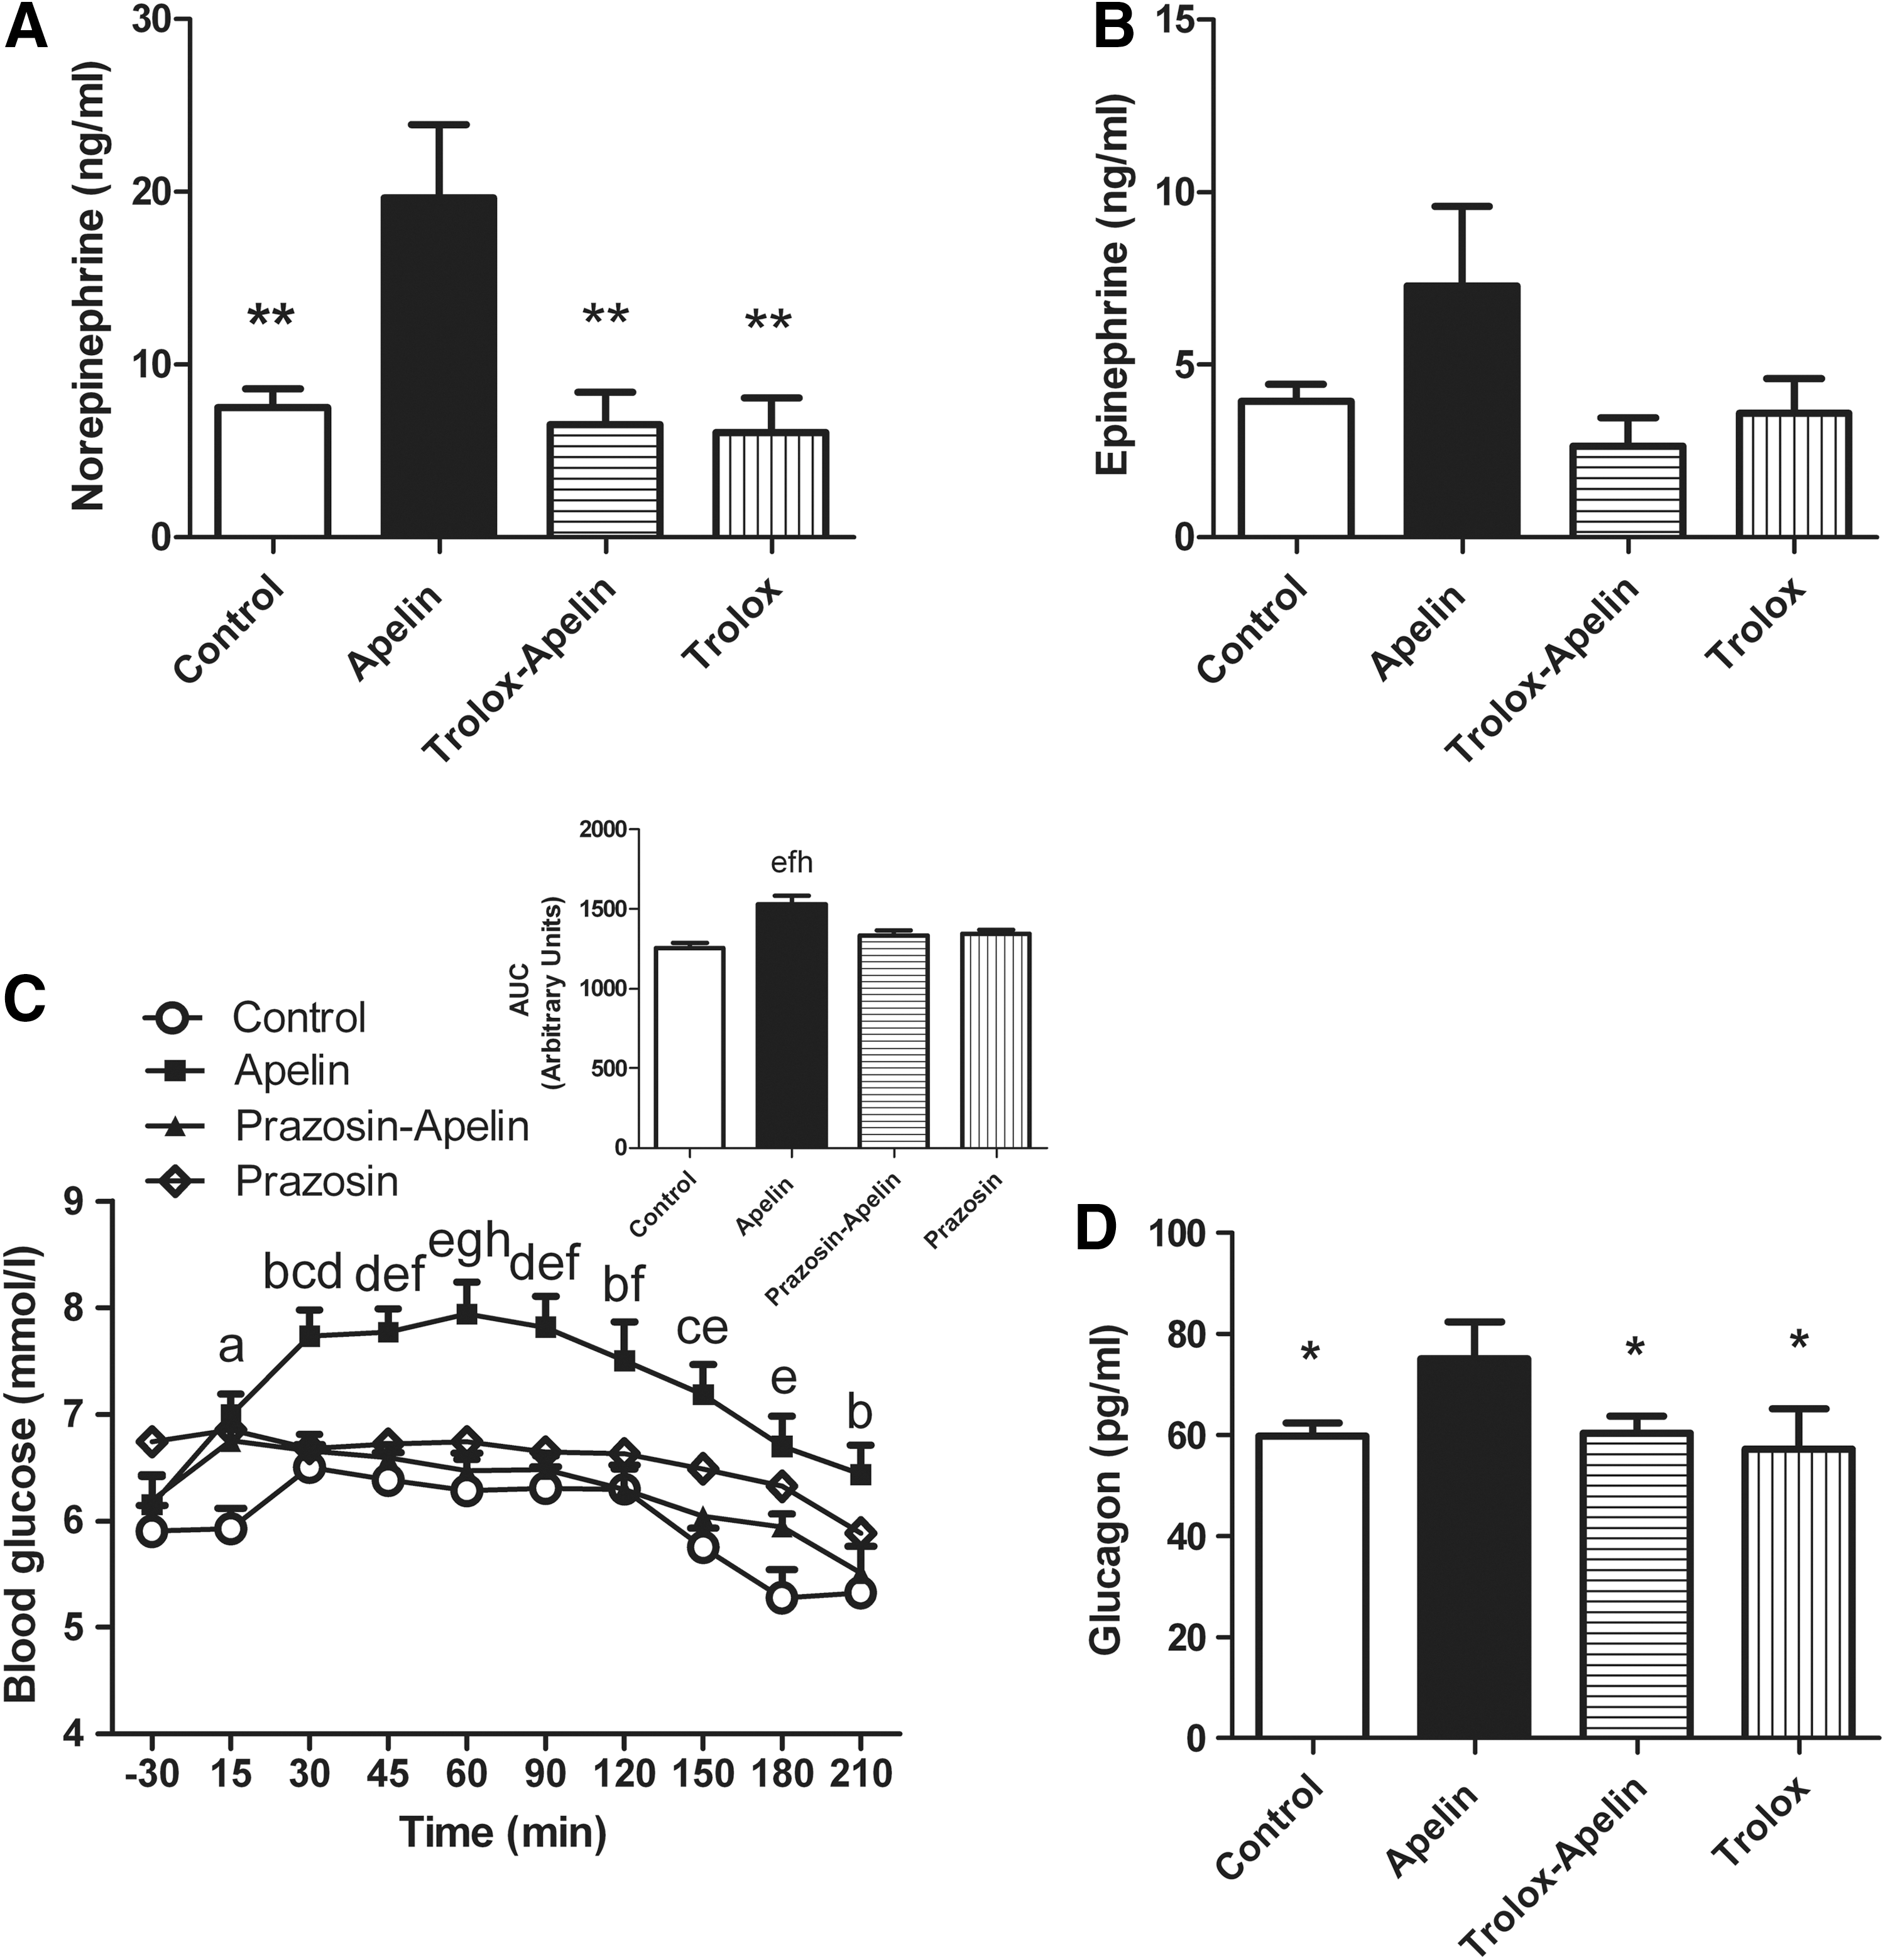
Given that the sympathetic nervous system (SNS) controls glycogenolysis and gluconeogenesis, we measured norepinephrine release in the blood of icv apelin±trolox-treated mice as an index of SNS activation. Norepinephrine levels were significantly higher in response to icv apelin than control mice, but not in icv apelin/trolox or trolox-alone treated mice (Fig. 3A). No significant variation of plasma epinephrine was observed (Fig. 3B). Alpha(1) adrenergic receptors are the principle receptors implicated in the control of hepatic glucose metabolism in mice (28). An intraperitoneal injection of prazosin, an alpha(1) adrenergic receptors antagonist, prevented icv apelin-induced hyperglycemia (Fig. 3C), thereby demonstrating the existence of a central apelin-SNS-liver signaling pathway. In addition to an alpha(1) adrenergic receptors-mediated effect on glycemia, activation of SNS by icv apelin is associated to an increase in plasma glucagon release (Fig. 3D), which further stimulates hepatic glucose production (41).
Apelin over-expression in the medio-basal hypothalamus stimulates hepatic glycogenolysis and gluconeogenesis
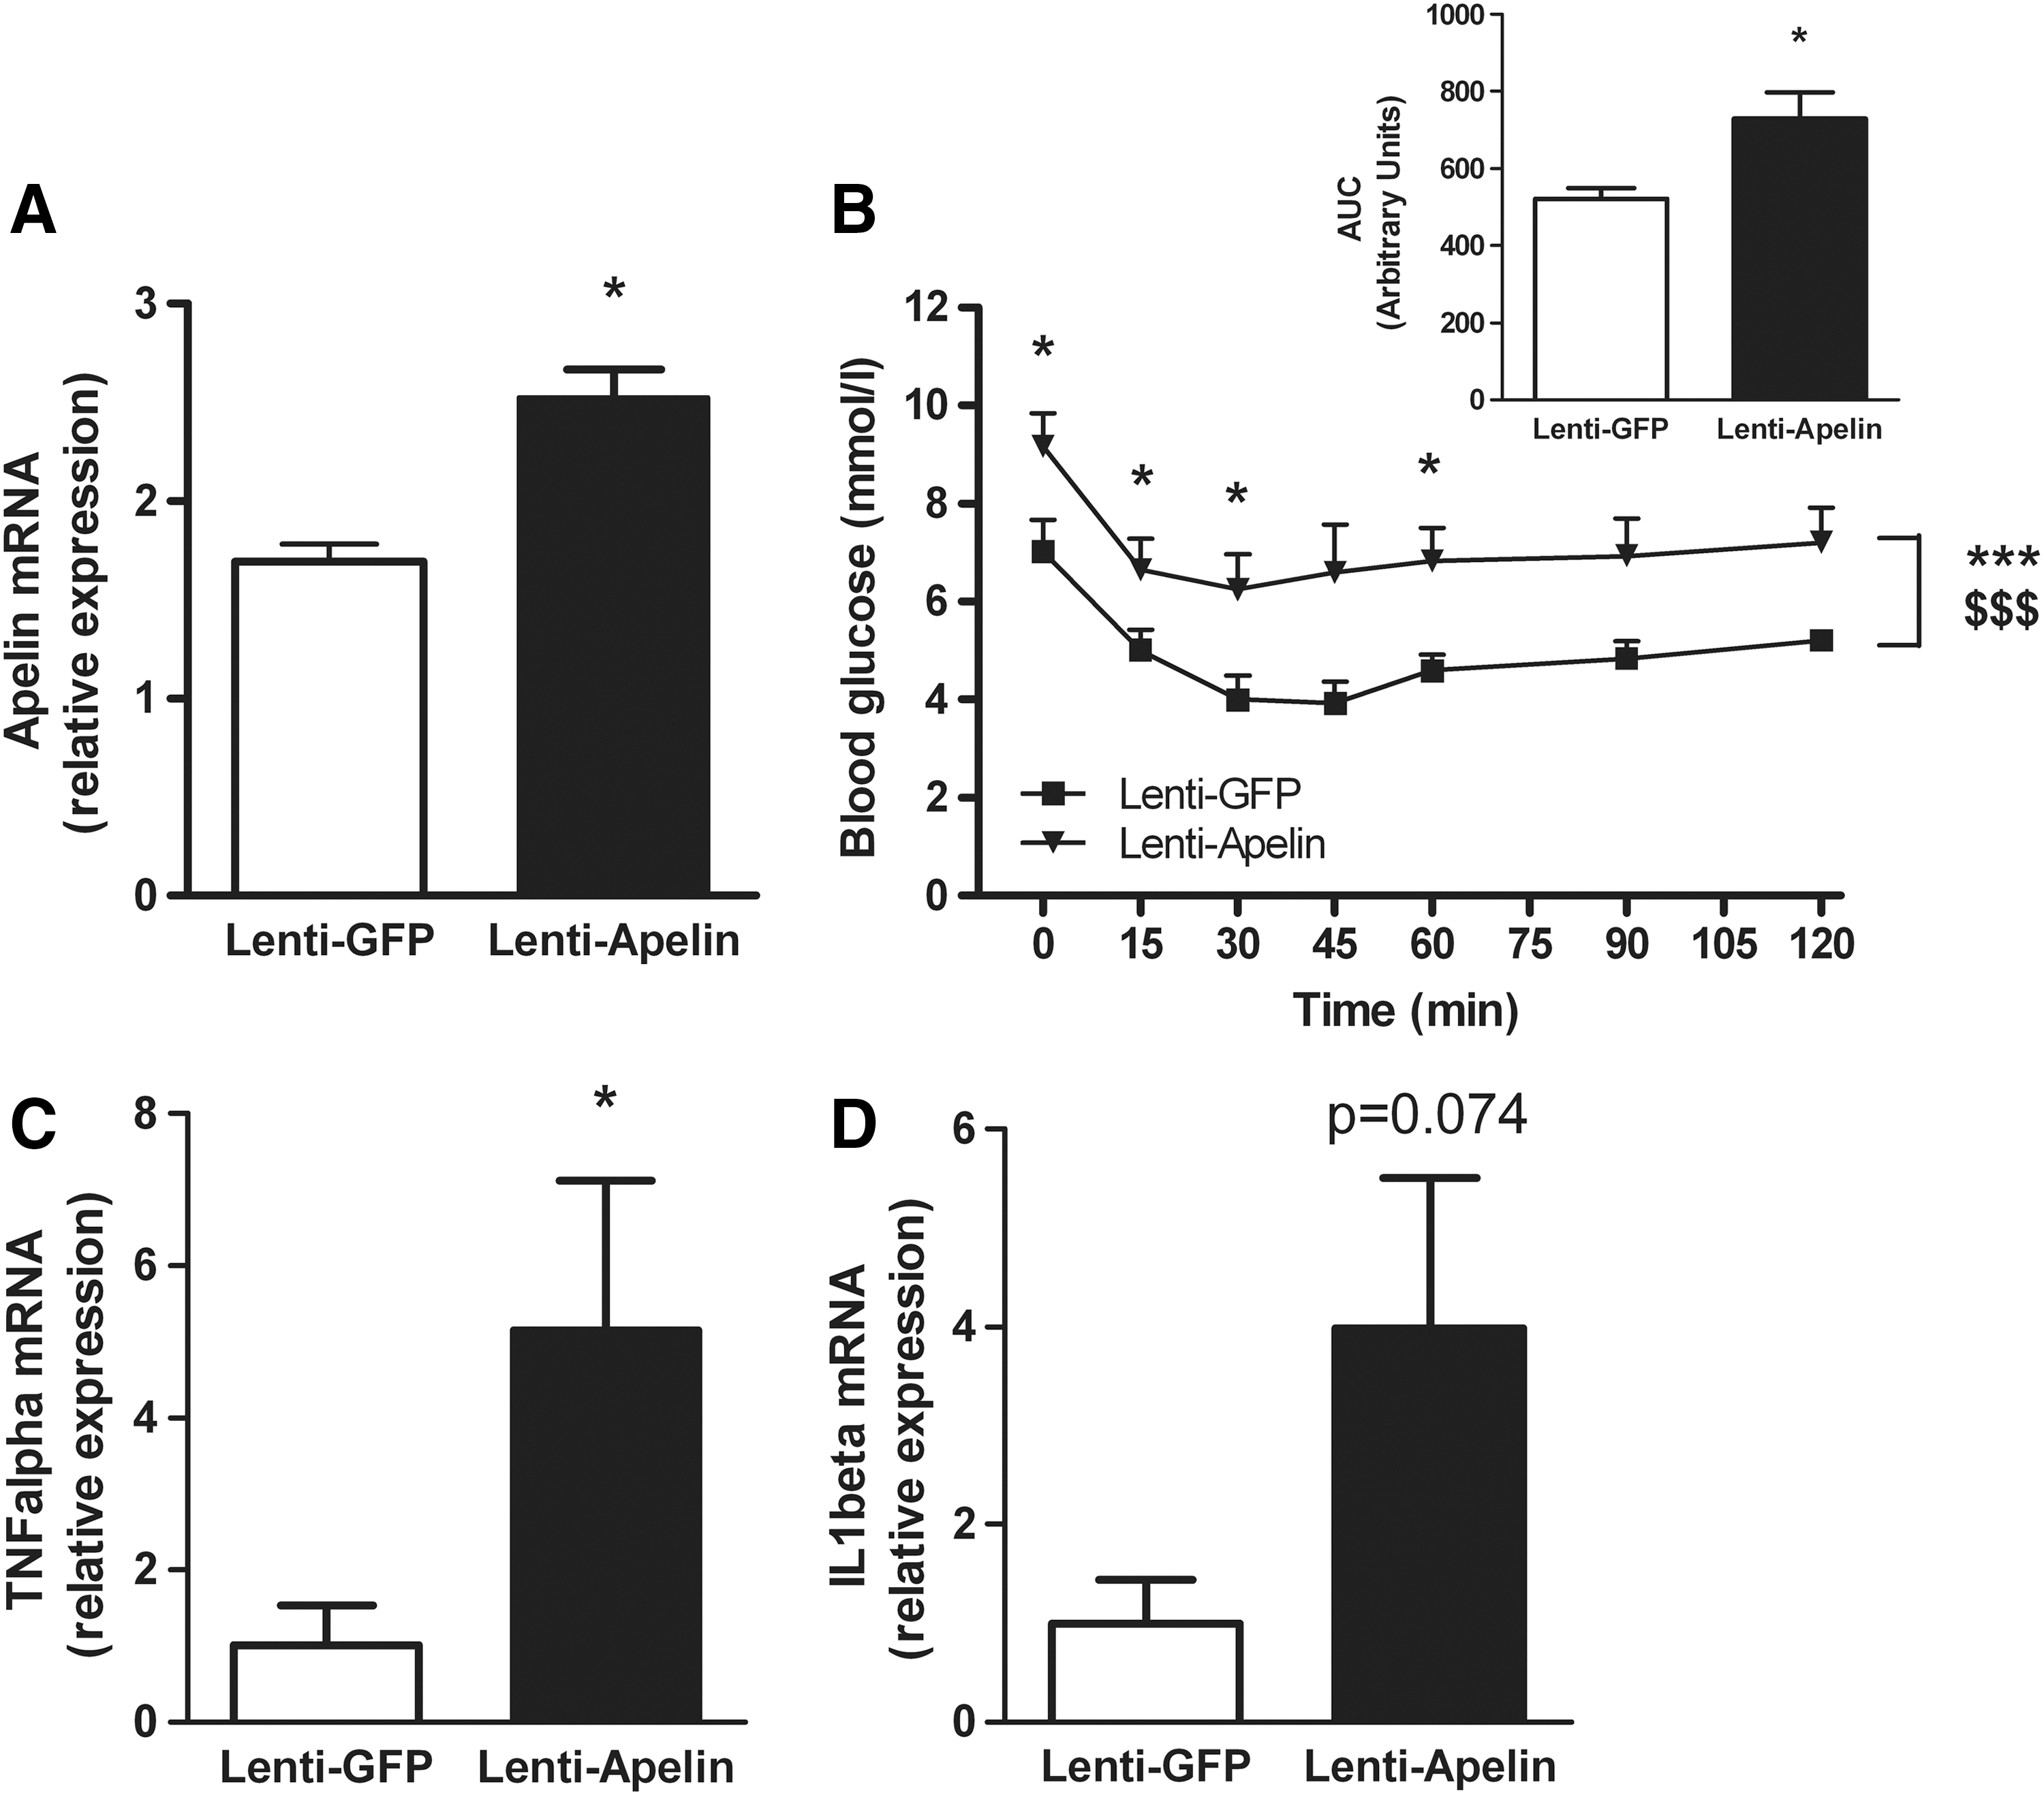
We have previously demonstrated that the medio-basal hypothalamus (MBH) is a hypothalamic target of apelin action on peripheral glucose homeostasis, as c-Fos expression is increased in the MBH of hyperglycemic apelin icv-injected mice (11). Moreover, electrical stimulation of ventro-median hypothalamus stimulates hepatic glucose release (48). To determine whether apelin controls liver function via an action on MBH, we injected apelin-expressing lentivectors specifically in the MBH of normal mice. Four weeks after infection, the level of apelin mRNA was significantly increased in the MBH of mice that received apelin-expressing lentivectors (Fig. 4A). The relative expression of apelin mRNA was increased by about 1.5-fold, similar to that observed at the protein level in obese/diabetic mice (42), demonstrating that this over-expression of apelin in normal mice corresponds to the level found in pathological conditions. To identify the impact on glucose homeostasis, we performed insulin tolerance test (ITT). Lentivectors apelin-infected mice presented fasted hyperglycemia and an insulin intolerance typical features of type 2 diabetes (Fig. 4B). This metabolic phenotype was associated to an increase in TNFalpha mRNA expression in the hypothalamus of lentivectors apelin-infected mice (Fig. 4C), suggesting an increase in hypothalamic inflammation that is clearly associated to a diabetic state (51); whereas hypothalamic IL1beta mRNA tends to increase in lentivectors apelin-infected mice, but did not reach significance (p=0.074, Fig. 4D). This inflammatory state was specific to the hypothalamus, as we did not observe any modification of mRNA TNFalpha and IL1beta expressions in the liver and adipose tissues (Supplementary Fig. S3C–H). In this chronic apelin expressed model, we showed no significant difference in plasma apelin (Supplementary Fig. S4F) and liver apelin/APJ mRNA expressions (Supplementary Fig. S3A, B) between the two experimental groups, suggesting that central control of apelin did not affect its own release in periphery.
Then, we measured the impact of apelin over-expression in the MBH on liver glucose metabolism. Hypothalamic apelin over-expression decreased liver glycogen content (Fig. 5A–C) and increased gluconeogenesis (Fig. 5D). This metabolic phenotype was associated to an increase in G6Pase activity during fasted state (Fig. 5E), but not PEPCK (Fig. 5F), glycogen synthase (Fig. 5G), and glycogen phosphorylase (Fig. 5H). No signification modification of plasma TG (Supplementary Fig. S4A), FFA (Supplementary Fig. S4B), ketone bodies (Supplementary Fig. S4C), liver TG (Supplementary Fig. S4D), and lipid content (Supplementary Fig. S4E) was observed between the two groups. This result clearly demonstrates that the diabetic state generated by apelin over-expression in the MBH is not associated to the modification of lipid metabolism, but specifically links to direct alteration of glucose metabolism.
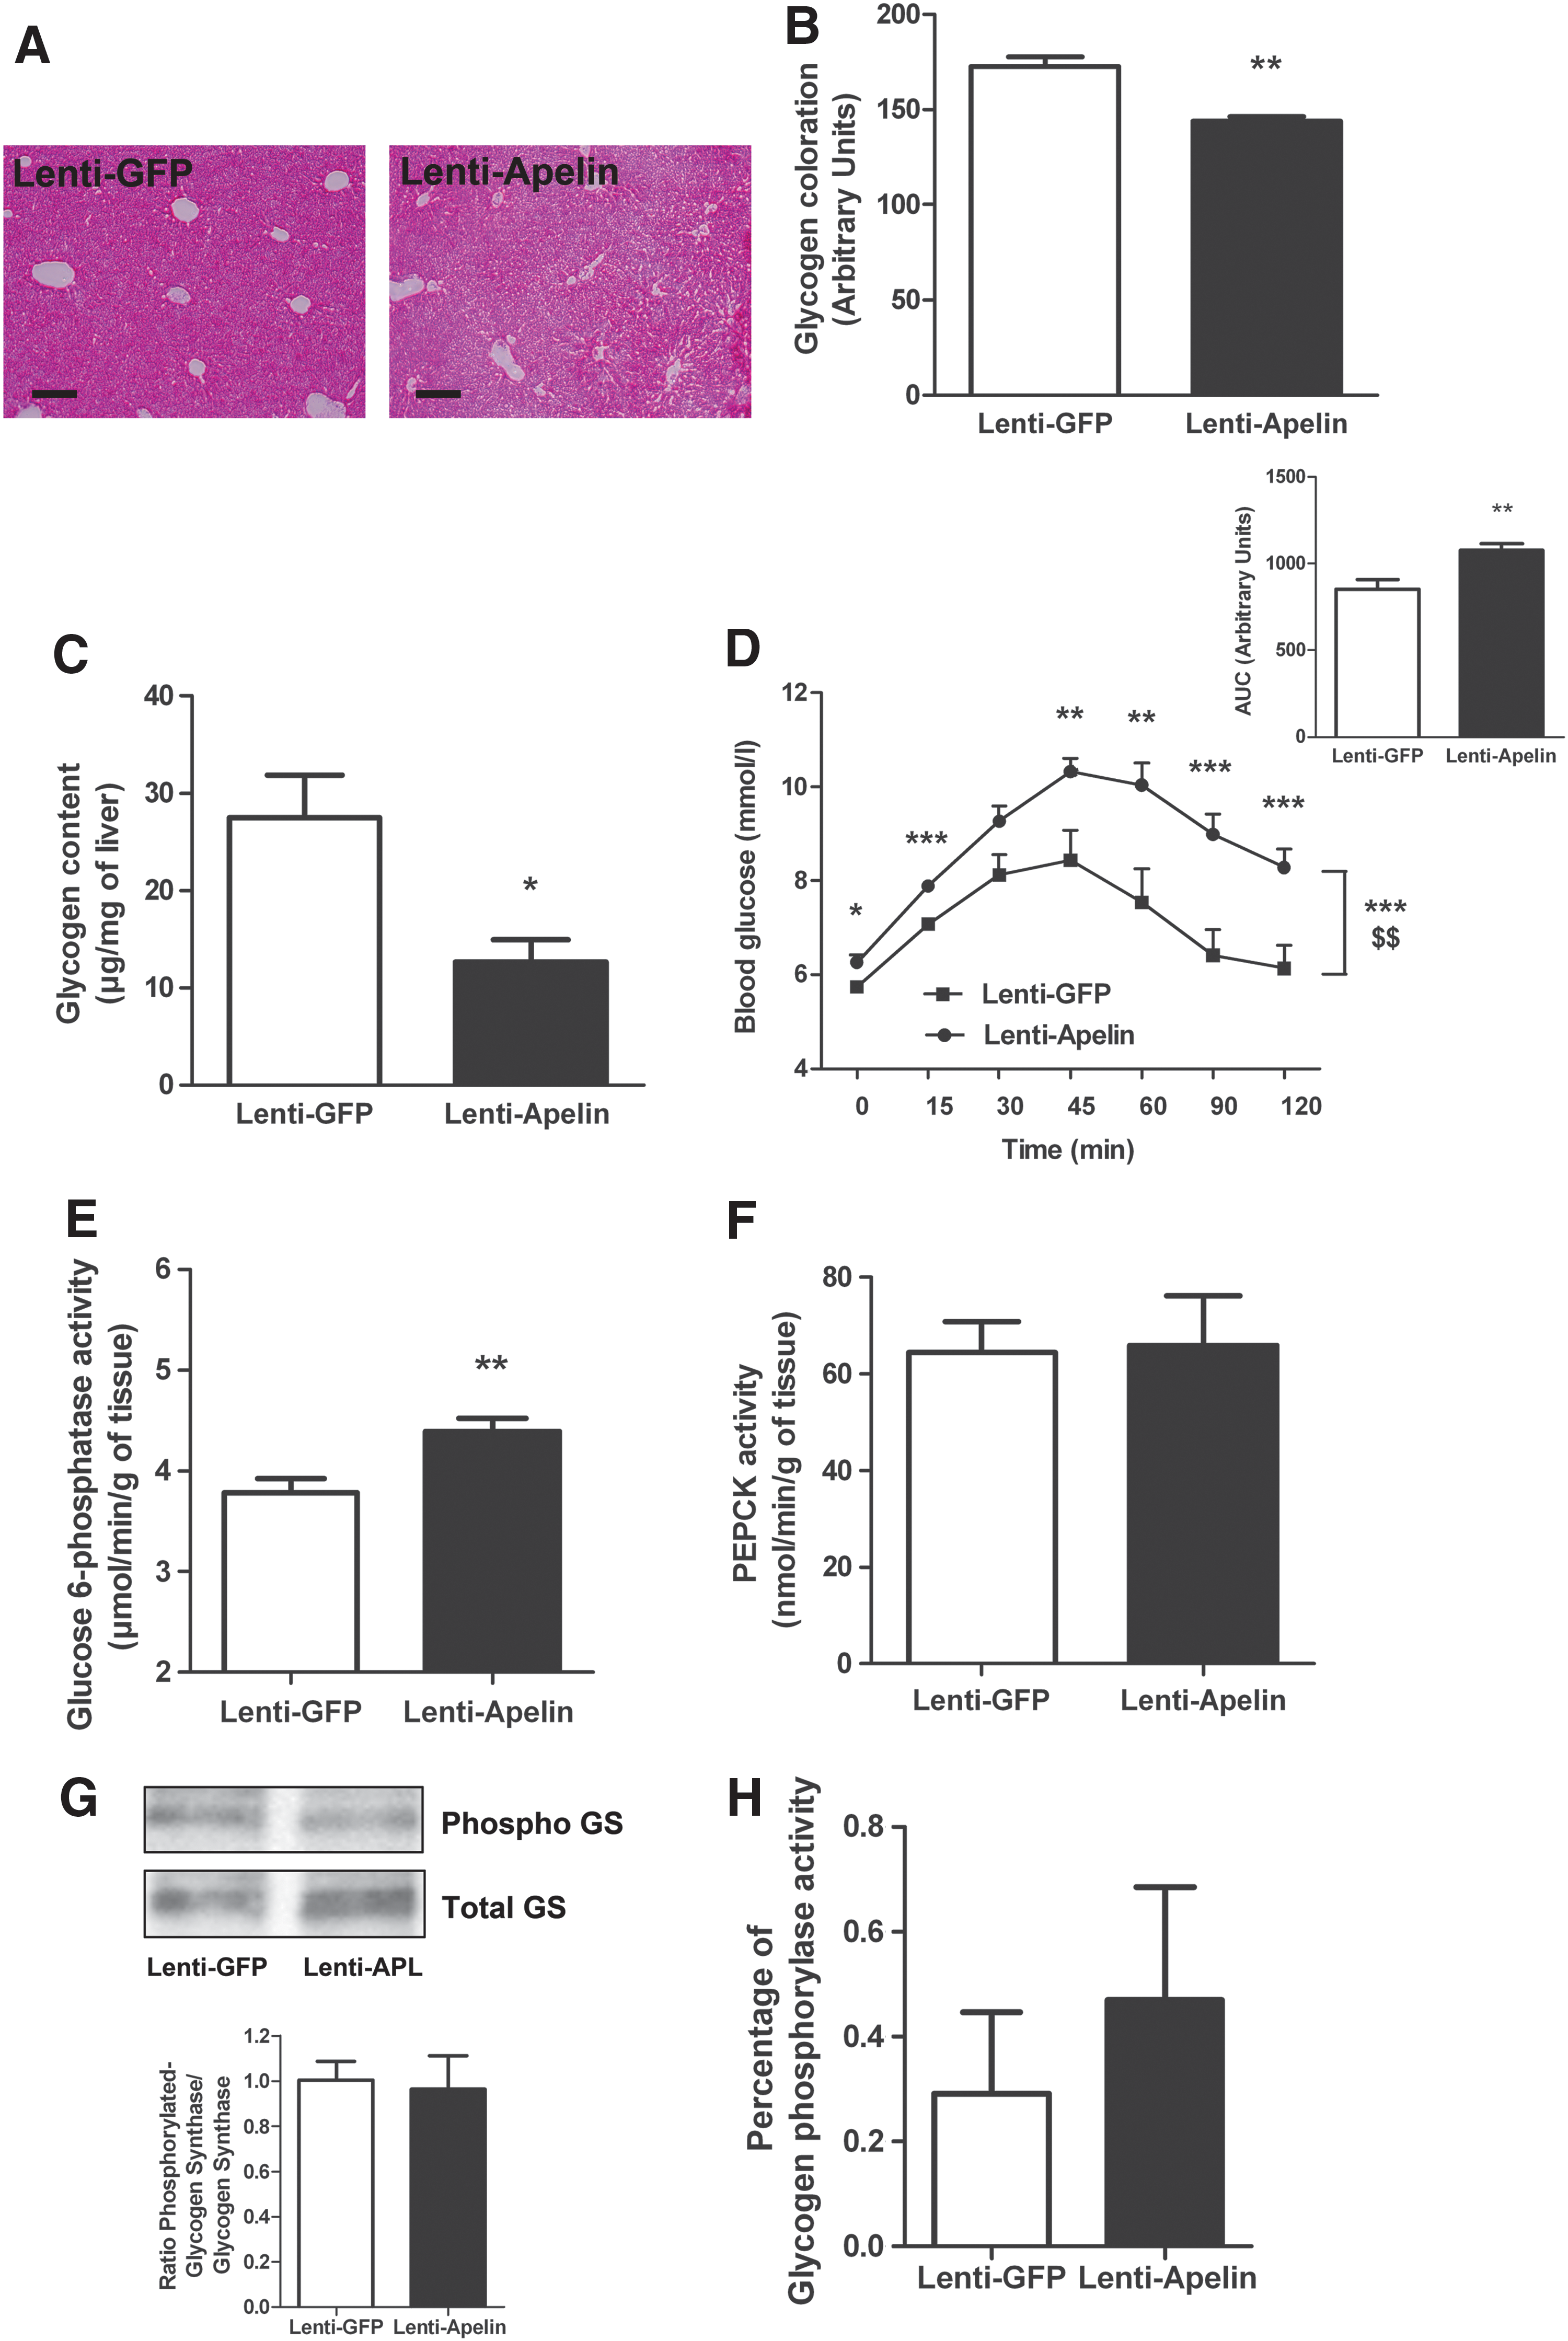
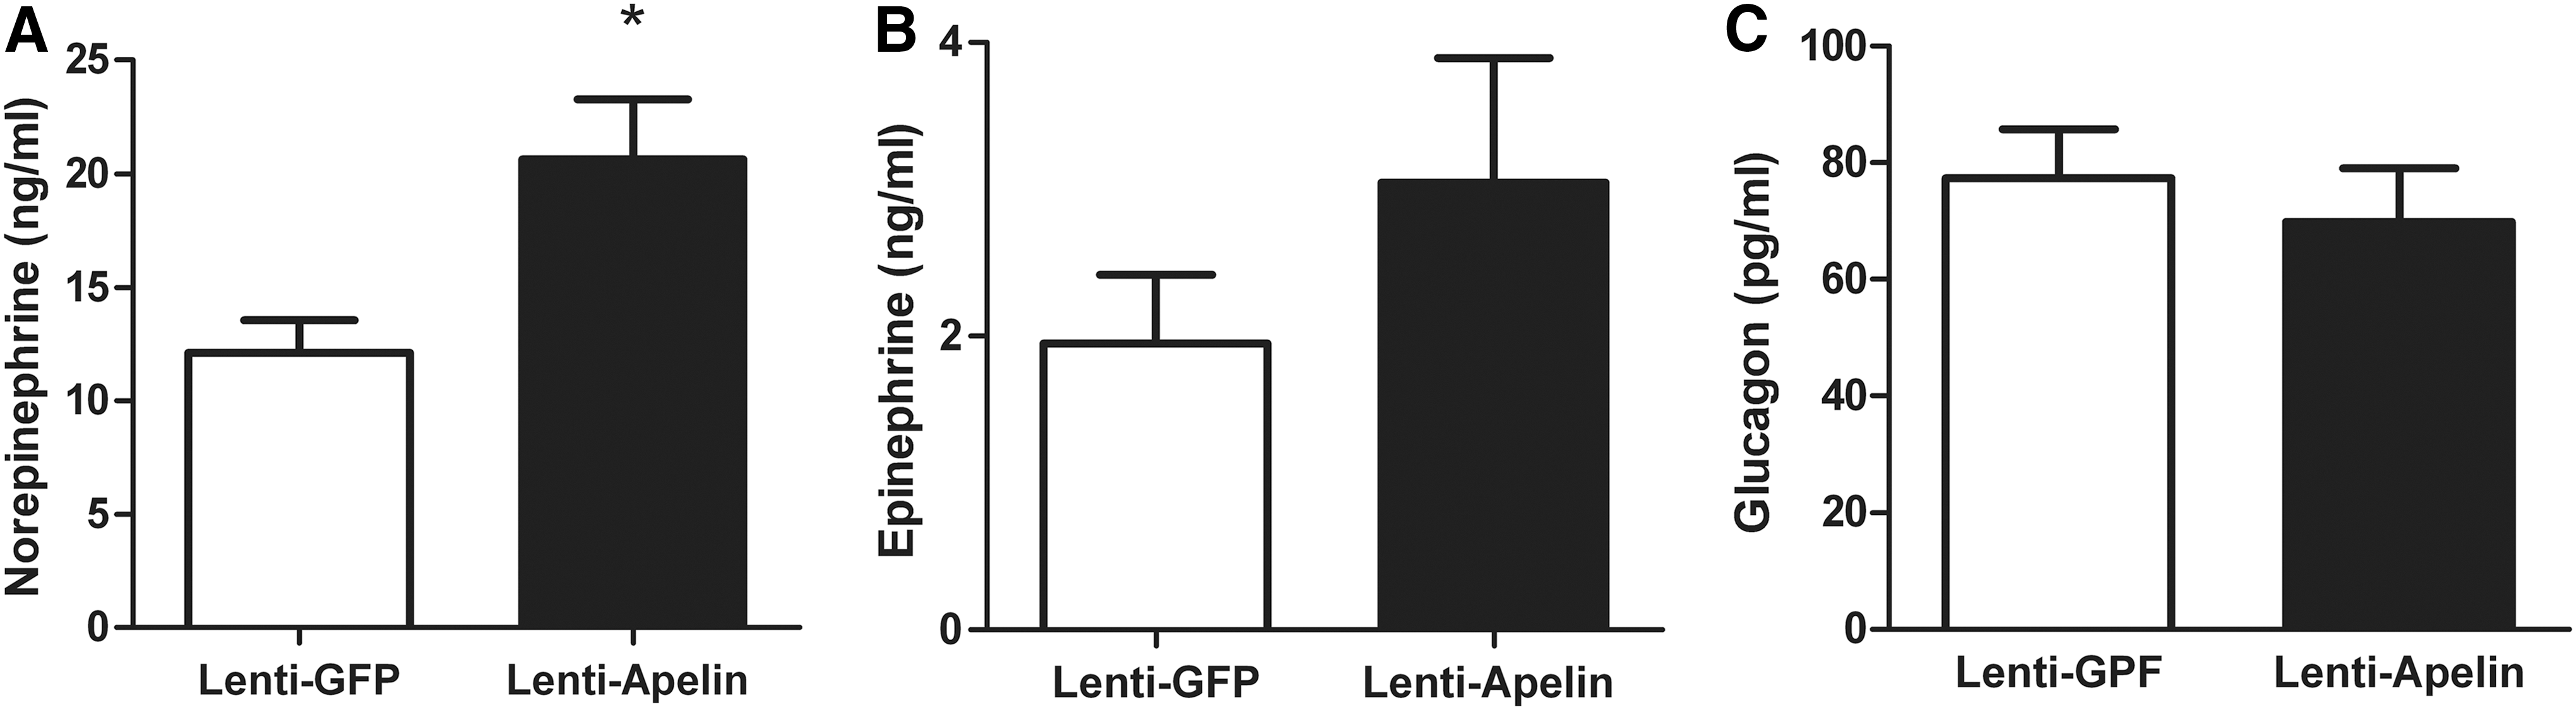
Similar to that observed in response to an acute apelin injection (Fig. 3A, B), apelin over-expression in the MBH was associated to an increase in plasma norepinephrine (Fig. 6A), but not epinephrine (Fig. 6B), showing the over-activation of SNS. On the contrary, we did not observe any significant difference in plasma glucagon (Fig. 6C), suggesting that SNS over-activation coupled to modification of G6Pase activity was sufficient to generate a diabetic state.
Antioxidants counterbalanced icv apelin-induced fasted hyperglycemia in obese/diabetic mice
We previously found that glycemia of HFD obese/diabetic mice could further increase in response to acute icv apelin injection (11), suggesting that the hypothalamic to liver axis is functionally still able to respond to a central stimulation by releasing hepatic glucose. Here, we showed that icv trolox completely abolished the hyperglycemic effect of apelin in HFD mice (Fig. 7A, B), suggesting that the hypothalamic apelin/ROS pathway was still effective.
Apelin amplifies the H2O2 release by the hypothalamus of obese/diabetic mice
The hypothalamic ROS signaling pathway is profoundly altered in obese/diabetic mice participating in an insulin-resistant state (15). Similar to that performed in normal mice, we measured real-time H2O2 release in response to apelin on hypothalamic explants from HFD mice. In this pathological model, apelin stimulated an exacerbated H2O2 release in the hypothalamus, and this was counterbalanced by trolox treatment (Fig. 7C).
Central apelin stimulates glycogenolysis but not gluconeogenesis via hypothalamic ROS in HFD mice
The liver is one of the most important organ in glucose homeostasis whose activity is deeply disturbed during metabolic diseases (36). Indeed, previous data demonstrate that gluconeogenic activity of the liver of obese/diabetic mice is exacerbated (55). We demonstrated that HFD mice are able to increase quickly fasted glycemia (Fig. 7A, B) on apelin treatment; this corresponds to the activation of glycogenolysis but not gluconeogenesis (45 –48). In accordance to glycemia, hepatic glycogenolysis was activated by icv apelin and blocked when icv trolox was co-injected (Fig. 8A–C). Acute icv apelin injection in HFD mice did not significantly modify gluconeogenic function in the liver (Fig. 8D). The decrease of glycogen content was mirrored by an increase in liver G6Pase activity (Fig. 8E) without modification of PEPCK, glycogen phosphorylase, and glycogen synthase (Supplementary Fig. S5A–C). Plasma norepinephrine, epinephrine, and glucagon concentrations did not vary in our experimental conditions (Fig. 8G, H).
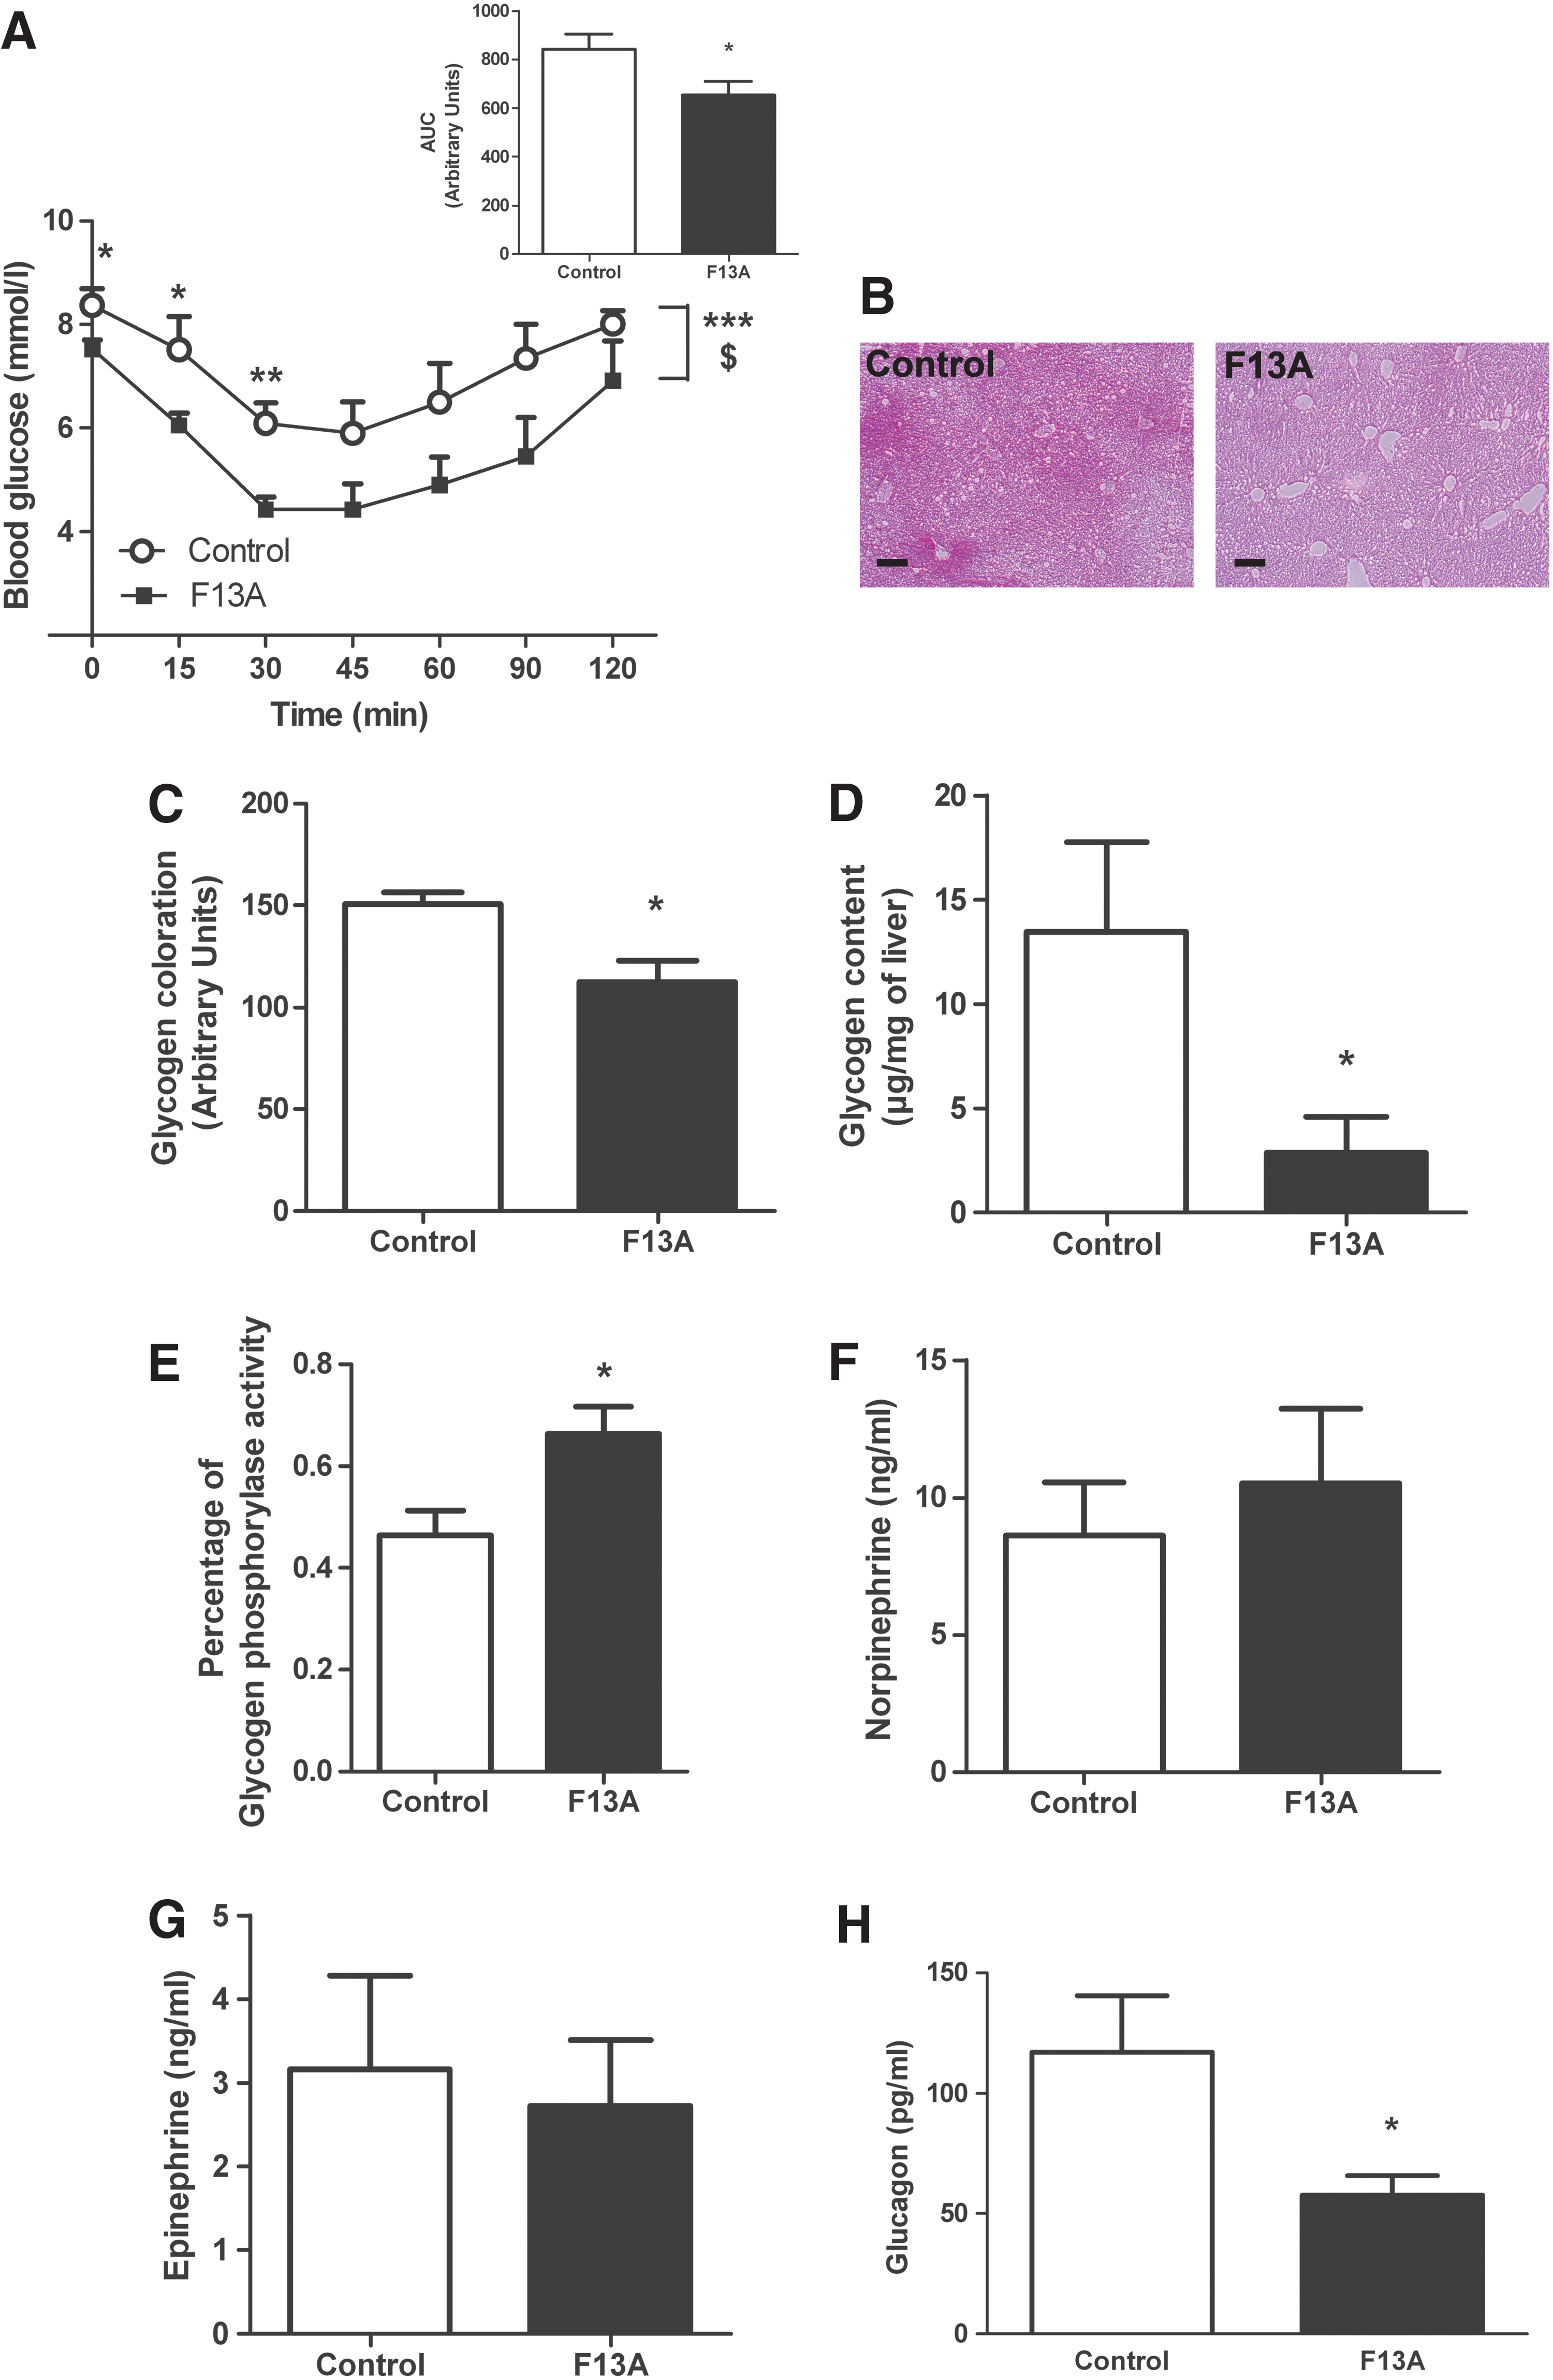
Blockade of central apelin ameliorates diabetic state of HFD mice
Our data show that a high level of central apelin participates in the establishment of a type 2 diabetes. To test whether blockade of apelin action in the hypothalamus could be a major target to restore a fasted normal glycemia, we have daily injected icv mice with an APJ antagonist, F13A, during 2 weeks after 3 months of HFD. Our data show that icv F13A decreased fasted hyperglycemia and insulin intolerance in HFD mice (Fig. 9A). HFD mice presented a decrease in glycogen content (Fig. 9B–D) at a level similar to that measure in normal mice (Fig. 2C), demonstrating an amelioration of the diabetic state in HFD mice. This phenotype is associated to an increase in liver glycogen phosphorylase activity, which could explain the low level of glycogen store (Fig. 9E). The activities of G6Pase, PEPCK and glycogen synthase did not vary between the two groups (Supplementary Fig. S6A–C). Plasma norepinephrine and epinephrine did not vary between the two groups of mice (Fig. 9F, G). Plasma glucagon concentration was decreased in F13A mice as compared with control HFD mice (Fig. 9H), thereby suggesting that chronic central apelin blockade improves glucose homeostasis regulation during diabetic state.
Discussion
Hypothalamic apelin is implicated in the control of peripheral glucose utilization in normal and pathological conditions (11). In the present study, we have identified for the first time the hypothalamic molecular signaling pathway implicated in deleterious effect of apelin. Moreover, we report that the couple apelin/ROS in the hypothalamus controls hepatic glucose production via the SNS to induce peripheral hyperglycemia.
The role of central apelin in the control of glucose homeostasis is poorly defined. We were the first to demonstrate that central apelin may have beneficial or deleterious effects on glucose homeostasis depending on the injected dose and/or the nutritional state (11). Indeed, an injection of a low dose of icv apelin induces an increase in glucose tolerance in normal mice. This result suggests that the slight increase of plasma apelin concentration observed in fed state in normal mice may reach the hypothalamus, a neurohemal structure which facilitates communications with peripheral hormones (25), to decrease glycemia in fed state (11). On the contrary, obese/diabetic mice fed a HFD show a disruption of circadian apelin regulation (11). Then, over-increased hypothalamic apelin expression observed in obese/diabetic (11, 42) is associated to abnormal regulation of glycemia (11). To reinforce this hypothesis, an icv injection of a high dose of apelin (used in this study and similar to that observed in obese/diabetic mice) in normal mice induces fasted hyperglycemia and insulin resistance (11), characterizing a type 2 diabetes. The liver is the main organ that is able to release glucose in fasted state via glycogenolysis and/or gluconeogenesis (30). Thus, we focused our attention on the hypothalamic apelin to liver axis in normal and physiopathological conditions. In all the models investigated, central apelin stimulated hepatic glucose production and release via glycogenolysis and/or gluconeogenesis. Importantly, the previously described kinetics of glucose release by the liver (glycogenolysis within minutes; gluconeogenesis within hours) (45, 46, 48) clearly fits with our two waves of increased glucose release induced by icv apelin injections. The only exception of this concept is observed in HFD mice, where an icv apelin injection did not modify gluconeogenesis (Fig. 8D). This result is in accordance with data from literature showing that liver gluconeogenesis is over-activated during metabolic disorders (55), leading to hypothesize that icv apelin treatment is not able to stimulate more than possible the hepatic glucose production. Moreover, these results could be correlated to the absence of stimulatory action of icv leptin on liver gluconeogenesis in over-feeding rats as opposed to normal chow-fed rats (34). In our experimental procedure, it is difficult to evaluate the potential variation of glycogenic and/or gluconeogenic enzymes activities in response to icv apelin. It is worth noting that the electrical stimulation of the hypothalamus stimulates hepatic glucose release in a few minutes, but the kinetic of activation of enzymes precedes the effect. In fact, in response to hypothalamic stimulation, the activities of G6Pase in the liver are increased in ∼30 s (46). However, in a longer period of time, a sustained electrical stimulation of the ventro-median hypothalamus (20 s periods once every 3 min for 4 h) increases liver PEPCK activity after 120 min (49). Whether an acute stimulation of hypothalamic nuclei in response to icv apelin modifies enzymes activities in the liver within seconds or minutes remains to be determined. Our data suggest a kinetic of activation closed to this, as variations of glycemia are observed from 15 to 210 min in our protocol. For this reason, we evaluate the activities of four enzymes implicated in the control of glycogenolysis and/or gluconeogenesis in the liver in all experimental conditions after 30 min of icv treatment. Our data show that the central apelin effect on glycemia is associated to an increase in G6Pase activity in the liver, an enzyme which is known to be implicated in the control of glycogenolysis and gluconeogenesis, which is in close correlation with hyperglycemia. In spite of the absence of variations in PEPCK, glycogen synthase, and glycogen phosphorylase in normal conditions, lentivectors expressed apelin or HFD mice models, we cannot totally exclude an implication of those enzymes on hepatic glucose production in response to icv apelin. Indeed, due to a large range of time of kinetics of glycemia (from 0 to 210 min) which could make us miss interesting results, it will be easy to speculate that specific variations of one or more types of enzymes may vary during this time-course period.
The importance of ROS in the pathological state is well documented. Obese and insulin-resistant rodents present a profoundly altered hypothalamic mROS signaling (8). Indeed, metabolic abnormal responses are in close correlation with increased hypothalamic mROS level, leading to a constitutive oxidized environment at both the cellular and mitochondrial levels associated to a dysfunction in mitochondrial respiration (8). Here, we found that hypothalamic action of apelin needs an ROS/H2O2-dependent production to stimulate hepatic glucose release to induce fasted hyperglycemia. Using specific probes that detect H2O2 in real time, we demonstrate that exogenous apelin applied on hypothalamic explants from normal mice stimulates H2O2 release. Interestingly, this H2O2 release is exacerbated in hypothalamic explants from HFD mice. Those data are in accordance with literature linking high levels of hypothalamic mROS, and, in particular H2O2, are deleterious for the control of glucose homeostasis, and, more specifically, in diabetic models (23). Indeed, mitochondrial respiration that is considered the primary source of H2O2 (3) is profoundly increased in the hypothalamus of diabetic rodents in association with high levels of ROS (8). Our original approach to measure H2O2 is used here for the first time in ex vivo hypothalami and gives access to a new technology to determine the exact quantity of H2O2 release directly in tissue, which is of crucial importance to unravel the role of ROS in the biological process (32). Then, levels of H2O2 measured in our experimental conditions reinforced the hypothesis that an increase in H2O2 release by tissue is clearly associated to a pathological state (53).
In spite of the fact that apelin is known to have an antioxidant effect (16), some publications reveal that apelin may be considered a new oxidative marker. First, Yu et al. (58) suggest that high levels of plasma apelin observed in obese/diabetic patients may be not only the results of compensatory response to insulin resistance, but also a causative factor of insulin resistance. Then, apelin can participate in the establishment of an inflammatory and oxidative stress state observed in metabolic disorders. In neuronal cell culture, exogenous apelin treatment increases ROS production (57). Our data show that apelin effects on hepatic glucose metabolism are mediated by ROS in in vivo and ex vivo conditions. Such a deleterious environment caused by apelin in the hypothalamus may be one of the first signals triggering a diabetic state, that is, fasted hyperglycemia. The hypothesis of the existence of a link between apelin and inflammation is reinforced by our results demonstrating that apelin over-expression in the ventromedian hypothalamus increase the mRNA expression of the pro-inflammatory marker TNFalpha in the hypothalamus. This specific variation in hypothalamic inflammation generated by apelin, without modification of peripheral inflammation, is responsible for the emergence of a type 2 diabetic state, including fasted hyperglycemia and insulin intolerance (6). This diabetic phenotype is clearly linked with an increase in (i) G6Pase activity in the liver and (ii) plasma norepinephrine concentration. Then, alteration of hypothalamic signaling (i.e., ROS and inflammation) by apelin leads to type 2 diabetes characteristics.
The role of ANS in the control of glucose homeostasis is well established. Metabolic disorders are characterized by increased basal SNS activity but an impaired sympathetic response to various stimuli, such as insulin (18). Here, we show that basal norepinephrine level is increased in hypothalamic apelin over-expressing mice, suggesting an increase in basal SNS tone activity. These data are in accordance with those of Masaki et al. (27), who demonstrate that a microinjection of apelin into the paraventricular nucleus of the hypothalamus increases sympathetic nerve activity. Norepinephrine can exert its action in the whole body via alpha(1–2) and/or beta(1–2) receptors. In the liver of adult rodents, hepatic glucose production is regulated via alpha(1) receptors (28), as (i) blockade of alpha(2) receptors did not modify glycogenolysis (31), and (ii) beta receptors become irrelevant in the livers of mice at adulthood (13). Our data confirm the importance of alpha(1) regulatory pathway of glycemia, as blockade of alpha(1) adrenergic receptors failed to increase icv apelin-induced hyperglycemia. Whether SNS activation occurs early in the process or secondary to long-standing metabolic syndrome is unclear, but our data obtained after an icv acute injection of apelin strongly supports the first hypothesis. Indeed, Prior et al. (37) show that a short-term HFD (4 weeks) drives toward sympathetic activation associated to an increase in visceral fat depot. On the contrary, we were not able to observe a significant increase in plasma norepinephrine levels in our 3 months HFD mice. The logical explanation of this result is the fact that over time, with obesity, adrenoreceptors down-regulation and/or reduced sensitivity are likely to develop in peripheral tissue, resulting in reduced sympathetic responsiveness (18). Then, this possibility could also explain the absence of activation of gluconeogenesis but not glycogenolysis in HFD mice.
Additional to SNS regulation, hepatic glucose production is under the influence of glucagon (41). Here, we show that acute icv apelin stimulates plasma glucagon secretion in normal mice, suggesting that glucagon is able to participate to fasted hyperglycemia. In accordance to our results, the group of Cherrington clearly demonstrates that in response to a physiological rise in glucagon, the increase observed in hepatic glucose production is entirely attributable to glycogenolysis but not (or little to quote the authors) to gluconeogenesis (41). Then, glucagon could be one important molecular actor participating in deleterious central action of apelin during the onset of a type 2 diabetes. In longer time, when type 2 diabetes is well established, icv apelin cannot increase glucagon secretion as observed in HFD mice, suggesting that hyperglucagonemia of those diabetic mice is too important to be even more increased. For all these reasons, therapeutic strategies cannot rule out the importance of pancreatic alpha cells as potential good targets to treat hyperglycemia and insulin resistance (5). In our central apelin to liver axis, the participation of glucagon to hyperglycemia is real, but lentivectors approach tends to focus on a direct norepinephrine action on liver, as plasma norepinephrine is increased in lentivectors apelin mice, but not glucagon.
Our data show that central apelin participates in the establishment of type 2 diabetes. We have previously shown that obese/diabetic mice present an increase in plasma apelin (11) and in hypothalamic apelin expression (42). The hypothalamus is a neurohemal structure that facilitates communication with peripheral signal, including hormones and metabolites. Then, in physiological and pathological conditions, the hypothalamus may be influenced by hypothalamic and/or peripheral apelin. To test whether targeting central apelin in an advanced type 2 diabetes could ameliorate the metabolic phenotype, we have injected obese/diabetic mice (3 months HFD) during 14 consecutive days with icv APJ antagonist. This experimental approach blocks the potential effect of hypothalamic and peripheral apelin on hypothalamic neurons. Then, we found that icv APJ antagonist-treated mice present a clear amelioration of their diabetic state, including a decrease in insulin intolerance, fasted hyperglycemia, plasma glucagon, and liver glycogen content associated to an increase in glycogen phosphorylase activity. No significant variation in plasma norepinephrine and epinephrine was observed between the two groups, reinforcing the hypothesis of a possible adrenoreceptor down-regulation in specific tissue and/or reduced sympathetic responsiveness as explained next. These data confirm that the decrease in glycogen content and fasted hyperglycemia is the result of an increase in insulin sensitivity provoked by blockade of central apelin. We can speculate that a longer time treatment may modify the activities of others targets such as G6Pase, PEPCK, and glycogen synthase. In fact, we show that in a well-established diabetic models (HFD), central apelin may be a potential target to treat diabetes, with a similar peripheral target to prediabetic mice (mimicked by icv apelin injected mice and apelin expressed lentivirals mice), that is, the liver.
Although the present set of experiments link hypothalamic apelin/ROS with hepatic glucose metabolism, we acknowledge that the exact molecular and cellular mechanisms implicated in the cross-talks observed between these key organs remained to be elucidated.
In conclusion, we identify a hypothalamic apelin/ROS signaling pathway that is implicated in the control of liver glucose metabolism via the SNS. Abnormal hypothalamic level of apelin observed in obese/diabetic mice participates in over-activation of SNS, which improves fasted hyperglycemia a characteristic of type 2 diabetes. Thus, we propose that central apelin could be one new target at the core of the regulation of glucose homeostasis and metabolic disorders.
Materials and Methods
Mice
Animals were handled in accordance with the principles and guidelines established by the National Institute of Medical Research (INSERM) and by the local ethical committee. C57Bl6/J mice were obtained from Charles River Laboratory. Mice were housed conventionally at a constant temperature (20°C–22°C) and humidity (50%–60%) animal room and with a 12/12 h light/dark cycle (lights off at 7:00 AM) and free access to food and water through the 24 h period. All injections and experiments were performed in 13–15-week-old males. A group of male mice was subjected to HFD containing 20% protein, 35% carbohydrate, and 45% fat (SAFE). HFD-fed mice were followed at regular intervals with measure of weight and blood parameters (glucose, insulin) until they were obese and insulin resistant corresponding to 3 months of HFD. Experiments were performed on 6 h-fasted mice. During the time of the experiment, mice fed overnight were placed in a new clean cage without food. In all experiments, icv apelin did not modify body weight of mice (11) and general behavior (unpublished data).
Plasmid construction and lentivector production
The lentiviral plasmid pTRIP-DU3-CMV-MCS was derived from the pTRIP-DU3-EF1a-EGFP plasmid by replacing the EF1a promoter and EGFP by the cytomegalovirus (CMV) promoter and a multiple cloning site (MCS), respectively (50). The cDNA encoding the murine apelin gene (EMBL accession number AJ290423), corresponding to the coding region flanked by 100 and 23 nucleotides of 5′- and 3′-untranslated regions, respectively, was subcloned into the lentivectorpTRIP-DU3-CMV-MCS (43). The lentivectors were produced by tri-transfection of pTRIP-DU3-CMV-apelin and pLvPack and pLvVSVg packaging plasmids (Sigma-Aldrich) in HEK 293FT cells (4).
Surgical procedures
For in vivo acute perfusions, an indwelling icv catheter (Alzet Brain Perfusion Kit 3; 1–3 mm (Charles River Laboratory) −1 mm lateral to the sagittal suture, −0.2 mm posterior to the bregma and −1.7 mm below the skull surface) was implanted in anesthetized mice with isoflurane (Abbott).
Acute injections
Apelin
Bolus injection of 2 μl of [Pyr]apelin-13 (concentration 20 nM corresponding to 40fmol; Bachem), the most active apelin isoform (10), was injected directly into the icv catheter completed to 2 μl of artificial cerebrospinal fluid (aCSF) for treated mice, or 4 μl of aCSF for control mice. Blood glycemia was measured every 30 min from −30 to 210 min (time 0 corresponding to icv apelin injection). The dose of apelin (2 μl of 20 nM, i.e., 40 fmol) corresponds approximately to the half quantity of total tissular apelin found in a normal mouse hypothalamus (near to 74 fmol per hypothalamus), and this injection leads approximately to the quantity found in an HFD mouse (near to 111 fmol per hypothalamus).
Antioxidant
Similar experiments were performed with an antioxidant, 6-hydroxy-2,5,7,8-tetramethylchromane-2-carboxylic acid (Trolox; Sigma), which was dissolved extemporaneously in aCSF, and then infused at a concentration of 1 mM (2 μl). At this concentration, trolox is known to prevent peripheral hyperinsulinemia by blocking hypothalamic ROS production in vivo (24). Trolox infusion was started 30 min before the beginning of the apelin injection.
Inhibitor of NADPH oxidase
Similar experiments were performed with an inhibitor of NADPH oxidase, DPI chloride (Sigma), which was dissolved extemporaneously in aCSF, and then infused at a concentration of 1 mM (2 μl). At this concentration, DPI inhibits NADPH oxidase in the brain (19). DPI infusion was started 30 min before the beginning of the apelin injection.
APJ antagonist
Similar experiments were performed with an APJ antagonist, F13A (polypeptide) (22), which was dissolved extemporaneously in aCSF, and then infused at a concentration of 2 μg/mouse (2 μl). At this concentration, F13A inhibits apelin effects in the brain (26). F13A infusion was started 30 min before the beginning of the apelin injection.
Intraperitoneal injection of antagonist of α1-adrenergic receptors
120 min before apelin or aCSF icv injection, prazosin (Prazosin hypochloride; Sigma) was injected intraperitoneally as previously described (39). Prazosin was dissolved extemporaneously in saline solution, and then infused at a concentration of 0.3 mg/kg. At this concentration, prazosin blocks α1-adrenergic receptors without perturbation of fasted glycemia (20).
Chronic injections
F13A
Male mice fed a HFD during 3 months received every day during 2 weeks a bolus injection of 2 μl of F13A (2 μg/mouse) that was injected directly into the icv catheter completed to 2 μl of aCSF for treated HFD mice, or 4 μl of aCSF for control HFD mice.
Bilateral lentivector injection in the MBH
Protocol is explained in details in Supplementary Materials and Methods section.
H2O2 measurements by fluorometric methods
Amplex Red (10-acetyl-3,7-dihydrophenoxazine) was used as a fluorescent probe for the detection of H2O2. Protocol is explained in detail in Supplementary Materials and Methods section.
Real-time amperometric H2O2 measurements
Mice were sacrificed after 6 h of fasting conditions. Protocol is explained in details in Supplementary Materials and Methods section. Data are expressed as delta variation of H2O2 release from basal as previously used for amperometric nitric oxide (NO) measurement (11, 12).
Tissues
Mice were fasted for 6 h, and blood samples were collected between 15 and 30 min after the acute injection of apelin or aCSF (these times correspond to the period of release of glucose by the liver glycogenolysis), or after the 6 h fasted for mice with lentivirus injection. Plasma was removed and frozen, powdered in liquid nitrogen, and kept at −80°C until catecholamine assays were performed. Mice were also decapitated without anesthesia. After dissection, liver fragments were also rapidly removed, frozen, powdered in liquid nitrogen, and kept at −80°C until glycogen assays were performed.
Liver glycogen determination
Glycogen content was determined as previously described (21) and explained in the Supplementary Materials and Methods section.
Enzymatic activities
Hepatic G6Pase activity was determined as previously described in detail (40). Results are expressed as μmoles/min per gram of wet tissue. Hepatic PEPCK activity was determined with the methods of Pogson and Smith (35). Results are expressed as nmol/min per gram of wet tissue. Hepatic glycogen phosphorylase activity assay was determined as previously described (33). Results are expressed as a percentage of activity. Glycogen Synthase activity was evaluated by the ratio of phosphorylated protein/total protein. Immunoblots were performed as previously described (11). Membranes were incubated overnight at 4°C with a primary polyclonal antibody against total Glycogen Synthase (dilution 1/1000; Cell Signaling Technology) or the phosphorylated active form (Ser641) of Glycogen Synthase (dilution 1/1000; Cell Signaling Technology).
Histological revelation of glycogen or lipid content
Liver lobe was taken along with the tissues for different assays. The samples were included in Carnoy solution for 24 h, then in 20% sucrose solution for 48 h, and then frozen at −80°C in tissue Teck (Polyfreeze; Sigma). Ten-micrometer-thin cryostat sections were made from livers. Glycogen was visualized with Periodic Acid-Schiff staining. The quantifying of the staining was performed with the software Adobe® Photoshop®. Lipids were visualized by Oil-Red staining. Hepatic TGs content was determined as described (17).
Plasma assays
Plasma catecholamine concentration was measured after 6 h of fasting in all protocols and after 6 h of fasting and 30 min for acute icv treatment. Catecholamine content of the plasma was determined as previously described in detail using high-performance liquid chromatography coupled with electrochemical detection after alumina extraction (29). Plasma glucagon content was determined with a commercial available enzyme-linked immunosorbent assay (ELISA) kit (Glucagon Quantikine; R&D Systems). Plasma ketone bodies content was determined with a commercial kit (Ketone bodies assay kit, Antibodies). Plasma apelin content was determined with a commercial available ELISA kit (Phoenix Pharmaceuticals). Plasma TGs were determined as described (17).
Pyruvate tolerance test
Six-hour-fasted mice were injected with an intraperitoneal pyruvate injection (2 mg/g) after an icv acute injection or unless icv injection (lentivirus). Blood was collected from the tail vein at −30, 0, 15, 30, 45, 60, 90, and 120 min later for determination of glucose levels.
Insulin tolerance test
Six-hour-fasted mice were injected with an intraperitoneal insulin injection (0.5 mU/g for mice with lentivirus, or 1 mU/g for HFD mice with chronic icv F13A treatment), as previously described (52). Blood was collected from the tail vein at −30, 0, 15, 30, 45, 60, 90, and 120 min later for determination of glucose levels.
Real-time PCR
Total RNA from tissues was prepared using the TriPure reagent (Roche) as described (14, 17). Quantization and integrity analysis of total RNA was performed as previously described (17). Protocol is explained in detail in Supplementary Materials and Methods section.
Statistical analysis
Results are presented as mean±SEM. The statistical significance of differences was analyzed by student t-test, by two-way ANOVA followed by a post hoc t-test, or one way followed by post hoc Bonferroni's or Dunnett's multiple comparison test, when appropriate. Statistical analyses were assessed by using GraphPad Prism version 5.00 for windows (GraphPad Software). Results were considered statistically significant when p<0.05.
Footnotes
Acknowledgments
The authors are grateful to Valérie Montel and Edith Renaud for technical assistance and Yannick Delpu and Hélène Le Bras for helpful discussion. P.D.C. is a research associate from the FRS-FNRS (Fonds de la Recherche Scientifique), Belgium. This work was supported by the Société Française de Nutrition (SFN).
Author Disclosure Statement
No competing financial interests exist.
Abbreviations Used
References
Supplementary Material
Please find the following supplemental material available below.
For Open Access articles published under a Creative Commons License, all supplemental material carries the same license as the article it is associated with.
For non-Open Access articles published, all supplemental material carries a non-exclusive license, and permission requests for re-use of supplemental material or any part of supplemental material shall be sent directly to the copyright owner as specified in the copyright notice associated with the article.