
Abstract
Local responses of energy metabolism during brain ischemia are too heterogeneous to decipher redox distribution between anoxic core and adjacent salvageable regions such as penumbra. Imaging mass spectrometry combined by capillary electrophoresis/mass spectrometry providing quantitative metabolomics revealed spatio-temporal changes in adenylates and NADH in a mouse middle-cerebral artery occlusion model. Unlike the core where ATP decreased, the penumbra displayed paradoxical elevation of ATP despite the constrained blood supply. It is noteworthy that the NADH elevation in the ischemic region is clearly demarcated by the ATP-depleting core. Results suggest that metabolism in ischemic penumbra does not respond passively to compromised circulation, but actively compensates energy charges. Antioxid. Redox Signal. 13, 1157–1167.
Quantitative Imaging Mass Spectrometry as a Novel Tactics to Decipher Metabolic Dynamics of Brain Ischemia
Using imaging MS (IMS) combined with CE/ESI/MS, we herein constructed maps of adenine nucleotides whereby abundance of these metabolites was assigned in absolute terms, that is, μmol/g tissue. Such assignment of contents made it possible to directly compare patterns of biochemical derangements in and around the ischemic core at different time points during infarction. Our results suggest that, unlike the core, the penumbra displays paradoxical elevation of ATP despite the constrained blood supply.
Heterogeneous Distribution of Adenylates in the Normal Brain
A direct comparison between metabolic maps of different specimens requires realistic transformation of acquired mass signals of a metabolite in absolute terms such as tissue content in μmol/g. To do so, the apparent content of a specific metabolite at the specific location within a specimen was estimated as described in the Methods section.
To evaluate if the method can adequately illustrate metabolic changes in situ, we compared constructed maps of apparent contents of adenylates ([adenylates]app) with heterogeneous patterns of local cerebral metabolic rates for glucose described previously (25). Apparent contents of ATP, ADP, and AMP ([ATP]app, [ADP]app, and [AMP]app, respectively) in the in situ freezing method (17, 20) varied considerably among different cerebral architecture (Fig. 1A). [ATP]app in the cortex was greater than those in amygdala and hypothalamus, whereas the opposite was the case for [AMP]app. Such structure dependence in [ATP]app was consistent with regional heterogeneity of local cerebral metabolic rates for glucose (14, 25), validating this method. On the other hand, postmortem freezing (PMF; decapitation before freezing) caused unacceptable autolytic reduction in ATP and increases in ADP and AMP. In this case, the heterogeneity disappeared (Fig. 1A).
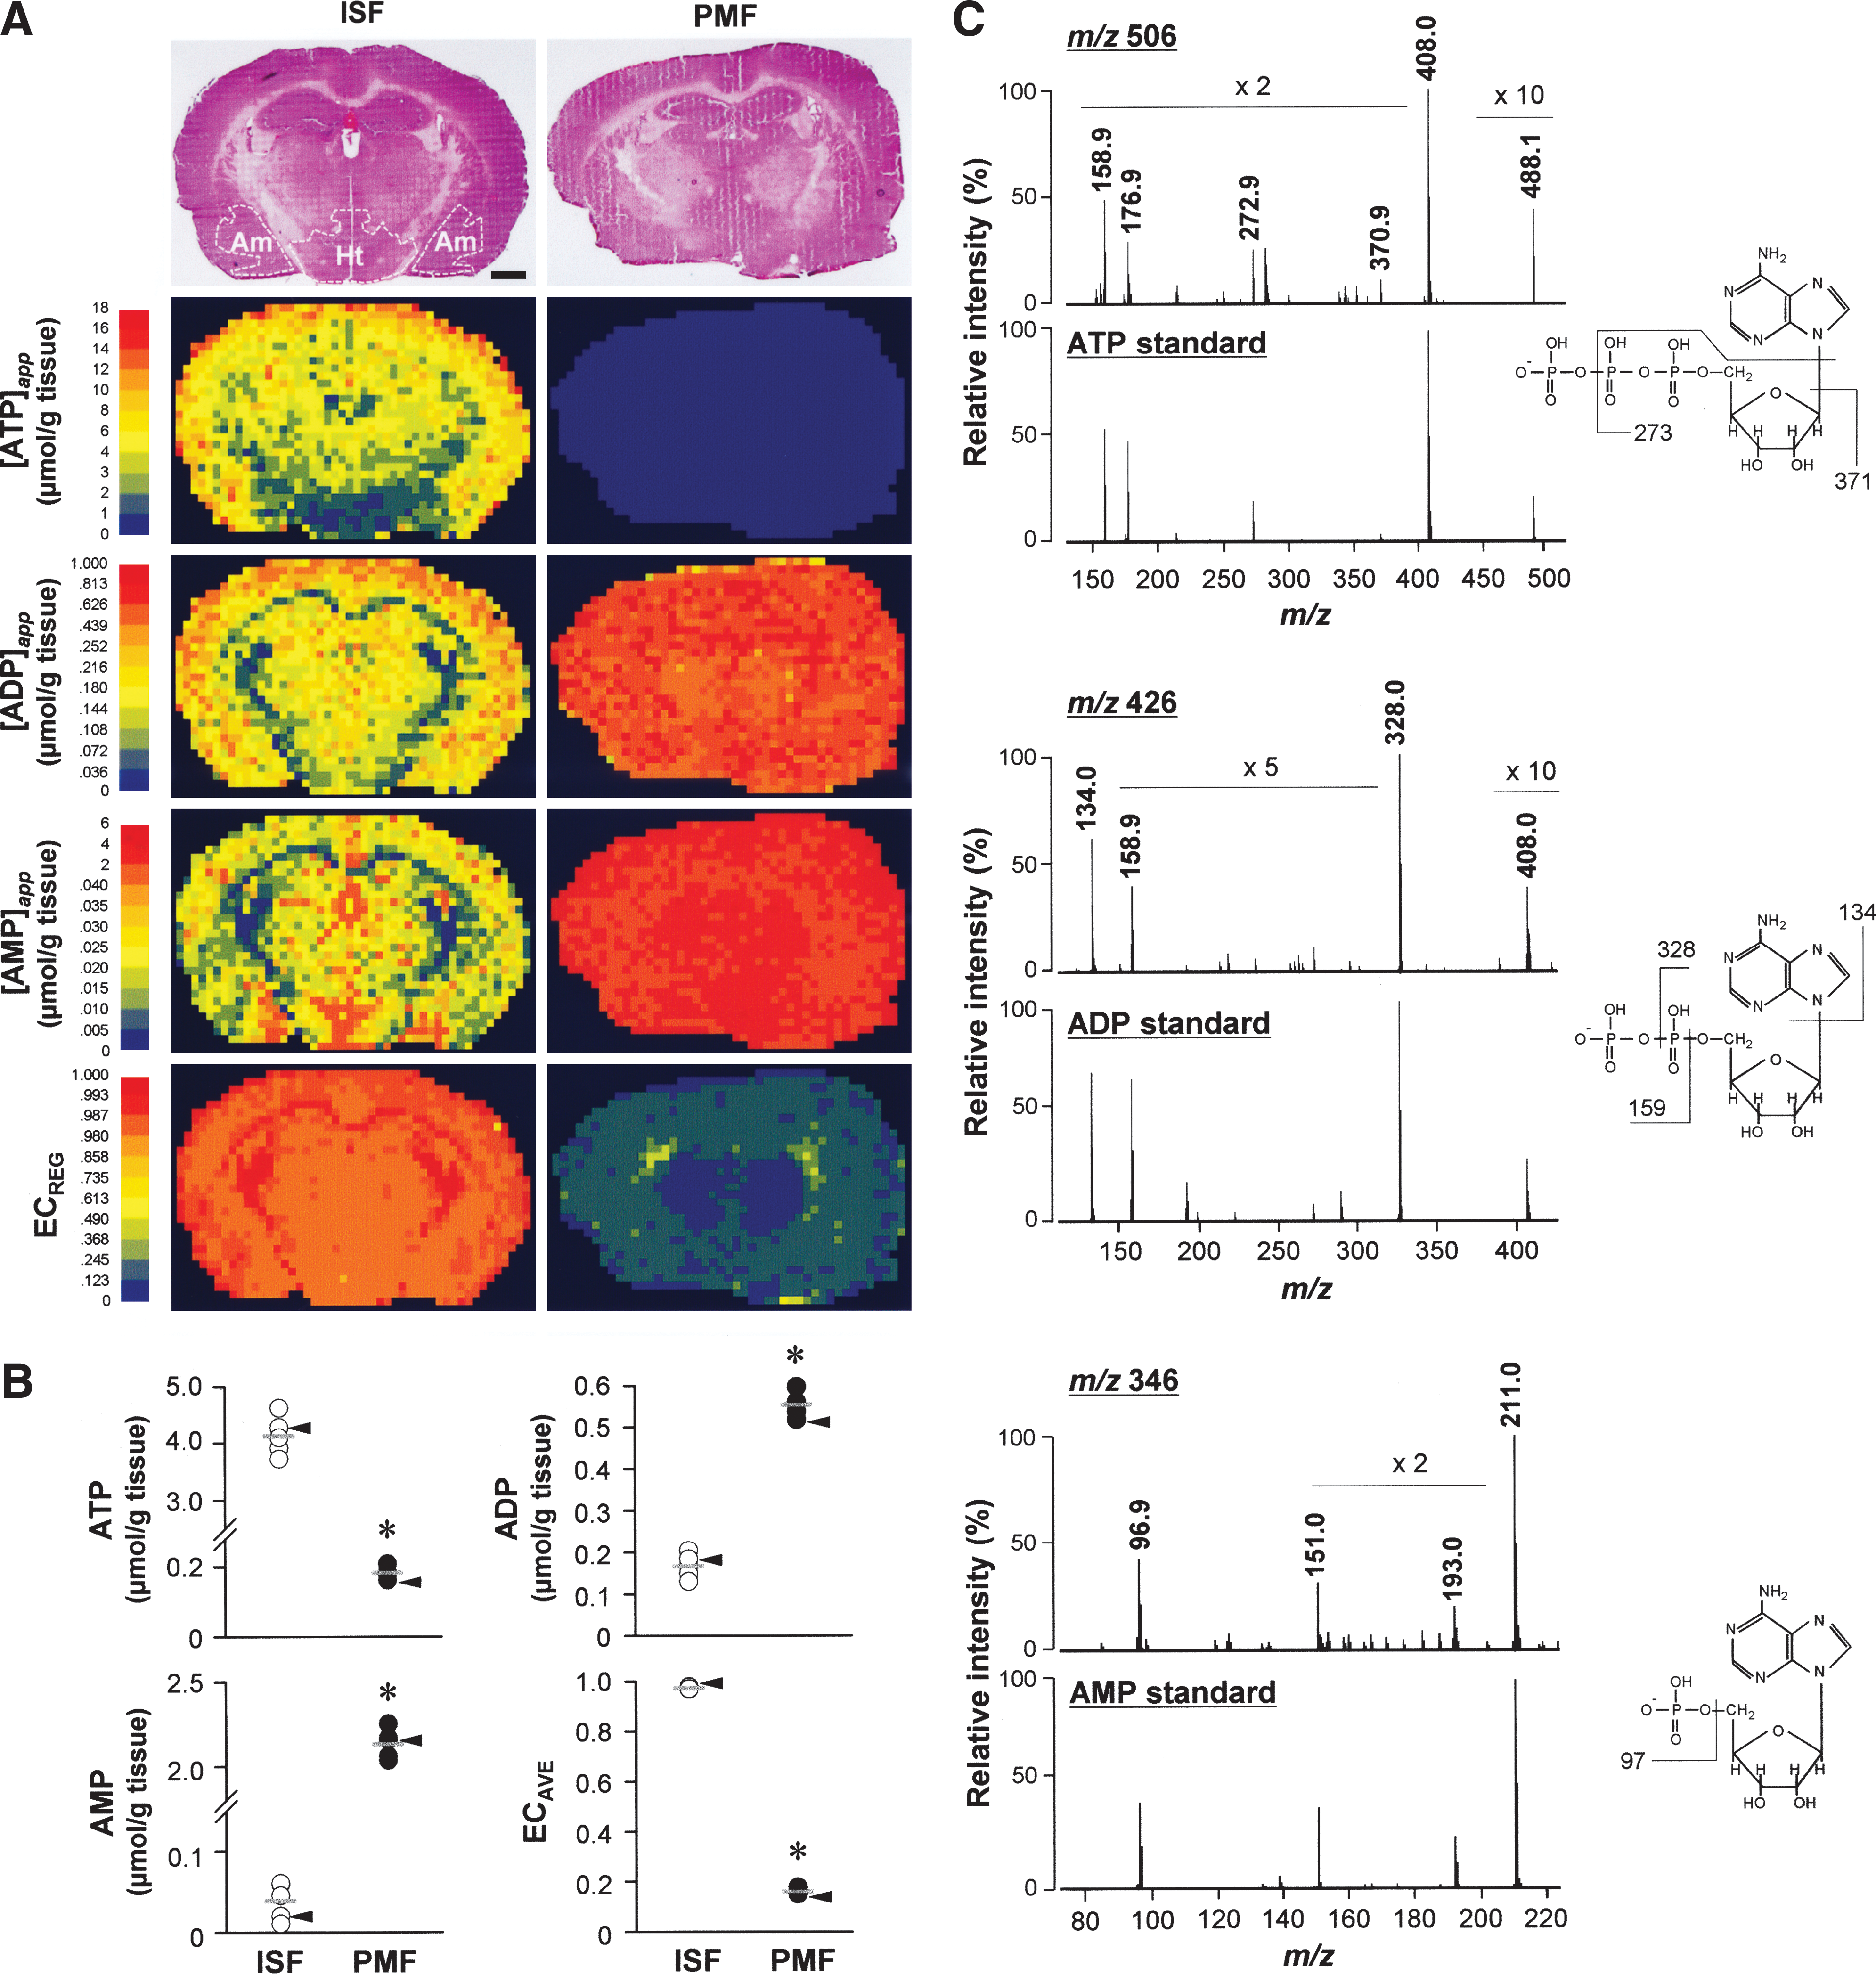
To identify ion peaks at m/z 506, 426, and 346, we conducted tandem mass spectrometry (MS/MS) comparing fragment fingerprints acquired from the tissue and standard compounds. The perfect match of these spectra assigns these metabolites to be ATP, ADP, and AMP (Fig. 1C).
Spatiotemporal Changes in Adenylates in Response to Acute Cerebral Ischemia
Our strategy using IMS combined with CE/ESI/MS enabled not only the snapshot depiction of the purine metabolism leading from ATP to AMP, but also their quantitative intergroup comparisons of local metabolic responses to cerebral ischemia at different time points. Figure 2A shows maps of [adenylates]app in the ischemic brain. In the core (defined as cerebral blood flow [CBF] < 20% of control), [ATP]app declined substantially at 10 and 60 min of middle cerebral artery occlusion (MCAO), whereas [AMP]app increased transiently at 10 min. Such temporal changes of [adenylates]app were consistent with measurements of adenylates extracted from the corresponding brain homogenate by CE/ESI/MS (Fig. 2B). In contrast, in the pericore (defined as CBF 20%–40% of control) at 60 min of MCAO, the map indicated a noticeable increase in [ATP]app, which did not match the reduced ATP measured by CE/ESI/MS. The dissociation of this kind led us to conduct region-specific analyses in four different zones (Fig. 3A).
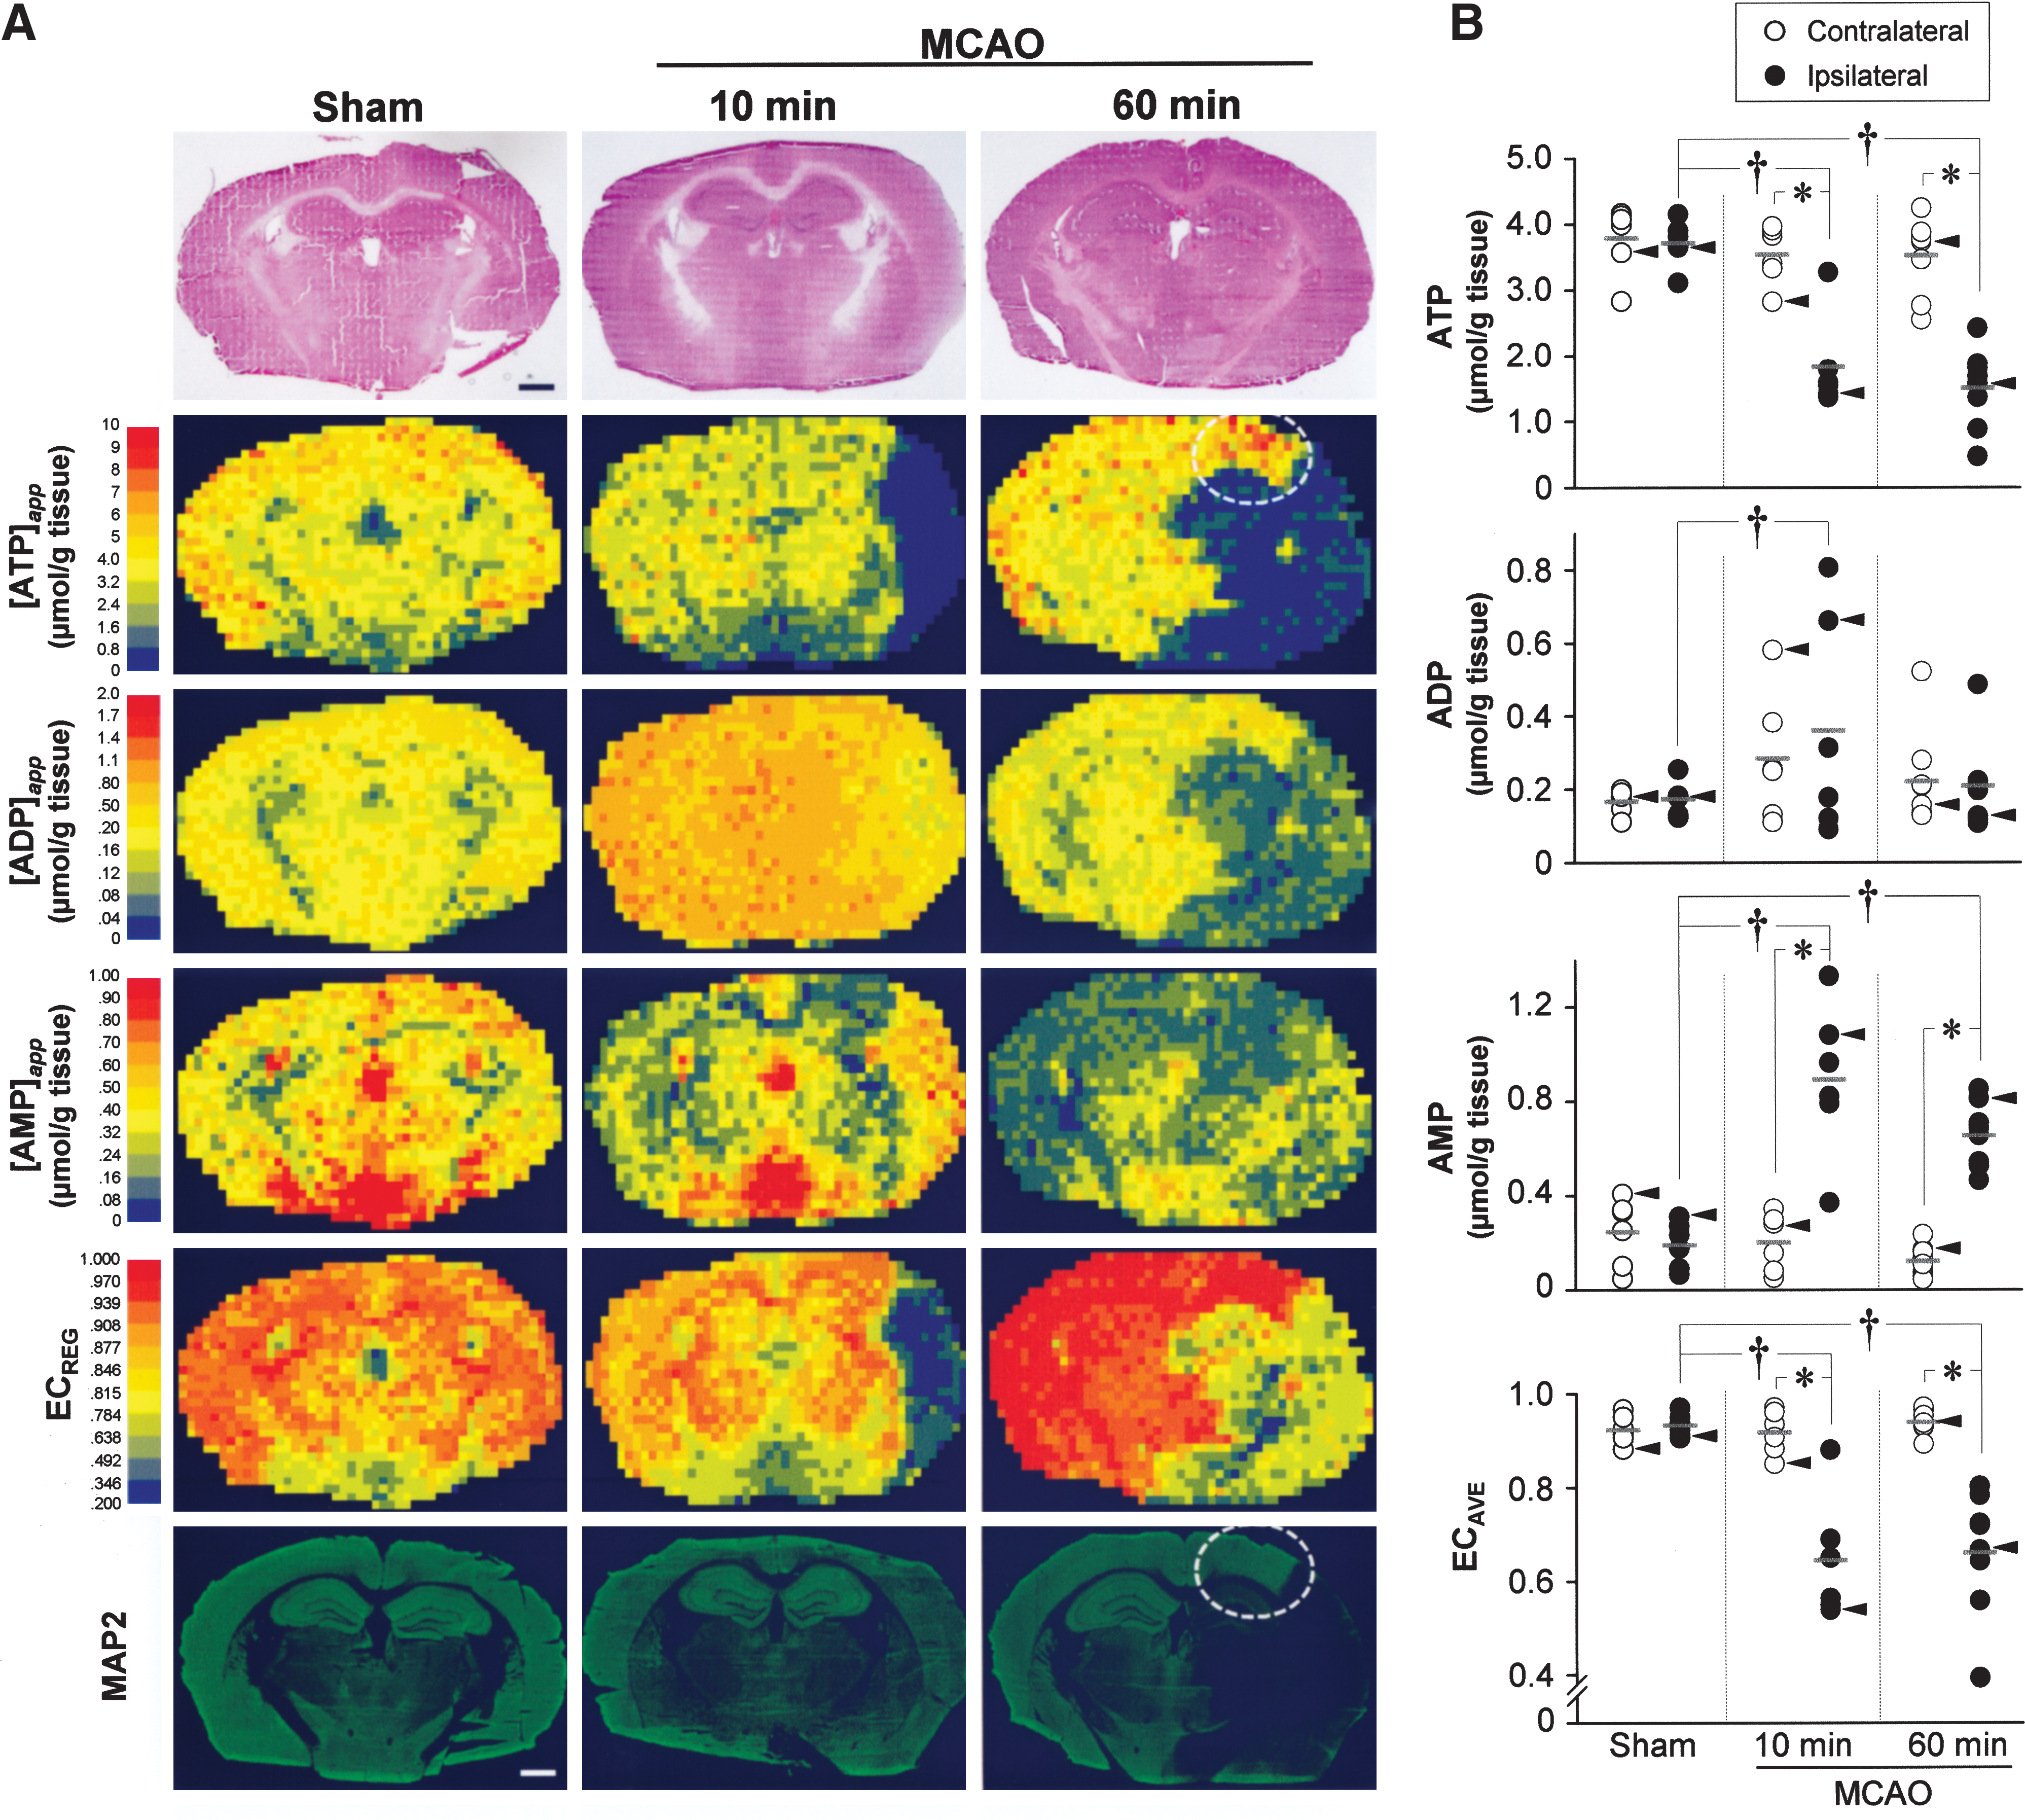
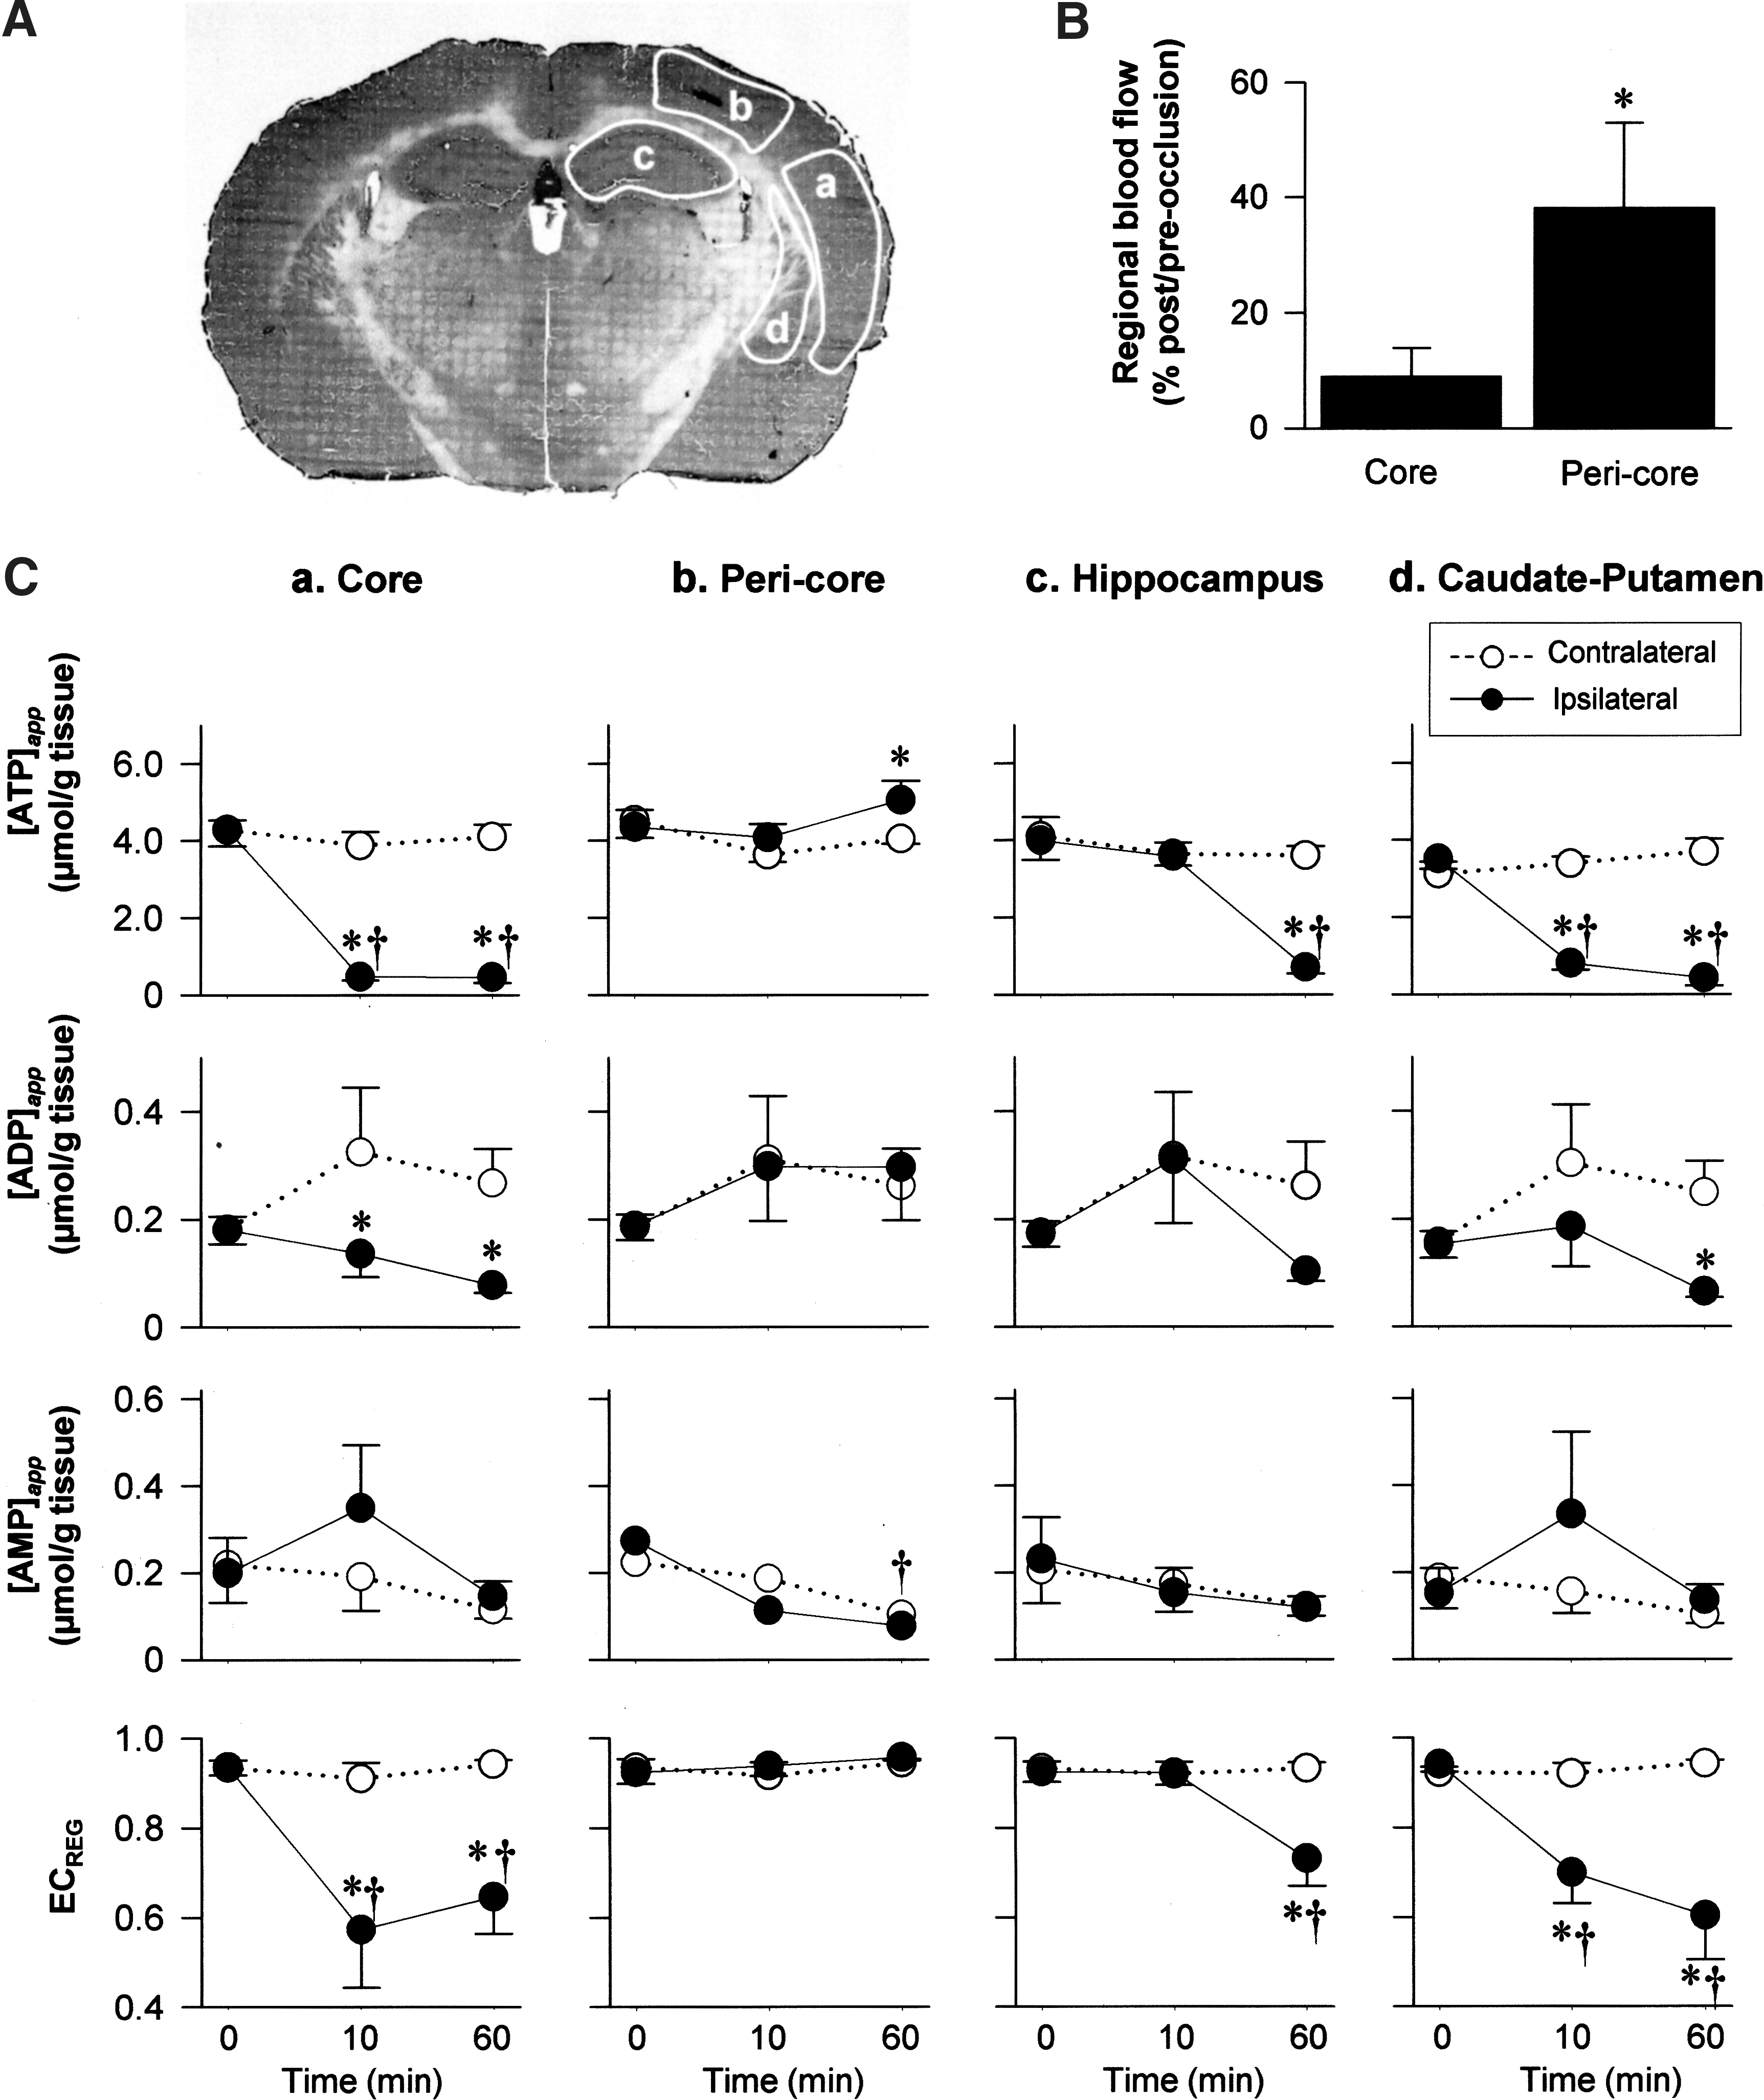
In both core and caudate putamen where blood supplies are governed by the MCA, a large decrease in [ATP]app was evident at 10 min followed by a sustained decrease at 60 min. In contrast, [AMP]app tended to increase at 10 min (p = 0.17) and returned to baseline at 60 min. Unlike these changes in the core, the pericore displayed opposite responses, that is, a significant increase in [ATP]app and a decrease in AMP at 60 min (Fig. 3). The area indicating ATP elevation (marked with dotted circle in Fig. 2A) resembles the ischemic penumbra at this coronal level, that is, bregma 2.1 mm (3) in the MCAO model. Further, the core and pericore showed different patterns of microtubule-associated protein-2 (MAP2) expression (the lowest row of Fig. 2A), that is, this calpain-sensitive protein in neural dendrites remained detectable at 10 min but disappeared at 60 min in the core but not in the pericore, consistent with previous studies (6).
Spatiotemporal Changes in NADH and Cyclic ADP Ribose During Ischemia
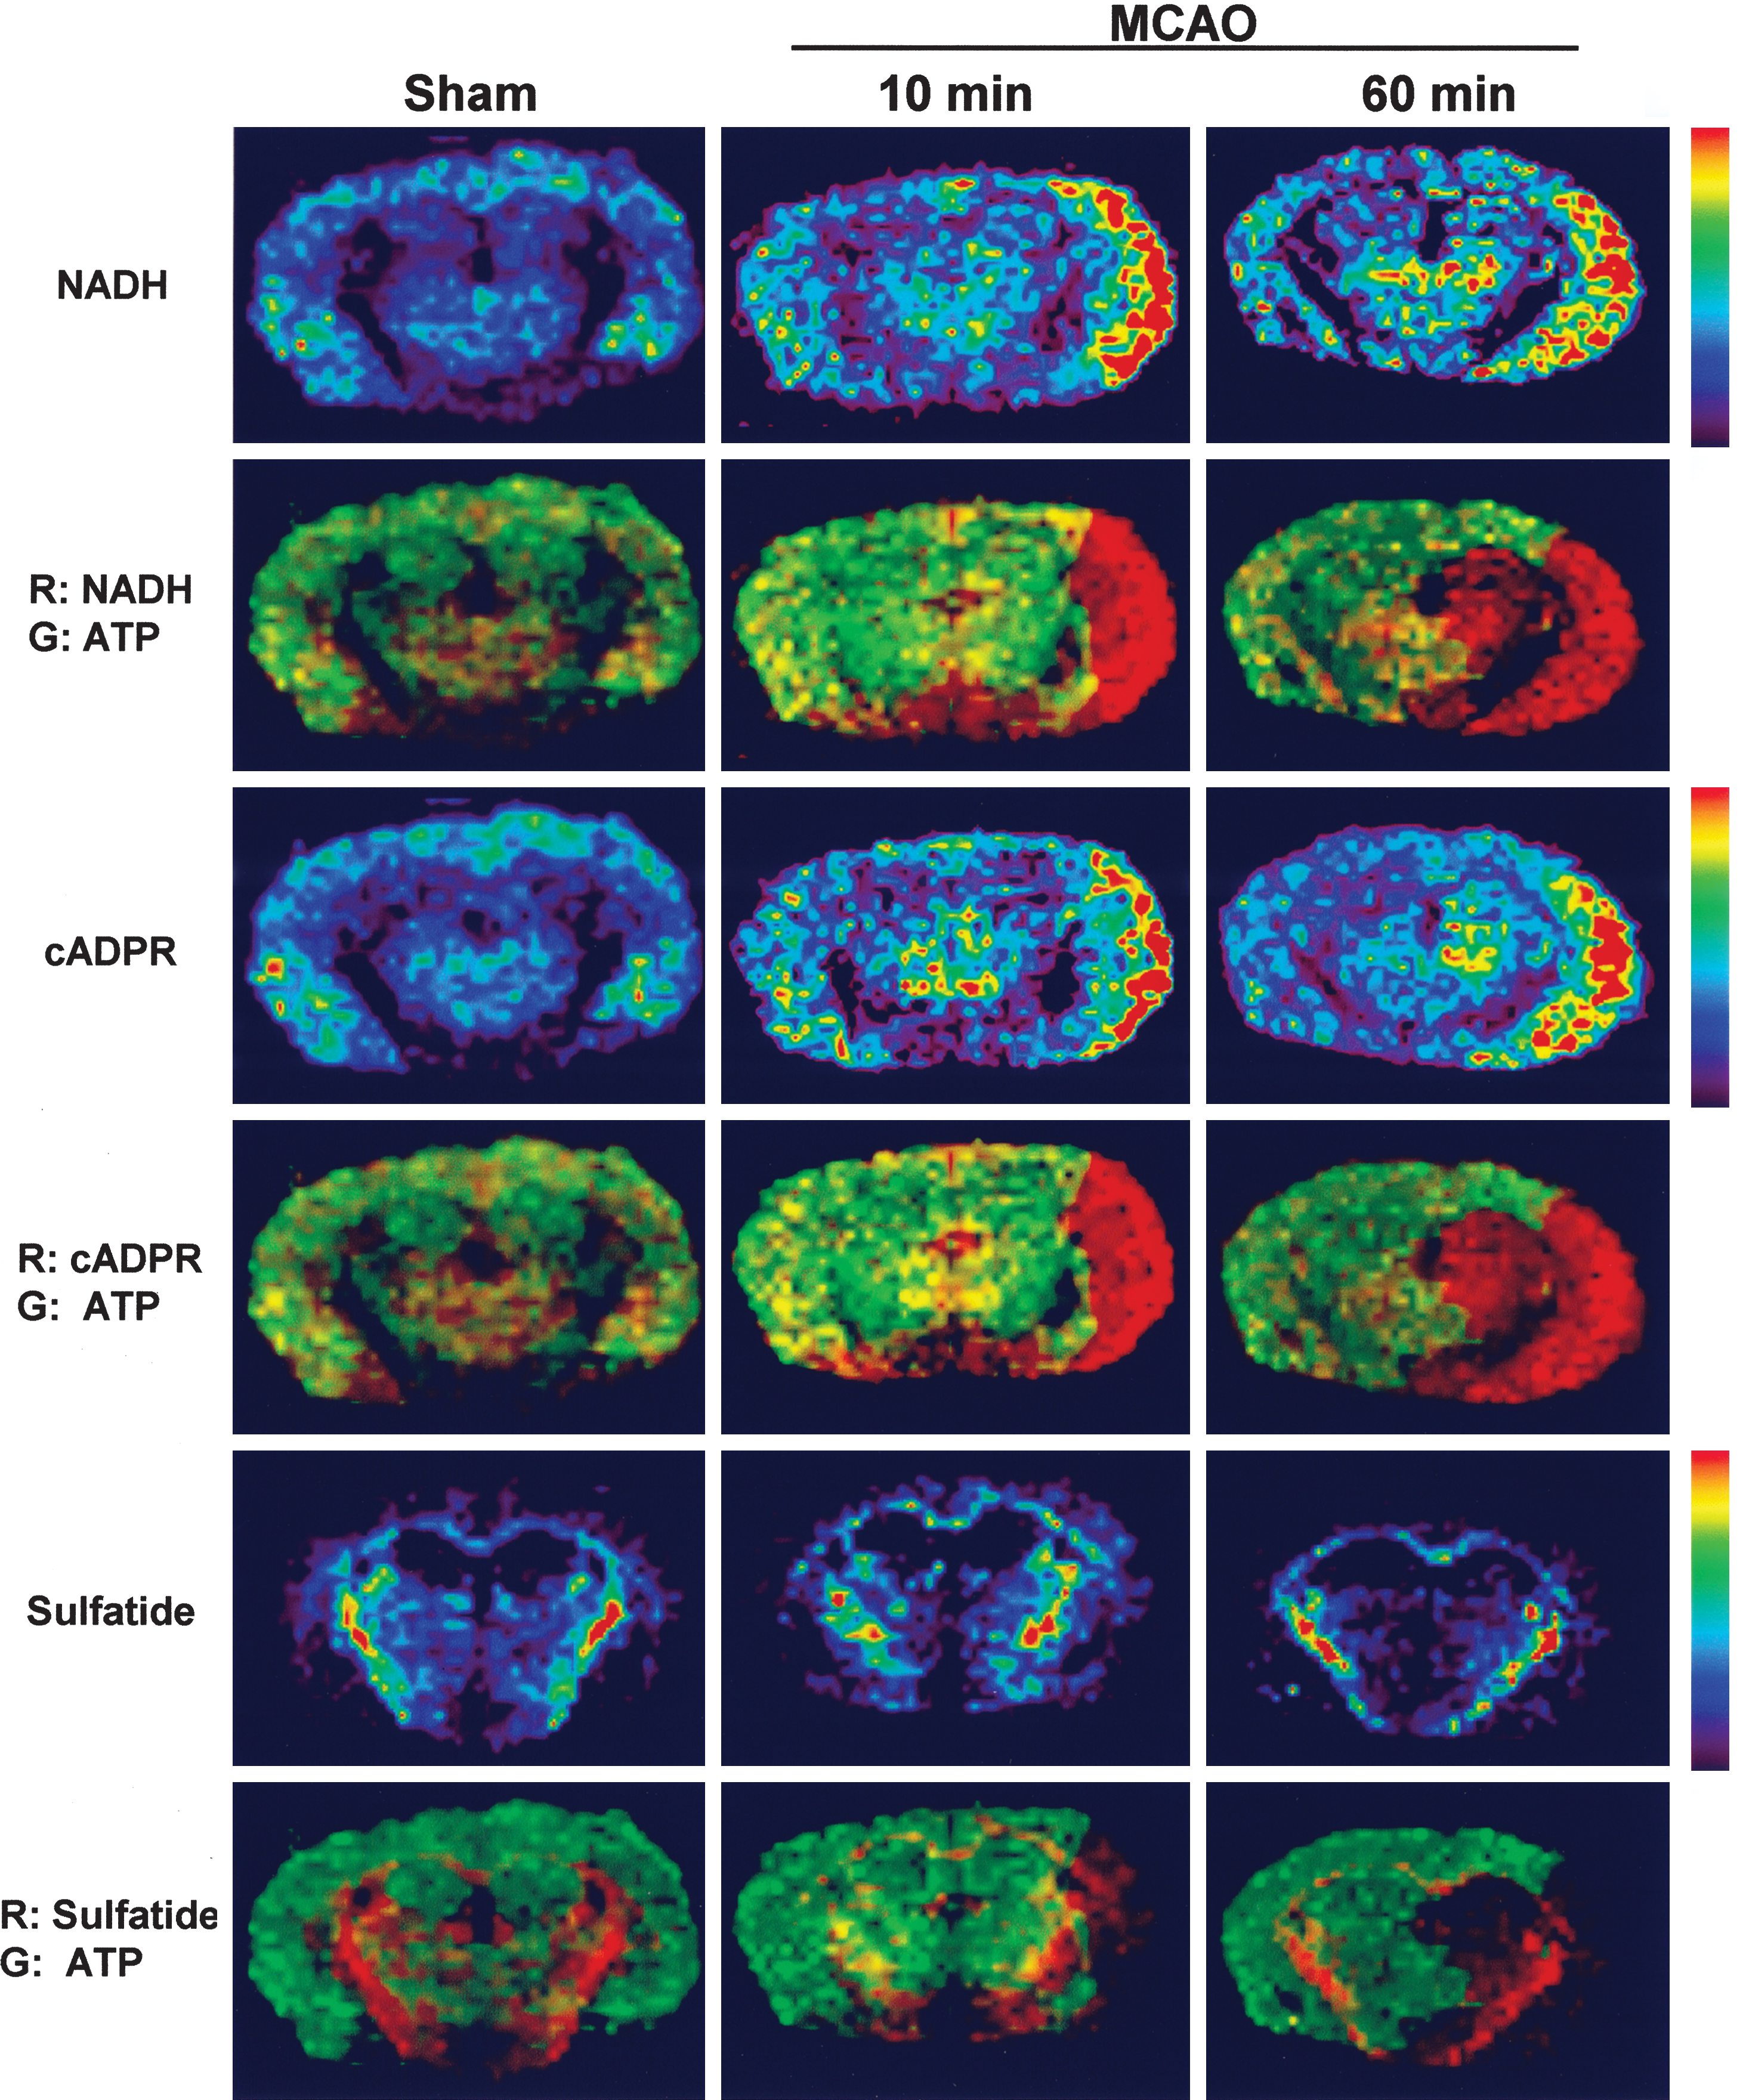
One of the strengths of IMS lies in its ability to identify metabolites in a nontargeted manner. In this study, NADH and cyclic ADP-ribose (cADPR) are among such metabolites identified retrospectively by tandem MS/MS analyses (Table 1). Rapid accumulation of NADH and cADPR, an endogenous modulator of ryanodine receptor responsible for intracellular Ca2+ mobilization that is derived from NAD catalyzed by ADP-ribosyl cyclase/CD38 (16) (Fig. 4), occurred before the disruption of neural dendrites indicated by the loss of MAP2 immunoreactivity. The core whose CBF diminished <20% control (Fig. 3B) was clearly demarcated by the accumulation of NADH and cADPR and by the marked ATP depletion. Thus, the pattern of NADH and that of ATP complemented each other forming a metabolically delineated boundary at the interface between the core and the pericore. It is worth noting that this is the first true visualization of NADH, because autofluorescence techniques (36) commonly used cannot reliably discriminate fluorescence signals between NADH and NADPH. The pathogenesis of neuronal and glial dysfunction was often evaluated from the viewpoint of cellular disturbances in NAD metabolism and activity of NAD-consuming enzymes such as ADP-ribosyl cyclase/CD38 (37). Therefore, identification of NADH and cyclic ADP ribose at a microregional scale at the early ischemic period could provide rationale to pinpoint effective therapeutic approaches.
Mechanisms for Paradoxical ATP Elevation in the Penumbra
Mechanisms for paradoxical ATP elevation in the penumbra under reduced CBF are yet to be identified. However, metabolome data from the corresponding ischemic hemisphere containing both core and pericore regions suggest putative metabolic interplay between these regions providing fuel molecules for ATP regeneration.
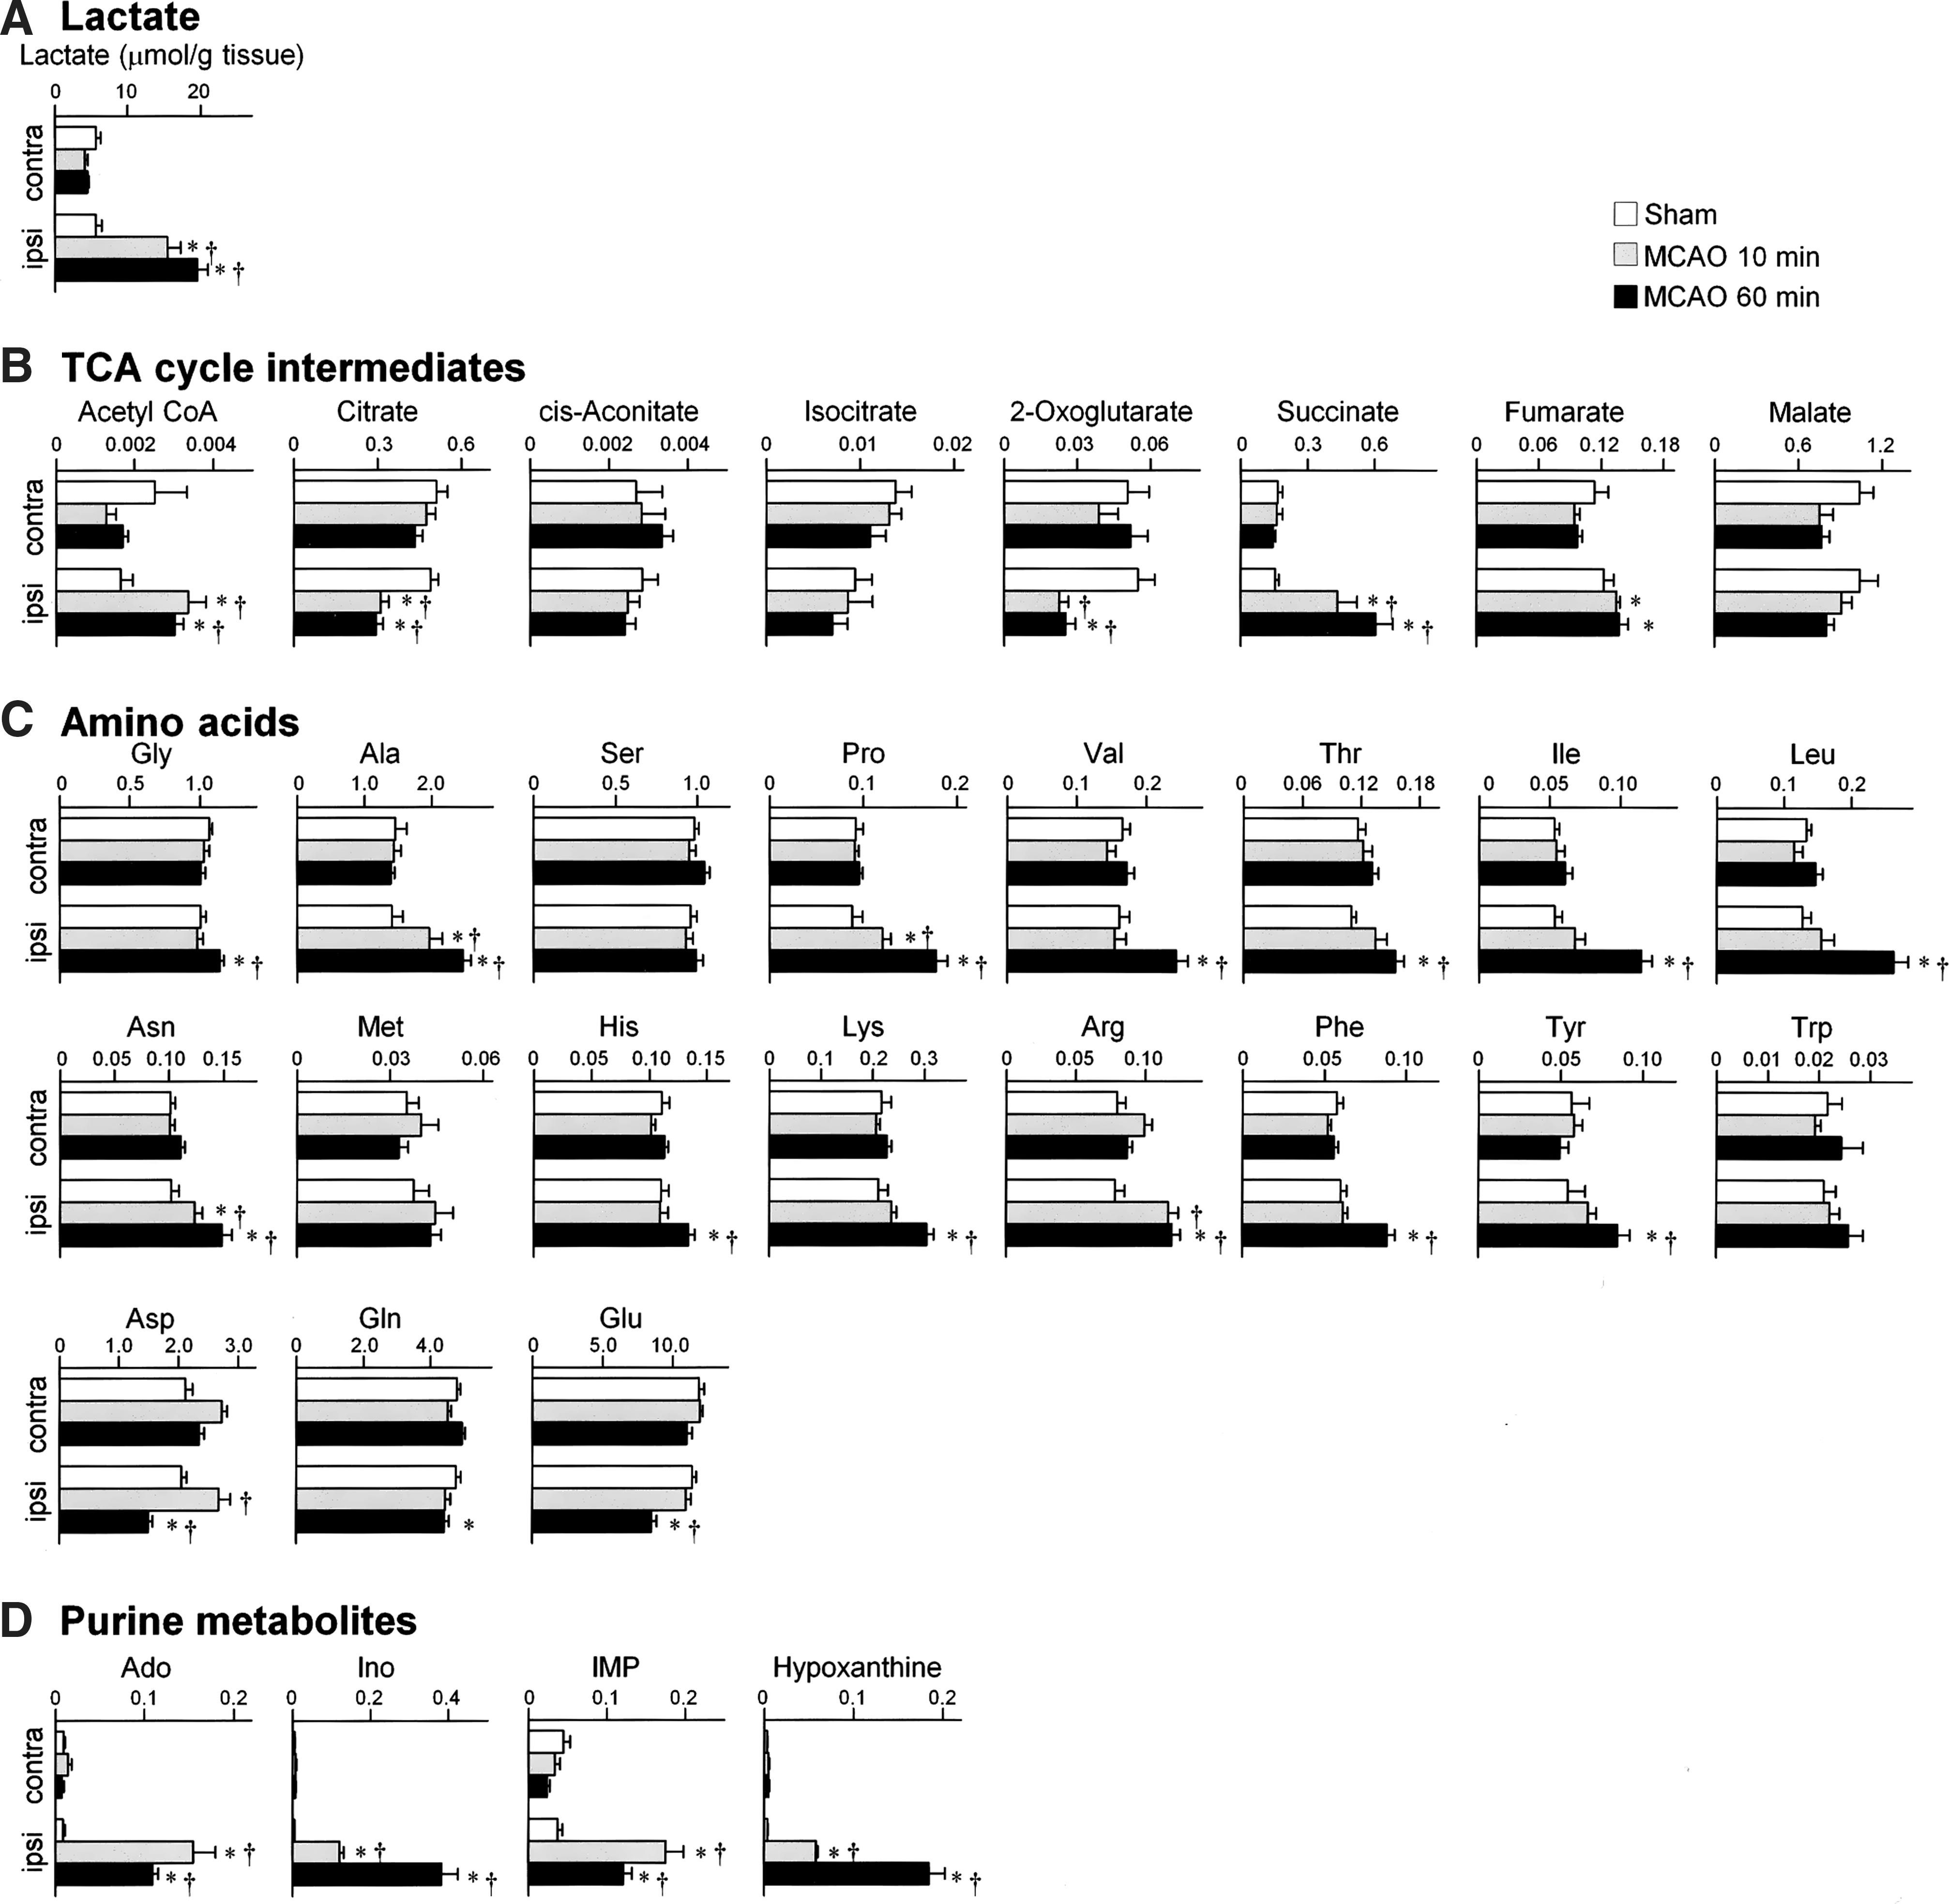
Recent observation that arteriolo-arteriolar-anastomosis between MCA and anterior cerebral artery regulates local hemodynamics (34) suggests the existence of functional collaterals between the core and penumbra. The metabolic boundary shown by NADH (Fig. 4) might mean that, in the core, accumulated NADH inhibits tricarboxylic acid (TCA) cycle and accelerates lactate generation, whereas, in the penumbra, core-derived lactate is utilized for oxidative phosphorylation. Indeed, oxidative metabolism could occur even under glucose-deprived conditions, that is, amino acids can be converted to intermediaries of TCA cycle such as fumarate and succinate through deamination, which, in turn, fuel oxidative phosphorylation to yield ATP. On the other hand, absence of NADH accumulation in the pericore region (Fig. 4) supports the oxidative metabolism despite perfusion limitation. Moreover, high values of oxygen extraction rate in ischemic penumbra (8) in the first hour after onset of ischemia supports this mechanism further. Such a scheme to use alternative carbon sources is also applicable to putative roles of globally increased amino acids in the ipsilateral hemisphere (Fig. 5C) induced by proteolysis and/or autophagy in the ischemic core (5) for supplying TCA substrates into the penumbra. Of interest is the metabolome data that Asp, Glu, and Gln, nitrogen resources for inosine monophosphate (IMP) and adenylates, are decreased in the ischemic hemisphere. In contrast, adenosine, IMP, and their degraded metabolites are increased while uric acid is maintained (Fig. 5D). Assuming that the ischemia-induced vasodilators (18) (e.g., adenosine) increase microvascular patency and the aforementioned substrates including adenosine are transported from the core to penumbra, it is not unreasonable to speculate that the penumbra actively performs energy-dependent salvage of ATP. Further investigation is necessary to decipher roles of ischemia-induced microvascular responses for supporting such substrate utilization in the penumbra.
Implications and Future Directions
Our results demonstrate the first simultaneous mapping of labile adenylates and related metabolites reflecting cerebral energy metabolism in situ. The novel strategy using IMS combined with CE/ESI/MS not only permits quantitative intergroup comparisons of local metabolic responses to cerebral ischemia but also enables us to metabolically define two specific regions of ischemic brain, namely the core and the penumbra. The ischemic penumbra is often defined as areas of brain that were damaged but not yet dead after focal ischemia (19) and/or of unstable regions threatened with possible injury yet potentially amenable to therapeutic intervention (8). In the context of establishing more robust definition of penumbra, the current approach is the first to reveal metabolic systems of active penumbra with the identification and quantification of molecules directly in tissue sections.
The present study is able to fill only a part of mechanisms in altered energy metabolism during ischemia with some details in adenine metabolism. It also helped us to postulate putative roles of interregional transport of energy substrates across the metabolic boundary to maintain the viability of the penumbra of ischemic brain. Compelling mechanisms to support the idea, however, will rely on the molecular identifications of many additional as-yet-undefined metabolites, which are currently taking place in our laboratory.
Elevation of NADH in the ischemic core is not only a key modulator of TCA cycle but also a determinant of oxidative stress through multiple mechanisms including iron release from ferritin and modulation of xanthine dehydrogenase/oxidase (9, 21, 27, 31, 37). Under low-flow hypoxia where molecular oxygen is still available, but not in global anoxia in the liver, excessive NADH inhibits xanthine dehydrogenase and thereby triggers purine catabolism through xanthine oxidase activity that generates reactive oxygen species (ROS) (21, 27, 31). In the brain ischemia, mechanisms whereby hypoxic conditions cause overproduction of reactive oxygen species in the ischemic core appear paradoxical and remain elusive. In this regard, the current IMS technology blended with robust bioimaging of mitochondrial functions and oxidative stress will provide a powerful tool to answer such a lingering question.
At present, the spatial resolution is not fine enough to resolve relationship within the neurovascular unit, which is made up of neurons, astrocytes, and endothelial cells. We believe that improvement of spatial resolution at cellular and subcellular levels will be able to define cell-specific metabolic mechanisms. Such advanced approaches will give rise to new insights into the complex interactions of oxygen-dependent biological gases, such as NO and CO (13), and fulfill control functions to treat stroke.
Methods
MCAO model
Experiments were approved by the Animal Care and Utilization Committee of Keio University School of Medicine. Male C57BL/6J mice (22–26 g; Clea Japan, Tokyo, Japan) were anesthetized with isoflurane (4% for induction, 1.5%–2% for maintenance) in 30% O2/70% air. Rectal temperature was maintained at 36°C ± 0.5°C throughout.
A focal brain ischemia was induced for 10 or 60 min by advancing a 6-0 nylon suture with its tip rounded to occlude the origin of a left middle cerebral artery (MCAO) as described previously (12). Occlusion was confirmed by the laser Doppler (ALF21; Advance). CBF was determined immediately before and after the MCAO against contralateral hemisphere at the skull over the territory of the MCA, that is, 2 mm posterior and 4 mm lateral to bregma. We found that CBF was reduced by MCAO to an average of 20% preocclusion CBF. Specifically, CBF was 35.8 ± 4.0 mL/min/100 g tissue before MCAO and 3.9 ± 1.3 mL/min/100 g tissue after MCAO. In the sham group, the same procedures were induced, except the occlusion, and total anesthetic period was same with the group of 60-min occlusion.
In situ freezing and tissue removal
Brain is extremely susceptible to postmortem changes in contents of cerebral labile metabolites such as adenylates. Thus the best available methods must be employed to trap the metabolites as they exist in vivo and to minimize autolytic changes. To achieve this, we employed the in-situ freezing method (17, 20), which enables suspension of metabolic processes by rapidly lowering the tissue temperature while maintaining blood flow and oxygenation during the freezing process. To do so, mice were deeply anesthetized with diethyl ether and the head skin was trimmed. Tip of the head was dipped into liquid nitrogen with great care not to immerse the nose. Frozen brains were dissected with a surgical knife in a refrigerated box at −30°C. When we found any trace of blood at the anterior cerebral artery-MCA bifurcation that suggested a possible subarachnoid hemorrhage, we excluded these brains. Postmortem freezing where the brain was frozen after decapitation was also conducted in comparison with in situ freezing.
Quantification of metabolites by CE/ESI/MS
CE/ESI/MS is unique in that it allows high-throughput analyses of water-soluble metabolites from biological samples (23, 24, 33). A large number of metabolites are often too polar to be retained by reversed-phase columns commonly employed. As a major fraction of metabolites, including ATP, ADP, and AMP, are polar and ionic, a good approach is to use CE/ESI/MS. In contrast with gas chromatography (GC) and liquid chromatography (LC), which operate based on differential interactions with a stationary phase, CE separates analytes according to their mass-to-charge ratios.
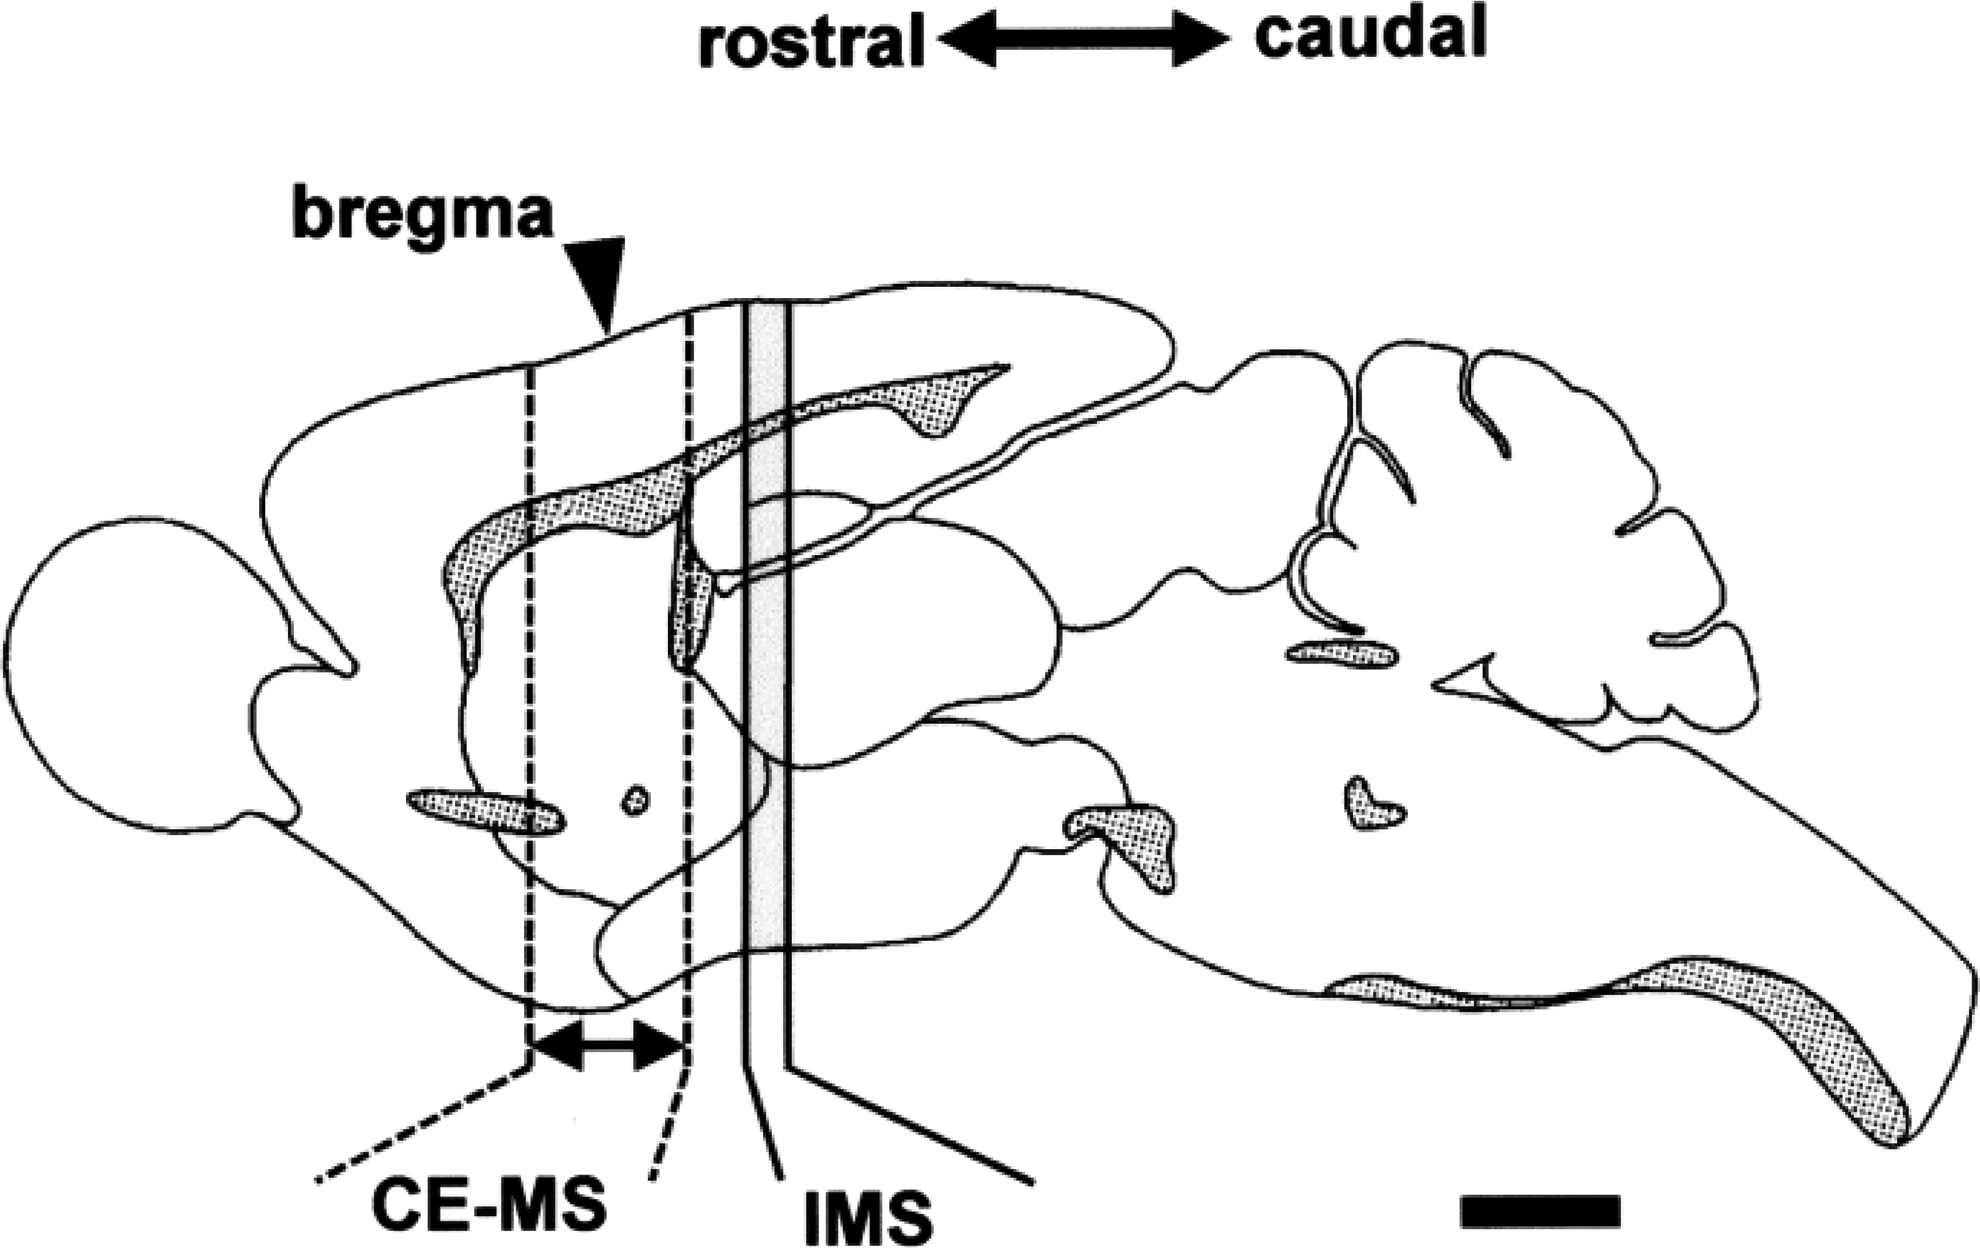
As shown in Figure 6, a 2-mm-thick frozen coronal section adjacent to the section used for the IMS analysis was used for metabolome analyses as described previously (15, 23). All CE/ESI/MS experiments were performed using an Agilent CE Capillary Electrophoresis System equipped with an air pressure pump, an Agilent 1200 series MSD® mass spectrometer, an Agilent 1200 series isocratic high-performance liquid chromatography pump, a G1603A Agilent CE/MS adapter kit, and a G1607A Agilent CE/MS sprayer kit (Agilent Technologies).
Imaging MS
Chemicals
9-Aminoacridine (9-AA) was obtained from Kanto Chemical. All other chemicals were obtained from either Sigma-Aldrich or Wako. All chemicals were of analytical or reagent grade.
Tissue sectioning
Serial coronal sections with 8 μm thickness (29) were cut with a cryomicrotome (CM1900; Leica Microsystems) (Fig. 6) and thaw-mounted on the indium tin oxide-coated glass slide (No. 578274; Sigma) at −20°C.
Matrix deposition on the tissue specimens
Matrix is required to absorb laser energy to induce desorption and ionization of analytes. Homogeneous cocrystallization of the analytes with matrix is crucial for high sensitivity of MS analysis. Prior to matrix deposition, tissue slices were kept for 20 min with desiccant to equilibrate at room temperature and another 20 min in a vacuum chamber. This dehydration process prevents the specimens from detaching during MALDI TOF experiments under a complete vacuum condition. Glass slides were mounted to an MS target plate (Shimadzu Corporation) with conductive-adhesive double-sided tape (3M). Microdeposition of the matrix solution on the tissue specimens at a picoliter level was conducted by using an automatic Chemical Inkjet Printer (CHIP-1000; Shimadzu Corporation). Freshly prepared 9-AA (25 mmol/L solution in 70% [v/v] methanol) was chosen because of its superiority to yield high signals for low molecular anionic metabolites (7). As an external standard for calibration, an aliquot of 0.5 μL of 100 μmol/L (w/v) angiotensin II in distilled water was spotted near the specimen and the same volume of the matrix was mixed with the standard on the glass slide. An aliquot of 300 pL of 9-AA was deposited per spot at a pitch of 0.2 mm on the specimens. This process was repeated 10–20 times. After matrix deposition, the slides were kept in a vacuum chamber for 20 min to dry up the matrix. Images were collected from typically 53 × 35 spots (1855 spots), separated by 0.2 mm pitch for an image size of 10.6 mm × 7.0 mm.
MALDI mass spectrometric analysis
All mass imaging experiments were performed in the negative ionization mode by using a MALDI mass spectrometer (AXIMA Performance MALDI TOF/TOF, and AXIMA Resonance MALDI QIT TOF/TOF; Shimadzu Corporation), and tandem MS analyses were performed with a prototype “mass microscope” MALDI-QIT-TOF mass spectrometer (Shimadzu Corporation) (10). Laser power was adjusted as required.
MALDI mass spectra were acquired using AXIMA Performance (Shimadzu Corporation) with 337-nm N2 laser, at 10 Hz, and operated in the linear negative mode. Unless otherwise noted, mass spectra were obtained with following conditions: accelerating voltage of 20 kV, scanning mass range of 1–2000 Da, and “pulsed extraction mass” was set to 1000 Da, respectively. The mass spectrometer was calibrated with spotted angiotensin II and 9-AA, whose mass-to-charge ratios (m/z) are 1044.52 and 193.07 in the negative mode, respectively. In parallel, the laser power was optimized to obtain a high ratio of the standard to matrix molecule. Irradiation area was determined with the positional information from CHIP-1000 with minor adjustment. All imaging data were acquired in a vacuum condition (8.0 × 10⁻⁵ Pa), and spectrum under m/z 250 was not collected. This is because several major peaks from 9-AA were obtained under m/z 250 Da (35) in the negative mode, which reduce the sensitivity to the target mass range. The number of laser shots per spot was set to 200 with a roaming function that enables to obtain averaged data from each spot, avoiding the effects of spotty matrix.
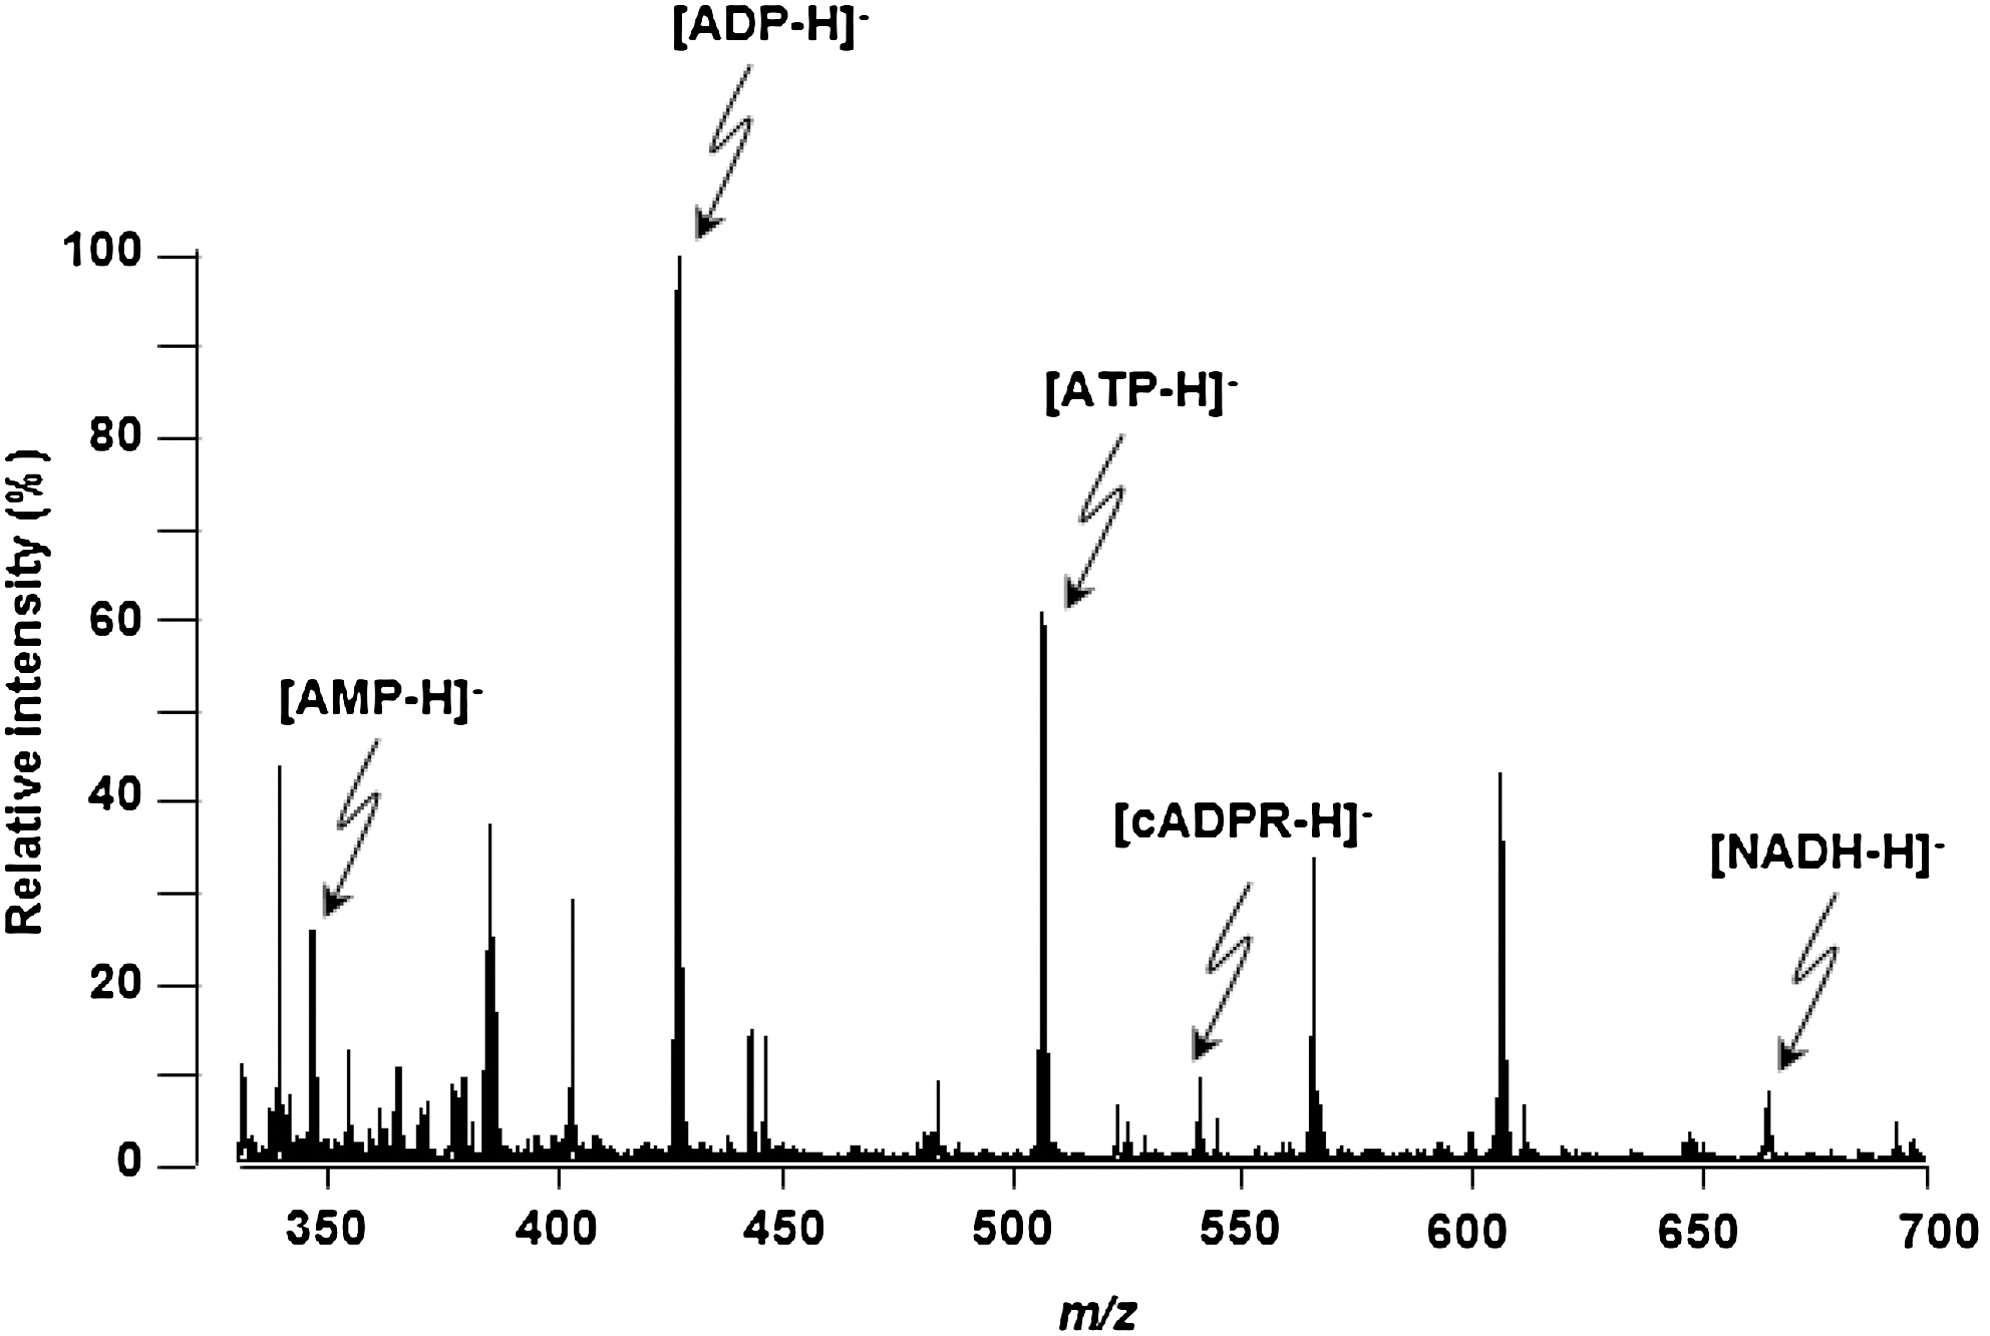
As shown in Figure 7, MALDI-MS analysis in the negative ion mode using 9-AA as the matrix yielded clear AMP, ADP, and ATP signals on the brain tissue, consistent with previous studies (4, 7, 30). Moreover, signals for NADH and cADPR were detected for the first time.
For adjacent sections, identification of metabolite peaks was carried out by fragmentation method using MALDI-QIT-MS/MS analysis in the low-mass range mode (AXIMA Resonance; Shimadzu Corporation). This tandem MS analysis was accomplished by turning on collision-induced dissociation gas that contained argon at a medium pressure. In this experiment, the conditions of data acquisition, that is, the laser power, collision energy, and number of laser irradiations, were changed to obtain product-ion mass spectra that had high intensity and signal-to-noise ratios of the fragment peaks. The calibration was performed with an external calibration method with ions from standard reagents, namely AMP, ADP, and ATP.
The standard MALDI samples for tandem MS analyses were produced by mixing 1 μL of the diluted 1 μmol/L each standard solution with 1 μL of 25 mmol/L 9-AA in 70% methanol solution. For crystalline matrixes, the samples were allowed to air-dry at room temperature (10). BioMap software (Novartis;
Metabolic mapping
Estimating and mapping of adenylates
To construct metabolic maps, mass signals covering m/z between 250 and 2000 were collected from 53 × 35 spots on a tissue. A direct comparison between metabolic maps of different slices requires realistic transformation of acquired mass signals of a metabolite in absolute terms such as tissue content in μmol/g. To do so, the apparent content of a specific metabolite at the ith spot of tissue (Ci
) was estimated as follows:
where C′ denotes the metabolite content of tissue from a contralateral hemisphere determined by the CE/ESI/MS, Ii
is the maximum intensity among mass spectra in a specified range at the ith spot, and
Total ion current normalization
To minimize spot-to-spot variance of signal intensities due to heterogeneous crystallization of the matrix analyte, normalization of raw intensity values with total ion current (TIC; the sum of all the separate ion currents) was carried out for a specified mass spectrum for all spots (11, 28). The normalized intensity of the ith m/z at the jth spot (
where I (i,j) denotes the acquired mass intensity of the ith m/z at the jth spot, K is an arbitrary constant, and TIC j represents the summed value of all the signal intensities between m/z 250 and m/z 2000 at the jth spot. Such a normalization process was automated with script written in Python.
Construction of a content map of a metabolite
To construct an ion-content map, data acquired with a MALDI mass spectrometer (AXIMA Performance) were saved as 1855 comma-separated variable (CSV) files and each file contained m/z values between 250 and 2000 and their corresponding values of mass intensities as single-spot information. These 1855 CSV files were automatically read, compiled as a single file, and processed to construct an ion-content map. All the transformation processes were automated by a custom script written in Python. For instance, to map ATP contents of a brain section, a maximum intensity in the m/z regions between 505.5 and 506.5 with a pitch of 0.03368 was chosen, normalized, and converted to an apparent tissue content of ATP ([ATP]app in μmol/g tissue) following the equation (a). [ATP]app calculated from 1855 spots were then automatically registered to appropriate x–y coordinates. The resulting CSV file was finally exported to Microsoft Excel and the values of [ATP]app were color coded on its appropriate x–y coordinates.
Conversion using equation (a) assumes that MS intensities are linearly correlated with contents of a metabolite, which was found to occur (data not shown). Under the specified condition in vitro using various contents of each adenylate, the contents were empirically a linear function of the height of mass signals (data not shown). We, therefore, made an assumption that this relation holds in the tissue specimen.
Using values for [ATP], [ADP], and [AMP] estimated above, the energy charge (EC) was calculated as (2):
Region-specific analyses
For the subsequent analysis described in Figure 3, four regions of interest were selected by careful visual inspection to match anatomical localization delineated by the hematoxylin and eosin staining of the identical specimen. Extracted values within each region of interest are averaged and used for the assessment of region-specific analyses of changes in each metabolite and EC in the ischemic brain. The identical areas from the contralateral hemispheres were examined as control.
Histological analysis of tissue specimens after the IMS analysis
After the MS imaging analysis with MALDI, same sections were used for histological analysis to visualize anatomical structures of the tissue. First, the sections were washed with 70% methanol for 1 min to remove the matrix, fixed with 10% formalin in PBS for 5 min, and washed in flowing water. Sections were immersed in hematoxylin and eosin solutions (Sakura Finetech) for 5 and 3 min, respectively, dehydrated through an ethanol series, cleared with xylene, and mounted.
Microtubule-associated protein-2 immunoreactivity to determine neuronal injury
Immunostaining of the tissues for MAP2 was conducted. Loss of MAP2 is associated with dendrite injury of neurons; thus, its staining serves as a marker for neuronal injury. First, tissue sections were fixed with 4% of paraformaldehyde for 5 min, washed with PBS, and permeabilized with 0.3% (v/v) triton X-100. To block nonspecific binding of antibody, sections were incubated with 5% (v/v) sheep serum, 0.2% (w/v) BSA, 0.01% (w/v) thimerosal, and 0.3% (v/v) triton X-100 in PBS (−) for 1 h at room temperature. Then monoclonal anti-MAP2 antibody (MAB378, 1:500; Chemicon) was applied on the sections overnight at 4°C. Alexa Fluor-488–conjugated anti-mouse IgG was used to visualize MAP2. After washing, sections were mounted in Vectashield antifade medium (Vector Laboratories) and stored at 4°C until examined. Sections were examined with Biozero digital microscope (BZ-9000, Keyence) with a 10 × objective (CFI PlanApo, NA 0.45; Nikon).
Footnotes
Acknowledgments
This work was supported by a Grant-in-Aid for Scientific Research 21500353 from the Japan Society for the Promotion of Science (to M.K.) and the Japan Science and Technology Agency (JST), Exploratory Research for Advanced Technology (ERATO), Suematsu Gas Biology Project, Tokyo 160-8582 (to M.Su.). Development of imaging MS microscopy was supported by Development of Systems and Technology for Advanced Measurement and Analysis from JST (to M.Se). A.Y-K. is a fellow supported by Research and Development of the Next-Generation Integrated Simulation of Living Matter, a part of the Development and Use of the Next-Generation Supercomputer Project of the Ministry of Education, Culture, Sports, Science and Technology Japan (MEXT). M.Su. and M.Sc. are members of the Global Center of Excellence Program for Human Metabolomics Systems Biology from MEXT. We are grateful to Dr. M. Ishikawa for helping us to develop the MCAO model, and to Professor F.E. Curry for his many helpful suggestions for the early stage of our manuscript.