
Abstract
Background:
The validation of high-efficiency particulate air (HEPA) housing decontamination efficacy is crucial for maintaining critical environments and is normally assessed by positioning biological indicators at the downstream port (filtered side) before the decontamination cycle. This method is favored for its significantly lower biohazard risk. HEPA housings and filters typically designed for high airflow face challenges during decontamination due to the diameters and positions of upstream and downstream ports, potentially impacting the distribution of decontamination agents.
Objective:
This study investigates the effectiveness of this prevalent validation method, particularly focusing on the uniformity of decontamination agent dispersion across the HEPA filter.
Methods:
Preparation: HEPA filters and housings were set up in a controlled environment. Placement of Biological Indicators: Indicators were positioned at multiple points, including the downstream port and various peripheral regions of the filter. Decontamination Cycle: The decontamination process was initiated using a standard protocol for hydrogen peroxide vapor or another selected agent. Measurement: The concentration of decontamination agents was measured at each indicator position using appropriate detection techniques. Analysis: Data were analyzed to assess the uniformity of decontamination agent distribution and identify any significant variations across different areas of the filter.
Results:
Our findings reveal a notable variability in the concentration of decontamination agents across different areas of the HEPA filter, especially in peripheral regions. Such variability poses questions about the current method’s ability to ensure comprehensive decontamination, given that the concentration at the exit port does not accurately reflect exposure across all filter surfaces. This discrepancy between expected and actual decontamination efficacy underscores the need for optimization in decontamination practices.
Conclusion:
The discrepancy between expected and actual decontamination efficacy underscores the need for optimization in decontamination practices. This study highlights the importance of validating decontamination methods and sets the stage for future research aimed at enhancing the uniformity of agent exposure across the HEPA filter. This study advocates for further investigation into methods that could ensure more reliable and effective decontamination, which is vital for biorisk management and the prevention of pathogen contamination.
Introduction
The increasing reliance on high-efficiency particulate air (HEPA) filtration systems in critical environments necessitates rigorous validation of decontamination processes to prevent pathogen exposure(s) during the changing of HEPA filters.1–3 Traditional methods for validating the efficacy of HEPA housing decontamination typically involve placing biological indicators at the downstream (HEPA-filtered) side of the HEPA housings, specifically the downstream (or exit) port, as it is considered safer due to its lower biohazard risk. 4
Despite the widespread acceptance of this method, scrutiny by our team members, we suggest that the distribution and concentration of decontamination agents, such as vaporized hydrogen peroxide (VHP), may not be as uniform as initially perceived.5,6 This could potentially compromise the entire decontamination process, leaving parts of the HEPA system inadequately decontaminated. Therefore, this study aims to assess the effectiveness of current validation practices and explore the potential for optimizing the placement of biological indicators and the application of decontamination agents to ensure comprehensive coverage and efficacy. 7
Through detailed experimentation and analysis, we aim to highlight the discrepancies in agent concentration across different areas of the HEPA filter and suggest methodologies that could enhance the reliability and effectiveness of HEPA housing decontamination. By doing so, we contribute to the ongoing efforts in improving biorisk management and ensuring the safety of critical sterile environments.8,9
Materials and Methods
HEPA Housing
H14 HEPA filter from Cambridge Filter Singapore (H14 V-bank HEPA filter s/n: 20230912-77034110) and prefilter (G4 beverage board) were purchased by Yizeta and delivered to Bio-Pointe, where Bio-Pointe’s technician installed and performed leak testing on the HEPA filter.
The single-HEPA housing was on loan to Yizeta by Bio-Pointe for a period of 50 days. This stand-alone unit was constructed from grade 304 stainless steel material with 2-inch decontamination ports mounted with stainless steel ball valves at both the upstream and the downstream sides of the housing. The HEPA housing was used exclusively for demonstration, making it suitable for the study with no risk of any contamination.
Decontamination Setup
Yizzy HEPA decontamination machine, manufactured by Yizeta Pte Ltd, Singapore, was used for this study. This machine is an automated, closed-loop HEPA housing decontamination unit that uses either hydrogen peroxide or peracetic acid as the decontamination agent. The Yizzy HEPA decontamination machine comes with a set of vaporized hydrogen peroxide and relative humidity sensors, high-torque circulation fan, and a decontaminant nebulizer.
The machine forms a closed loop by connecting to the HEPA housing’s upstream and downstream ports via standard 2-inch camlock fittings. The circulation fan provided constant air circulation throughout the duration of the decontamination cycle. The vaporized hydrogen peroxide and relative humidity sensors were connected at the “exit” port, where the HEPA filtered air was drawn out of the HEPA housing, circulated within the closed-loop cycle and returned back to the HEPA housing through the “entry” port. In our case, the exit port is also known as the downstream port, while the entry port is known as the upstream port.
An additional vaporized hydrogen peroxide sensor (Brand: Viasala, Model: HPP272) was placed inside the downstream (HEPA filtered) compartment, at the center of the chamber, depicted in Figure 1. The sensor was connected to the same Yizzy decontamination machine via an additional analog input connection for additional data input during the decontamination cycles. All the sensors used were calibrated within 12 months of the study period. The two hydrogen peroxide sensors (exit port and inside the downstream compartment of the HEPA housing) allowed us to map the concentration differences between these two zones.
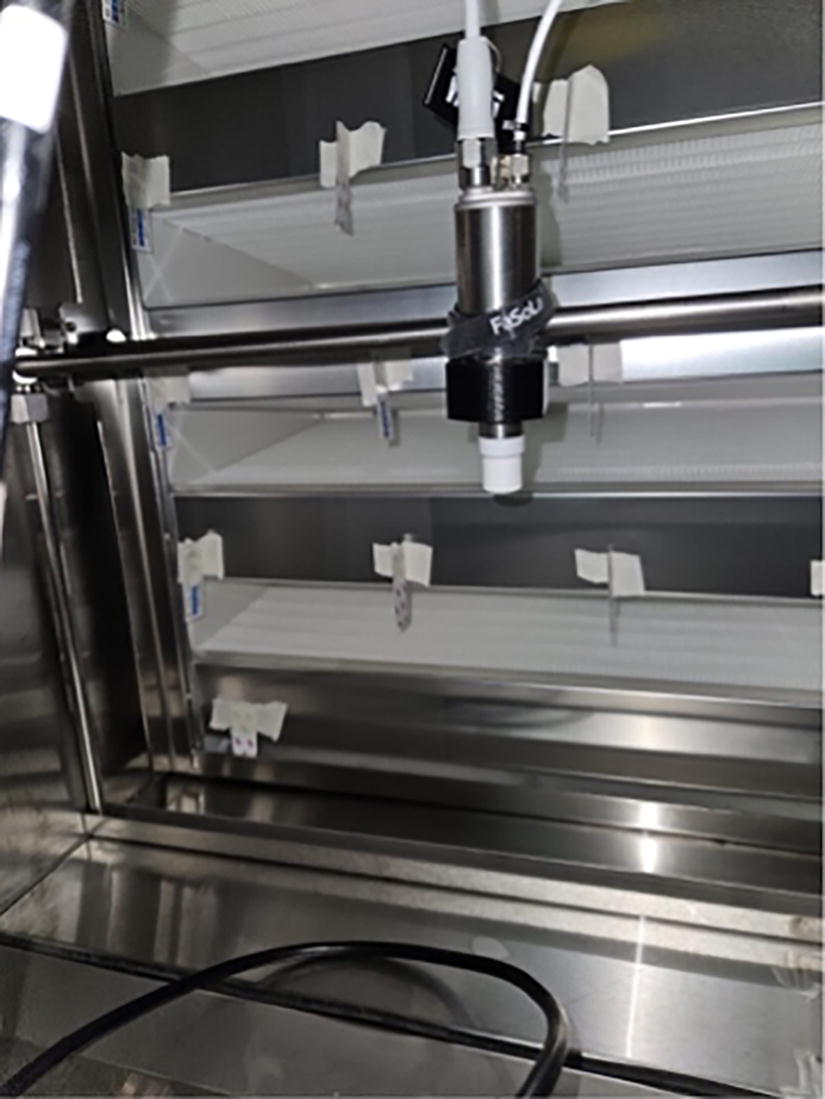
Additional hydrogen peroxide sensor (Brand: Viasala Model: HPP272).
At the entry port connection is where the hydrogen peroxide nebulizer was connected and the decontamination agent to be supplied into the HEPA housing. Nebulized hydrogen peroxide had a particle size of between 5 and 20 μm in diameter entering into the HEPA housing chamber. The large surface area of the nebulized decontamination agent would readily vaporize 10 at the upstream side of the HEPA housing and penetrate across the HEPA surfaces by the air flow created from the closed-loop decontamination machine.
Another unique feature of the Yizzy HEPA decontamination machine is an in-line receptacle at the exit port to house both the biological indicator(s) and the chemical indicator. This feature allows biological and chemical indicators to be placed securely within the closed decontamination loop to perform its decontamination validation. Indicators are easily retrieved after the decontamination process without compromising both bio and chemical safety of the personnel.
The Yizzy HEPA decontamination machine is driven by a microcontroller that is programed to run at preset decontamination cycles. Sensors on the machine provided real-time feedback to the microcontroller and adjusted the decontamination cycle according to the conditions of the HEPA house. All the data captured from the decontamination cycle were stored for references and reporting.
Hydrogen Peroxide Solution
About 30% v/v stabilized hydrogen peroxide solutions were purchased from Kimic Chemitech Pte Ltd (Singapore) and used as the primary decontaminant. No other chemicals were used for this study.
Biological Indicators
ISO11138 compliant biological indicators (Tyvek-type) Geobacillus stearothermophilus spores (10e6 population) from Mesa Labs were used for this study. Six biological indicators (BIs) were evenly distributed at the downstream side of the HEPA filter before every cycle (1. top-left; 2. top-right; 3. bottom-left; 4. bottom-right; 5. middle, and 6. exit port). The BIs were placed as close to the HEPA surfaces as possible to accurately reflect hydrogen peroxide exposure. To prevent any impedance to the airflow, the BIs were positioned perpendicular to the direction of the air flow. To incubate the biological indicators after the decontamination cycles, commercially prepared tryptic soy broth (TSB) was aliquoted into 5 mL sterile plastic disposable tubes.
Dispensing of the TSB was performed in a Nuaire’s Class II type A2 Biological Safety Cabinet (BSC), and the TSB tubes were stored in a refrigerator (8°C) for subsequent usage. Inoculation of the biological indicators was performed in the BSC and incubated in Memmert’s bacterial incubator with the temperature setpoint of 57.5°C (±2.5°C) for an incubation period of 7 days.
Chemical Indicators
ISO 11140 type 4 hydrogen peroxide chemical indicators (Brand: 3M, model: 1348) were also used for the study. For each decontamination cycle, 26 chemical indicators would be evenly distributed at the downstream side of the HEPA filter (25 on the HEPA side, 1 at the exit port). The position of the chemical indicators was similar to that of the biological indicators. The chemical indicators were retrieved after aeration, and figures of the indicators were taken immediately after retrieval.
A simple rig (Figure 2) was set up to allow a consistent means of measurement. It also improved the efficiency of reading results. Chemical indicators that were retrieved from the HEPA housing were photographed immediately to capture the color change as accurately as possible.
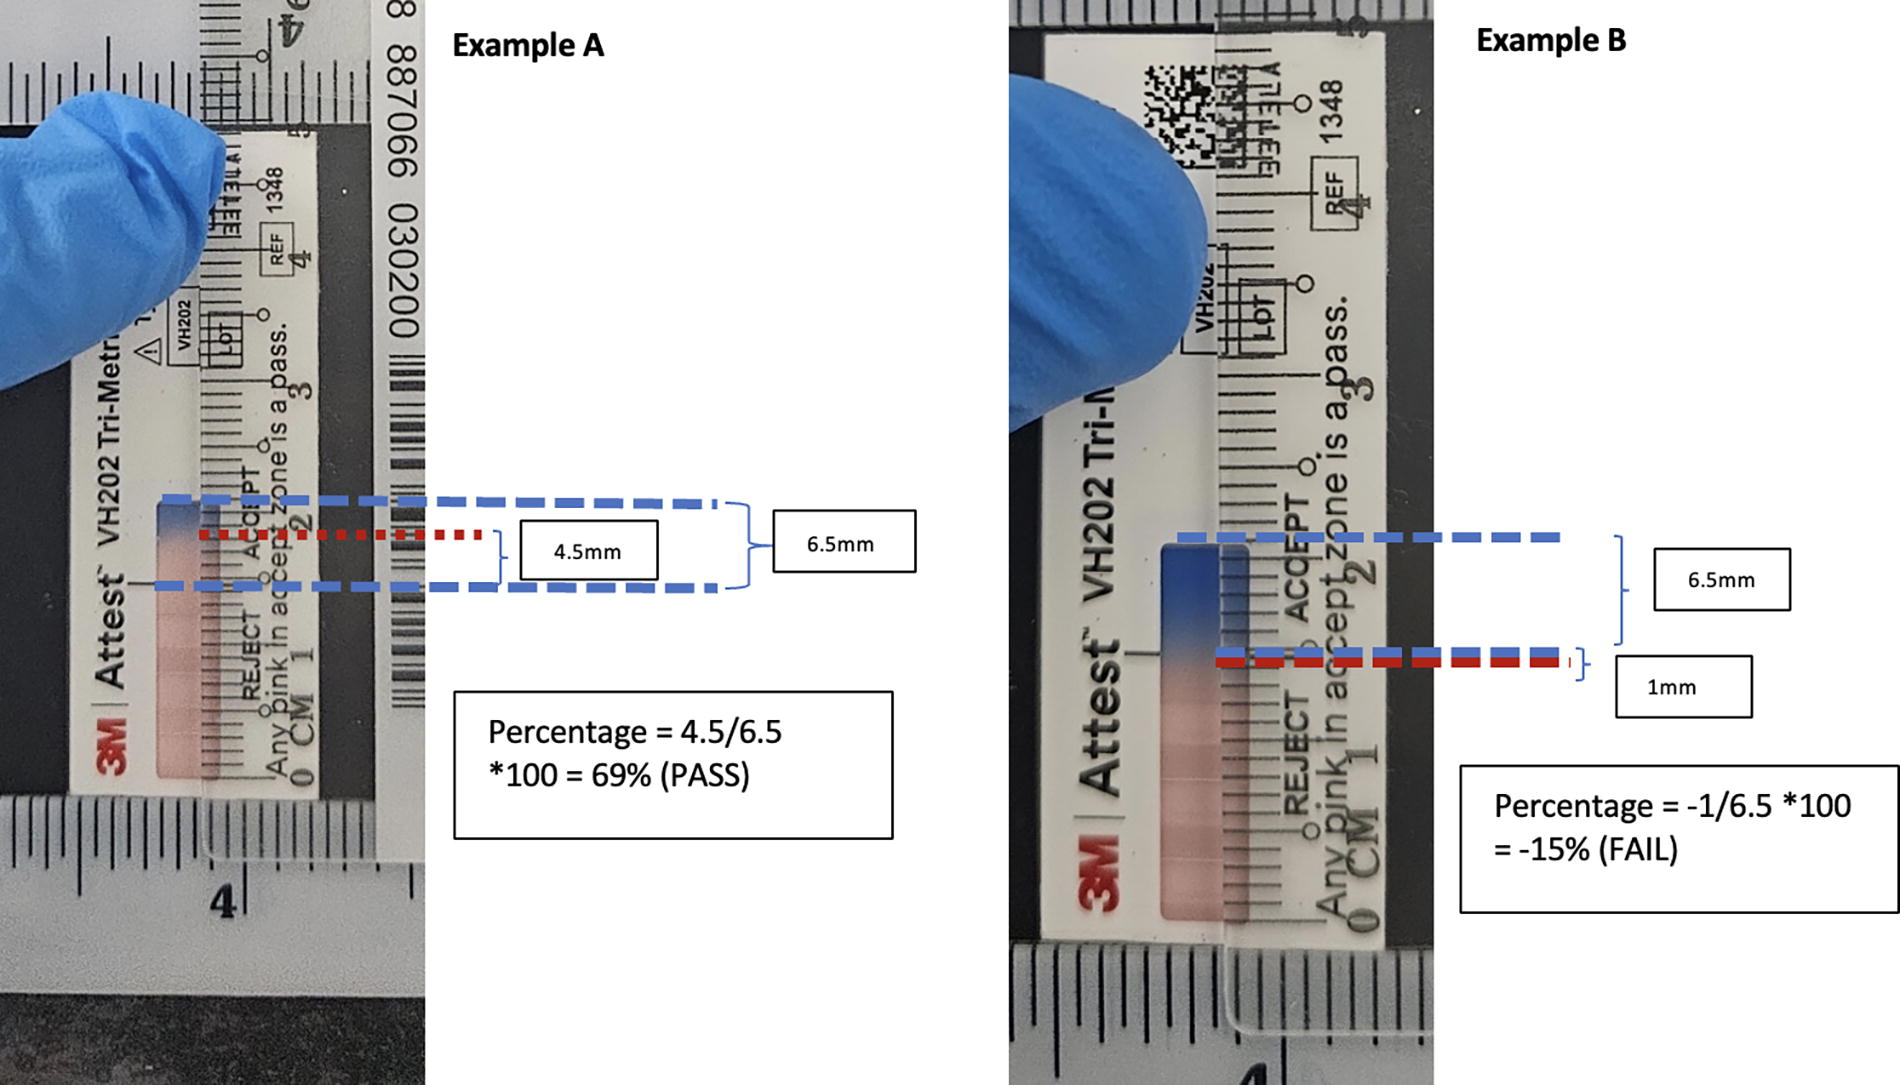
Percentage of color change was calculated by taking the length between the “pass” line to where the color change (pink) has occurred and divided by the total length from the “pass” line to the end of the indicator mark and multiplying by a factor of 100. Example A showed a significant color change giving a percentage of 69%. Example B showed that the color change did not cross the pass line, resulting in a −15% or a fail result.
Decontamination Cycles
A total of 20 decontamination cycles were performed with varying parameters (VHP concentration and cycle time). Each cycle time consisted of both introduction and contact time. Once each cycle time was completed, the aeration cycle would be initiated with the use of an external extraction fan to purge the VHP from the HEPA housing. During the aeration cycle, the HEPA decontamination machine would monitor the hydrogen peroxide concentration until it reached 1 ppm or less. Retrieval of biological and chemical indicators was only done when the VHP concentration was <1 ppm (the OSHA Permissible Exposure Limit [PEL] for hydrogen peroxide is 1 ppm). For safety precautions, personnel retrieving the indicators would don full face respirators (Brand: 3M, model: 6800) with hydrogen peroxide vapor cartridges, coveralls, and nitrile gloves.
Results
Twenty decontamination cycles were performed starting from the highest cumulative VHP concentration. Cumulative hydrogen peroxide concentration was calculated from taking the average VHP concentration in parts per million and multiplying by the cycle time. And with each cycle, the cumulative hydrogen peroxide concentration would reduce in order to determine the failure points of the study, as depicted in Table 1.
Showing the concentration of VHP at exit port versus concentration of VHP inside the downstream side of the HEPA compartment
Cumulative ppm at the exit port is the product of the cycle time (h) and the exit port (ppm/h). Cumulative ppm of the HEPA compartment was calculated respectively. The differences in cumulative concentration varied between cycles, but the cumulative concentration at the exit port was constantly higher. HEPA, high-efficiency particulate air; ppm, parts per million; VHP, vaporized hydrogen peroxide.
When we compare the exit port VHP concentration against the concentration inside the downstream chamber (Figure 3), we observed a consistent trend throughout all the decontamination cycles. The concentration reading from the exit port was always higher than the downstream chamber. This result supported our initial postulation that the concentration readings taken at the exit port may not be an accurate representation of the concentration across the HEPA filter surfaces.
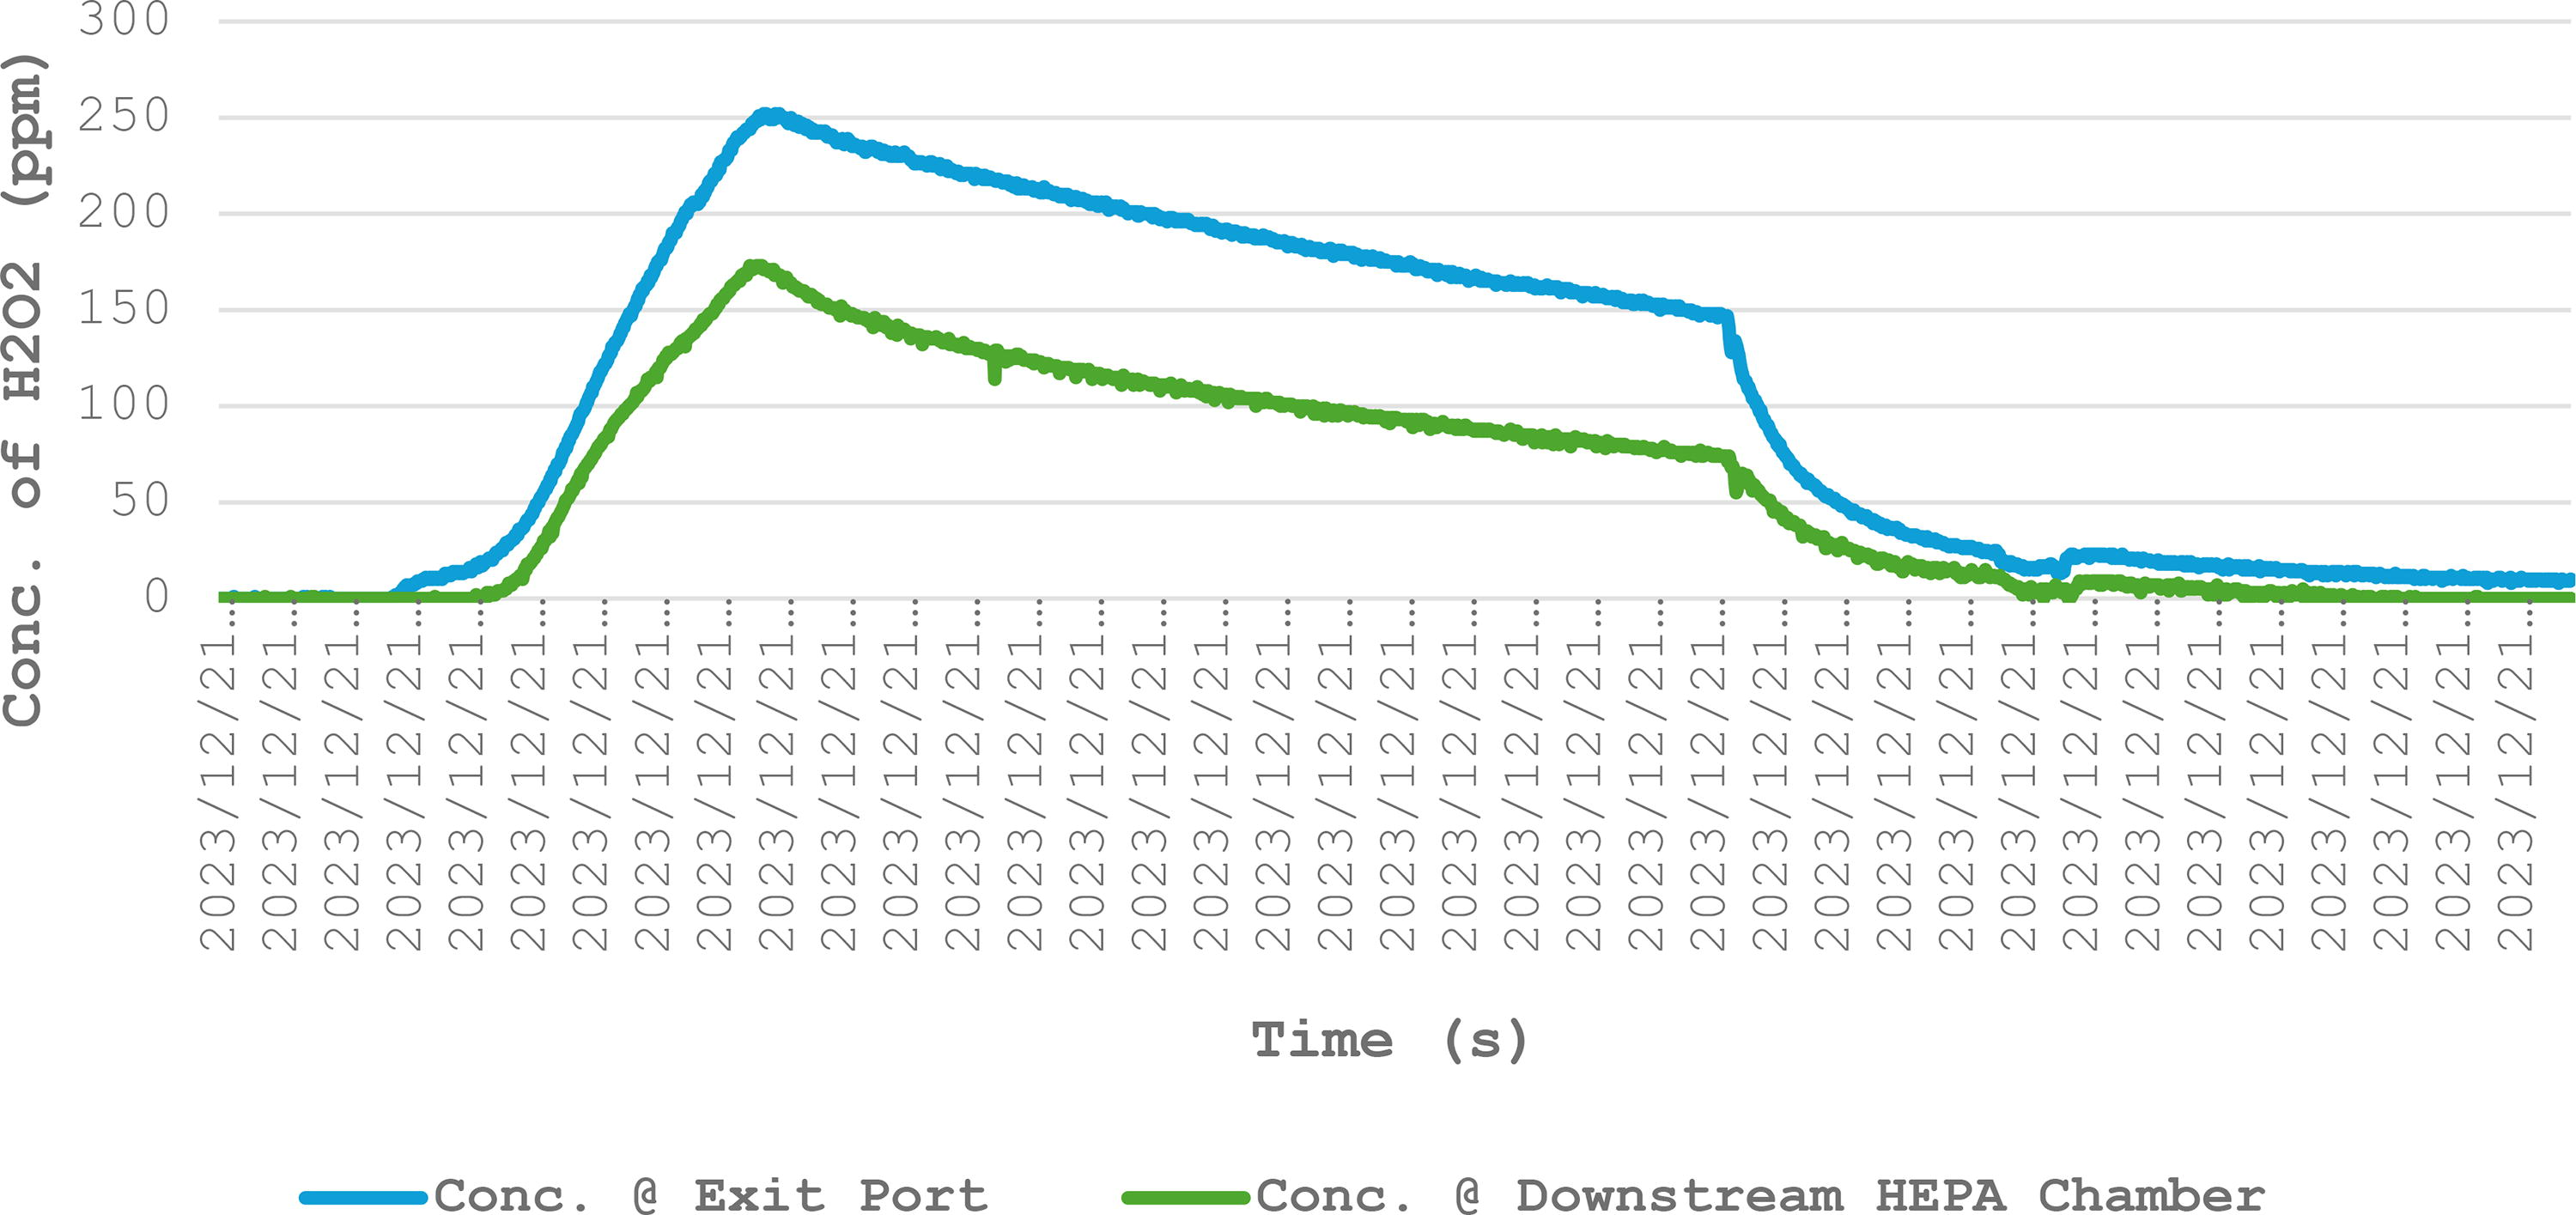
An example of concentration of VHP at exit port vs concentration of VHP at downstream HEPA chamber. The concentration of VHP at the exit port was consistently higher throughout the cycle time. VHP, vaporized hydrogen peroxide.
Biological Indicators
Based on the 20 decon cycles, all the BI results retrieved from the exit port had passed the sterility test. However, it is crucial to note that even when BIs at the exit port pass, BIs positioned at other areas of the HEPA filter, especially at the peripheries, can still fail. Cycle 18 (Table 1), with 1.5 h cycle time and a cumulative concentration of 33 ppm at the HEPA compartment, resulted in four out of five BI failures. All four failures occurred at the four corners of the HEPA filter, while the center BI position passed the sterility test. The result indicates that there is higher exposure of the decontamination agent at the center compared with the peripheral surfaces of the HEPA filter.
Looking at cycles 19 and 20 (Table 1), with 1 h cycle time and cumulative concentrations of 24 and 29 ppm at the HEPA compartment, respectively, all 5 BI at the downstream HEPA failed the sterility test, while their respective BIs at the exit port side were tested negative. This result clearly demonstrates that a passing BI at the exit port does not guarantee effective decontamination across the entire HEPA filter. The concentration of the decontamination agent at the exit port being higher than the concentration within or across the HEPA surfaces results in this discrepancy.
Chemical Indicators
3M’s ISO11140 type 4 hydrogen peroxide indicators provided good insight into the concentration exposure across the surface of the HEPA filter. The color change from the indicators was graduated, and we were able to quantify the percentage of color change from the result.
Throughout most of the 20 cycles, the HEPA housing was exposed to varying hydrogen peroxide concentrations and contact time. It was observed that the chemical indicator’s color change at the exit port was consistently greater than the average color change taken from the HEPA surface.
From Table 2 or cycle 14, the percentage of color change at the exit port was at 83%, while the average color change over the HEPA filter surface was 47.48%. From Table 3, the percentage of color change at the exit port was 62%, and the average color change percentage across the HEPA filter was 24.02%. Both tables (along with all other chemical indicator results) were congruent with the initial VHP concentration results and the previous biological indicator results.
Cycle 14—positions of the chemical indicators across the HEPA surface against the percentage of color change on the chemical indicators after decontamination with all biological indicators cleared
Cycle 18—positions of the chemical indicators across the HEPA surface against the percentage of color change on the chemical indicators after decontamination with four biological indicators failures located at each of the filter corners
Upon further examination of the chemical indicator results, we observed that the color change percentages were consistently higher at the center region compared with the peripheral surface of the HEPA filter.
From Table 2 (or cycle 14), if we grouped five points at the center (58%, 62%, 60%, 58%, and 58%) and averaged them, we would have 59.2%. Similarly, by taking all four corners of the HEPA filter (37%, 37%, 42%, and 33%) and averaging them, we would have 37.25%. Referencing the percentage of color change at the exit port (83%), we could observe that the concentration at the exit port would always be the highest, followed by the center of the HEPA filter and the peripheral regions of the HEPA filter would always get the lowest concentration. This would be congruent with cycle 14’s VHP concentration as well as its biological indicator results.
From Table 3 (or cycle 18), the average percentage color change between the center of the HEPA and the four corners was 34.6% and 17.75%, respectively. By incorporating the exit port percentage color change (62%) and collating the VHP concentration and the biological indicator results, we could observe that the peripheral region with the 17.75% color change was already below the exposure concentration of the VHP, thus resulting in failure of all biological indicators placed at all four corners of the HEPA surface. However, its center region had an average of 34.6% color change, which had a similar average percentage with cycle 14’s peripheral region of 37.25%, providing adequate cumulative concentration to successfully inactivate the biological indicator.
Discussion
On a positive note, the data presented in Table 1 have clearly demonstrated that with a properly managed and adequately high cumulative concentration of hydrogen peroxide, it is indeed possible to achieve thorough decontamination across the entire surface of the HEPA filter. This outcome underscores the effectiveness of hydrogen peroxide as a potent decontaminant capable of penetrating and inactivating pathogens that may be lodged within the filter matrix. The core objective of this investigation was to assess whether the strategic placement of biological indicators at the exit port effectively mirrors the chemical exposure experienced across the HEPA surface. While we observed that lower cumulative concentrations of <55.5 ppm at the exit port marked the point of failure, the results suggest that such placement does indeed serve as a reliable proxy for gauging decontamination efficacy albeit with some noted limitations regarding spatial homogeneity of exposure. However, it would be prudent for stakeholders and decontamination service providers to validate their decontamination procedures to ensure the efficacy is achieved.
Importantly, our study was not designed with the intent to pinpoint the precise minimum cumulative concentration of hydrogen peroxide necessary for achieving adequate decontamination, although our observations noted a cumulative concentration of 63.75 ppm at the exit port. The selection of this concentration as a benchmark was based on preliminary assessments and existing literature, serving as a starting point for our analysis rather than a definitive threshold. The effective cumulative concentrations for any decontamination process vary depending on the number and type of filters, as well as the specifications provided by the HEPA housing and HEPA filter manufacturers. Given the critical nature of ensuring complete sterilization of HEPA filters to maintain aseptic conditions, it is imperative that future investigations delve deeper into optimizing decontamination protocols. Specifically, subsequent research should aim to refine our understanding of the minimum effective concentration of decontaminants such as hydrogen peroxide, ensuring that it is both sufficient to ensure safety and efficient in terms of resource use.
Additionally, considering the variance in decontamination effectiveness observed at different locations across the HEPA filter, further study is warranted to explore the dynamics of decontaminant dispersion and retention. It would be particularly beneficial to examine whether adjustments in the placement of biological indicators or modifications to the decontamination process itself could yield more uniform distribution and exposure across all filter regions. Such insights could lead to enhanced protocols that ensure more consistent and reliable decontamination outcomes.
Conclusion
It is important to note that due to the biosafety considerations, placing biological indicators at the exit ports of the HEPA housing during onsite decontamination is the safest option. The results have shown that, with proper validation, placing of biological indicators at the exit port of HEPA housings can provide a reliable method for validating the effectiveness of decontamination processes. However, this study has highlighted a significant variability in decontamination agent concentration across different areas of the HEPA filter, with peripheral regions showing lower exposure levels. These findings underscore the importance of considering the distribution and concentration of decontamination agents when assessing the efficacy of sterilization procedures. Future research should focus on optimizing decontamination practices to ensure uniform exposure across the HEPA filter, potentially through the adjustment of biological indicator placement or the exploration of alternative decontamination strategies. Ultimately, ensuring the effectiveness of HEPA housing decontamination is critical to biorisk management against pathogen contamination. It is also important to recognize that every system and operational context is unique, and the data presented here should be considered a starting point. Each facility should conduct its own rigorous testing and validation to develop an optimal decontamination protocol suited to its specific requirements.
Footnotes
Acknowledgments
The authors extend their deepest gratitude to the following individuals for their invaluable technical support and expertise throughout this study: Mr. Dan Yoong of World Biohaztec Pte Ltd, a biocontainment engineer/certifier, who provided repeated advice on technical and engineering aspects, greatly enhancing the authors’ understanding and implementation of biocontainment protocols. Mr. Chin Yew Chyi, Product Manager at Yizeta Pte Ltd, and Mr. Lim Chun Khang, also from Yizeta Pte Ltd, who were instrumental during the experimental phase of the study, offering frequent guidance and hands-on assistance with the Yizzy HEPA decontamination machine. Mr. Desmond Tan, Director of Bio-Pointe Pte Ltd, who generously loaned the single HEPA housing used throughout the research, thereby enabling the practical execution of our experiments. Their contributions were vital to the success of this research, and the authors are profoundly thankful for their expertise and support. The authors gratefully acknowledge the support provided by Yizeta Pte Ltd, which was instrumental to the completion of this study. Yizeta Pte Ltd generously supplied essential resources including experimental space, biological indicators, culture media, and laboratory equipment. This support played a critical role in facilitating the authors’ research efforts.
Authors’ Contributions
C.C.C. was instrumental in conceiving the study and designing the experiments. The author also took the lead in writing the article, ensuring the integration of all findings and theoretical discussions. C.H.K. was responsible for performing the experiments, meticulously carrying out each step, and documenting the results. Both C.C.C. and C.H.K. collaboratively analyzed the data, working together to interpret the results and draw meaningful conclusions from the experimental findings.
Authors’ Disclosure Statement
The authors are employees of Yizeta Pte Ltd, a private company based in Singapore that manufactured the decontamination equipment used in this study. While no financial support was received for the article and the study’s findings can be replicated using any similar decontamination equipment for HEPA housing, the authors acknowledge a potential conflict of interest due to their employment.
Funding Information
This research received no specific grant from any funding agency in the public, commercial, or not-for-profit sectors.