
Abstract
Introduction:
Quantitative data informing biosafety practices have long been lacking. In this study, we describe the conduct of the first large-scale investigation into human reliability in the life sciences laboratory to estimate an error rate during routine biological experiments.
Methods:
To generate these critical data, we conducted two sets of experiments: blinded experiments in clinical laboratories in Brazil, Jordan, and Tunisia, and volunteer experiments in training laboratories in two U.S. universities. In these experiments, GloGerm was used to indicate where spills occurred during laboratory manipulations. In the blinded clinical experiments, dummy samples were introduced into the normal workflow and workers processed them as they would a normal clinical sample. Surfaces were examined at the end of the shift for contamination. In the experiments in the United States, volunteers would repetitively pipette a solution of GloGerm into a 96-well plate and the work area was inspected after each plate.
Conclusion:
The median volunteer is estimated to have an error rate of about 4 or 8 errors per 1,000 manipulations (for volunteers with significant laboratory experience vs. those with little laboratory experience, respectively). Estimated error rates from both experiments are comparable, suggesting that studies using volunteers who know they are working with nonhazardous materials can be used to replicate real laboratory conditions to provide critical data in biosafety. The volunteers were also asked to declare when they thought they made an error. By comparing true errors to those declared, we found that volunteers identified a maximum of 52% of their total mistakes, indicating that many mistakes go unnoticed.
Introduction
As the ultimate authority for safety, governments have the responsibility to develop policies regarding when the benefits of research on pathogens outweighs their risks and to define under what conditions such research should occur. In the past decade, the U.S. government notably grappled with exactly this question, and contemplated if the risks of working with modified influenza and coronaviruses were justified by the benefits of the research, resulting in the Pathogens with Pandemic Potential Care and Oversight (P3CO) framework. 1 Similarly, the World Health Organization established guidelines for laboratories handling poliovirus to prevent any laboratory incidents that could jeopardize global efforts to eradicate the virus, given the intent of facilities in >20 countries to continue to work with the virus. 2
These policies were developed through risk assessments that utilized data on pathogen stability and infectivity; however, certain key data were lacking, which could have improved the final guidance. 3 Data on the frequency with which incidents occur and the consequences of those incidents,4,5 such as the amount and form 6 of escaped material, are limited. Specifically, evidence on the frequency and consequences of incidents in the life sciences laboratories is lacking. Although specific instances of incidents in laboratories are reported, there is not enough information to truly assess risk of incidents because no quantitative data are available on how many opportunities exist for incidents to occur and how frequently near misses happen. Data do not exist on how often laboratory workers spill or drop culture vessels, drip liquid when pipetting or make poor decisions that cause laboratory equipment to malfunction (such as failing to counterbalance a centrifuge or to use an airtight lid). The factors that influence these incident rates (recency of training, degree of experience, time of day, and workload) are unknown.
As a result, assessing the risk associated with incidents in the laboratory is impossible even though this assessment is a key component in understanding the trade-offs inherent in work with the world’s most dangerous pathogens. Moreover, smart investments in laboratory research that would significantly reduce the possibility of an error or reduce the severity of its outcome without significantly compromising laboratory productivity cannot be made with confidence. For example, if worker carelessness or misunderstanding of protocols drives critical incidents in the laboratory, then worker training may be the most critical means to mitigate risks. In contrast, if motor mistakes drive critical incidents in the laboratory, then investments in engineering controls and personal protective equipment would be paramount to mitigating the risks that will inevitably arise from even the most careful and thoughtful researchers.
Because these data are currently lacking, resources are spent in biosafety without much evidence for their effectiveness, and possibly too much or too little time and treasure are spent mitigating risks. Applied biosafety research will help make the overall research enterprise more efficient by ensuring that resources are spent only on measures that meaningfully mitigate risks. 7
This article describes two studies designed to provide critical evidence that informs long-standing questions in the management of biological risks. In this study, we describe the conduct of the first large-scale investigation into human reliability in the life sciences laboratory; that is, how often laboratorians make mistakes that could start a chain of events that could, in turn, lead to a laboratory-acquired infection or a loss of containment incident (through a series of other failures).
Materials and Methods
Clinical Laboratory Studies
We conducted one set of blinded experiments in clinical laboratories in three countries (the Pasteur Institute of Tunis, Tunisia; the Gedallab Laboratório de Análises Clínicas in Brazil; and the Royal Scientific Society of Jordan). In these experiments, dummy samples that contained a fluorescent tracer (GloGerm) but resembled real clinical samples were prepared by our collaborators within the facilities. The samples were then tested for the presence of various pathogens (e.g., SARS-CoV-2, Neisseria gonorrhea) by workers in the laboratory using their normal workstation and supplies. At the end of a shift, the collaborator used a black light to determine if any of the material contaminated surfaces in the laboratory. In these clinical experiments, >1,500 dummy samples were tested, for a total of 23,053 individual pipetting steps of the tracer-laced sample.
The experiments in the clinical laboratories were deception studies, and thus, workers were not informed that an experiment was taking place. For each laboratory, calibration experiments were done to determine a dilution of GloGerm that would be imperceptibly different from the clinical samples normally processed. These samples (typically diluted to 1:20) were calibrated to be visible under UV light without turning off the room lights. Multiple 10 μL, 1 μL, and 0.1 μL aliquots of 1:20 diluted GloGerm were spotted onto various surfaces and scrutinized with a UV light, making note of which size spot could be detected. The locations tested included, but were not limited to, the bench pad, pipettor, 96-well plate surface, biosafety cabinet (BSC) surface, chair, gloves, laboratory coat, and floor. The area was decontaminated as usual and scanned again to ensure that no residual GloGerm remained. Before starting this research, the laboratory workers completed a survey to assess their level of education and experience, although their participation in this work was not disclosed.
The rate of samples processed was determined based on the workflow in each laboratory and the following formula:
Samples were processed as if they were normal clinical samples during each worker’s shift. The area was then scanned with a black light after each worker’s shift and any errors were recorded. After that the area was decontaminated and reset for the next shift as usual.
Volunteer Studies
In a parallel set of experiments, volunteers working in a simulated laboratory environment at the Colorado State University and the University of Maryland pipetted GloGerm-containing fluid from a reagent reservoir into five 96-well plates using a single-channel pipette. A black light was used to detect spots of contamination between the fillings of each plate. In this experiment, the volunteers knew they were working with nonhazardous materials and that they were being observed to determine an error rate. Volunteers were asked to declare when they made an error so that their ability to notice when they make a mistake could be evaluated. Across these experiments, 74,000 pipetting operations occurred using 79 volunteers. In the volunteer studies, the GloGerm solution was calibrated to each laboratory as outlined above. Equipment for each location was calibrated on-site before use in the study. The area was decontaminated as usual and scanned again to ensure that no residual GloGerm remained.
For each experiment, the volunteers, with at least some familiarity with basic laboratory practices, filled out a survey before participation in the study to obtain metadata useful for analysis: level of education, experience, time spent in the laboratory, self-perceived competency, etc. They were then given a copy of the SOP to review before sitting down at the BSC to conduct the experiment. The BSC would already be set up with a black bench pad, the micropipette, pipette tips, 5 × 96-well plates, 24 × 1 mL solution of GloGerm in a reagent reservoir, and a waste bin. The volunteer arranged the items in the BSC to their preference and filled the 96-well plates with 50 μL per well, calling out any perceived errors to an observer. The observer scanned the entire work area with a black light after each plate was filled and recorded all detectable spots. The observer also scanned the volunteers’ gloves, hands, and laboratory coat for contamination and recorded those observations at the end of each session.
Statistical Analysis
For both sets of experiments, singular visible (under UV light) spots of GloGerm of any size were assumed to be caused by experimenter error. For example, if five spots were observed, they could have all been caused by one error, or they could have been each individually caused by five separate errors, or any combination in between. Therefore, the error rate cannot be estimated directly from the number of observed spots without modeling assumptions.
Our approach was to estimate conceptual lower and upper bounds to the error rate, along with an estimate from a more plausible mathematical model. The advantage of this approach is that the lower and upper bounds rest on unrealistic assumptions of error, so the true error rate is likely in between them. We estimated the lower bound by assuming that a single error caused all of the spots in a shift (clinical study) or plate (volunteer study). Similarly, the upper bound assumes that each error generated exactly one spot. We were only able to estimate the upper bound for the volunteer study, since the clinical laboratory data only revealed where in the laboratory spots were found, not how many. We refer to the lower bound as the “binary error rate” and the upper bound as “the average spots rate.”
Our preferred model of error rates is the Polya-Aeppli (PA) distribution, 8 which assumes that the number of spots per mistake follows a geometric distribution. The advantage of the PA model is that the number of errors is a latent variable, and the rate of errors can be easily estimated using only the number of observed spots. There are several choices of how to estimate the error rate, and for more details, refer to the Supplementary Data S1. The results below use the method of moments for estimation. For an experimenter, assume we had five sessions worth of data, with 2, 0, 8, 6, and 3 spots per session. Using the method of moments estimator, we would estimate the error rate as 2.06 errors per session. The binary and average spot error rates would have been 0.8 and 3.8, respectively. As with the average spot rate, we can only calculate this error rate for the volunteer data. We also refer to this number as the Poisson error rate, since the number of errors is assumed to follow a Poisson distribution.
Finally, all error rates were standardized to the number of manipulations used during the work. For the volunteer studies, each pipetting motion counted as one manipulation. For the clinical laboratories, we calculated the total number of manipulations based on the tests performed, and the number of manipulations (movements of sample) per test. We reported error rates as “X errors per 1,000 manipulations.”
Ethical Considerations
All experiments were examined by IRBs at both the participating institutions and Gryphon Scientific as it involved a combination of ethical issues at the intersection of quality improvement research 9 and research in developing countries. 10 We considered the ethical implications of conducting biosafety research in this setting, including the following: (1) study procedures if safety issues were identified that could be attributed to individual clinical staff; (2) ensuring that the research did not compromise the primary function of clinical laboratories, particularly in the context of the COVID-19 pandemic; and (3) sharing the results of research with partner institutions for their own quality improvement. We communicated these concerns to partner institutions, and developed processes to guide personnel reliability concerns, to ensure that study volume did not strain the laboratory capacity, and to provide poststudy communication and resources to partners. The results have been used to improve practices in these laboratories and no participant’s job was adversely affected by the results.
Results
Across the clinical sites, the rate of error ranged from 1 to 26 per 1,000 pipetting steps, depending on which laboratory was being studied (Figure 1). These error rates are conservative, since they were calculated using the “binary error rate” method described above.
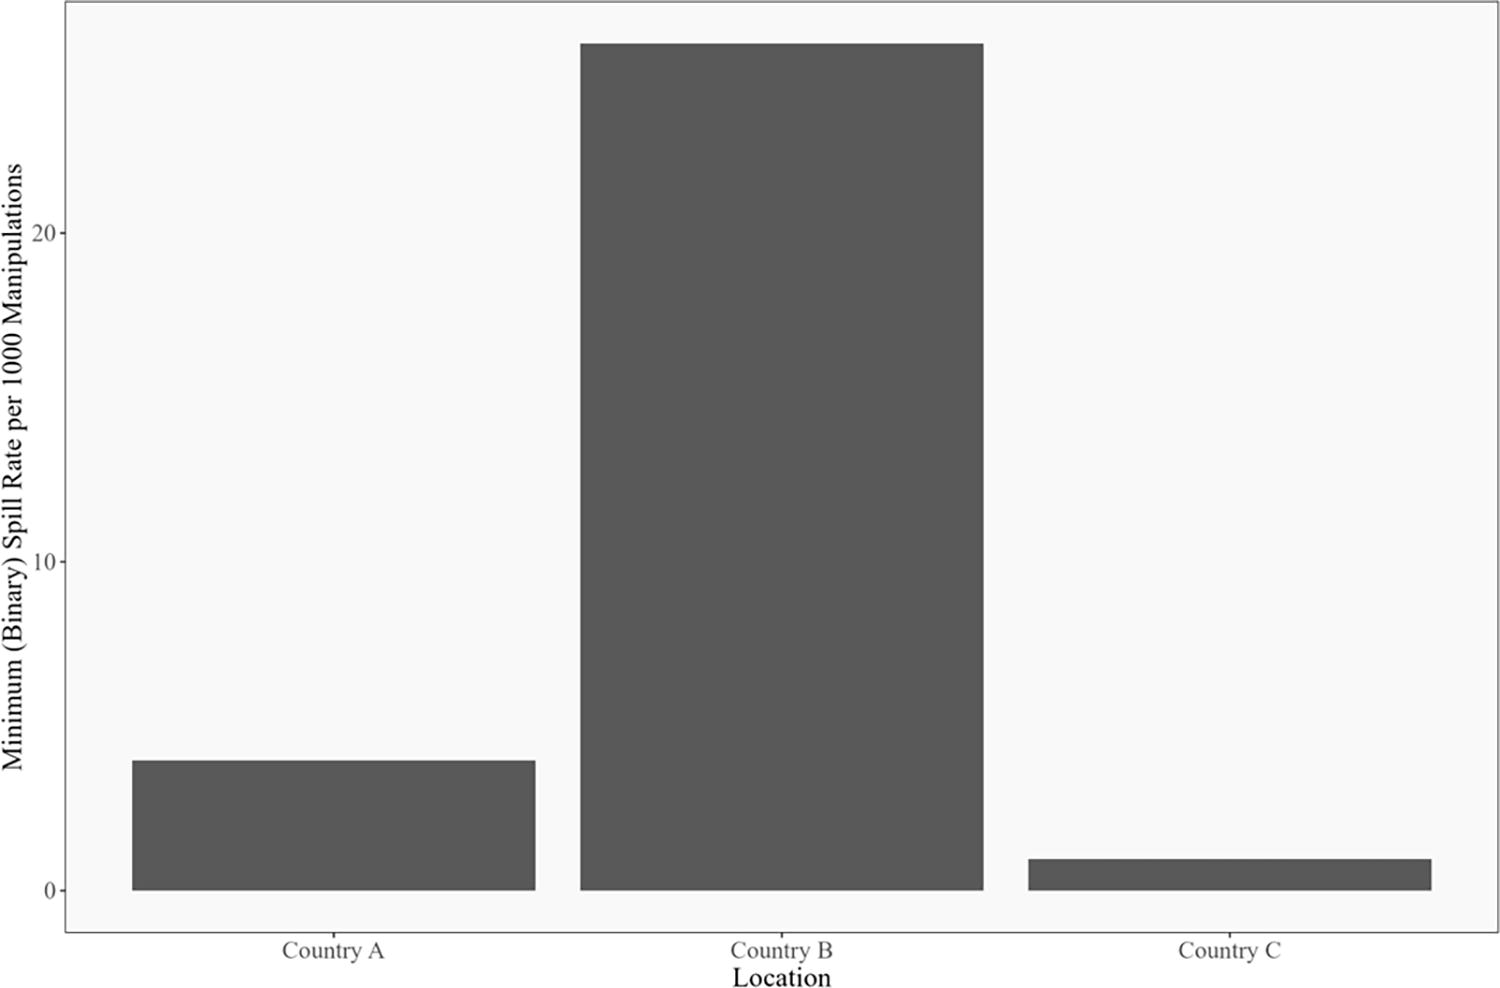
Binary human error rate by location for clinical laboratories. The binary error rate is calculated as the ratio of the number of days with at least one GloGerm spot divided by the total number of manipulations across all days, in thousands. For example, if there were 3 days with at least one GloGerm spot, and 2,000 total manipulations, the binary error rate would be 3/(2,000/1,000) = 1.5. The error rates were calculated for each laboratory separately. For each laboratory, all of the data were pooled for the calculation. In other words, we did not calculate separate error rates by technician or day of the week for this figure. For more discussion, see the Supplementary Data S1.
In the volunteer studies, the precise number of errors was difficult to determine because many samples were manipulated between each investigation with the black light. The presence of multiple spots of contamination indicated that there was not complete independence of the spots observed per plate, suggesting that a single incident can create multiple spots. For example, a bubble bursting on the end of the pipette tip could cause multiple spots of contamination from a single event. Given the overrepresentation of plates with multiple spots of GloGerm and the underrepresentation of plates with just a single spot of contamination, we used a Poisson model to estimate the likely number of errors that created the spots, as described above.
We therefore present the error rate in three different ways, as shown in Figure 2. In the leftmost panel, we assume that all the spots on each plate were caused by a single error; we refer to this calculation as the binary error rate, which is most comparable with the observed error rate in the clinical laboratories mentioned earlier. In the rightmost panel, we assume that every error caused only one spot of contamination—these numbers are equivalent to the average number of spots per 1,000 manipulations. Finally, the Poisson model error rate estimates are shown in the center. The Poisson model estimates are always between the binary error rate and the average number of spots but are closer to the binary error rate.
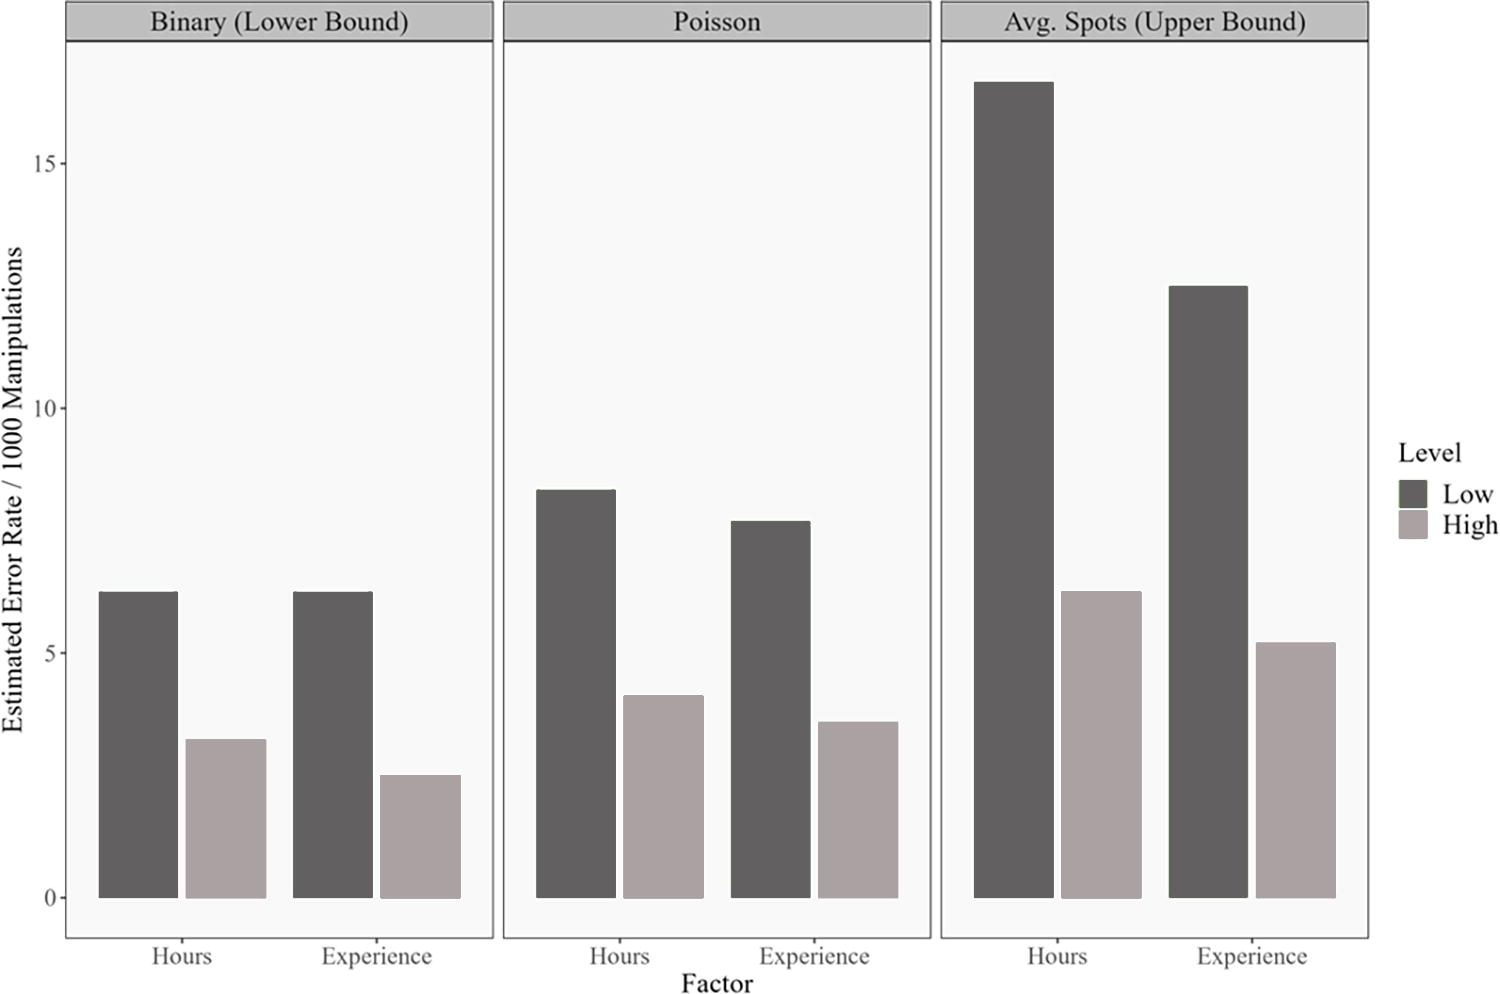
Median estimated error rates for volunteers at the two U.S. universities. In total, 53 of 79 participants had low current time in the laboratory (<8 h per week) and 65 of 79 participants had a lower level of experience (<4 years). The leftmost panel assumes that all spots on a plate were caused by one error (binary error rate); the rightmost panel assumes that every error caused only one spot of contamination; and the center panel shows the estimate produced by the Poisson model.
We further hypothesized that the amount of experience in the laboratory (in terms of years of experience or hours spent per week in the laboratory) may influence the error rate, and so present our data divided by the experience of the volunteer (with less experienced volunteers shown in a darker color). Low experience is defined as fewer than eight hours in the laboratory per week or fewer than four years of laboratory experience. The median Poisson error rate for the volunteers with fewer hours in the laboratory is 8.33 per 1,000 manipulations versus 4.12 for volunteers with more laboratory hours. The median Poisson error rates for the low- and high-experience groups are 7.69 and 3.59 per 1,000 manipulations, respectively. Critically, this error rate derived from volunteers falls within the range of the error rate observed in the blinded experiments in the clinical sites.
To evaluate the ability of workers to detect their own errors, volunteers were asked to call out their errors to an observer during the study. These reported errors were then compared with actual locations of GloGerm spots. We found a poor correlation between the errors that volunteers thought they made and if/where contamination actually occurred (Table 1). Table 1 represents the ratio of detected errors over total errors. Total error is the sum of false negatives and true positives. Conceptually, a true positive represents the case when a volunteer makes a mistake and accurately marks that mistake. A false negative is when a volunteer makes an error but does not call it out or does not accurately note the location of the error. Two definitions of true positive were included: location agnostic, which is more lenient regarding participant accuracy in describing an error, and location specific, which is stricter. In the first row of Table 1, location agnostic, a true positive is when the volunteer called out an error and GloGerm was detected anywhere in the workspace. For the second row, location specific, a true positive is when the volunteer called out an error and at least one spot of GloGerm was detected in the general location of the specified error. One conclusion from Table 1 is that many errors are missed. The estimated detection sensitivity is never greater than 52%. Notably, those with more experience or time in the laboratory seem to notice a smaller percentage of the errors that they make (although they are making fewer mistakes). Perhaps more experienced workers rely more upon routine or muscle memory and are engaged less in the routine task that was studied here. For details about how detection sensitivity was calculated, see the Supplementary Data S1.
Detection sensitivity in the volunteer study
The low/high hours and experience groups are the same as in Figure 2.
Discussion
These data presented here have several critical implications for biorisk management and laboratory operations. First, our results demonstrate that the rate of human error is greater than that previously demonstrated in other industries, which was used as a proxy in previous risk assessments because data from the life sciences were not available. The rate of spills found in our experiments overlaps and exceeds, by nearly an order of magnitude, the error rate used to drive conclusions in the Site Specific Risk Assessment of the National Bio- and Agro-defense Facility, 11 and the Gain of Function Risk Benefit Assessment. 12 Specifically, the Gain of Function Risk Benefit Assessment used a range of error rates for physical mistakes that had a minimum of 5 per 100,000 manipulations and a maximum of 5 per 1,000 (log uniformly distributed). These studies used proxy data on human reliability from non-life science activities to determine which experiments may generate the most risk and which mitigations may most reduce risk.13,14 In general, the fact that the rate of human error is greater than previously predicted does not affect the relative risk of various experimental types (i.e., increasing transmissibility of coronaviruses would still be considered a high-risk activity as stated in the Gain of Function report). However, this finding indicates that events precipitated by workers (spills and splashes) are even more important incident pathways than natural disasters and mechanical failures explored in the previous studies, which suggest that the relative value of various in-laboratory mitigations may need to be revisited.
Second, these studies demonstrate that spills and splashes caused by workers are a very common occurrence, stressing the importance of primary and secondary containment measures. Moreover, our study likely underestimates the frequency of very small spills because we are unable to detect splashes of <0.1 μL, and such small spills could still contain many infectious units of pathogens. When working with numerous samples, such accidents can be expected to occur more than once per week. Therefore, the implementation of engineering controls, BSCs, personal protective equipment, well-rehearsed doffing protocols, excellent microbiological techniques, good laboratory decontamination practices, and continuous biosafety training is imperative. These measures aim to prevent commonplace incidents from becoming laboratory-acquired infections or loss of containment events. Similarly, the fact that these errors are commonplace, yet laboratory-acquired infections and loss of containment events are rare provides even more evidence about the power of secondary measures to effectively mitigate risk. For example, the vast majority of contamination events were found inside the BSC or on personal protective equipment (not shown). Data on errors committed inform more than just safety; this work emphasizes the importance of improving repeatability and quality assurance in life science laboratories.
Third, workers demonstrated a poor ability to track when and where they made a mistake, which demonstrates that response protocols enacted only when a spill or splash is known will address only some incidents. Moreover, these experiments provide data supporting the guidance and commonplace practice that decontamination measures should be taken regularly (adapted to the workload in the area), not just when a spill is noticed. Similarly, decontamination should occur over the general area in which work was conducted, not just where an error was thought to occur.
Fourth, these data demonstrate that volunteers working in simulated laboratory environments (and know they are being watched) suffer much the same rate of errors as workers in their real work environment who think they are working with samples derived from sick patients. Our study validates the use of nonblinded, volunteer-based studies as good proxies for human error inside real laboratories, which enables further experiments to understand how characteristics that cannot easily be manipulated in a working laboratory (e.g., of the worker, their training, or the laboratory environment) affect error rate. In addition, our work demonstrates that critical biosafety research need not be conducted with pathogens inside containment, reducing the cost (and risks) of critical research.
This work fills critical gaps needed to support biorisk management in laboratories and to inform smart policies related to the conduct of pathogen research. However, the data gaps are vast and much more research must be conducted to ensure that decisions related to pathogen research are informed by evidence. This study illustrates a flexible experimental set-up that can be easily extended to explore the factors that influence human reliability in the laboratory. Specifically, follow-on experiments could be conducted to determine how the level of experience, the workload, the type of training received, and the recency of training influence the error rate. In this way, training could be tuned to the exact level needed to maximize safety but not overly burden researchers. Experiments that determine how workload, psychological state, time of day, time pressure, height of bench, and ambient noise/music affect error rate could be used to craft laboratory workflows and environments to be more inherently safe. Combined with research in the physical and social sciences, future research could define the exact conditions under which critical pathogen research can be conducted as safely as possible when supported by the appropriate practices, training, and equipment.
Footnotes
Authors’ Contributions
Conceptualization: R.C. Methodology: A.E.J.F., E.L., R.R., R.C., N.G.E., and K.N.K. Investigation: J.M.R., S.C., J.H., L.Y., A.G.D.B., A.C., S.S.B., N.A., S.M., A.B.G.V., and R.M. Data curation: H.L.W., K.N.K., K.N., N.G., and N.D.S. Formal analysis: H.L.W. Visualization: H.L.W. Supervision: K.N.K. and R.C. Writing—original draft: R.C. Writing—review and editing: K.N.K., H.L.W., N.A., A.B.G.V., J.M.R., N.G.E., and S.S.B.
Authors’ Disclosure Statement
A.B.G.V. holds a Research Fellowship from Conselho Nacional de Desenvolvimento Científico e Tecnológico (CNPq, Brazil, Grant process 304476/2022-6).
Funding Information
The authors thank the Open Philanthropy Project for funding this research with a grant (no grant number assigned).
References
Supplementary Material
Please find the following supplemental material available below.
For Open Access articles published under a Creative Commons License, all supplemental material carries the same license as the article it is associated with.
For non-Open Access articles published, all supplemental material carries a non-exclusive license, and permission requests for re-use of supplemental material or any part of supplemental material shall be sent directly to the copyright owner as specified in the copyright notice associated with the article.