
Abstract
Introduction:
Ionized hydrogen peroxide (iHP) is a new technology used for the decontamination of surfaces or laboratory areas. It utilizes a low concentration of hydrogen peroxide (H2O2) mixed with air and ionized through a cold plasma arc. This technology generates reactive oxygen species as a means of decontamination.
Objectives:
The purpose of this study is to review the effects of iHP on the structure of the spores of Bacillus atrophaeus by observing its effects using transmission electron microscopy (TEM) and also by evaluating the existence of DNA damage by fluorescence-based quantitative polymerase chain reaction (qPCR).
Methods:
Spore samples of B. atrophaeus decontaminated using iHP at different exposure times (Control, 1, 2, 6, and 12 h) were fixed for TEM. In addition, DNA was extracted for evaluation of DNA damages using fluorescence-based qPCR assays.
Results:
Damages to the spore structures of B. atrophaeus caused by the decontamination process with iHP at different exposure times (Control, 1, 2, 6, and 12 h) can be observed in micrographs. The effects of the decontamination to short DNA segment (132 base pairs [bp]) of the yaaH gene using qPCR present a linear degradation, and for the long DNA segment (680 bp), it presents a biphasic mode.
Conclusion:
The results of the qPCR analysis show two initial stages of damage to DNA with very noticeable damage at 12 h contact time, which confirms the observations of the TEM micrographs for the B. atrophaeus spores. The study demonstrates damage to the spore core DNA.
Introduction
Validated decontamination methods are a critical component for the operations of clinical space as well as biocontainment laboratories. In the research biocontainment setting, chemical decontamination, radiation, or thermal sterilization is often used. Chemical decontamination is typically used to inactivate biologic agents from impervious material and equipment and must be employed for routine maintenance and service as well as removal from the containment laboratory. Sodium hypochlorite, 70% ethanol, quaternary ammonium, and liquid or gas formaldehyde are common forms of chemical decontamination. Recently, ionized hydrogen peroxide (iHP) has been employed more as a form of chemical decontamination.
The iHP system utilized in this study sprays a 7.8% hydrogen peroxide (H2O2) solution mixed with air and ionized through a cold plasma arc. This ionization process generates reactive oxygen species (ROS) that could include ozone (O3), atomic oxygen, superoxide, peroxide, and hydroxyl radicals.1,2 The mechanisms of spore inactivation that affect germination and growth are not well understood.
Studies investigating the effects of ROS using an atmospheric pressure plasma jet on spores of Cordyceps pruinosa found that the morphology of the spore changed dramatically after treatment. The flattening of the spores suggests that the intracellular space was emptied of its contents and that the cell wall deformation could affect spore viability. 3
Ideally, methods of inactivation should have verifiable and quantifiable means to determine whether decontamination has been achieved. The purpose of this study was to determine the effects of iHP on the structure of the dry heat-resistant spores of Bacillus atrophaeus by visual analysis using transmission electron microscopy (TEM) and concurrently evaluate the extent of DNA damage by fluorescence-based quantitative polymerase chain reaction (qPCR).
Materials and Methods
No human or animal samples or subjects were used in this study. Therefore this study was exempt from IRB and IACUC approval.
Sample Preparations for Decontamination
Spores of B. atrophaeus (ATCC 9372; Mesa Labs, Lakewood, CA) were grown at 37°C in Tryptic Soy Broth medium for 14 days in a shaker incubator at 100 revs/min. After the incubation period, samples were centrifuged at 1125 g for 20 min at 4°C. The supernatant was discarded, and the pellet was resuspended in electropure water (>14 MΩ-cm). This process was repeated four times.
Spore quantification was done by serial dilution and inoculation on blood agar plates. The spore counts varied between 1.28 × 10⁹ and 1.65 × 10⁹ per mL.
Decontamination samples of the produced spores were created by placing 400 μL of spore sample suspensions in six-well plates and allowed to dry overnight inside a biological safety cabinet. After drying, the spore samples were stored in a 4°C refrigerator until used for decontamination.
Decontamination Procedure
A fumigation room with a volume of 880 ft 3 (24.9 m3) [8 ft (2.44 m) × 11 ft (3.35 m)× 10 ft (3.05 m)] was used for the decontamination trials. This gas-tight room has air pressure resistant doors and bioseal dampers to isolate the room during decontamination procedures. Decontamination samples of B. atrophaeus were placed inside animal cages [2.75 ft (0.84 m) × 2.75 ft (0.84 m) × 7 ft (2.14 m)] facing away from the iHP spray nozzle. Room environmental conditions during decontamination were measured using a temperature and humidity sensor (Velocicalc, Model 9555P, Probe Model 966; TSI Incorporated, Shoreview, MN). H2O2 and O3 levels were measured using a portable gas detector (PortaSens II, Model C16; Analytical Technology, Inc., Collegeville, PA) with smart sensor modules for O3 (1–5 ppm, Part No. H10-00-1008) and H2O2 (10–100 ppm, Part No. H10-00-1042).
Generation of iHP was done with the use of the SteraMist Environmental System equipment (TOMI Environmental Solutions, Beverly Hills, CA) at a rate of 25 mL/min and 20 psi of air pressure through the plasma arc. The total room volume was adjusted to 900 ft 3 for ease of dose calculations, and the disinfection solution used was SteraMist Solution (TOMI Environmental Solutions), with 7.8% H2O2 at the dose of 0.5 mL per ft 3 . Air sampling monitors for measuring concentrations of O3 and H2O2 were located inside the room, and the bioseal dampers and the door with a pneumatic gasket were closed before the start of fumigation to provide a gas-tight room. The total spray time per decontamination trial was 18 min, and the contact periods that started at the end of the spray times were for 1, 2, 6, and 12 h. The samples were collected and resuspended for processing after a 30-min ventilation period of the room. In total, three different decontaminations were done for each contact time.
Validation of decontamination procedures was done by using biological indicators of B. atrophaeus (ATCC 9372; Mesa Labs) on stainless steel disks and Tyvek® Envelope (Population 2.2 × 10⁶, D-Value of 0.7 min).
Verification for inactivation of the biological indicators by the decontamination process was done by inoculation of the B. atrophaeus biological indicators in soybean casein digest medium (Red Releasat®, RM/100; Mesa Labs) and incubated for 7 days at 37°C.
Preparation of TEM Samples
The exposed decontamination samples utilized for TEM were resuspended with 400 μL of a solution of 2% glutaraldehyde with 2% paraformaldehyde and stored in a 4°C refrigerator. Depending on the pellet form and size, agar was added to consolidate the pellet for staining and polymerization. The fixation procedure used was modified from that of Berryman and Rodewald. 4 At the end of the staining and infiltration period, the samples were placed in a polymerization tube and set for hardening in a 60°C oven overnight. After hardening, the hard epoxy resin containing the spore samples was cut into ultrathin sections using a diamond knife and placed onto an objective disk and prepared for imaging. TEM images were obtained using a JEOL JEM-1400 microscope (JEOL, Ltd., Tokyo, Japan).
Preparation of DNA Samples
The exposed and nonexposed decontamination samples utilized for DNA extraction were resuspended with 400 μL of Dulbecco's phosphate buffer saline solution and stored in a −20°C freezer for further processing.
Since one of the goals of the study was to evaluate the potential DNA damage caused by the decontamination activity, no mechanical action could be done to the spore samples due to the potential of physically damaging the DNA. Multiple DNA extraction techniques were evaluated. 5 We decided to extract DNA utilizing a protocol with phenol/chloroform/isoamyl alcohol extraction followed by ethanol precipitation. The extraction procedure was modified from Ausubel et al. 6 and Sargent. 7 The extracted DNA samples were stored in a −20°C freezer.
qPCR Assays
To quantify potential damage to the spore core DNA caused by iHP decontamination, the gene yaaH that produces the spore germination protein YaaH was used as a template for the qPCR assays. qPCR was chosen over gel electrophoresis because this assay can indicate how much of a specific DNA or gene is present in the sample in real time.8,9 In addition, real-time qPCR has been used to identify Geobacillus stearothermophilus in samples of canned food 10 and as a reliable detection method for Bacillus anthracis spores. 11
The gene yaaH for B. atrophaeus (ATCC 9372) has 1281 base pairs (bp). Preliminary primer selection was considered using NCBI's Primer-BLAST tool. 12 Final selections for optimization and validations were made using DNASTAR Lasergene Software (DNASTAR, Inc., Madison, WI) as previously described by Thornton and Basu 8 and Bustin and Huggett. 13
The criterion for primer set selection was that its elongation product could produce both short and long segments of the yaaH gene to be able to evaluate quantitative damages to the segments.14,15 Also, the short and long primer sets needed to fall within the elongation product of the primers were used to generate the plasmids for developing the standard curve for quantification. Since there was no history of using the yaaH gene for quantification of damage and the primer selection needed to be optimized for use, short and long primers were selected in an attempt to match proximity to the 5′ end as well as the 3′ end of the plasmids to be generated. The list of primer sets identified for this study for the yaaH gene of B. atrophaeus to be evaluated and optimized for this study is given in Table 1.
All primers were purchased from Integrated DNA Technologies (Coralville, IA). For naming purposes, all primer pairs to be analyzed were named using the 5′ end position of the corresponding spore yaaH gene oligonucleotides as previously described by Fajardo-Cavazos et al. 15
The fluorescence quantification of possible DNA damage to the spores of B. atrophaeus was done using SYBR Green (BIORAD, Hercules, CA) and a real-time thermal cycler C1000 Touch (BIORAD).
The optimization and validation of the primers that were used to evaluate the potential damage to the DNA segment encoding the yaaH gene of B. atrophaeus (ATCC 9372) caused by the decontamination with iHP were evaluated following the recommendation of Raymaekers et al. 14
Plasmids for quantification were developed for a segment of the yaaH gene of B. atrophaeus using the nucleotide sequence presented in Table 2. Amplification verification, the limit of detection, and optimization of reaction conditions and annealing temperatures for all short and long primers for the yaaH gene of B. atrophaeus were also determined.
The qPCR was performed using primers given in Table 3 with thermal cycling conditions of a hold temperature of 95°C for 3 min, followed by 45 cycles at 95°C for 5 s an annealing temperature of 60°C for 20 s for the short primers and 40 s for the long primers. The melt curve analysis was done from 65°C to 95°C.
All samples used for the analysis of DNA damage resulted from three different decontamination tests for each contact time. DNA was extracted from at least three samples for each decontamination trial. For fluorescence-based qPCR analysis, all samples tested were run with three technical triplicates. The number of samples analyzed by qPCR is given in Table 4.
The exclusion criteria used from qPCR results were made by looking at the melt curve produced by each sample product. The samples that did not generate an appropriate melt curve were excluded from the qPCR analysis.16,17 Melting curve analysis is rapid and reliable for the quantification of DNA. 18 Because all dyes used to detect DNA on a fluorescence-based system can also identify primer-dimers and other products, a melting point analysis was used in this study. 19 The sensitivity of the detection of the correct product by using melting point analysis can be up to 10-fold more accurate than agarose gel electrophoresis. 20 Furthermore, melting curve analysis can help identify alterations in amplified regions because, when compared with a control sample, it can detect shorter, equivalent, or longer segments such as primer-dimers. 21
All data were analyzed using GraphPad Prism version 8 (GraphPad Software, San Diego, CA), and data are as presented as the median with interquartile range.
Results
Transmission Electron Microscopy
The results of the visual verification of the effects in the morphological structure of the spores of B. atrophaeus caused by the iHP decontamination process at different decontamination times (Control, 1, 2, 6, and 12 h) can be observed in the following micrographs, where different spore structures can be seen. These are the outer spore coat (OC), the inner spore coat (IC), the cortex, the inner membrane (IM), and the core (CO) where the DNA resides. Arrows indicate the location of the morphological damage.
Views of the effects of the decontamination process with iHP at different exposure times and subsequent damage to the spore structures caused by the decontamination were observed by TEM (Figs. 1–3). Spore structures of nonexposed control samples (panel A) contrast the initial damages to the OC after 1-h decontamination (panel B). Damage can be observed to the OC and the IC after 2-h decontamination (panel C). Panel D shows the result of the 6-h decontamination cycle where damages to both spore coats and some initial effects in the IM are observed. The effects of the 12-h decontamination can be seen in panel E, where damage can be seen to IM accompanied by the release of CO material. Figure 1 presents a view of a whole spore. Figure 2 presents a higher magnification of the outer layers of the spores, and Figure 3 presents a higher magnification of the IMs and the CO.
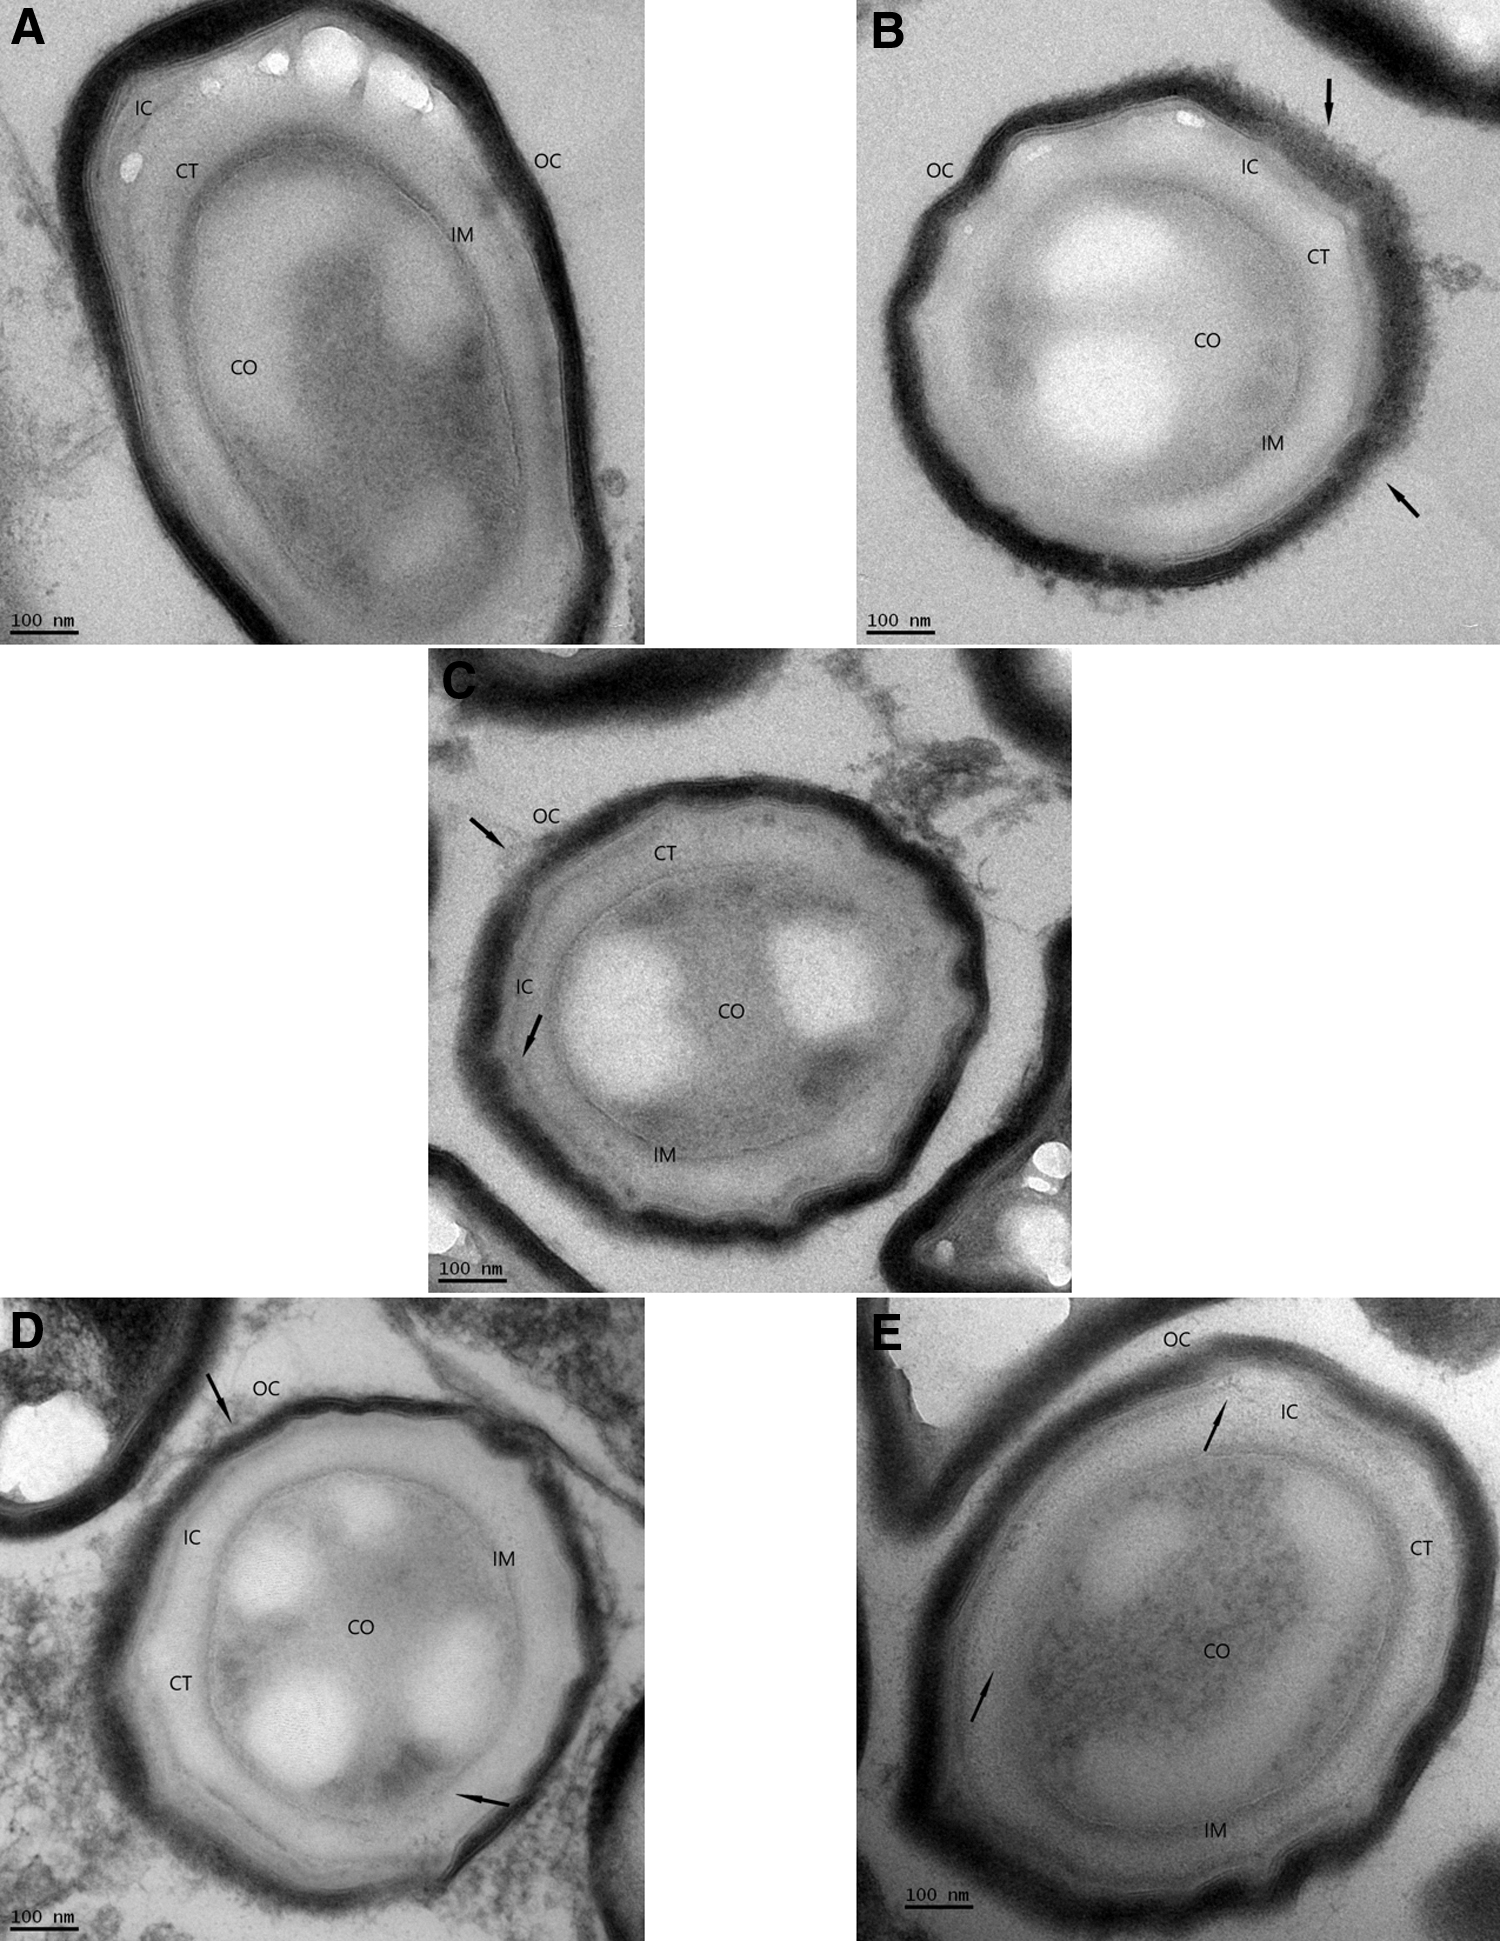
Progression of decontamination effects of iHP in the spores of Bacillus atrophaeus.
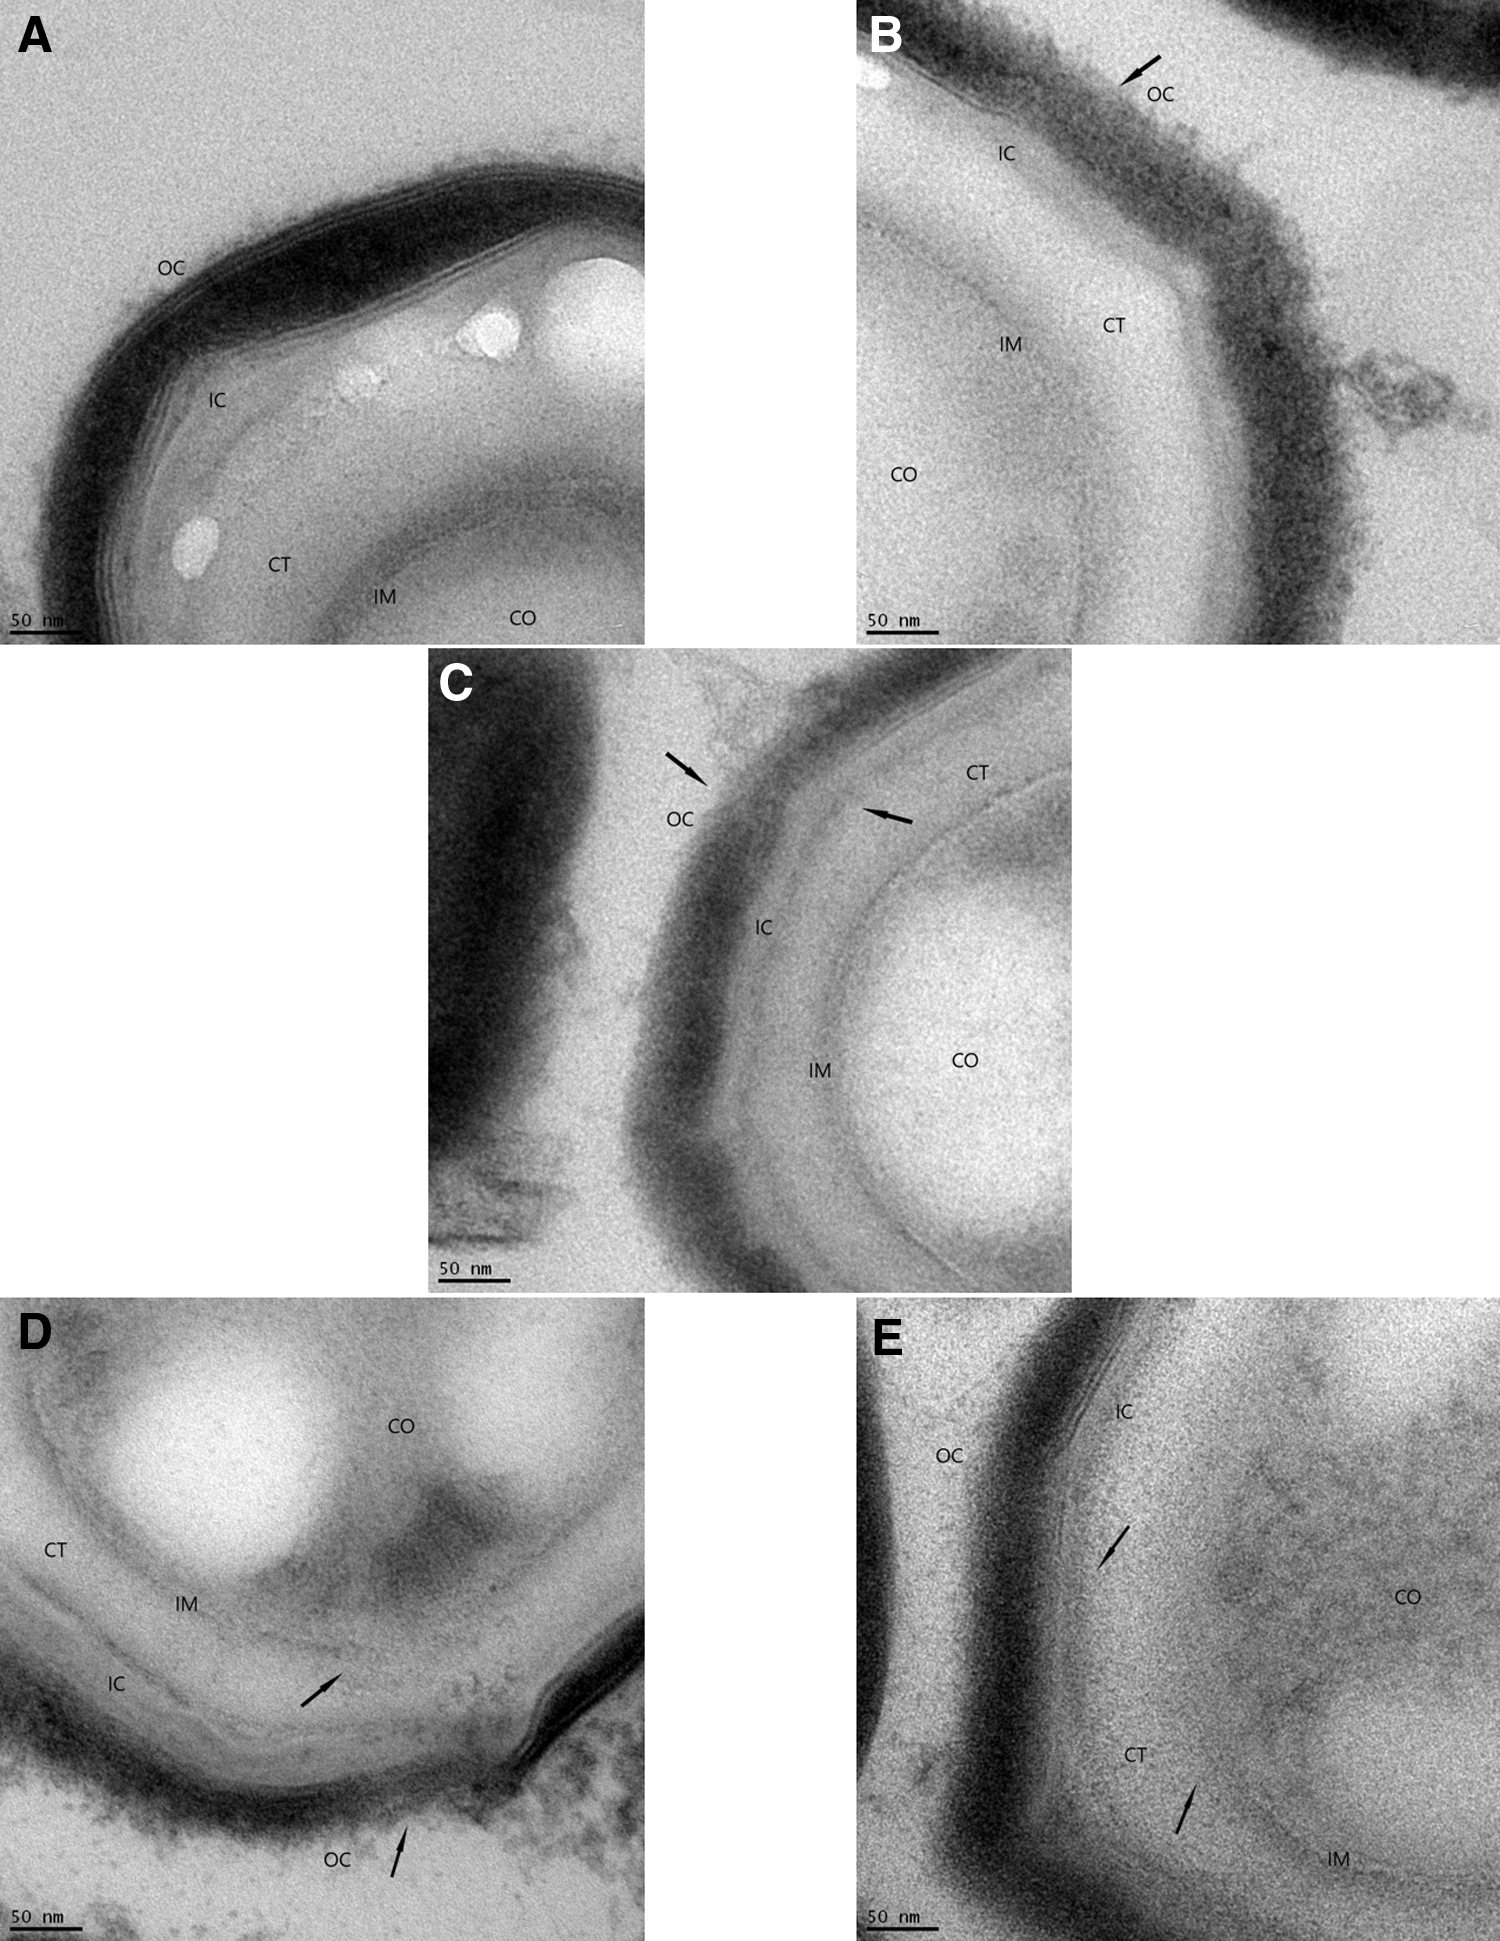
Progression of decontamination effects of iHP in the spore coat of Bacillus atrophaeus spores.
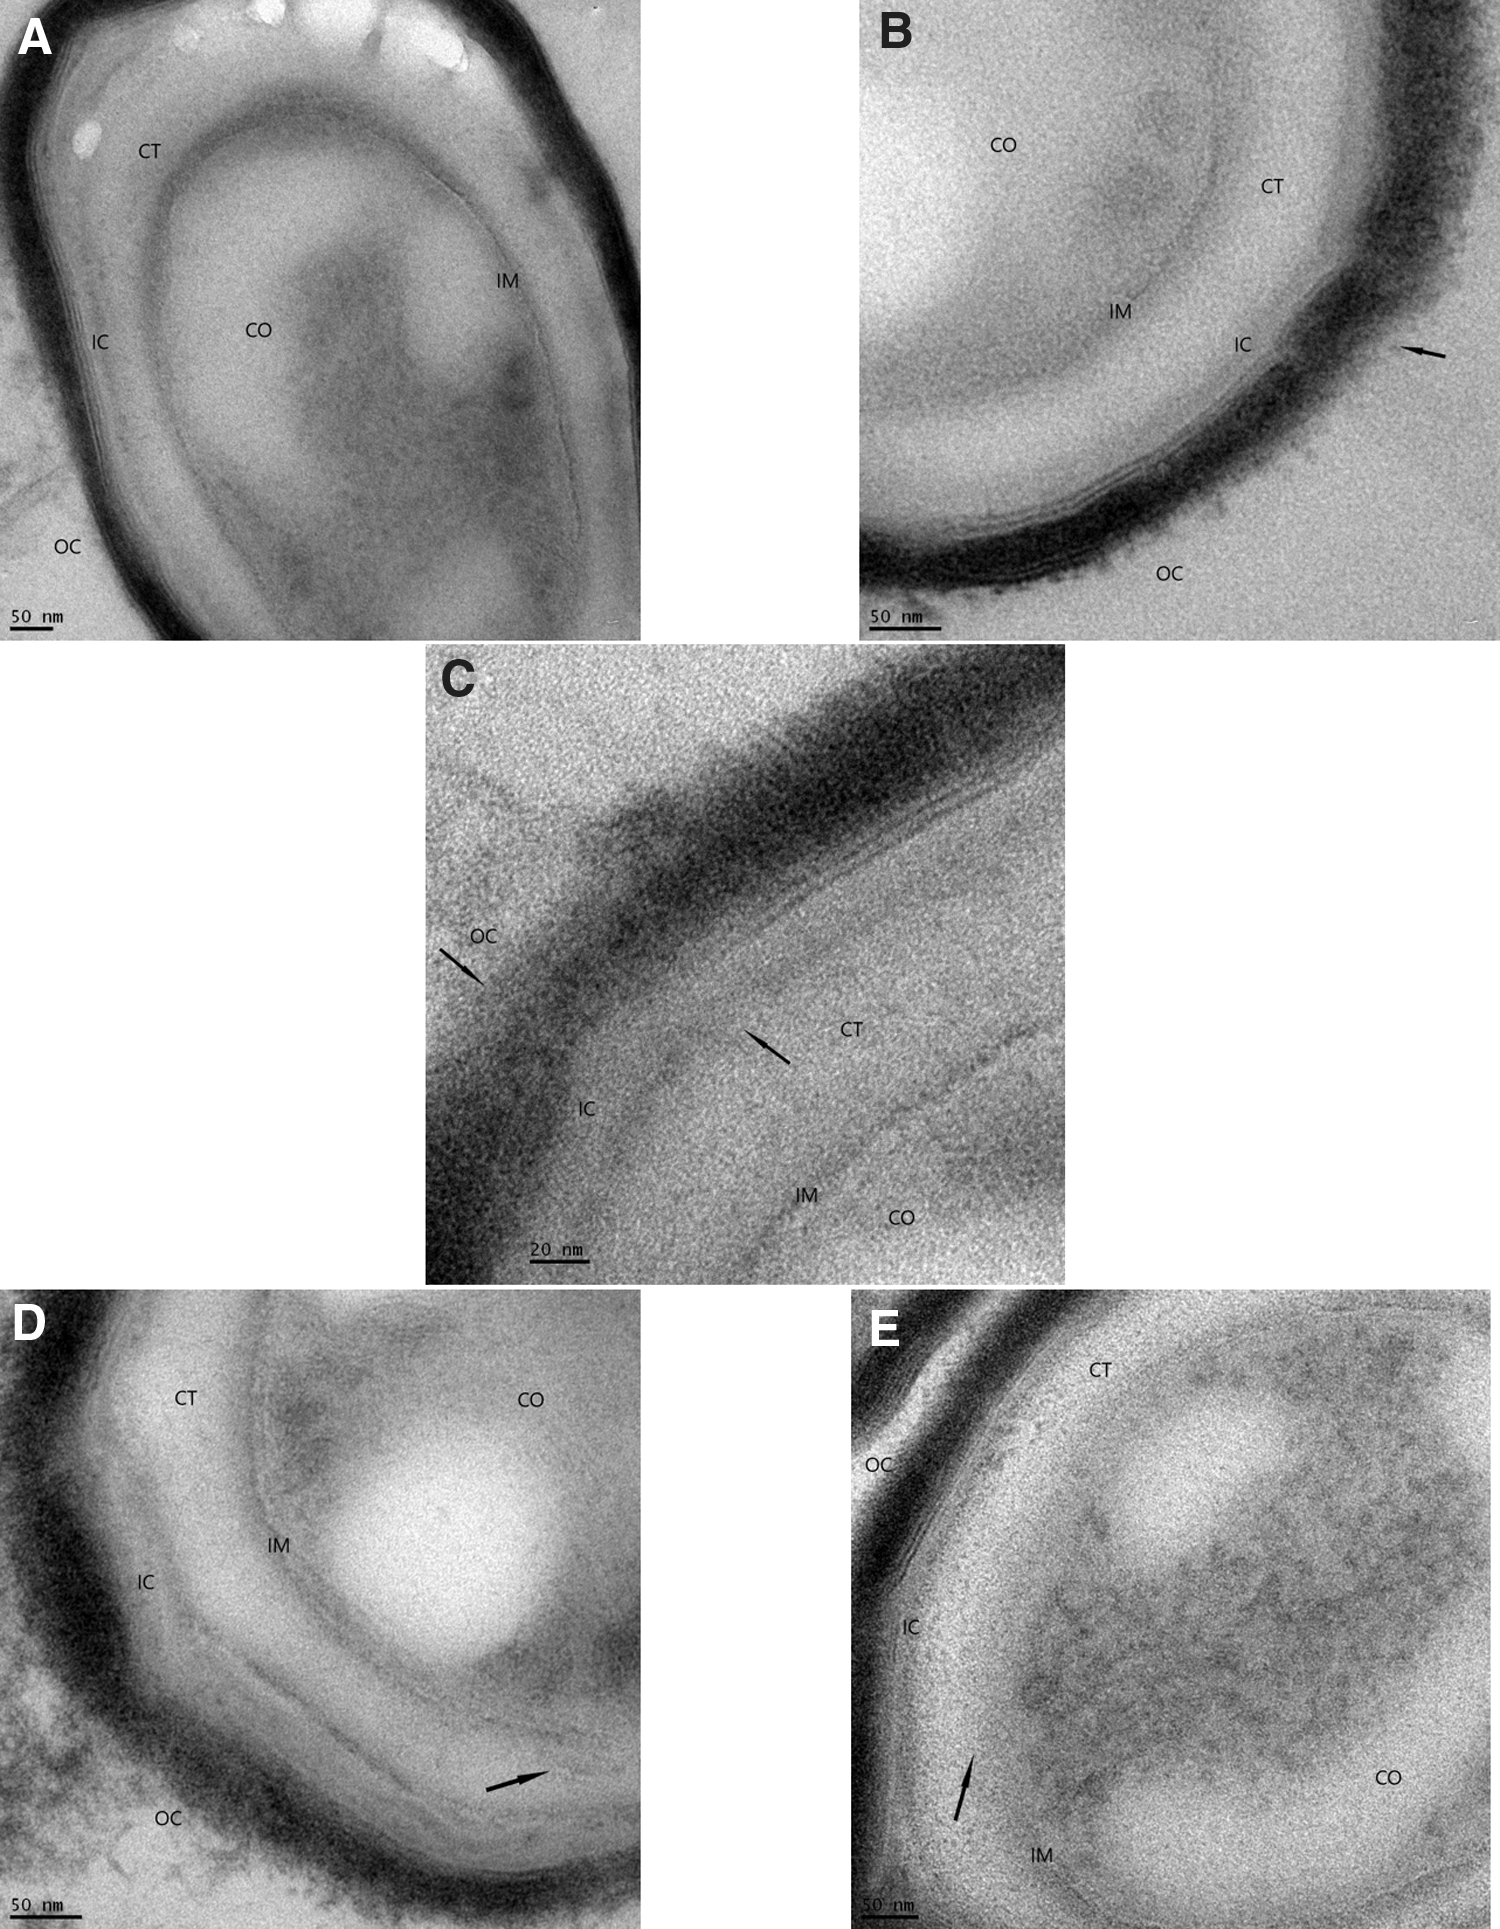
Progression of decontamination effects of iHP in the spore coat and inner membranes of Bacillus atrophaeus spores.
qPCR Assays
The compiled quantitative result of the damage caused to the DNA of the B. atrophaeus spores is given in Table 5 and Figure 4. The effects of the decontamination to short DNA segment (132 bp) of the yaaH gene using “BA yaaH Primer Set 3” present a linear degradation starting at ∼489,000 copies and ending on 49,600 copies. In contrast, the damage to the long DNA segment (680 bp) of the yaaH gene using “BA yaaH Primer Set 2” presents a biphasic mode, starting with ∼392,000 copies with a very rapid degradation for the 1-h decontamination, followed by a plateau or refractory effect in damage for the 2 h, then another rapid deterioration for the 6 h and a plateau in degradation for the 12-h decontamination ending in ∼181,000 copies.
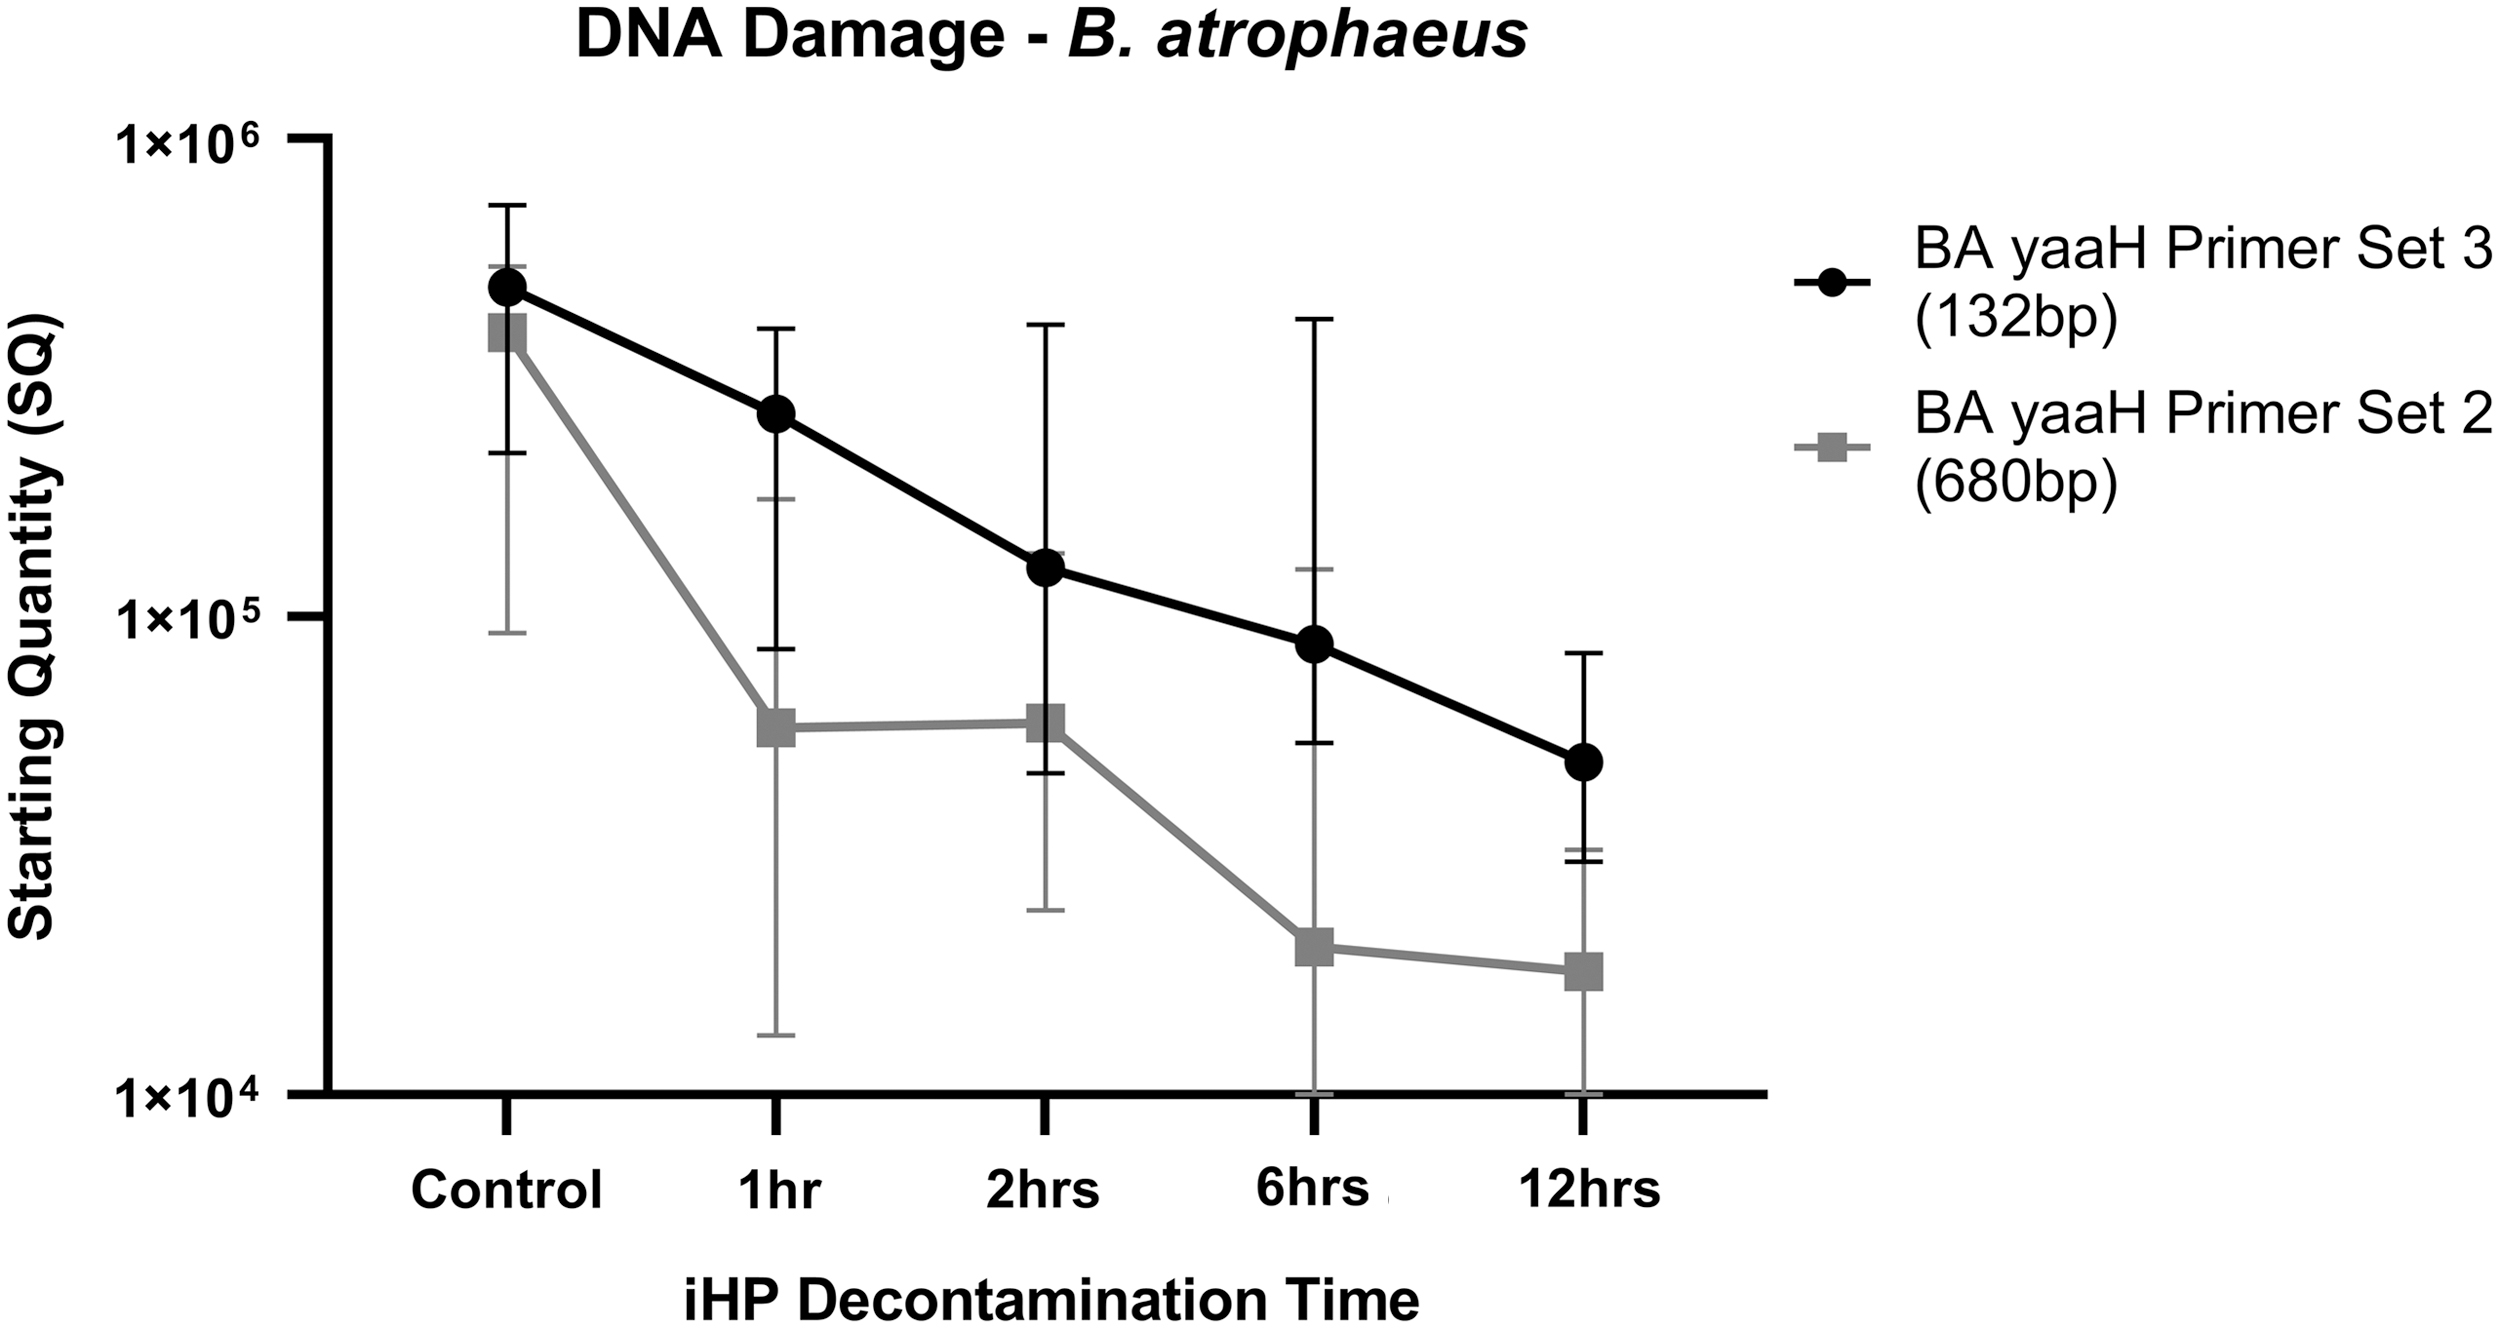
Results of the qPCR analysis to the damage to the yaaH gene of the Bacillus atrophaeus spores. Data are presented as the median with interquartile range. qPCR, quantitative polymerase chain reaction.
Data are presented as the median.
iHP, ionized hydrogen peroxide.
The results of a statistically significant difference test (t-test analysis) on the effects of the decontamination on the yaaH gene using the qPCR data for the “BA yaaH Primer Set 3” show that the damage to the short DNA segment (132 bp) is somewhat significant for the 1-h contact time (p = 0.0084, t = 2.732) and highly significant for the contact times of 2 h (p < 0.0001, t = 4.425), 6 h (p < 0.0001, t = 4.327), and 12 h (p < 0.0001, t = 8.044) when comparing with the control samples. The graphical results are shown in Figure 5.
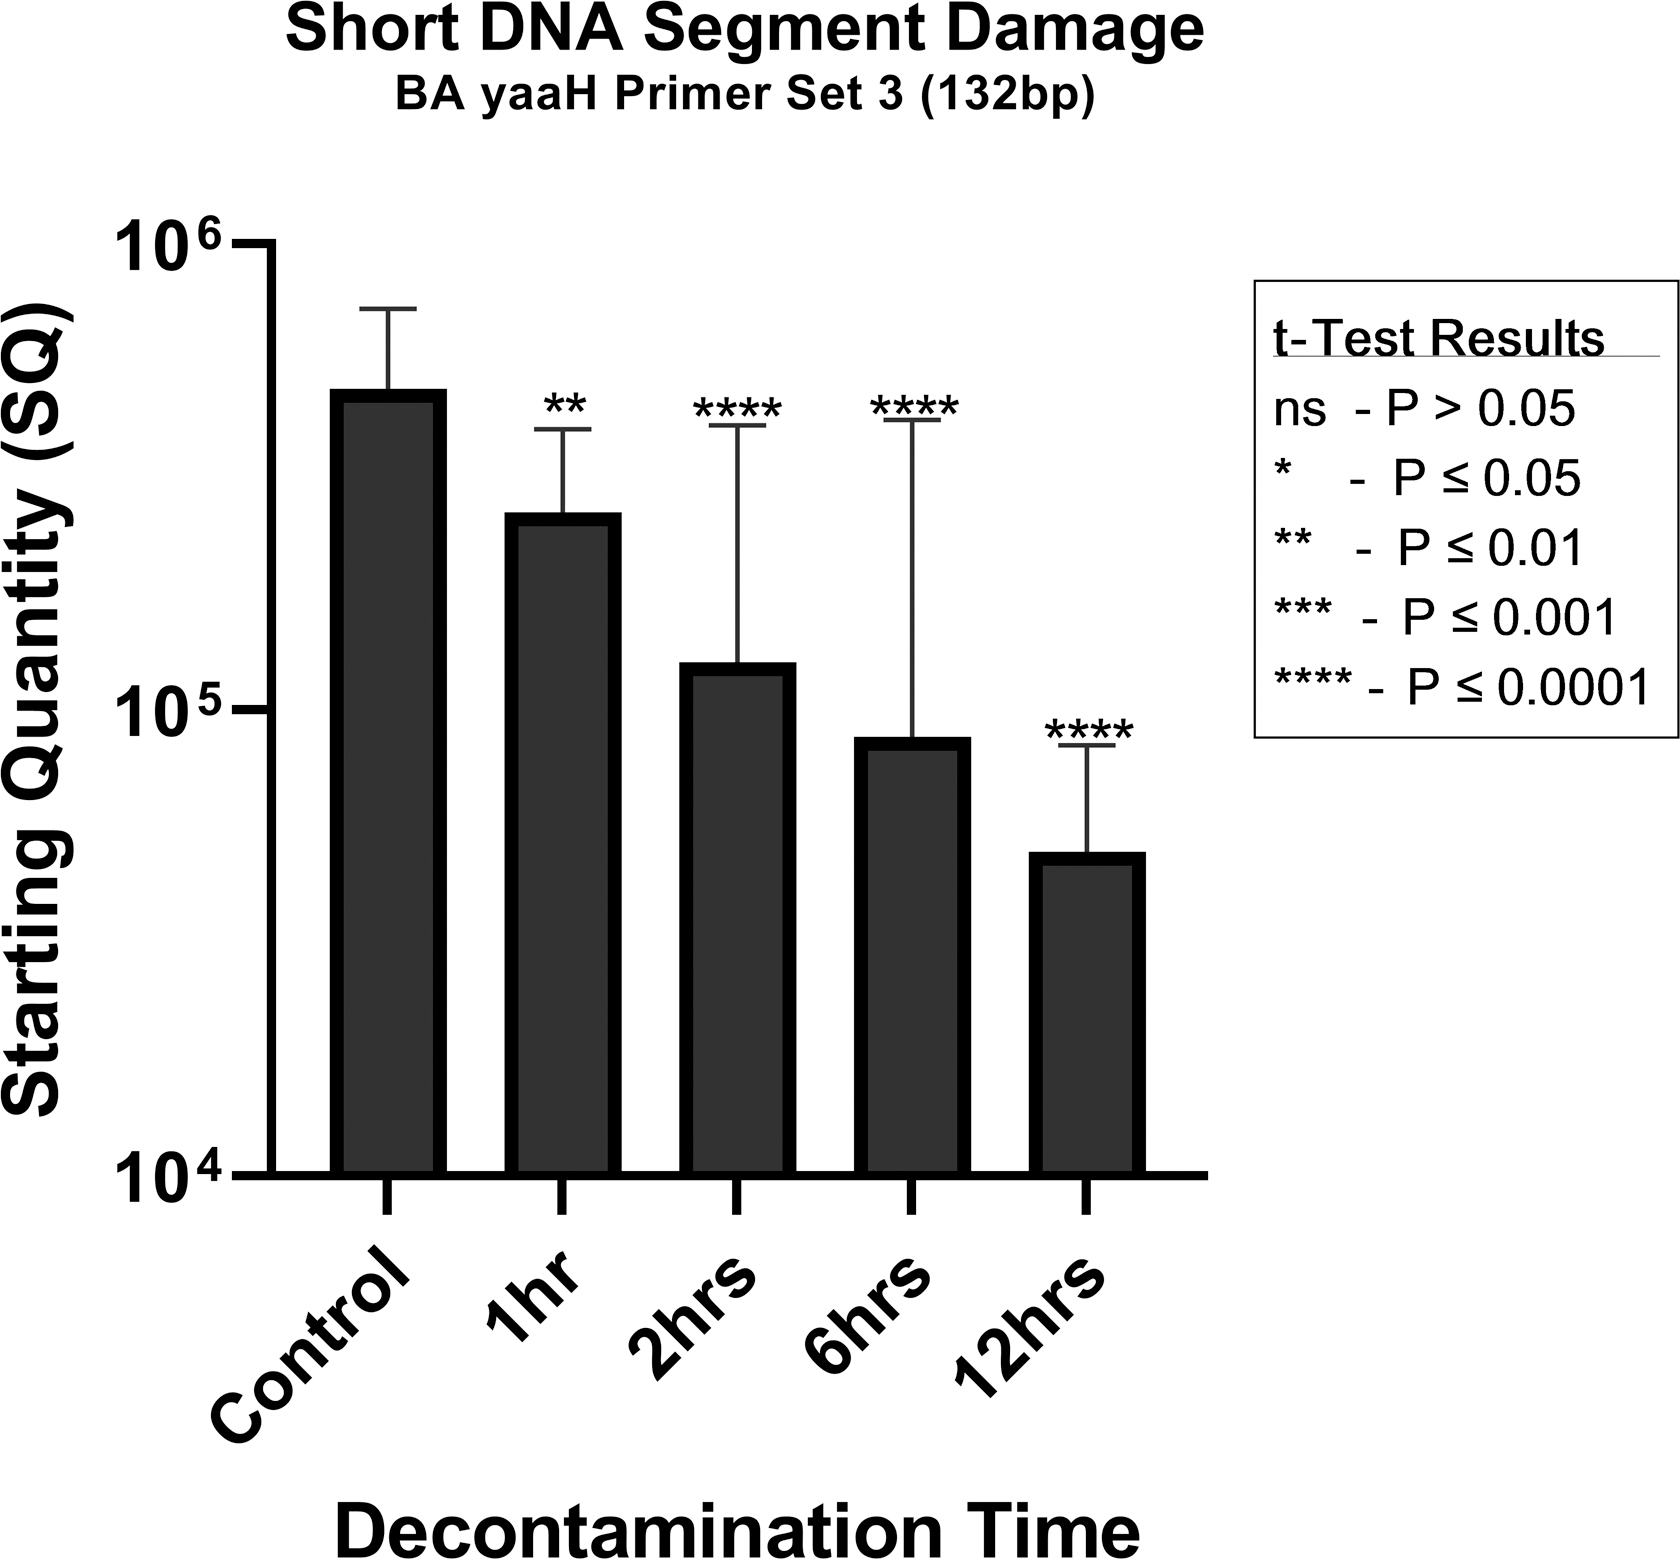
t-Test analysis result for each decontamination time for the qPCR results of the BA yaaH Primer Set 3 (132 bp).
In addition, the results of the t-test analysis on the effects of the decontamination on the yaaH gene using “BA yaaH Primer Set 2” show that damage to the long DNA segment (680 bp) is highly significant for the contact times of 1 h (p < 0.0001, t = 4.394), 2 h (p < 0.0001, t = 6.246), 6 h (p < 0.0001, t = 6.605), and 12 h (p < 0.001, t = 7.858) when comparing with the control samples. The graphical results are shown in Figure 6.
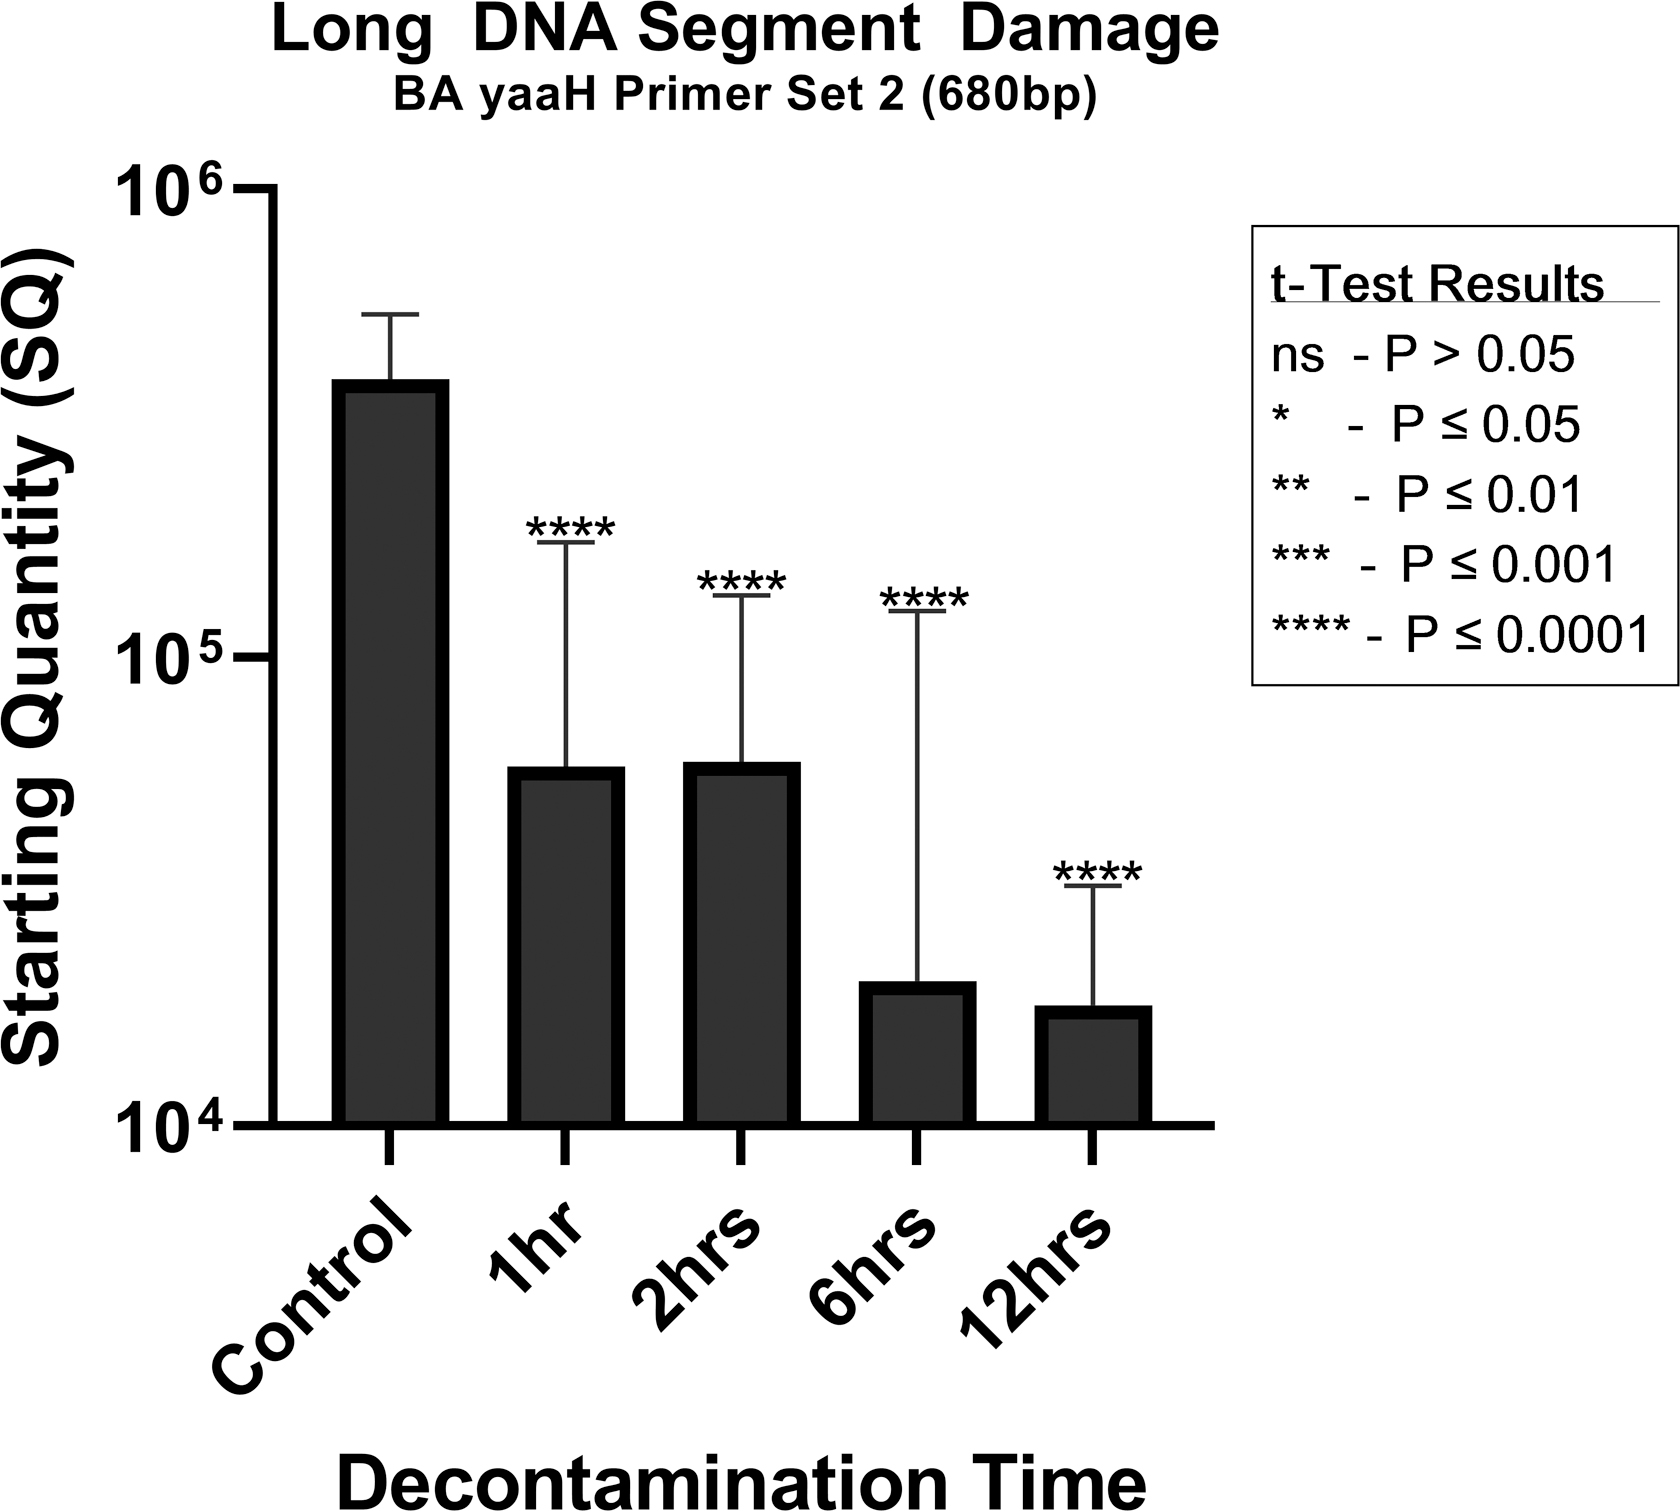
t-Test analysis result for each decontamination time for the qPCR results of the BA yaaH Primer Set 2 (680 bp).
Discussion
Typically, DNA extraction from spores required that spores be disrupted to make the DNA available. 22 Since the purpose of this study was to analyze the effects, if any, of DNA damage of spores due to the decontamination with iHP, no mechanical damage could be done to spores in an attempt to improve the fixation for TEM or the extraction of DNA. Any effort to enhance either method would affect the real results of this study.
The results of this study are significant because they showed that iHP inhibited the germination of the spores of B. atrophaeus by ultrastructural damage to the IM of the spore, as shown in the TEM micrographs and subsequent degradative damage to the DNA as shown by the qPCR tests results.
Visual effects of the decontamination process were observed in the ultramicrographs of the B. atrophaeus spores in Figures 1–3. It was observed that visible ultrastructural damage to the spore coat was initiated at timepoints beyond the 1 h of contact time, and it was most noticeable after 6 h of contact time. Ultrastructural damage to the IM was first observed at 6 h of contact time and was more pronounced at the 12-h contact timepoint. In addition, the t-test analysis of the data shown in Figures 5 and 6 presented highly significant differences, especially after 6 h of decontamination contact time.
It is important to note that the longer the exposure time, the better was the penetration of the fixative solutions in the spore, and the better the fine details of its structure could be observed. We think that this finding could be a result of the ultrastructural damage that could be seen in the outer layers of the spores that permitted the TEM fixative solutions to have a more effective penetration efficiency.
The results of the qPCR analysis in Figure 4 showed two initial stages of degradative damage to DNA with very noticeable damage at 12-h contact time, and this finding confirmed the observations of the ultrastructural micrographs for the B. atrophaeus spores. Although qPCR studies could provide excellent results when assessing the effects of a decontamination process on the spores, confirmatory experiments (i.e., TEM analysis) should be performed to elucidate the real impact of the decontamination process on the spores under analysis.
Conclusion
The methodology used in this study was similar to the protocols used for the evaluation of exposure of DNA and Bacillus subtilis spores to a simulated Martian environment developed by Fajardo-Cavazos et al. 15
Although the inactivation of biological agents has always been of utmost importance, recent events have created an increase in public awareness of laboratory research activities.23,24 These events have moved the research environment toward higher accountability of actions. The inactivation of biological agents utilized within laboratories will require a quantifiable approach with the use of the agents or their surrogates. The methods presented in this study could be used to evaluate the decontamination effect on different biological agents by selecting the proper primers and creating the correct plasmids.
The verification of degradative damages to DNA is a simple viable alternative to evaluate the decontamination processes. It can be used to evaluate the inactivation of the biological agents that are located in any medium from which DNA could be extracted.
Footnotes
Acknowledgments
The authors acknowledge the support provided on this project by Christopher M. Gibbs and John D. Carter, Zhixia Ding, and Dr. Vsevolod Popov from UTMB.
Author Disclosure Statement
No competing financial interests exist.
Funding Information
The authors acknowledge the support of this study by the University of Texas Medical Branch (UTMB); the Universidade Federal de Viçosa, Brazil; the National Institute of Allergy and Infectious Diseases (NIH NIAID); Infectious Diseases National Biocontainment Laboratories (NBLs) Operations Support (UC7 Grant); and the Coordenação de Aperfeiçoamento de Pessoal de Nível Superior (CAPES), Brazil.