
Abstract
Introduction:
Cosmetics Europe develops two defined approaches (DAs) for eye hazard identification, that is, addressing serious eye damage (Cat. 1), eye irritation (Cat. 2), and the absence thereof (No Cat.), for nonsurfactant liquid test substances. DAL-1 combines four physicochemical properties, the reconstructed human cornea-like epithelium (EpiOcular™ eye irritation test [EIT]: VRM1 and SkinEthic™ human corneal epithelium EIT: VRM2) test method (OECD test guideline [TG] 492), and bovine corneal opacity and permeability (BCOP) test method (OECD TG 437). DAL-2 combines the short time exposure test method (OECD TG 491) and the BCOP test method (OECD TG 437). In both DAs, the BCOP with the laser light-based opacitometer is used, however, only opacity is used to identify liquids that cause serious eye damage.
Materials and Methods:
The performance of the DAs to distinguish between the three United Nations Globally Harmonized System of Classification (UN GHS) categories was compared against the minimum performance values proposed by Cosmetics Europe to the Organisation for Economic Co-operation and Development expert Group on eye/skin irritation/corrosion and phototoxicity and agreed upon by the experts. Furthermore, the class-specific performance metrics are also provided for each DA.
Results:
The balanced accuracy of DAL-1 with validated reference method—EpiOcular EIT (VRM1), DAL-1 with validated reference method—SkinEthic HCE EIT (VRM2), and DAL-2 was 69.2%, 75.2%, and 74.3%, respectively. DAL-1 with VRM1 identified 76.5% of Cat. 1 (N = 17), 59.1% of Cat. 2 (N = 22), and 72.1% of No Cat. (N = 55) correctly. DAL-1 with VRM2 identified 76.5% of Cat. 1 (N = 17), 68.7% of Cat. 2 (N = 23), and 80.4% of No Cat. (N = 46) correctly. DAL-2 identified 81.2% of Cat. 1 (N = 17), 56.3% of Cat. 2 (N = 24), and 85.3% of No Cat. (N = 123) correctly.
Conclusion:
The percentage of correct predictions was greater than the proposed minimum performance values of 75% for Cat. 1, 50% for Cat. 2, and 70% for No Cat. Therefore, DAL-1 and DAL-2 have shown to successfully distinguish between the three UN GHS categories for eye hazard identification.
Introduction
Cosmetics Europe developed two defined approaches (DAs) for classification and labeling of chemicals according to the United Nations Globally Harmonized System (UN GHS).1–3 These DAs are DAL-1 for non-surfactant liquids combining physicochemical properties, reconstructed human cornea-like epithelium (RhCE) test method (OECD test guideline [TG] 492), and bovine corneal opacity and permeability (BCOP) test method (OECD TG 437); and DAL-2 for non-surfactant liquids combining short time exposure (STE) test method (OECD TG 491) and BCOP test method (OECD TG 437).4–6 In both DAs, the BCOP laser light-based opacitometer (LLBO) is used, as described within the OECD TG 437. 5
Both DAs have been shown to be useful for making predictions across the whole range of UN GHS categories, that is, category 1 (Cat. 1) on “serious eye damage”; category 2 (Cat. 2) on “eye irritation,” and no category (No Cat.) for chemicals “not requiring classification and labeling” for eye irritation or serious eye damage. 1 The two DAs were introduced to the Organisation for Economic Co-operation and Development (OECD) expert group on eye/skin irritation/corrosion and phototoxicity in 2019, with the objective to adopt the first OECD guideline for DAs for serious eye damage/eye irritation as defined by the UN GHS for classification and labeling of chemicals.
The DAs described here follow the recommendations and combinations of modules as stipulated in the guidance document No. 263 on integrated approaches to testing and assessment for serious eye damage and eye irritation. 7 Strategies such as the bottom-up and top-down approaches proposed by Scott and coauthors fit within this framework. 8 In brief, when a chemical is expected not to cause sufficient serious eye damage/eye irritation to require classification, it is suggested to start with the bottom-up approach. This approach for DAL-1 is shown in Figure 1, which combines four physicochemical properties of the liquid test substances with the results of two in vitro test methods (RhCE and BCOP LLBO). 2
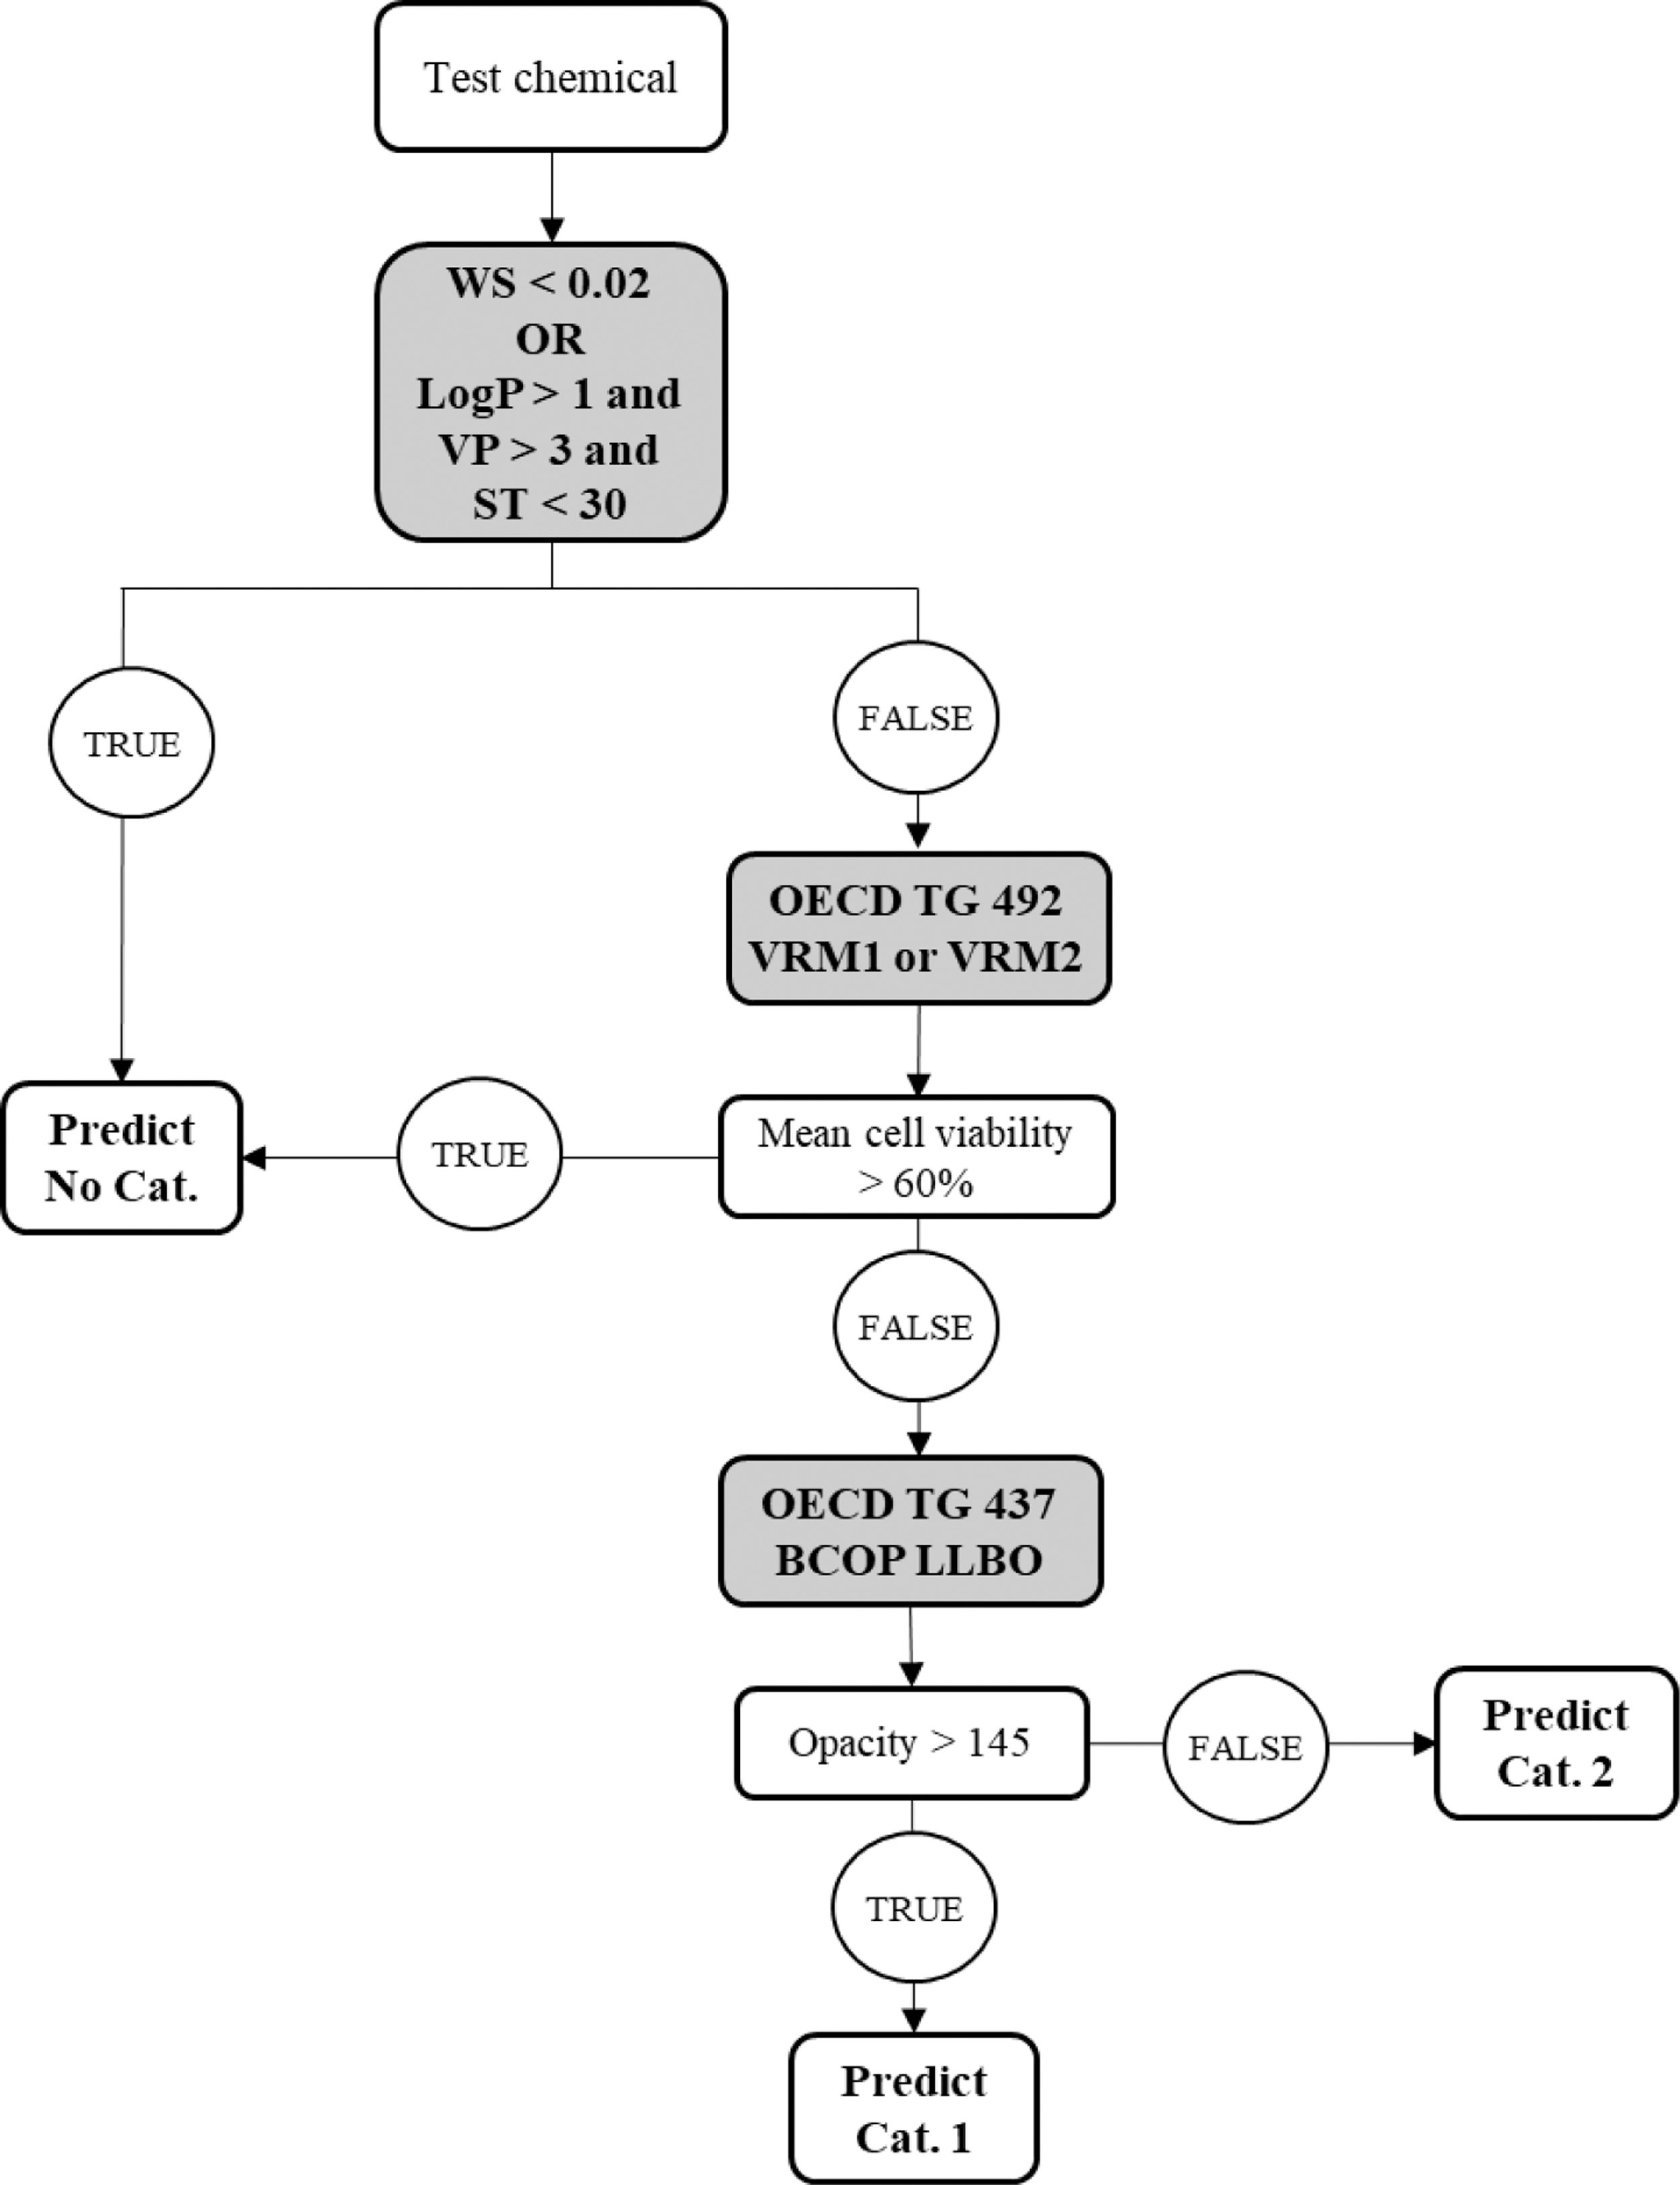
Scheme of the DAL-1 (bottom-up approach): step 1 physicochemical exclusion rules (WS in mg/mL or LogP and VP in mm Hg and ST dyne/cm) to identify No Cat., step 2 RhCE test method used to identify No Cat., and step 3 BCOP LLBO used to identify Cat. 1. BCOP, bovine corneal opacity, and permeability; LLBO, laser light-based opacitometer; RhCE, reconstructed human cornea-like epithelium; ST, surface tension; VP, vapor pressure; WS, water solubility.
Physicochemical property exclusion rules based on water solubility (<0.02 mg/mL) or a combination of octanol–water partition coefficient (LogP >1), vapor pressure (>3 mm Hg), and surface tension (ST <30 dyne/cm) are used in a first step to identify liquid chemicals with no serious eye damage or eye irritation potential. Liquids for which the exclusion rules are not met are evaluated based on an RhCE test method in Step 2. The RhCE models that are part of DAL-1 are the EpiOcular™ eye irritation test (EIT) and the SkinEthic™ human corneal epithelium (HCE) EIT and are referred to hereafter as validated reference method—EpiOcular EIT (VRM1) and validated reference method—SkinEthic HCE EIT (VRM2), respectively. 4 Liquids that result in a tissue viability >60% are classified No Cat. Those that result in a tissue viability ≤60% are evaluated based on the BCOP LLBO test method in a third step. Liquids that result in an opacity >145 are predicted Cat. 1 and the remaining liquids are assigned Cat. 2. In contrast, when the chemical is expected to cause serious eye damage, it is advised to use the top-down approach of DAL-1 and start with the BCOP LLBO followed by the RhCE test methods (Fig. 2). Furthermore, the BCOP LLBO test is only needed in case the physicochemical property exclusion rules are not met. When the physicochemical properties are not available, DAL-1 is reduced to a testing strategy that combines the results of the in vitro test methods (BCOP LLBO and RhCE). It is important to note that the correct No Cat. identification for the combination of the in vitro test methods is less than that of DAL-1 since some of the in vivo No Cat. liquids that are positive with the RhCE test methods are correctly identified based on the physicochemical property exclusion rules. 2
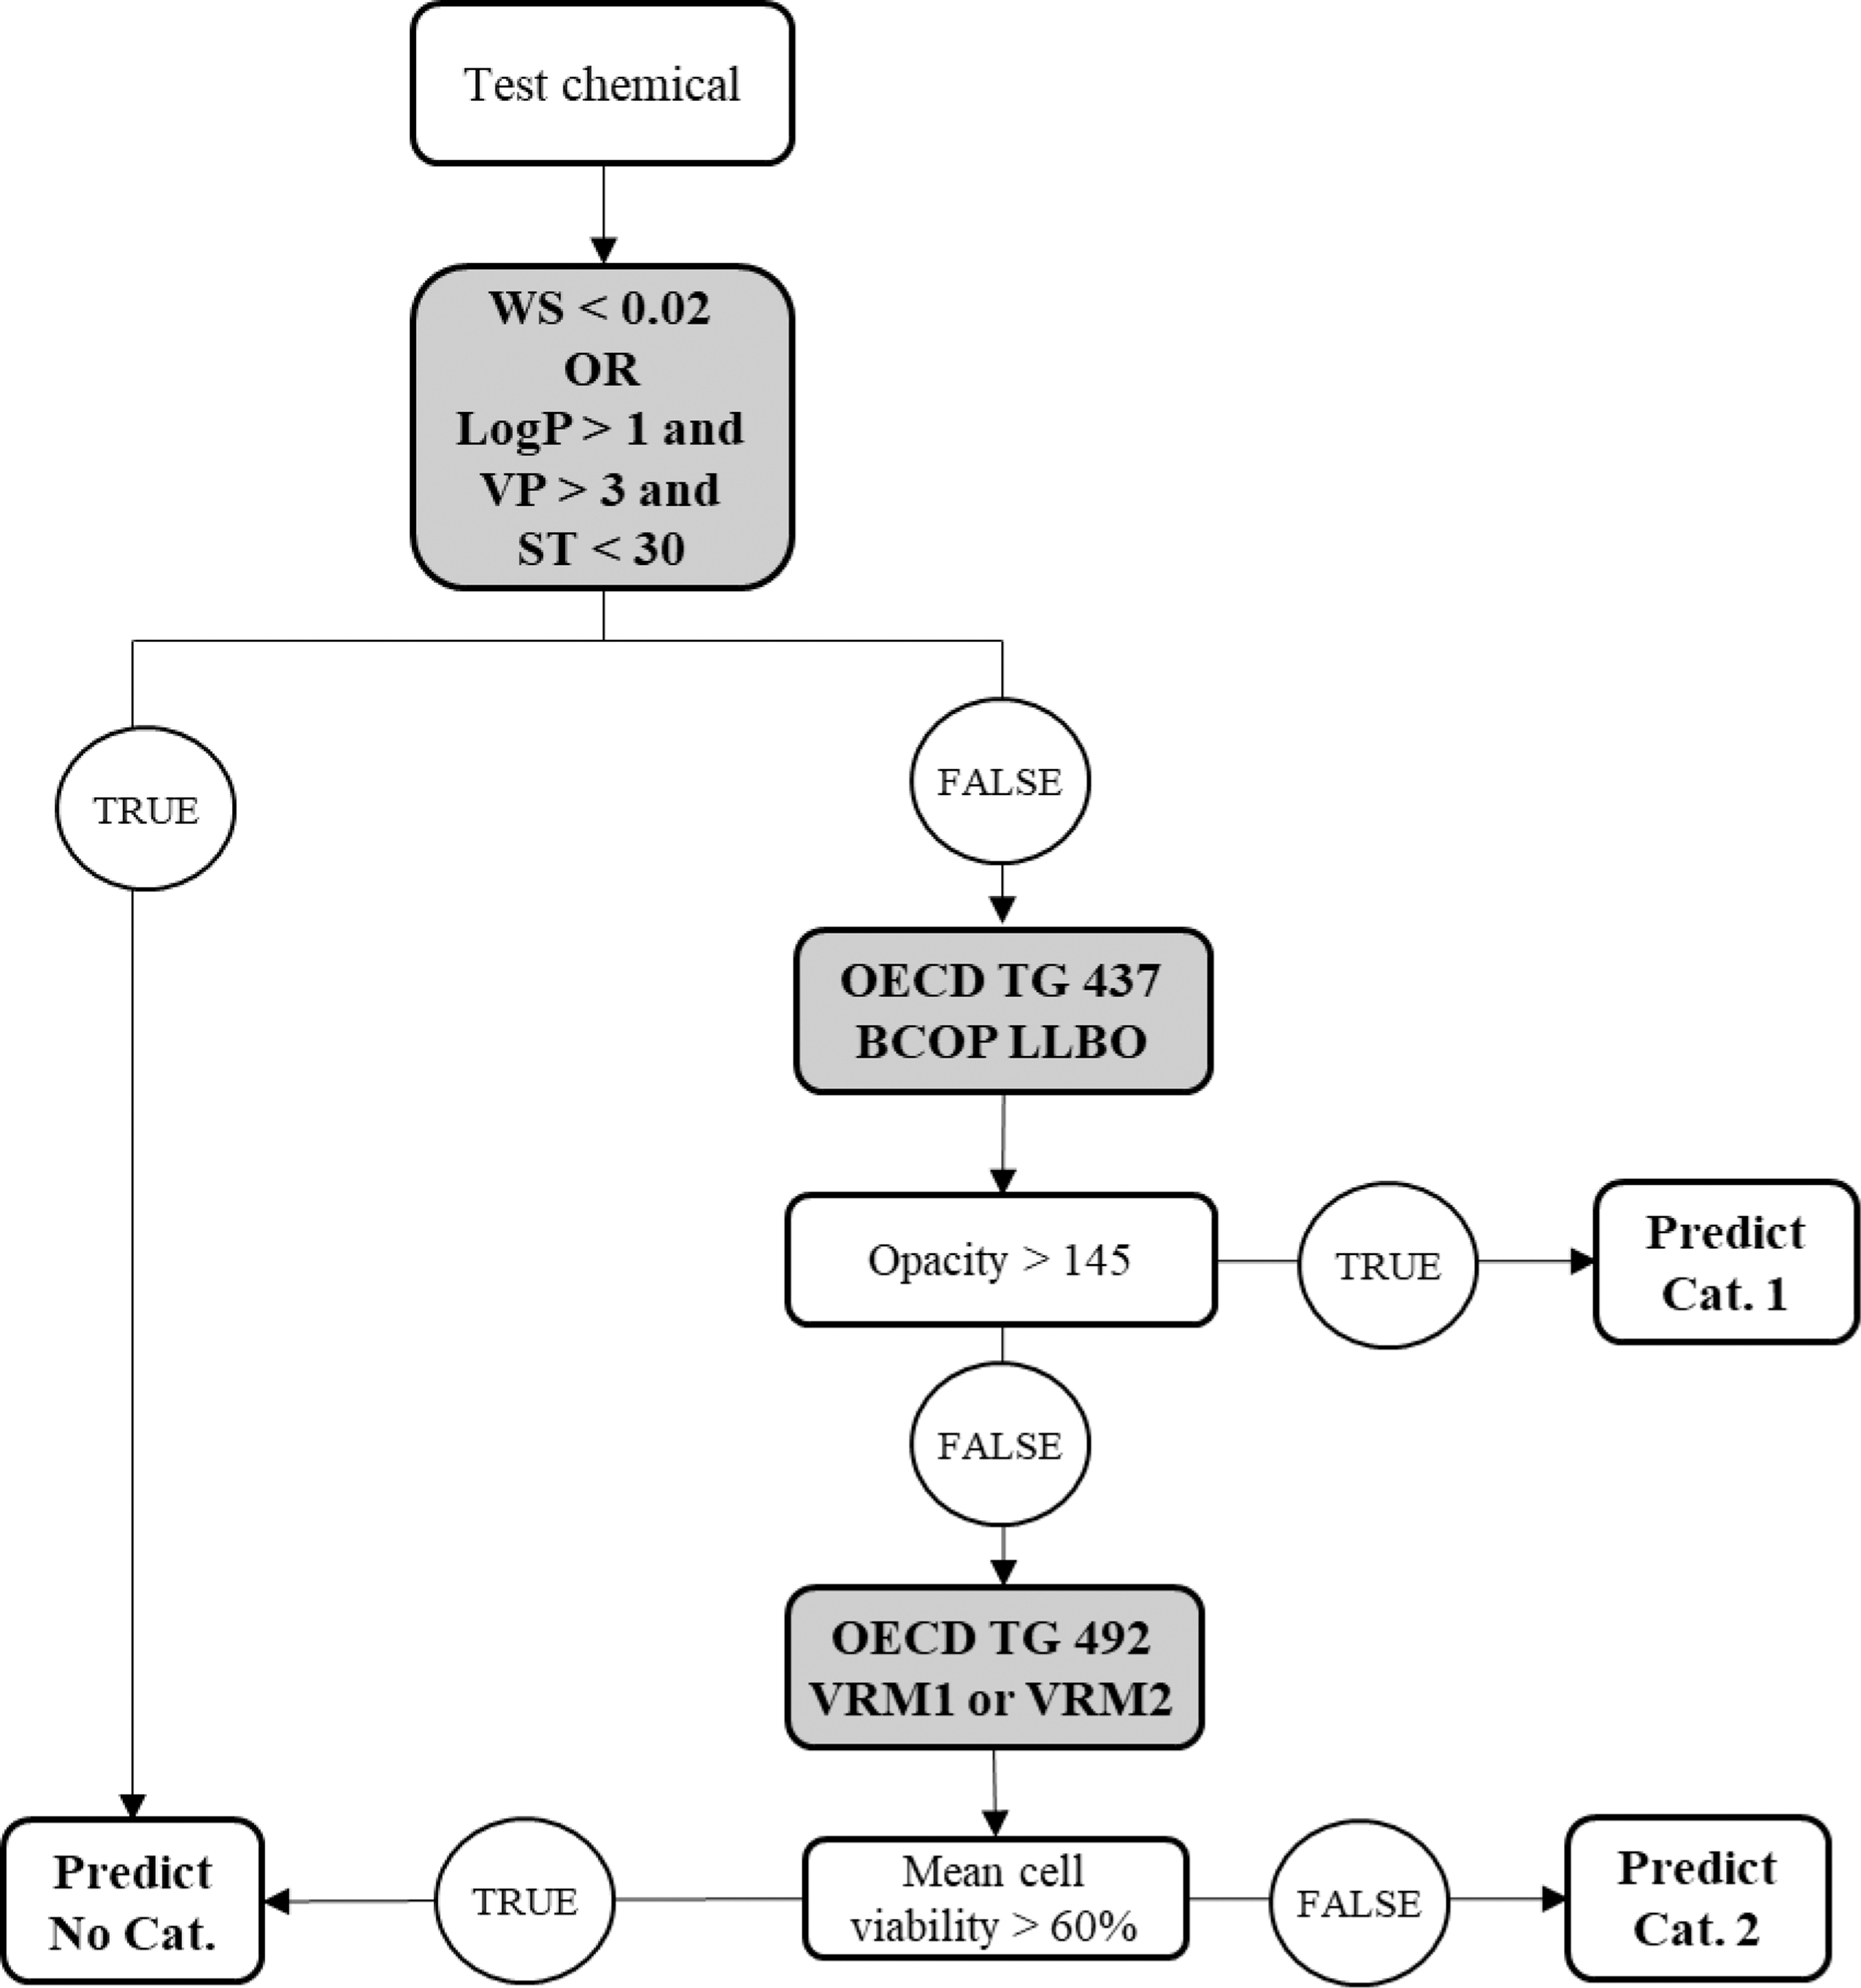
Scheme of the DAL-1 (top-down approach); step 1 physicochemical exclusion rules (WS in mg/mL; or LogP: octanol–water partition coefficient/VP in mm Hg/ST in dyne/cm) to identify No Cat., step 2 RhCE test method used to identify No Cat., and step 3 BCOP LLBO used to identify Cat. 1.
DAL-2, shown in Figure 3, describes the combination of STE test method and the BCOP LLBO test method in a bottom-up approach. 3 The STE test method is used to identify liquid chemicals with no serious eye damage or eye irritation potential (No Cat.: liquids that result in a mean cell viability >70% at a 5% and 0.05% concentration) or to identify liquids that cause serious eye damage/eye irritation (Cat. 1: liquids that result in a mean cell viability ≤70% at a 5% and 0.05% concentration). For liquids that result in a mean cell viability ≤70% at 5% concentration but >70% at 0.05%, the BCOP LLBO is needed for final classification, liquids that result in an opacity >145 are predicted as Cat. 1, and the remaining liquids are assigned to Cat. 2.
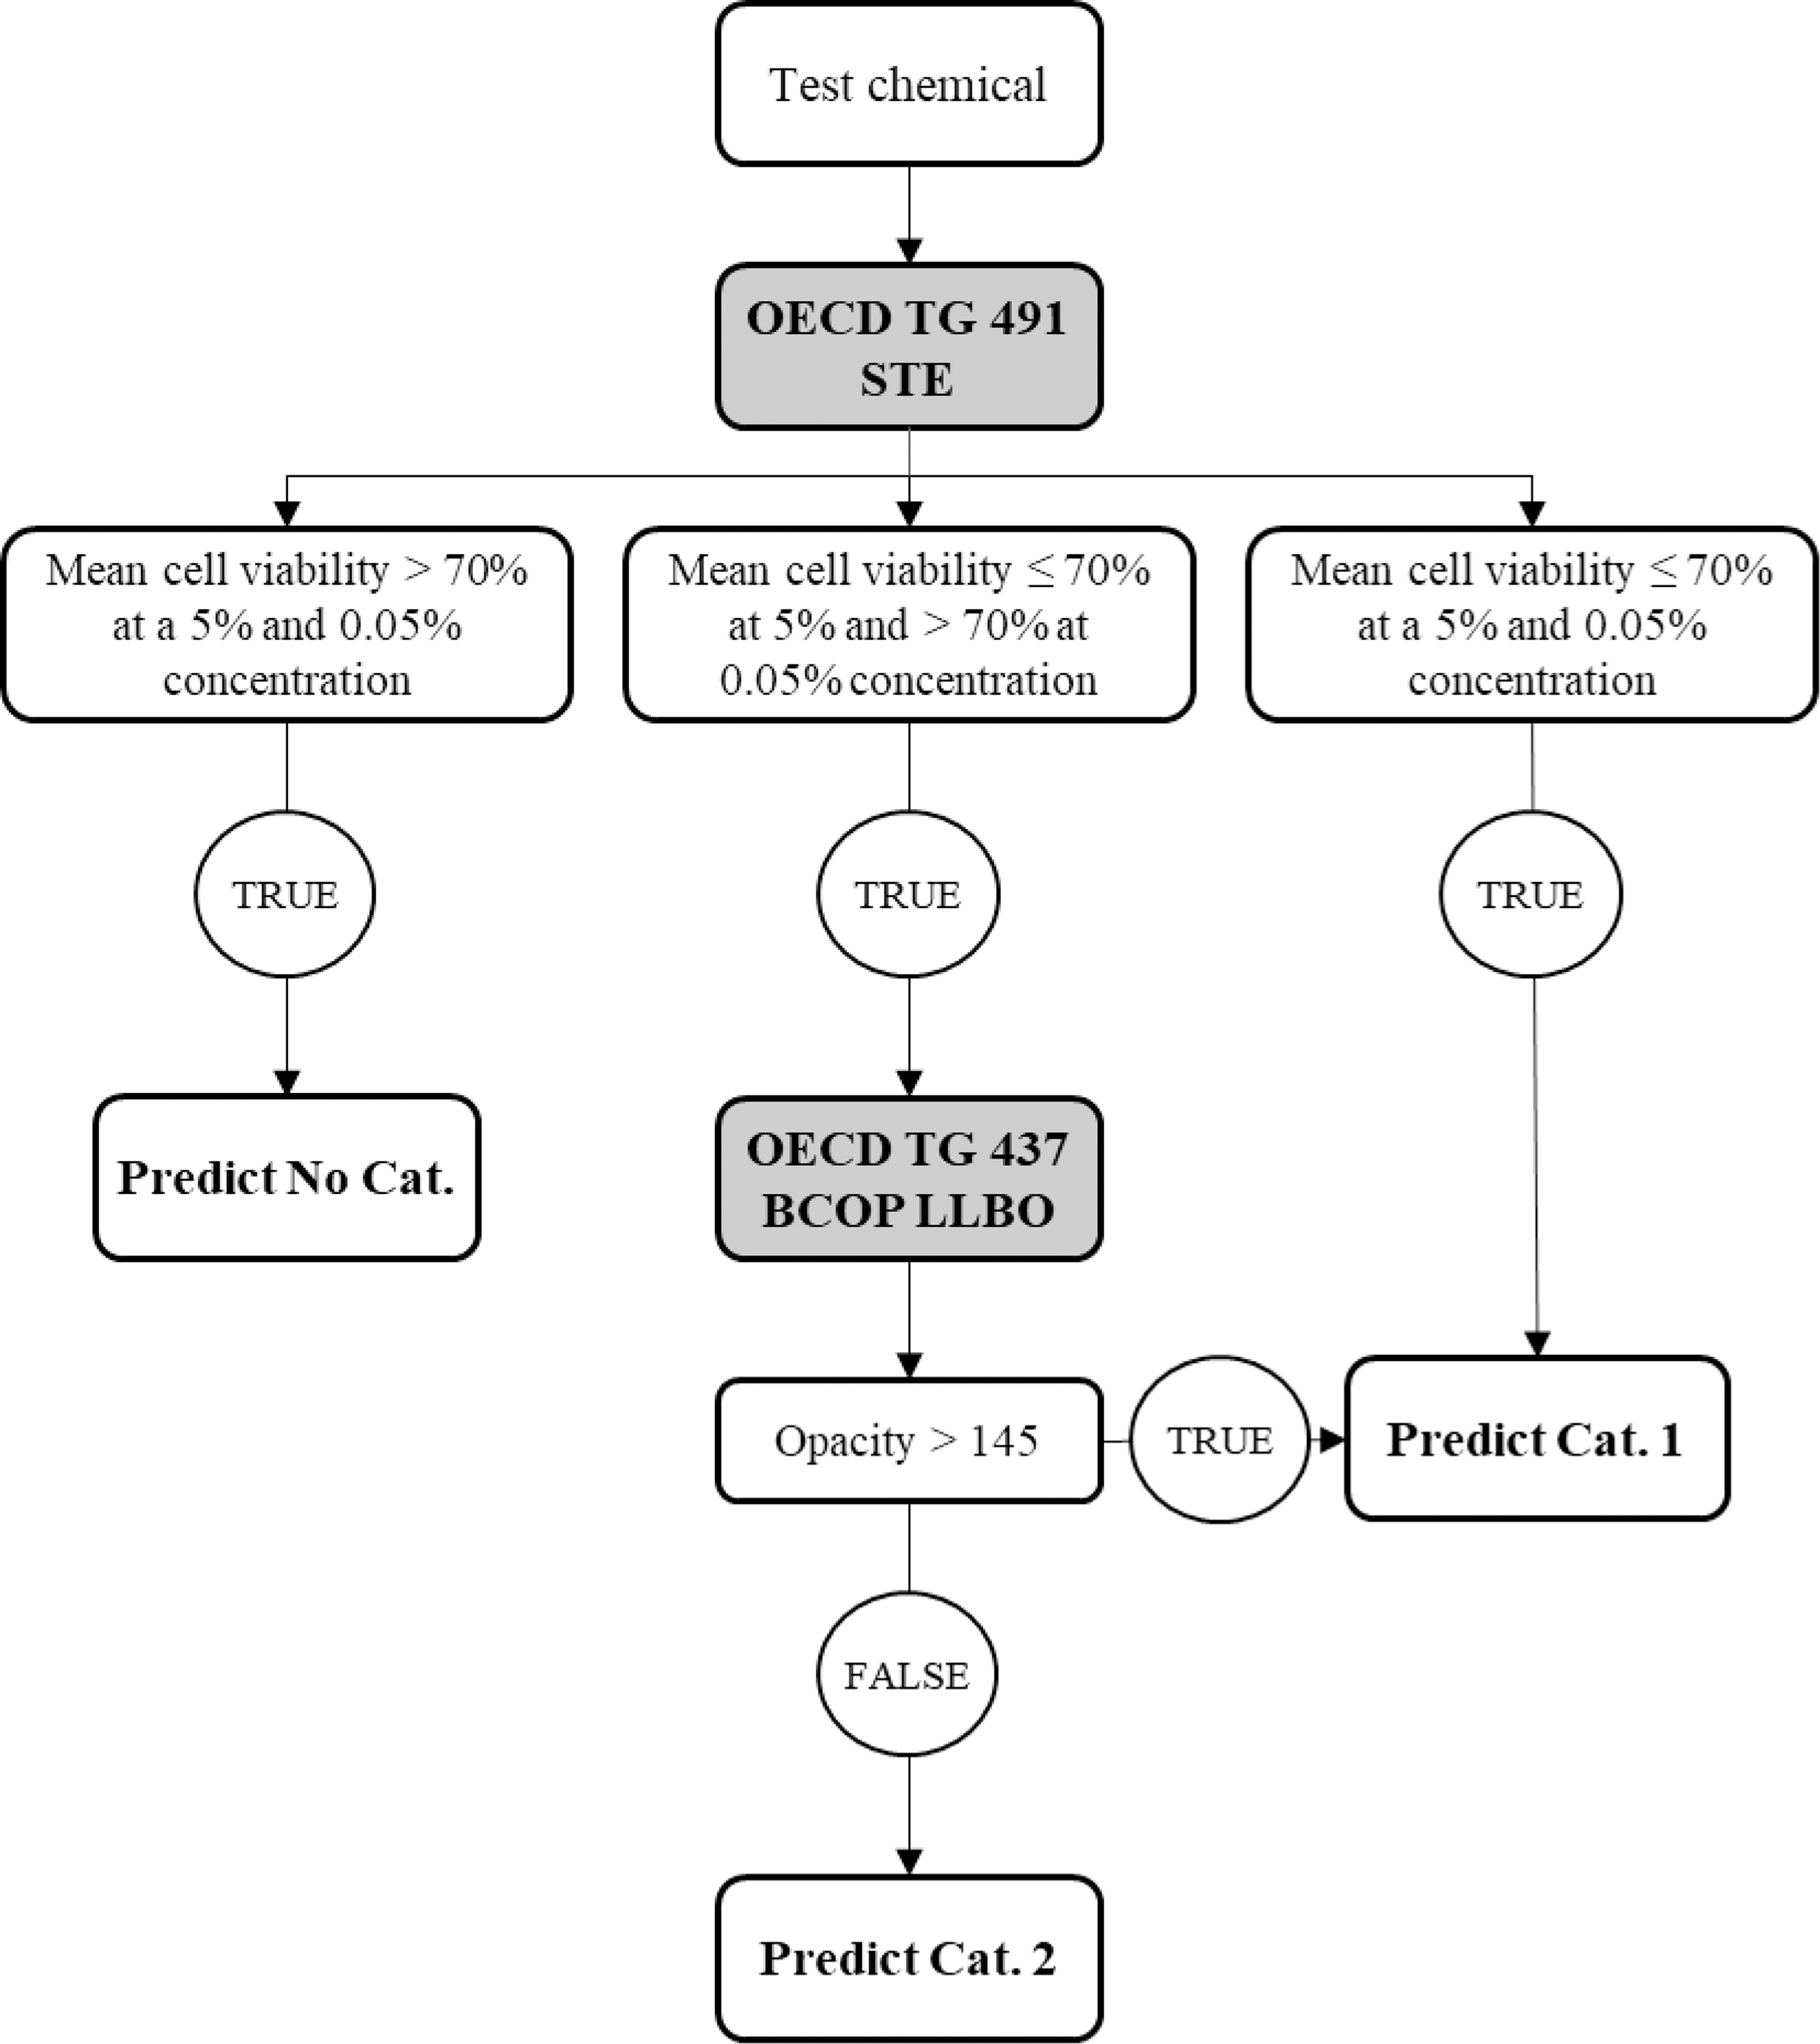
Scheme of the DAL-2 (bottom-up approach): start with the STE test method followed by the BCOP LLBO test method. STE, short time exposure.
Note that when the chemical is expected to cause serious eye damage, it is advised to use the top-down approach and start with the BCOP LLBO followed by the STE test method (Fig. 4). The reason for this is that the predictivity to identify Cat. 1 correctly is much less with the STE (23.5% correct) in comparison with that with the BCOP LLBO test method (76.5% correct). 3
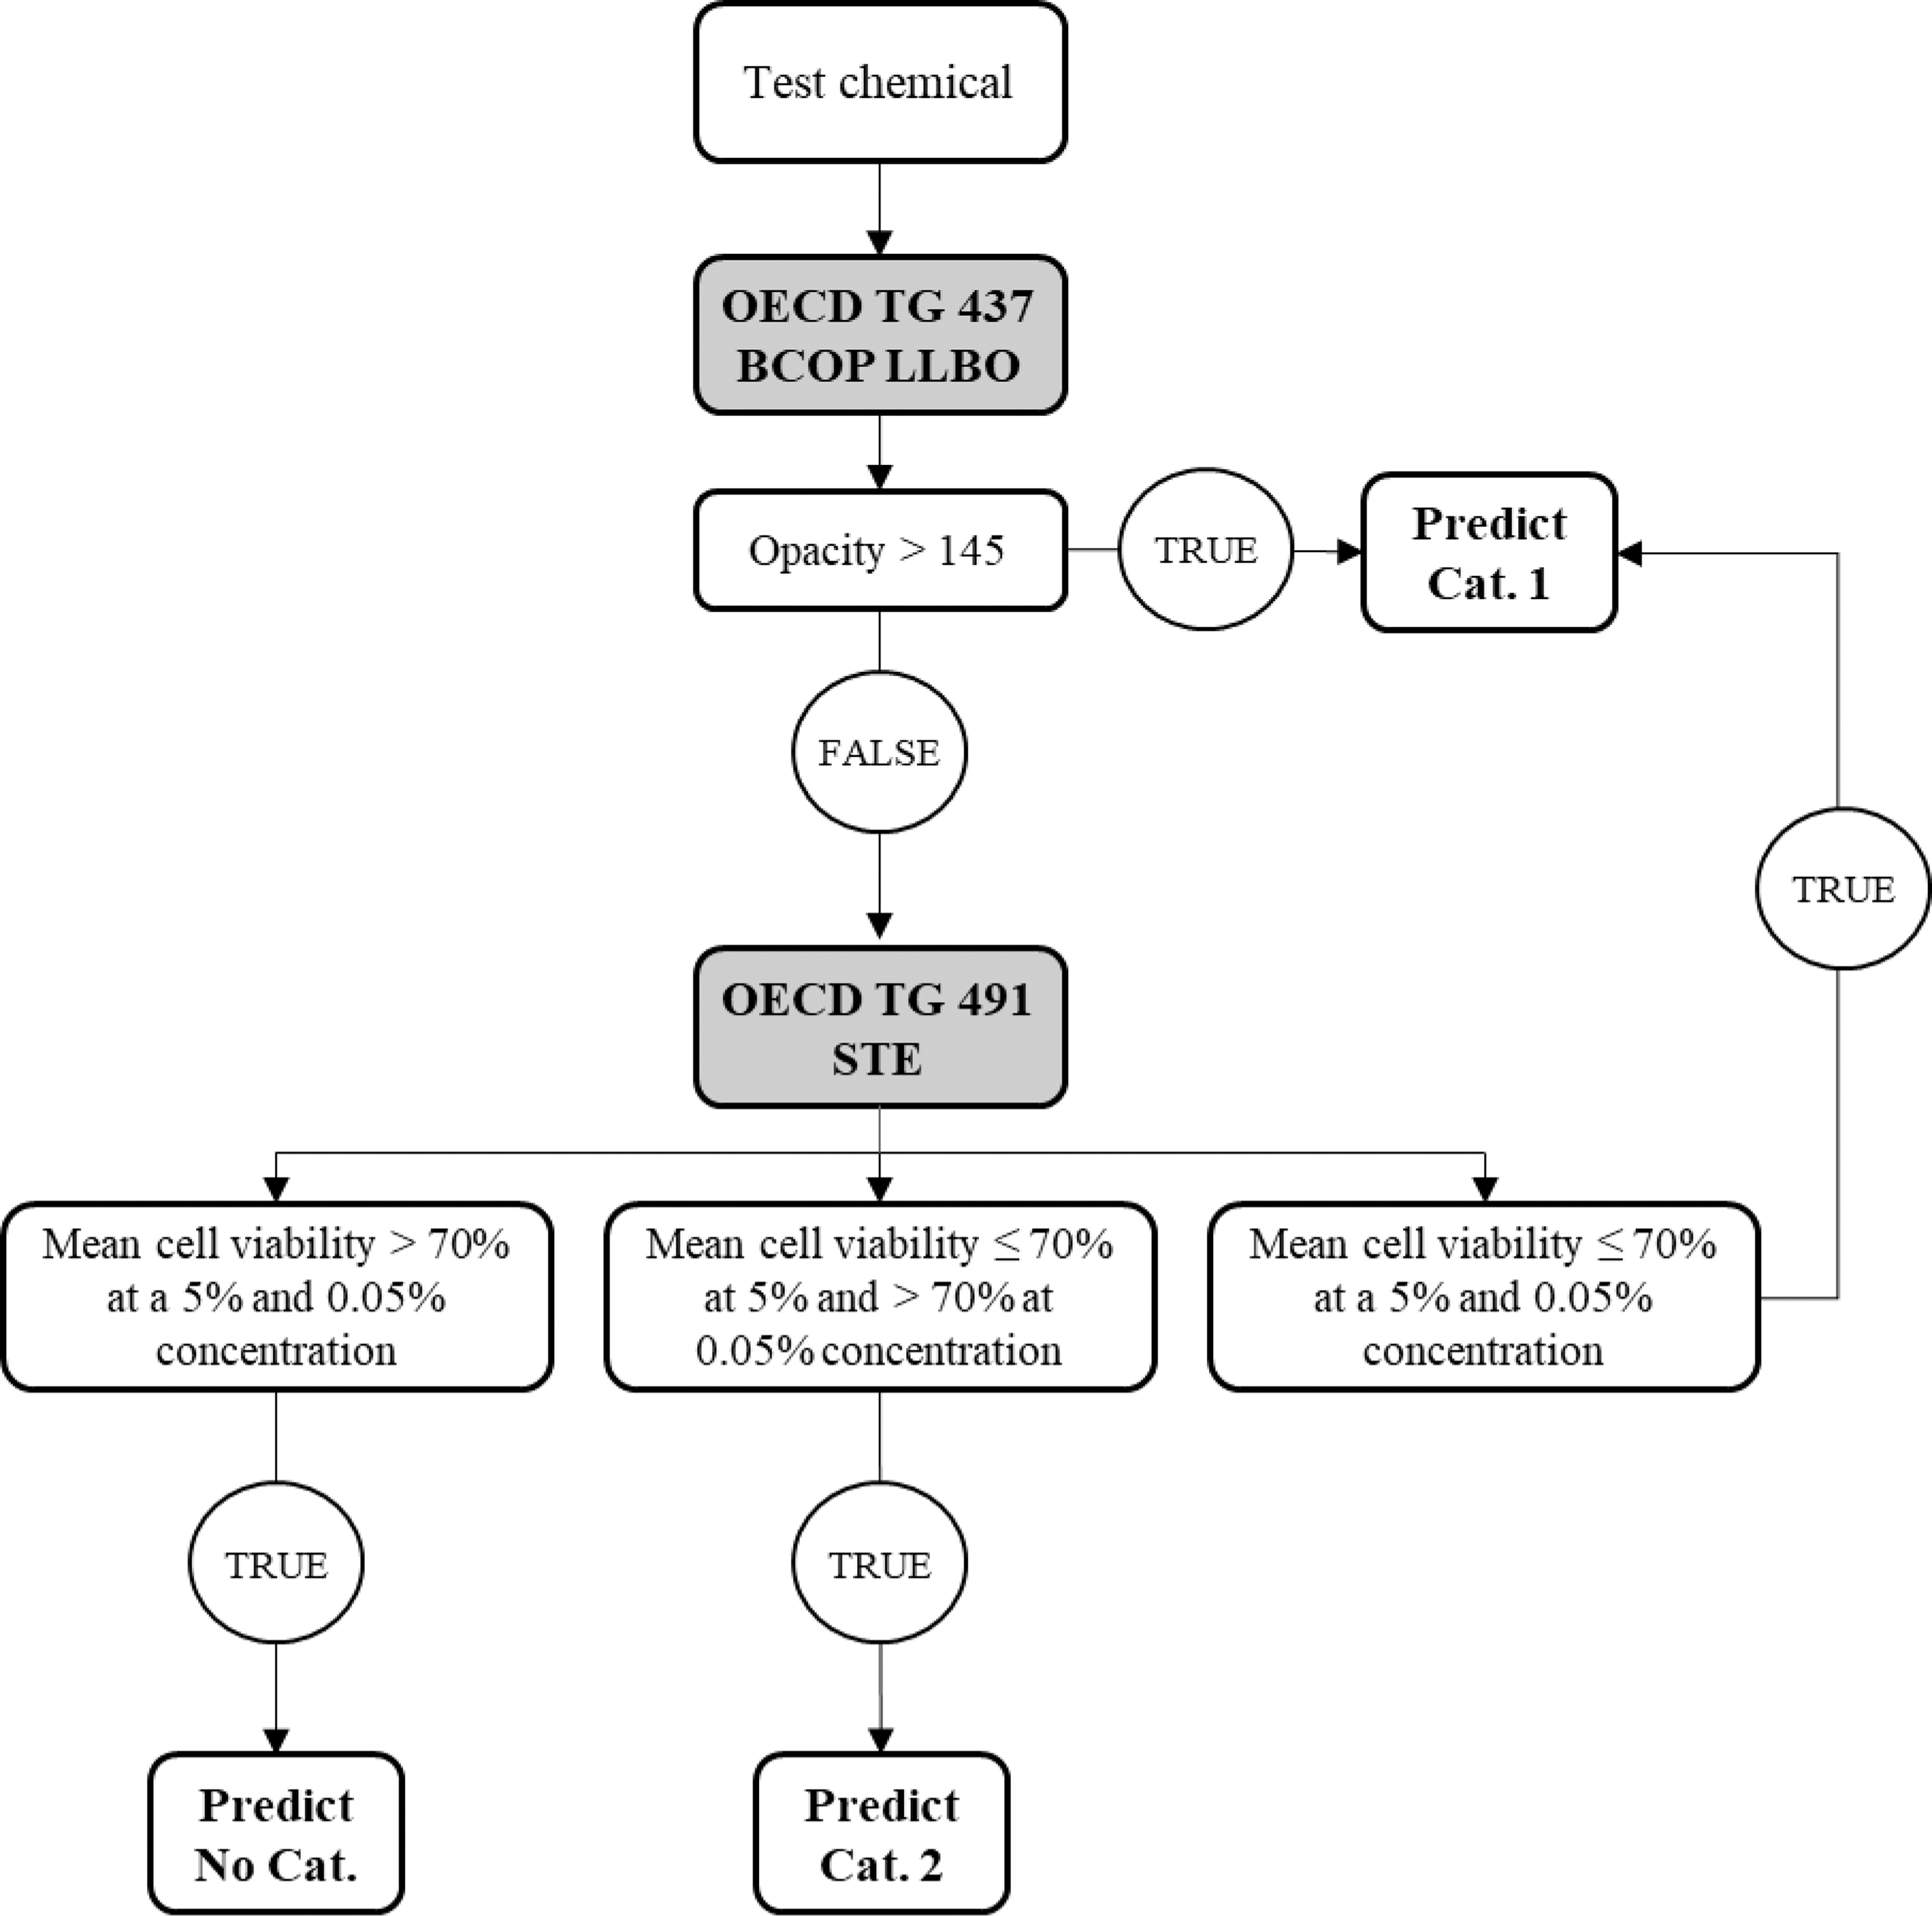
Scheme of the DAL-2 (top-down approach): start with the BCOP LLBO test method followed by the STE test method.
The performance of the DAs and their individual components was assessed against the Draize eye test. Note that for the selection of the reference chemicals from the Cosmetics Europe Draize Eye Test Reference Database, the key criteria as identified by Barroso and coworkers were applied. 9 In brief, the reference set for each DA contained chemicals classified based on the most important drivers of in vivo Cat. 1 classification (severity and/or persistence of corneal opacity [CO]) and of in vivo Cat. 2 classification (CO severity or conjunctival (Conj.) effects). For the set of in vivo No Cat. chemicals, the majority of the chemicals did belong to the subgroup CO = 0 (CO scores equal to 0 in all animals and all observed time points) and the remaining chemicals did belong to the subgroups CO >0 and CO >0 ** (CO scores not equal to 0 in at least one animal). No Cat. studies marked with ** are studies for which at least one animal had a mean of the scores of days 1–3 above the classification cutoff for at least one endpoint but not in enough animals to generate a classification.
The overall accuracy, the proportion of correctly identified Cat. 1, Cat. 2, and No Cat., underprediction, overprediction, false negative (FN) rate, and false positive (FP) rate for DAL-1 and DAL-2 were published by Alépée and coauthors.2,3 At the time the DAs were developed, no international agreed performance criterion was available to assess their predictive capacity. Therefore, the criteria that were set during the CONsortium for in vitro Eye Irritation testing strategy (CON4EI) project were used initially to develop DAL-1 and DAL-2. 10
Following the introduction of the DAs to the OECD expert group on eye/skin irritation/corrosion and phototoxicity, Cosmetics Europe proposed target values to assess the performance of DAs for eye hazard identification to distinguish between the three UN GHS categories. The proposed target values considered the uncertainty of the Draize eye test by taking into account the within- and between-test variability.9–11 After discussion with the OECD expert group, a consensus was reached on the performance criteria to assess the predictivity of DAs.
The aim of this article was to assess the performance of DAL-1 and DAL-2 for eye hazard identification to distinguish between the three UN GHS categories based on the target values agreed upon by the OECD expert group. In addition, it is the first time that class-specific performance metrics (sensitivity, specificity, and balanced accuracy) based on a one-versus-all other classes approach were provided for each DA. 12 To gain further insight in explaining the performance in the context of the applicability domain of the individual DAs, the predictivity was also assessed based on the drivers of classification and by the organic functional group (OFG).
Materials and Methods
Data sources
The set of reference chemicals was composed of 173 monoconstituent liquids and 16 liquids tested in dilution (DAL-2 only). The purity of the chemicals should be as high as possible and ideally ≥95%. 9 From the set of neat liquids, 156/173 (90.2%) had a purity of at least 95% and 164/173 (94.8%) had a purity of at least 90%. For the chemicals that were tested in dilution, 13/16 (81.3%) liquids had a purity of at least 95% for the neat material. The set of liquids covered a broad range of chemical classes, industrial uses, and OFGs (79 different OFGs) defined according to OECD QSAR Toolbox analysis (version 3.2; www.oecd.org/chemicalsafety/risk-assessment/theoecdqsartoolbox.htm).
The distribution of the reference chemicals by UN GHS category is provided in Table 1. The individual test substances are listed in the Supplementary Data. Details on the data sources of the different components of the DAs (RhCE, STE, BCOP LLBO, and physicochemical properties) and the Draize eye test reference data are published by Alépée et al.2,3
Distribution of the Reference Chemicals
n/n (n): number of neat liquids tested with DAL-1 with VRM1/DAL-1 with VRM2 (number of liquids tested in common).
EIT, eye irritation test; HCE, human corneal epithelium; UN GHS, United Nations Globally Harmonized System of Classification; VRM1, validated reference method—EpiOcular™ EIT; VRM2, validated reference method—SkinEthic™ HCE EIT.
Evaluation of the performance of the DAs
The performance of each DA was assessed by comparing the prediction results with the classification based on historical in vivo Draize eye test data. For each chemical, the predicted class was obtained by considering all available results of each in vitro test method. This resulted sometimes in discordant predictions for a chemical and, therefore, a weighted calculation approach was used so that all chemicals had the same weight (weight of 1). Consider, for example, the prediction results for methyl cyanoacetate (CASRN 105-34-0) with DAL-2. For this liquid, two BCOP LLBO results were available, both having an opacity <145, and, therefore, the final prediction is based on the STE test method. The STE resulted two times in a No Cat. prediction and two times in No prediction can be made for which a Cat. 2 prediction was assigned. The corresponding weights for “No Cat.” and for “Cat. 2” were 0.5 (2/4) and 0.5 (2/4), respectively.
Next, the performance of each DA was assessed based on a confusion matrix, a cross table that reports the predicted classes against the UN GHS classes. For each UN GHS category, the percentage of correct and mispredictions was compared with target values that were discussed and agreed by the OECD expert group on eye/skin irritation/corrosion and phototoxicity for this purpose. Note that the target values were proposed for test substances in general and not explicitly for liquids. The values are reported in Table 2. For overall measure of performance, the balanced accuracy was reported for each DA since it takes imbalances of the data set into account whereas accuracy does not. The balanced accuracy is the average of the proportion of the correct predictions of each category. In addition, class-specific performance metrics (sensitivity, specificity, and balanced accuracy) were calculated.
Performance Metrics for Assessment of the Predictivity of a Defined Approach of Non-Surfactant Liquid Test Substances for Eye Hazard Identification
The values in the table correspond with the minimum values for the correct predictions and maximum values for the mispredictions. Note that within an UN GHS category, the values add up to 100% (e.g., DAL-1 with VRM1, for each UN GHS category the correct and mispredictions add up to 100%).
Details on the calculations were published by Adriaens et al. 12 In brief, the 3 × 3 confusion matrix is reduced into three 2 × 2 matrices using the one-versus-all approach. For example, the class-specific performance of UN GHS No Cat. is calculated based on a 2 × 2 matrix that consists of in vivo No Cat. (true within class) and all other classes (Cat. 1 and Cat. 2, true outside class). As such, sensitivity (true positive rate) is defined as the proportion of correct predictions within the class (e.g., No Cat.), specificity (true negative rate) is defined as the proportion of correct predictions outside the class (e.g., Cat.1 and Cat. 2), and balanced accuracy is the average of sensitivity and specificity.
Note that the terms true positive and true negative are related to the statistical definition and not to the biological effect. Since this may be confusing with respect to the performance metrics as reported in the OECD TGs (TG 437, 491, and 492) that are based on a binary classification (2 × 2 matrix), class-specific sensitivity and specificity were here defined as “true within class” and “true outside class” in the tables, respectively.
The same principle is followed for Cat. 2 versus all others and Cat. 1 versus all others. All analyses were performed with R version 3.6.0. 13
Results and Discussion
Performance of DAL-1 and DAL-2 by UN GHS
The predictive performance considering the three UN GHS categories (Cat. 1, Cat. 2, and No Cat.) of DAL-1 is reported for 94 liquids with VRM1 (Table 3) and for 86 liquids with VRM2 (Table 4). The predictive performance of DAL-2 is reported for 164 liquids (Table 5). Note that results of the BCOP LLBO test method do not exist for 40/55 (DAL-1 with VRM1), 34/46 (DAL-1 with VRM2), and 108/123 (DAL-2) of in vivo No Cat. liquids. As such, it was not possible to identify the final prediction (Cat. 1 or Cat. 2) for in vivo No Cat. liquids that are mispredicted (positive result for RhCE and physicochemical properties exclusion criteria not met for DAL-1 or positive results for STE with DAL-2).
Performance of the DAL-1 Based on Physicochemical Properties, VRM1 (EpiOcular Eye Irritation Test) and Bovine Corneal Opacity and Permeability Laser Light-Based Opacitometer (N = 94 Liquids)
Bold values indicate 69.2% balanced accuracy.
The proportion given is based on weighted calculation that take into account (where they exist) multiple results from an individual information source for a given chemical, and applying a correction factor so that all chemicals had the same weight of 1.
BCOP LLBO data are not available for the majority (40/55) of the in vivo No Cat. liquids, as such, for liquids that were not identified as No Cat. with VRM1, it was not possible to distinguish between Cat. 1 (based on BCOP LLBO) and Cat. 2. Therefore, the false positives are presented between Cat. 1 and Cat. 2.
BCOP, bovine corneal opacity, and permeability; LLBO, laser light-based opacitometer.
Performance of the DAL-1 Based on Physicochemical Properties, VRM2 (SkinEthic Human Corneal Epithelium Eye Irritation Test) and BCOP LLBO (N = 86 Liquids)
Bold values indicate 75.2% balanced accuracy.
The proportion given is based on weighted calculation that take into account (where they exist) multiple results from an individual information source, and applying correction factor so that all chemicals had the same weight (weight of 1).
BCOP LLBO data are not available for the majority (40/55) of the in vivo No Cat. liquids, as such, for liquids that were not identified as No Cat. with VRM1, it was not possible to distinguish between Cat. 1 (based on BCOP LLBO) and Cat. 2. Therefore, the false positives are presented between Cat. 1 and Cat. 2.
Performance of the DAL-2 Based on Short Time Exposure and BCOP LLBO (N = 164 Liquids)
Bold values indicate 74.3% balanced accuracy.
The proportion in the tables are based on weighted calculation. For each chemical, all results were taken into account and a correction factor was applied so that all chemicals had the same weight (weight of 1).
BCOP LLBO data are not available for the majority (40/55) of the in vivo No Cat. liquids, as such, for liquids that were not identified as No Cat. with VRM1, it was not possible to distinguish between Cat. 1 (based on BCOP LLBO) and Cat. 2. Therefore, the false positives are presented between Cat. 1 and Cat. 2.
However, it is very unlikely that a large number of FPs will be predicted Cat. 1 by the BCOP LLBO. This assumption is based on BCOP LLBO data that were published by Adriaens et al. 14 In total, BCOP LLBO data were available for 46 in vivo No Cat. chemicals (22 liquids and 24 solids). 14 Only 1/46 (2.2%) chemicals, a solid, was predicted Cat. 1 based on the BCOP LLBO. Assuming that this finding can be generalized, the misprediction rate for in vivo No Cat. predicted as Cat. 1 by the BCOP LLBO is likely to be low (i.e., <1%), knowing that only RhCE positive or STE positive results can be predicted as Cat. 1. For example, for DAL-1 with VRM1 (Table 3), the FP of in vivo No Cat. is 27.9%, assuming that only 2.2% will be predicted Cat. 1 with the BCOP LLBO means that <1% of No Cat. will be predicted Cat. 1.
The balanced accuracy of DAL-1 with VRM1, DAL-1 with VRM2, and DAL-2 was 69.2%, 75.2%, and 74.3%, respectively (Tables 3–5). DAL-1 with VRM1 identified 76.5% of Cat. 1 (N = 17), 59.1% of Cat. 2 (N = 22), and 72.1% of No Cat. (N = 55) correctly. DAL-1 with VRM2 identified 76.5% of Cat. 1 (N = 17), 68.7% of Cat. 2 (N = 23), and 80.4% of No Cat. (N = 46) correctly. DAL-2 identified 81.2% of Cat. 1 (N = 17), 56.3% of Cat. 2 (N = 24), and 85.3% of No Cat. (N = 123) correctly. Independently of the DA applied, these values were always greater than the proposed minimum performance values of 75% for Cat. 1, 50% for Cat. 2, and 70% for No Cat. Regarding the mispredictions, the values were below the target values except for DAL-1 with VRM2 and DAL-2 that show slightly more overpredicted Cat. 2 liquids (30.4% and 30.2%, respectively) as compared with the target value that was set at ≤30%.
Furthermore, the class-specific performance metrics are provided for each DA (Table 6). In general, the within class and outside class performance of Cat. 1 and No Cat. are good resulting in a balanced accuracy that ranges from 82.1% to 89.9%. The class-specific performance of Cat. 2 is lower than the class-specific performance of Cat. 1 and No Cat., the different DAs have a balanced accuracy that ranges from 66.1% to 74.0%.
Class-Specific Performance Metrics
VRM1: EpiOcular™ EIT; VRM2: SkinEthic™ HCE EIT.
Number of liquids with the class/number of liquids outside the class, (n/n).
According to the statistical terminology, sensitivity is defined as the proportion of true membership within class and specificity is defined as the proportion of true membership outside class.
Performance of DAL-1 and DAL-2 by driver of classification
The predictive performance of the individual DAs according to the driver of classification (Cat. 1 and Cat. 2) or according to the subgroups (No Cat.) is presented in Table 7. In both DAL-1 and DAL-2, the BCOP LLBO test method is used to identify chemicals requiring classification for serious eye damage. Although the STE test method can also be used to identify Cat. 1 with DAL-2, the BCOP LLBO is a necessary component of DAL-2, since only 4 out of 17 Cat. 1 liquids were correctly identified with the STE against 13 out of 17 liquids with the BCOP LLBO (Supplementary Data). The STE test method, however, identified one Cat. 1 liquid (CO = 4; CASRN 56-35-9) correctly that was underpredicted with the BCOP LLBO.
Predictive Performance of Defined Approaches According to Driver of Classification (Cat. 1 and Cat. 2) or According to the Subgroups (No Cat.)
VRM1: EpiOcular™ EIT; VRM2: SkinEthic™ HCE EIT.
The proportion in the tables is based on weighted calculation. For each chemical, all results were taken into account and a correction factor was applied so that all chemicals had the same weight (weight of 1).
TN and FP based on RhCE test methods only, so not taking into account the PCP exclusion rules.
Indicates at least one animal with a mean score of days 1–3 above the classification cut-off for at least one endpoint.
FP, false positive; PCP, physicochemical property; RhCE, reconstructed human cornea-like epithelium; TN, true negative.
The underprediction rate for the Cat. 1 drivers of classification CO mean ≥ 3 and CO = 4 was low and ranged from 0% to 16.7%. The underprediction rate for Cat. 1 liquids classified based on CO persistence on day 21 only was 50% with DAL-1 and 44% with DAL-2. The FN rate of 4% with DAL-2 (Cat. 1 predicted as No Cat.) was the result of a discordant prediction with the STE test method for hydroxyethyl acrylate (CASRN 818-61-1) that was predicted FN in one out of five repeat experiments (Supplementary Data). Although the number of liquids for each driver was low, it is known that the BCOP (OP-KIT and LLBO) and STE test methods do not specifically measure persistence/reversibility of ocular tissue effects. 7 It is, therefore, expected that the predictivity for the driver CO persistence on day 21 is less when compared with the drivers CO severity (CO mean ≥ 3 and CO = 4).
The different DAs have a similar correct prediction rate for Cat. 2 liquids classified based on CO mean ≥ 1 (55.9%–62.8%), mispredictions correspond mainly with overpredictions (27.9%–36.1%). For Cat. 2 liquids classified based on conjunctival effects (Conj mean ≥ 2), substantial differences exist between the different DAs (Table 7).
When only the RhCE (VRM1 or VRM2) models were used to identify chemicals that do not require classification for eye irritation or serious eye damage, the FP rate for the No Cat. liquids from the subgroup CO = 0 was low (21.9%–26.5%), whereas this was higher for the subgroup CO >0 (58.3%–100%) and CO >0** (100%). In vivo No Cat. chemicals from the subgroup CO = 0 represent in vivo studies for which CO scores are equal to 0 in all animals and all observed time points, whereas for the subgroup CO >0, CO scores are >0 for at least one observation time in at least one animal. Furthermore, for the subgroup CO >0**, at least one animal had a mean of the scores of days 1–3 above the classification cutoff for at least one endpoint but not in enough animals to generate a classification.
It seems that especially liquids from the subgroups CO >0 and CO >0 ** affect the tissue viability of the RhCE models resulting in an FP. In contrast, some of the FPs are identified correctly as No Cat. based on the physicochemical properties exclusion rules, resulting in a decrease of the FP rate for DAL-1 (13.0%–16.7% for CO = 0, 33.3%–62.5% for CO >0, and 57.1%–60.0% for CO >0 **). Note that the effect of incorporation of the physicochemical properties exclusion rules was most pronounced for the subgroups CO >0 and CO >0 **.
The relationship between CO observed in vivo and cytotoxicity measured with the STE test method (DAL-2) is less pronounced in comparison with the RhCE models, this is shown by the FP rate of 11.0% for CO = 0, 33.3% for CO >0, and 20.8% for CO >0 **. A comprehensive in-depth analysis of the New Chemicals Database (NCD) performed by Cosmetics Europe and EURL ECVAM showed that the vast majority (∼90%) of the in vivo No Cat. liquids belong to the subgroup CO = 0 (Adriaens et al.). 15 Note that the NCD is expected to represent the true distribution of the UN GHS classes and drivers/subgroups since the database contains data on “New Chemicals” notified under Directive 67/548/EEC and introduced to the EU industrial market after September 1981 (Adriaens et al.). 15 It is, therefore, important to note that the performance of the different DAs is highest for the subgroup CO = 0 (> 83%) knowing that the prevalence of this subgroup is high.
Performance of DAL-1 and DAL-2 by OFG
The performance of the different DAs by OFG was only provided for liquids with an alcohol, ether, or carboxylic acid ester group. For these groups, results of at least 11 liquids were available (Table 8), whereas the number of liquids represented by the other OFGs was too low to draw conclusions with respect to the performances of the DAs. For almost all in vivo Cat. 1 and Cat. 2 liquids belonging to the OFGs given in Table 8, results were available for all DAs. This was not the case for the in vivo No Cat. liquids for which the number of test substances per OFG differs between the Das, and the set of liquids is not per se the same (especially for the alcohol and ether groups).
Predictive Performance of Defined Approaches According to the Organic Functional Group
VRM1: EpiOcular™ EIT; VRM2: SkinEthic™ HCE EIT.
TN and FP based on RhCE test methods only, so not taking into account the PCP exclusion rules.
The performance for the in vivo Cat. 1 and Cat. 2 liquids with an alcohol function was similar for the different DAs with a small majority being correctly predicted. The Cat. 1 and Cat. 2 liquids with an alcohol function were mispredicted based on the BCOP LLBO, three were underpredicted (cyclohexanol, CASRN 108-93-0; 1-chloroctan-8-ol, CASRN 23144-52-7; benzyl alcohol, CASRN 100-51-6) and five were overpredicted (cyclopentanol, CASRN 96-41-3; propasol solvent P, CASRN 1569-01-3; allyl alcohol, CASRN 107-18-6; iso-propanol, CASRN 67-63-0; glycolic acid (10%), CASRN 79-14-1). DAL-2 shows the best performance for in vivo No Cat. liquids with an alcohol function, 14.0/16 liquids were correctly identified whereas DAL-1 with VRM1 and DAL-1 with VRM2 identified 2.0/6 and 5.6/8 liquids correctly, respectively.
Note that there is one alcohol (2,2-dimethyl-3-pentanol, CASRN 3970-62-5) that was irritant with both RhCE methods but that was predicted No Cat. based on the physicochemical exclusion rules (step 1 in DAL-1, Figs. 1 and 2). The performance of the DAs with respect to liquids with an ether function differs. The only in vivo Cat. 1 liquid (methoxyethyl acrylate, CASRN 3121-61-7) was correctly predicted with each DA based on the BCOP LLBO. The results for the in vivo Cat. 2 liquids (same three chemicals) were different for the DAs. For the in vivo No Cat. liquids with an ether function, the best performance was observed for DAL-2 (18/20 true negatives [TNs]), followed by DAL-1 with VRM2 (6.6/10 TNs) and DAL-1 with VRM1 (3.2/7 TNs). Liquids with a carboxylic acid ester function is the group with most accurate predictions for the different UN GHS categories.
The impact of the physicochemical exclusion rules on liquids with a carboxylic acid ester function was very important for DAL-1, resulting in a correct prediction rate of at least 71% (5.0/7 correctly predicted, DAL-1 with VRM2). For this OFG, the RhCE test methods resulted in three (VRM1) and four (VRM2) FPs, which were correctly identified when applying DAL-1 since the physicochemical exclusion rules were met for those liquids.
Conclusions
Cosmetics Europe developed two DAs for eye hazard identification for non-surfactant liquid test substances. The performance of the DAs to distinguish between the three UN GHS categories was compared against predefined minimum performance values proposed by Cosmetics Europe to the OECD expert group on eye/skin irritation/corrosion and phototoxicity and agreed upon by the experts. DAL-1 is a combination of physicochemical properties exclusion rules, RhCE test methods (OECD TG 492), and the BCOP LLBO test method (OECD TG 437). Based on a set of 86–96 neat non-surfactant liquids, a balanced accuracy of 69.2%–75.2% was reported. Furthermore, DAL-1 identified 76.5% of Cat. 1 (N = 17), 59.1%–68.7% of Cat. 2 (N = 22–23), and 72.1%–80.4% of No Cat. (N = 46–55) correctly.
DAL-2 combines the STE and BCOP LLBO test method (OECD TG 491, TG 437) and resulted in a balanced accuracy of 74.3% (N = 164 liquids). DAL-2 identified 81.2% of Cat. 1 (N = 17), 56.3% of Cat. 2 (N = 24), and 85.3% of No Cat. (N = 123) correctly. The percentage of correct predictions for each DA was greater than the proposed minimum values for correct predictions of 75% for Cat. 1, 50% for Cat. 2, and 70% for No Cat. Regarding the drivers of Cat. 1 and Cat. 2 classification, liquids that were classified in vivo based on CO severity (Cat. 1: mean CO ≥3 or CO = 4; Cat. 2: mean CO ≥1) were mostly correctly predicted with the DAs. Furthermore, No Cat. liquids from the subgroup CO = 0 had the highest predictivity.
In conclusion, DAL-1 and DAL-2 have shown to successfully distinguish between the three UN GHS categories for eye hazard identification of non-surfactant liquids. Both DAs were submitted to support OECD acceptance, and currently an OECD draft guideline is under review to support regulatory acceptance.
Footnotes
References
Supplementary Material
Please find the following supplemental material available below.
For Open Access articles published under a Creative Commons License, all supplemental material carries the same license as the article it is associated with.
For non-Open Access articles published, all supplemental material carries a non-exclusive license, and permission requests for re-use of supplemental material or any part of supplemental material shall be sent directly to the copyright owner as specified in the copyright notice associated with the article.