
Abstract
Abstract
Introduction:
Developed by Advanced Cell Diagnostics, RNAscope® in situ hybridization technology enables detection of a target RNA in a cell-specific manner on formalin-fixed paraffin-embedded tissue sections and represents a good alternative to immunohistochemistry. The goal of this work is to illustrate an optimized protocol of the RNAscope technology to detect target genes in various human organotypic culture models (nasal, small airway, and gingival). These culture models retain the three-dimensional structure of native epithelium, mimic in vivo morphology and human physiology, and can be used as alternative sources to animal testing.
Materials and Methods:
After fixation and processing of five replicates of the three different organotypic cell cultures, the tissue morphology was checked by hematoxylin and eosin staining. The RNAscope protocols were optimized based on three crucial parameters: heat pretreatment, enzymatic digestion, and signal amplification. Digital images of the RNAscope stained slides were generated using the Hamamatsu NanoZoomer 2.0 slide scanner, and images were quantified using a custom-made plugin on Definiens Tissue Studio software (Definiens AG, Munich, Germany).
Results:
The tissue morphology demonstrates optimum fixation and processing for samples, while the optimized protocol for RNAscope shows preserved RNA with staining on the positive control probe with score ≥2 and no staining on the negative control probe with score <1.
Discussion and Conclusion:
RNAscope combined with organotypic cell cultures is a promising tool to better understand cell-specific RNA expression while implementing 3R (replace, reduce, and refine animal testing) principles.
Introduction
RNAscope® is a novel RNA in situ hybridization (ISH) technology provided by Advanced Cell Diagnostics (ACD) that allows visualization of single RNA molecules in individual cells. The RNAscope technology uses novel probes and an exclusive staining kit that amplifies staining signal while reducing background noise. The technology is compatible with short and degraded RNA available in formalin-fixed paraffin-embedded (FFPE) samples. The staining can be visualized under a standard brightfield microscope.1–4 The RNAscope technology is based on hybridization of a pool of 20 specific “Z” probe pairs targeting 1000 bases of RNA while each pair hybridizes to an ∼50 base pair region of target RNA. The detection is carried out by specific binding of oligonucleotide preamplifier molecules linked to several amplifiers containing multiple chromogenic labels.1,2,4 The Z pair is necessary to bind the preamplifier and generate signals. The preamplifier cannot bind to a single Z probe (nonpaired Z probe); the hybridization of three Z-pair probes is sufficient to obtain a detectable signal. Differently from standard RNA ISH, limited to detecting only highly expressed genes with low sensitivity and specificity,2–5 this target-specific probe design minimizes nonspecific off-target signals, thus resulting in highly specific staining As RNAscope technology virtually works for any gene from any species in any tissue, it has been applied on various biological samples in many fields, including colorectal tumors, 6 cerebellum in neuroscience, 7 lung tissue in developmental biology, 8 or liver in stem cell biology. 9 However, to date, RNAscope has not been used on three-dimensional (3D) organotypic cultures, one of the latest advances in cell culture technology.
Organotypic cultures derived from human primary cells comprise differentiated cells in a 3D organization of cells that better recapitulate the morphological, physiological, and molecular aspects of human tissues.10–16 Human 3D cultures structurally and functionally resemble native tissues and mimic better in vivo physiology in comparison to both two-dimensional culture and in vivo animal model systems. The innovative 3D cell culture technologies (i.e., spheroids, organoids, scaffolds, hydrogels, organs-on-chips, and 3D bioprinting) currently have a significant impact on drug discovery and toxicological assessment.17–21
Herein, we illustrate an optimized protocol for applying the RNAscope ISH technology applied to human organotypic cultures (nasal, small airway, and gingival cultures), previously used for toxicological studies.22–32 In these studies, gene expression alterations specific for each cell type were not assessed. In this regard, RNAscope technology would allow visualization of specific target genes in a single cell within the 3D context.
Here, our goal was to optimize the protocol for fixation and tissue processing to preserve the morphology of 3D cultures and RNA quality. The culture morphology was assessed by hematoxylin and eosin (H&E) staining. The human peptidylprolyl isomerase B (Hs-PPIB) probe was used as a positive control of the RNA detection, and the dihydrodipicolinate reductase (dapB) probe was used as a negative control. Finally, we present a semi-automatic process to quantify the staining using Definiens software.
Our results will open future applications of this technique on 3D organotypic cultures, including the use of this optimized protocol for various preclinical assessments and biomarker identification.
Materials and Methods
Organotypic tissue cell cultures
Organotypic small airway cultures (SmallAir™) and nasal cultures (nasal-MucilAir™) were purchased from Epithelix (Geneva, Switzerland), while the human gingival cultures (EpiGingival™) were purchased from MatTek Corporation (Ashland, MA). Upon arrival, fully differentiated samples were cultured at the air-liquid interface at 37°C (5% CO2, 90% humidity) and grown in Transwell inserts (6.5 mm diameter). The cultures were maintained in 24-well culture plates in their respective culture medium (0.7 mL/well) provided by the supplier, with a medium change every 2 to 3 days, for a maximum of 12 days. The cultures were observed periodically to monitor for changes or contamination. Five replicates per cell culture type were used.
Tissue fixation and processing
Organotypic cultures were washed apically and basolaterally three times in phosphate-buffered saline solution (PBS) followed by fixation in 10% neutral-buffered formalin (NBF) for 24 hours at room temperature. The cell cultures were washed again with PBS for three times after fixation. The fixed cultures were bisected at the midpoint, placed in cassettes, and processed with the Leica ASP300 S Tissue Processor (Leica Biosystems Nussloch GmbH, Nussloch, Germany) on a 12-hour automated schedule that includes dehydration in a graded series of ethanol and xylene and infiltration with melted paraffin (Supplementary Table S1). The two bisected pieces per culture were embedded vertically and in parallel using the MEDITE TES Valida System tissue embedding station (MEDITE GmbH, Burgdorf, Germany), and 5 μm-thick sections were cut using a Leica RM2255 microtome (Leica Biosystems Nussloch GmbH). The cut sections were mounted on Superfrost™ Plus slides (Thermo Fisher Scientific, Waltham, MA) and stained. The gingival culture (EpiGingival) samples were stained with H&E. The small airway (SmallAir) and nasal (nasal-MucilAir) cultures samples were stained with H&E and Alcian blue (Fig. 1A). The morphology of samples was checked by histological assessment under microscope before proceeding to RNAscope staining.
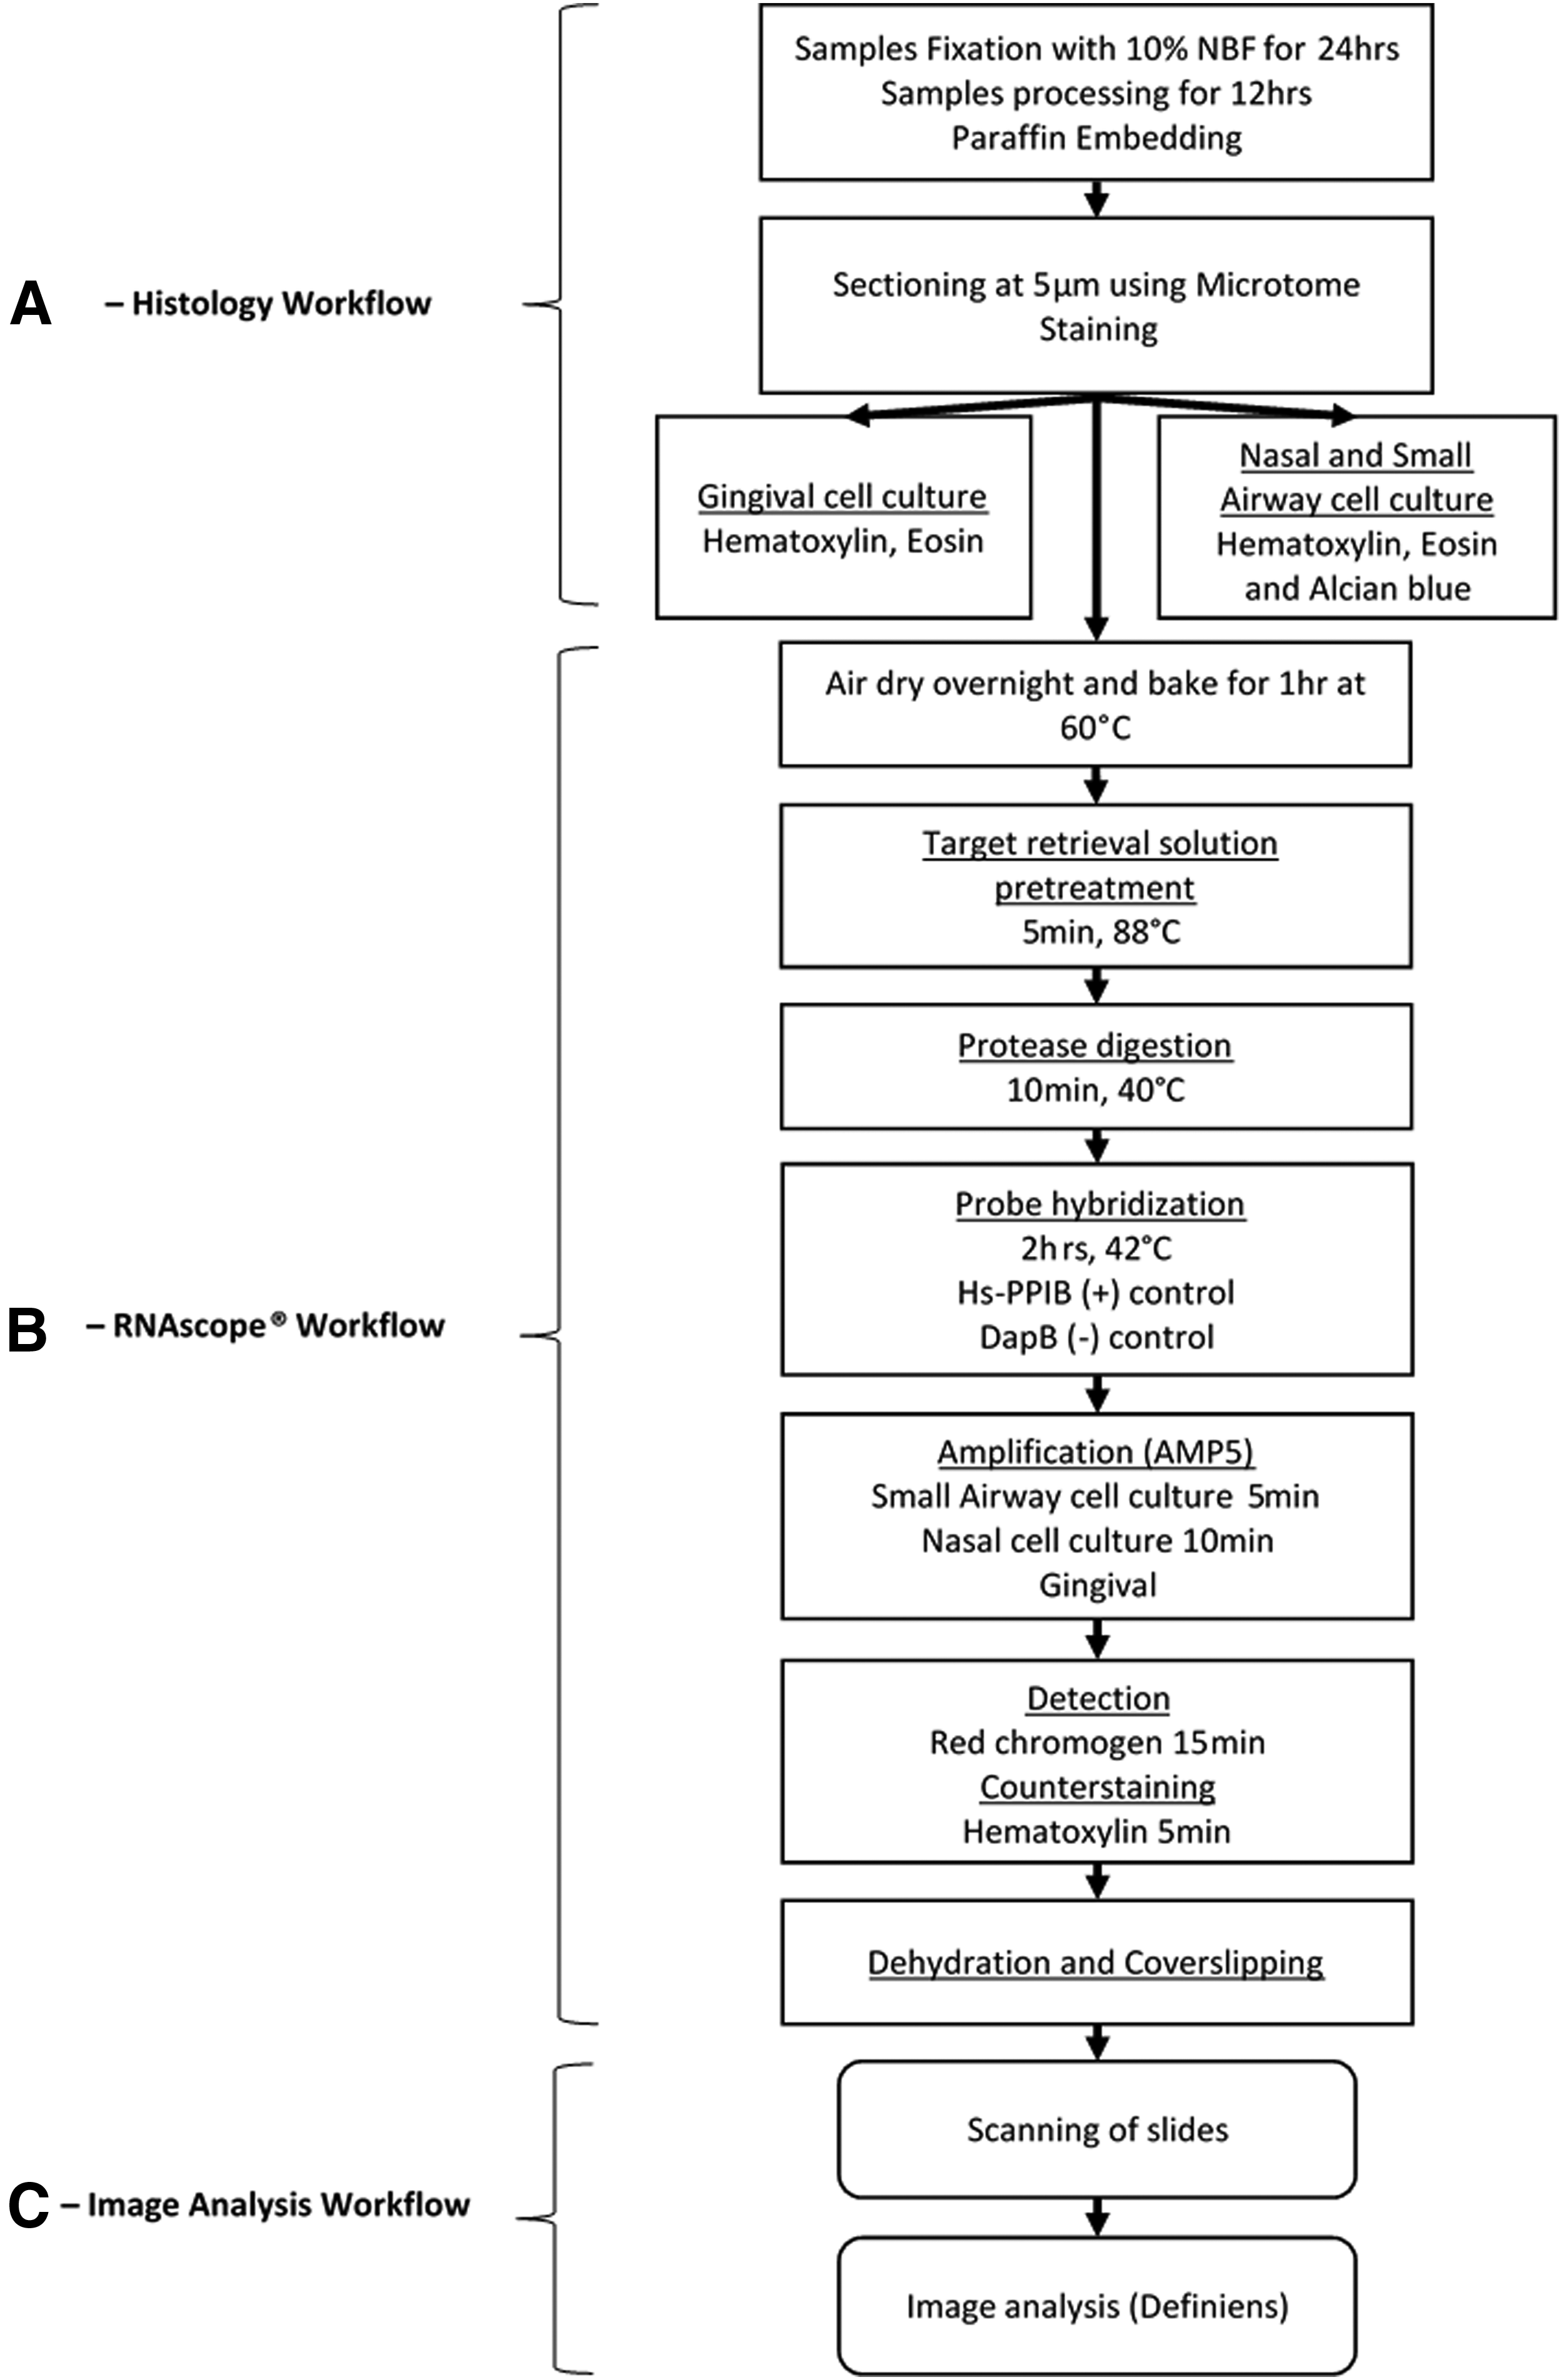
Workflow for the histology and RNAscope® processing. The experimental process is divided into three steps.
RNAscope ISH assay
Automated RNAscope was performed on the Leica BOND RX system (Leica Biosystems Nussloch GmbH) using 2.5 LS Reagent Kit-RED (Cat No. 322150; Advanced Cell Diagnostics, Newark, NJ,). The sections were cut, and slides were dried overnight at room temperature and baked for 1 hour at 60°C in an oven. They were then transferred to the Leica BOND RX for RNAscope staining (Supplementary Table S2).
RNAscope staining protocol using Leica BOND RX
Paraffin was removed from the tissue sections using the Leica BOND Dewax Solution (Leica Biosystems Nussloch GmbH). Subsequently, the slides were treated with BOND Epitope Retrieval Solution 2 (ER 2) (Leica Biosystems Nussloch GmbH) and Protease III (Advanced Cell Diagnostics) to unmask the target RNA. Hydrogen peroxide (4%) was applied on sections to block endogenous peroxidase activity and to prevent nonspecific staining. Hs-PPIB (RNAscope Positive Control Probe—Hs-PPIB; Advanced Cell Diagnostics), a housekeeping gene, was used as a positive control, while dapB (RNAscope Negative Control Probe—dapB; Advanced Cell Diagnostics), a bacterial gene, was used as a negative control. These probes were hybridized for 2 hours at 42°C, and signals were amplified by six amplifiers (sequential hybridization AMP1 to AMP6). The AMP5 amplification is critical at this step, as this additional amplification boost significantly increases the sensitivity of the assay and was therefore adjusted depending on the tissue type. We determined that 5 minutes of AMP5 amplification was optimal for the small airway cultures, 10 minutes was optimal for nasal cultures, and 4 minutes was optimal for gingival cultures. The amplified signal was detected using red chromogen (ready-to-use solution) and counter-stained using hematoxylin (Supplementary Table S2). After the staining was completed, slides were washed with soap and water and dehydrated in an oven for 30 minutes at 60°C. Slides were mounted and coverslipped using the Leica CV5030 automated coverslipper (Leica Biosystems Nussloch GmbH) (Fig. 1B).
RNAscope image analysis
Digital images of the stained slides were generated using the Hamamatsu NanoZoomer 2.0 slide scanner (Hamamatsu Photonics, K.K., Japan) at 40 × magnification. The scanned slide images were quantified using the fit-for-purpose region of interest (ROI) Detection plug-in developed by Definiens (Definiens AG) (Fig. 1C). The plug-in runs on Definiens Tissue Studio (Definiens AG) and performs image analysis automatically. The image analysis was performed using four main steps. The parameters used for specific signal detection are shown in Table 1.
Quantification Parameters for RNAscope Staining for Each Culture Type
ROI detection: the plug-in detected the ROI and separated the noncellular part of the section. Nucleus detection: performed using the color intensity of the hematoxylin stain threshold value and the average size of nuclei. Cell simulation: performed by adjusting the growth from the nuclei size parameter. Spot detection: red spots were detected from the ROI based on size and intensity. Each red spot represents positive staining for RNAscope®.
ROI, region of interest.
Results
The optimal fixation and processing of the 3D organotypic cell culture (SmallAir, MucilAir, and EpiGingival) for RNAscope was determined by testing different fixatives and duration of fixation. We determined that the most appropriate protocol to preserve the architecture of the culture models was 24-hour fixation using 10% NBF followed by 12-hour processing. Using this protocol, the H&E and Alcian blue-stained small airway and nasal cultures displayed pseudostratified structures with dense, well-shaped nuclei located at several levels, similar to the in vivo tissue counterparts. They comprise not only basal and goblet cells but also ciliated cells. The mucus and mucocilliary clearance produced by these cultures and ensured by the coordinated movement of cilia were visible, demonstrating highly preserved morphology (Fig. 2A, B). Gingival cultures stained with H&E showed a well-stratified architecture composed of several keratinocyte layers covered by a cornified layer. In this complex tissue structure, several types of nuclei were observed: they are round in the basement, larger in the middle to finally become small, dense, and pyknotic, characteristic of the keratinization process (Fig. 2C).
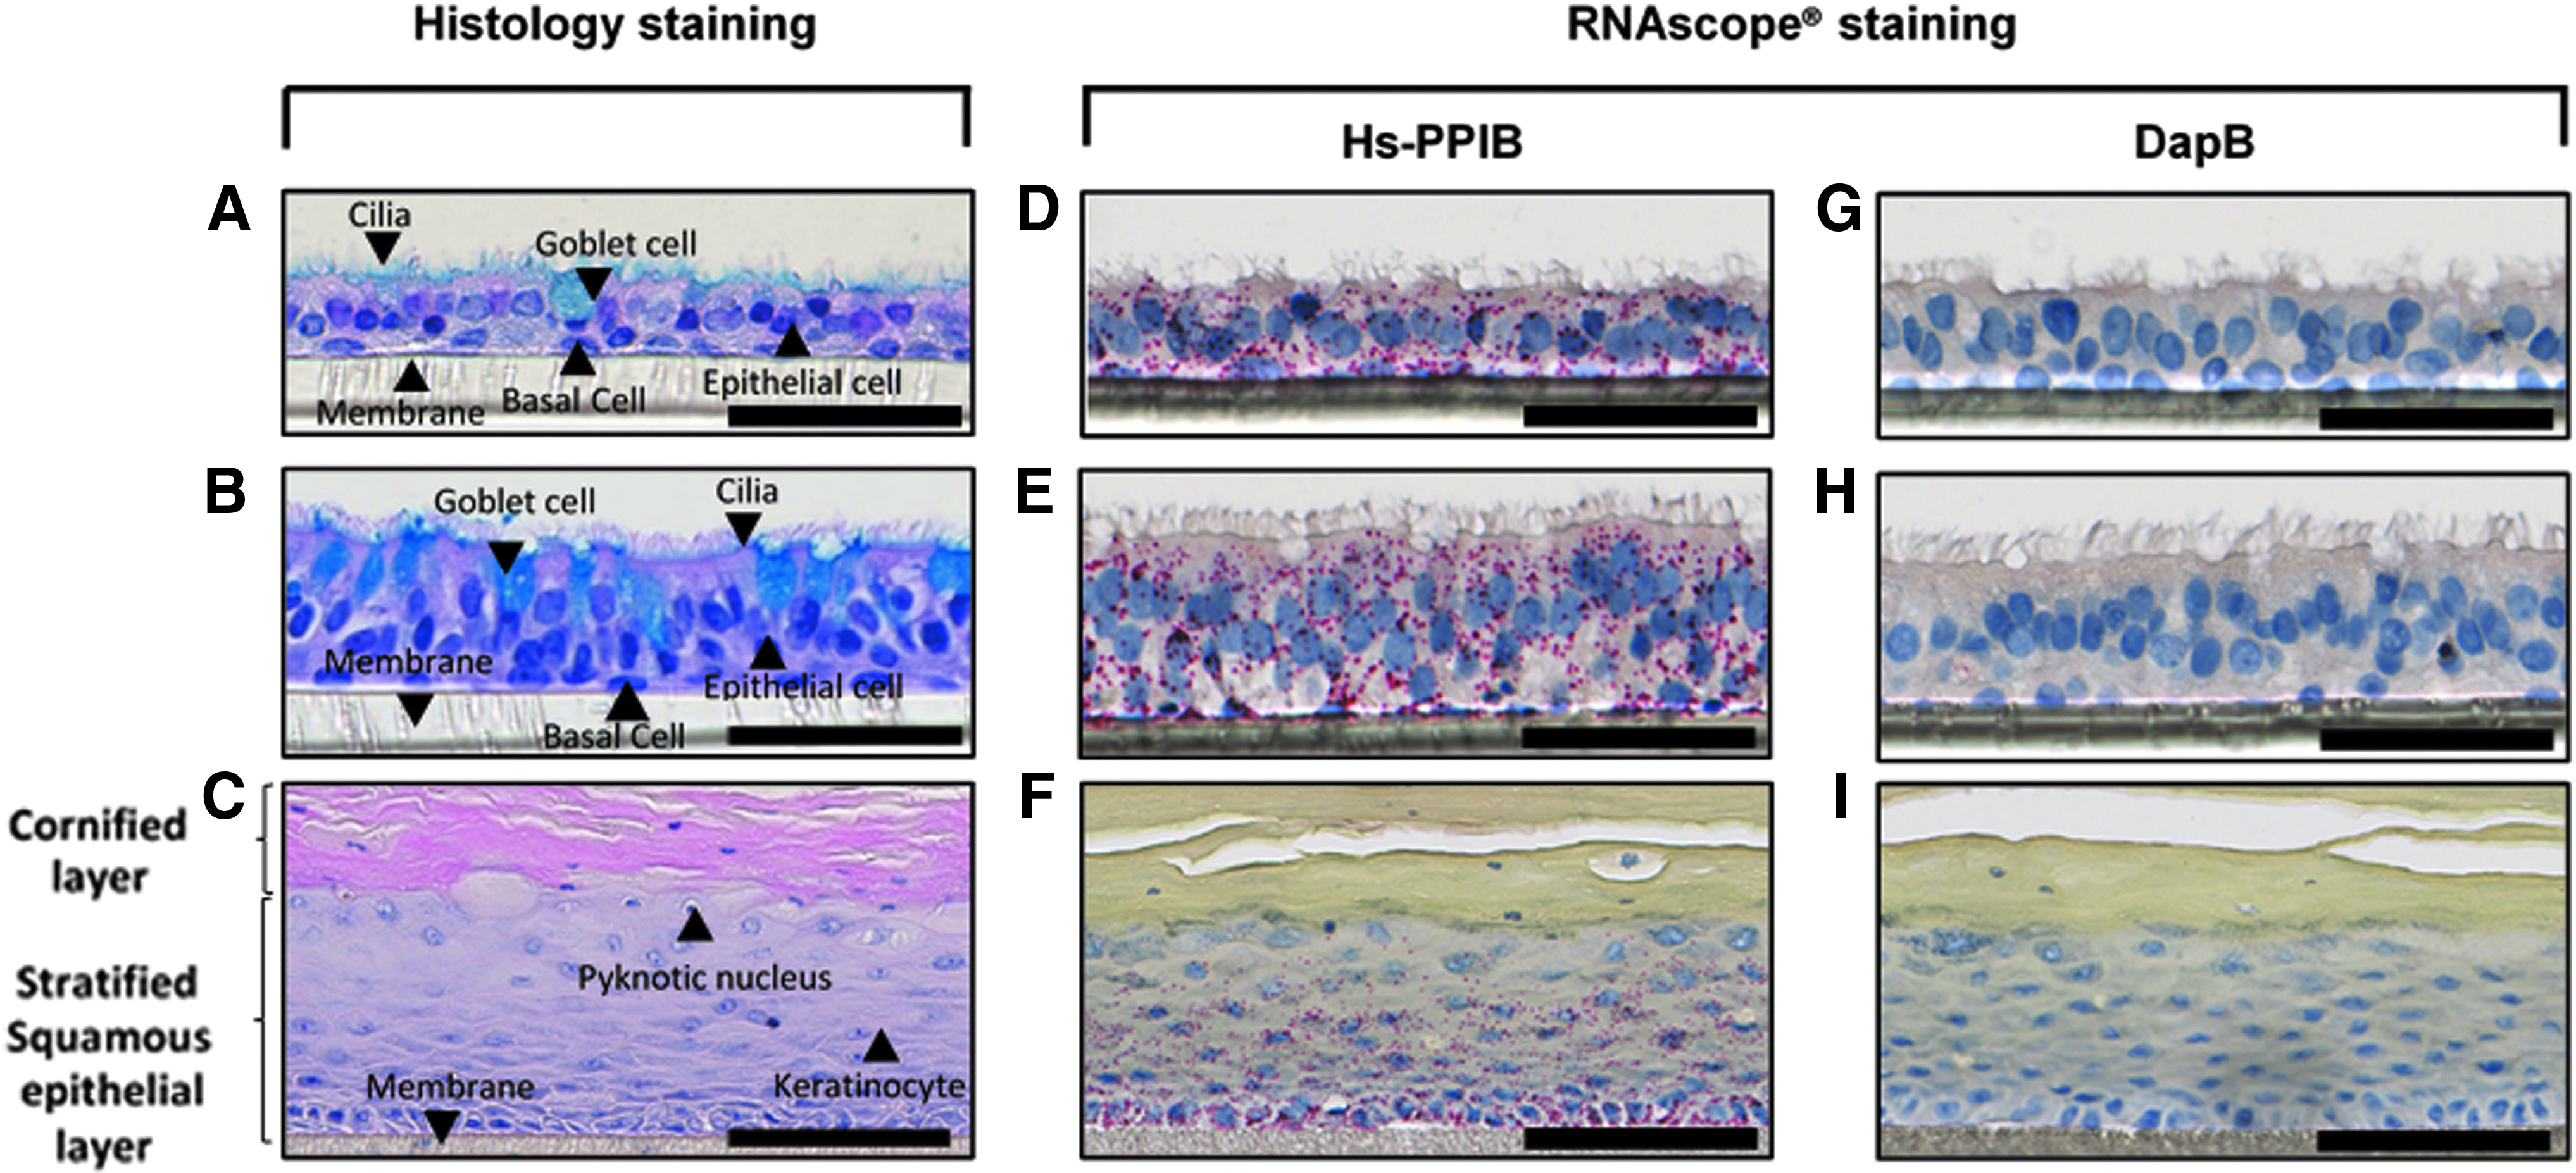
Architecture and cell composition of various organotypic epithelial cultures. Detection of Hs-PPIB and dapB probes in organotypic epithelial cultures. Representative images of the H&E and Alcian blue staining of
Subsequently, the protocol for RNAscope staining was optimized. From the initial microscopic evaluation, strong expression level of the Hs-PPIB positive control probe was observed with absence of background noise (Fig. 2D–F). In addition, no expression of the dapB negative control probe was observed in all culture types (Fig. 2G–I). The five replicate samples of each organotypic cell culture showed uniform marked red spots.
The slides obtained using the optimized protocol were subsequently scanned using the Hamamatsu NanoZoomer 2.0 slide scanner. The digital images were later quantified with Definiens Tissue Studio software. The customized plug-in automatically detected the ROI and separated the noncellular part (insert membrane) in all three culture types (Figs. 3B, 3B′, 4B, 4B′ and 5B, 5B′). The detection of the nucleus was based on the color intensity of the hematoxylin stain threshold and the average size of nuclei (Figs. 3C, 3C′, 4C, 4C′ and 5C, 5C′). To capture the cytoplasm of cells, the area to be analyzed was expanded from each nucleus to a maximum distance (Figs. 3D, 3D′, 3E, 3E′, 4D, 4D′, 4E, 4E′, 5D, 5D′ and 5E, 5E′), previously defined, as stated in Table 1. Finally, the stained dot (Figs. 3A, 3A′, 4A, 4A′ and 5A, 5A′) were detected by adjusting the red color intensity threshold and spot size (Figs. 3F, 3F′, 4F, 4F′ and 5F, 5F′). Results from the quantification were expressed as a score predefined by ACD.
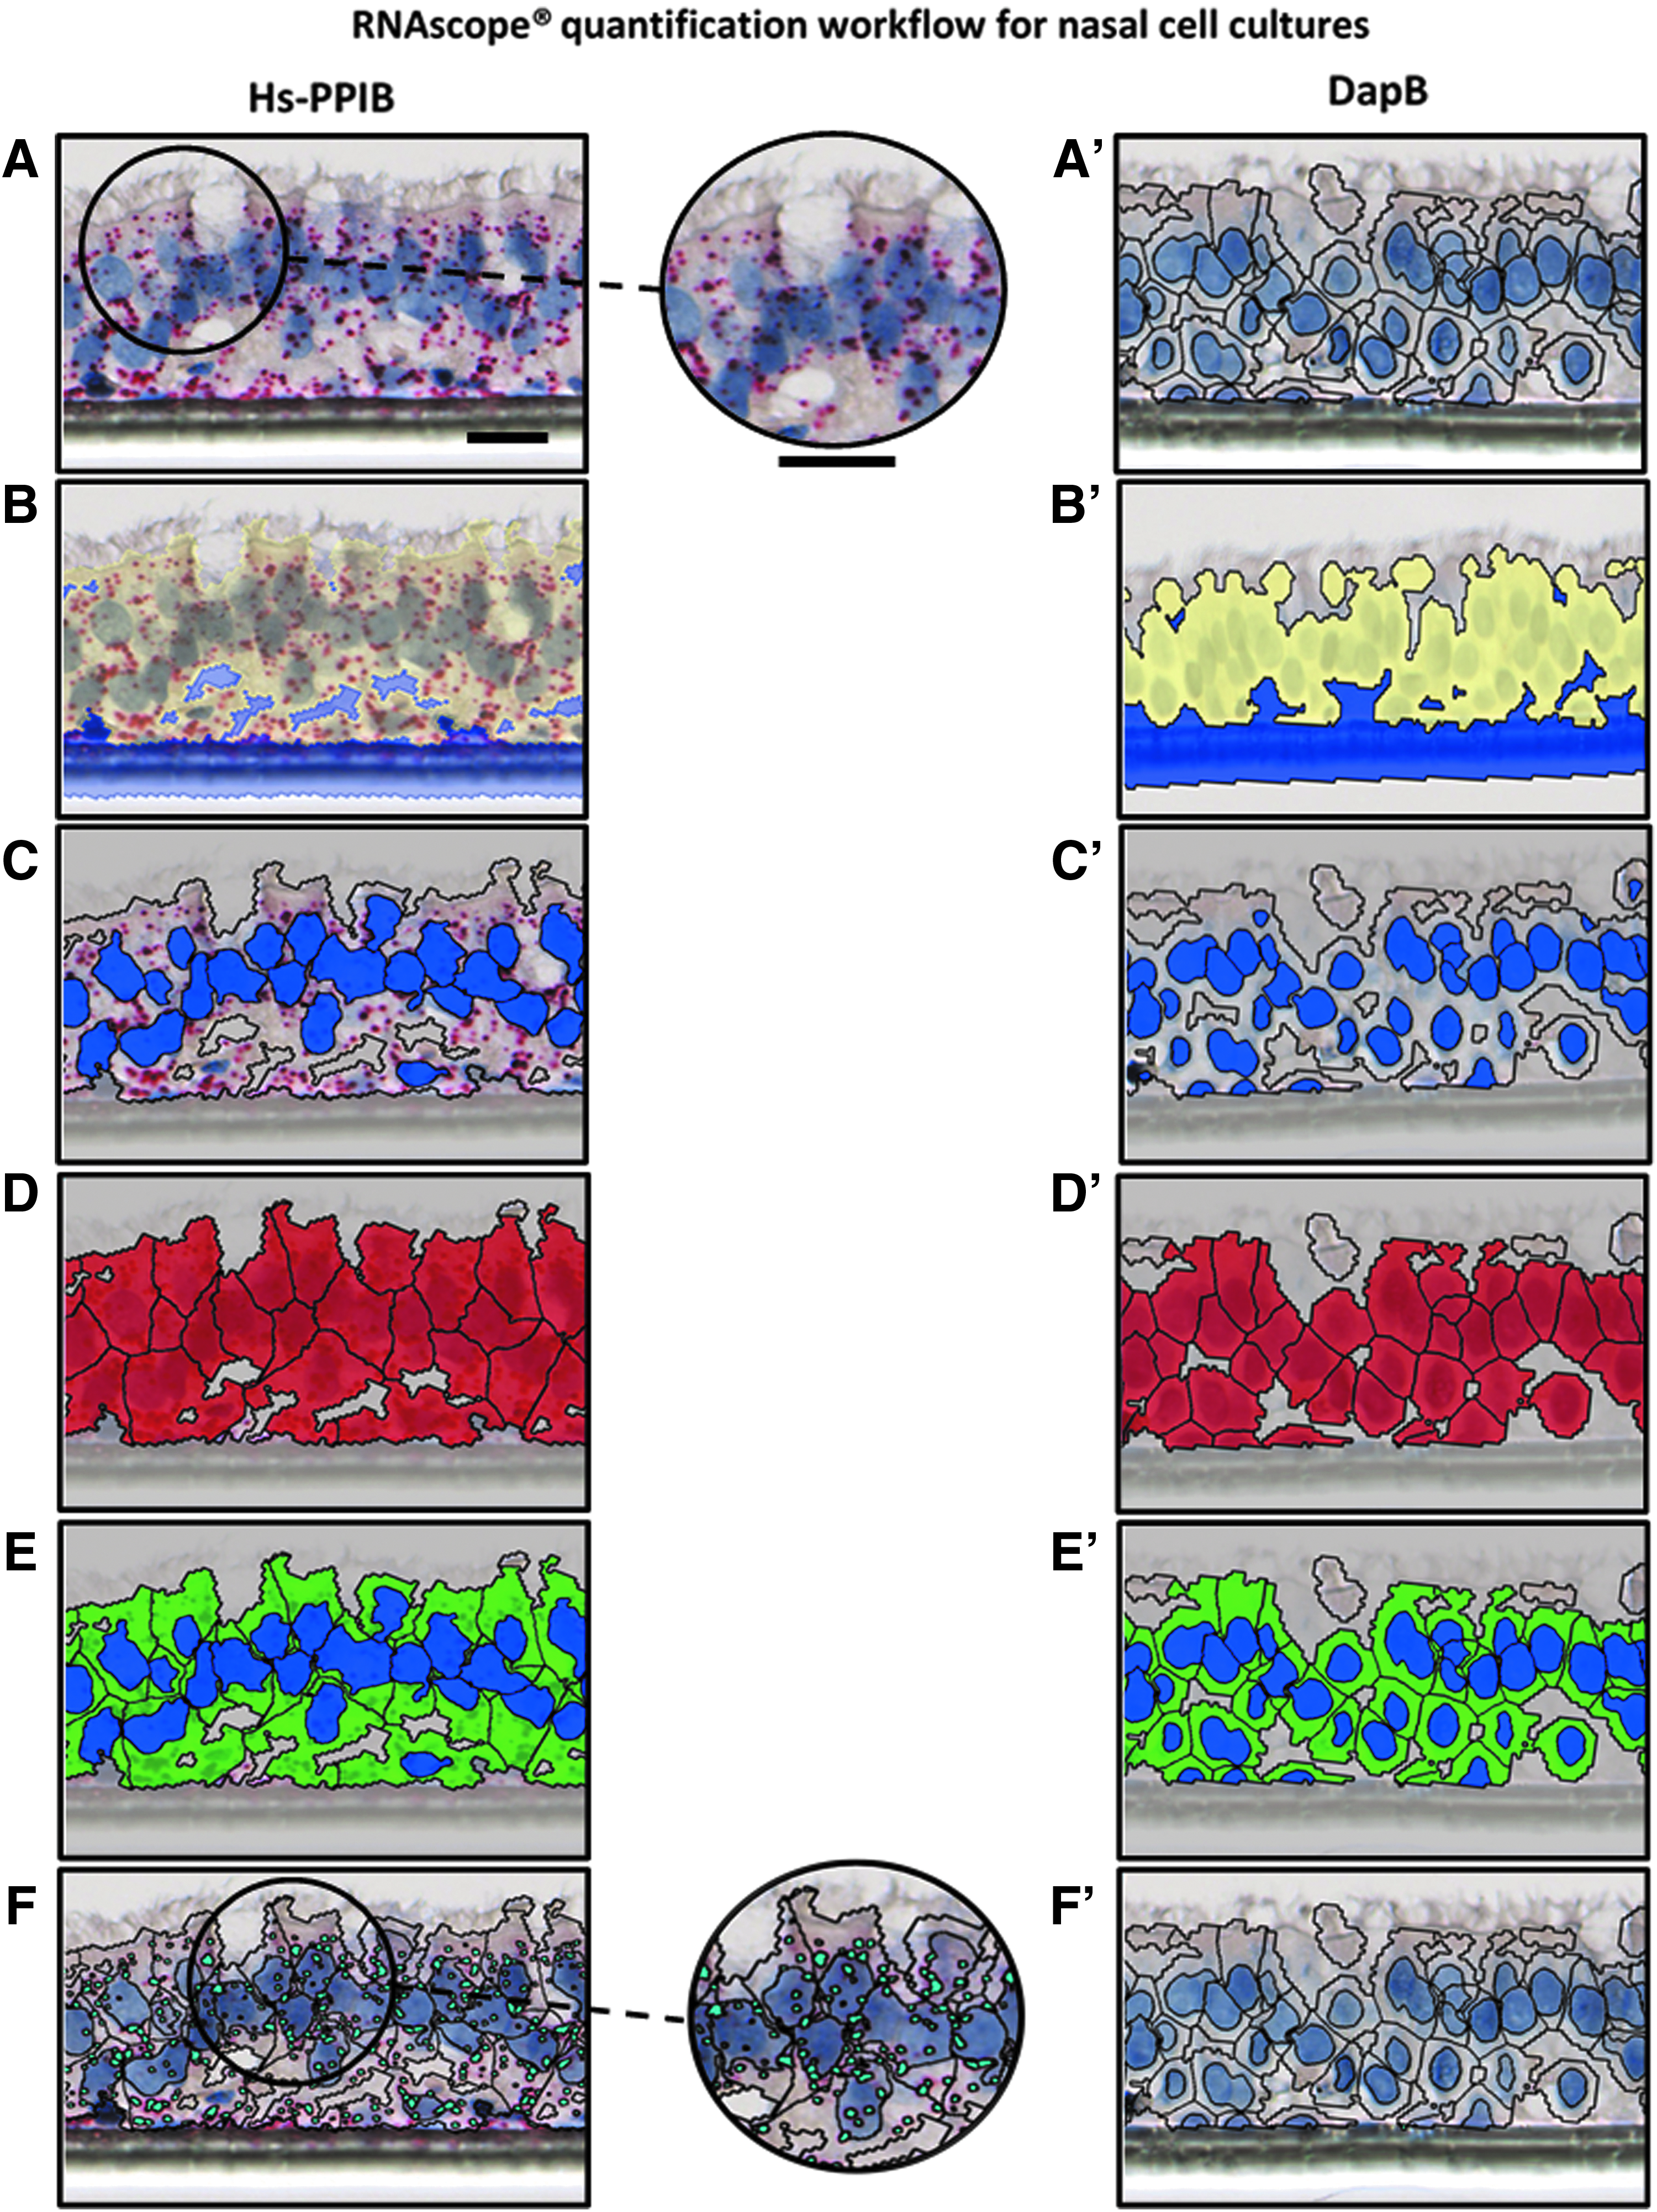
Analysis using Definiens software of Hs-PPIB RNA and dapB RNA stained nasal epithelial culture. (
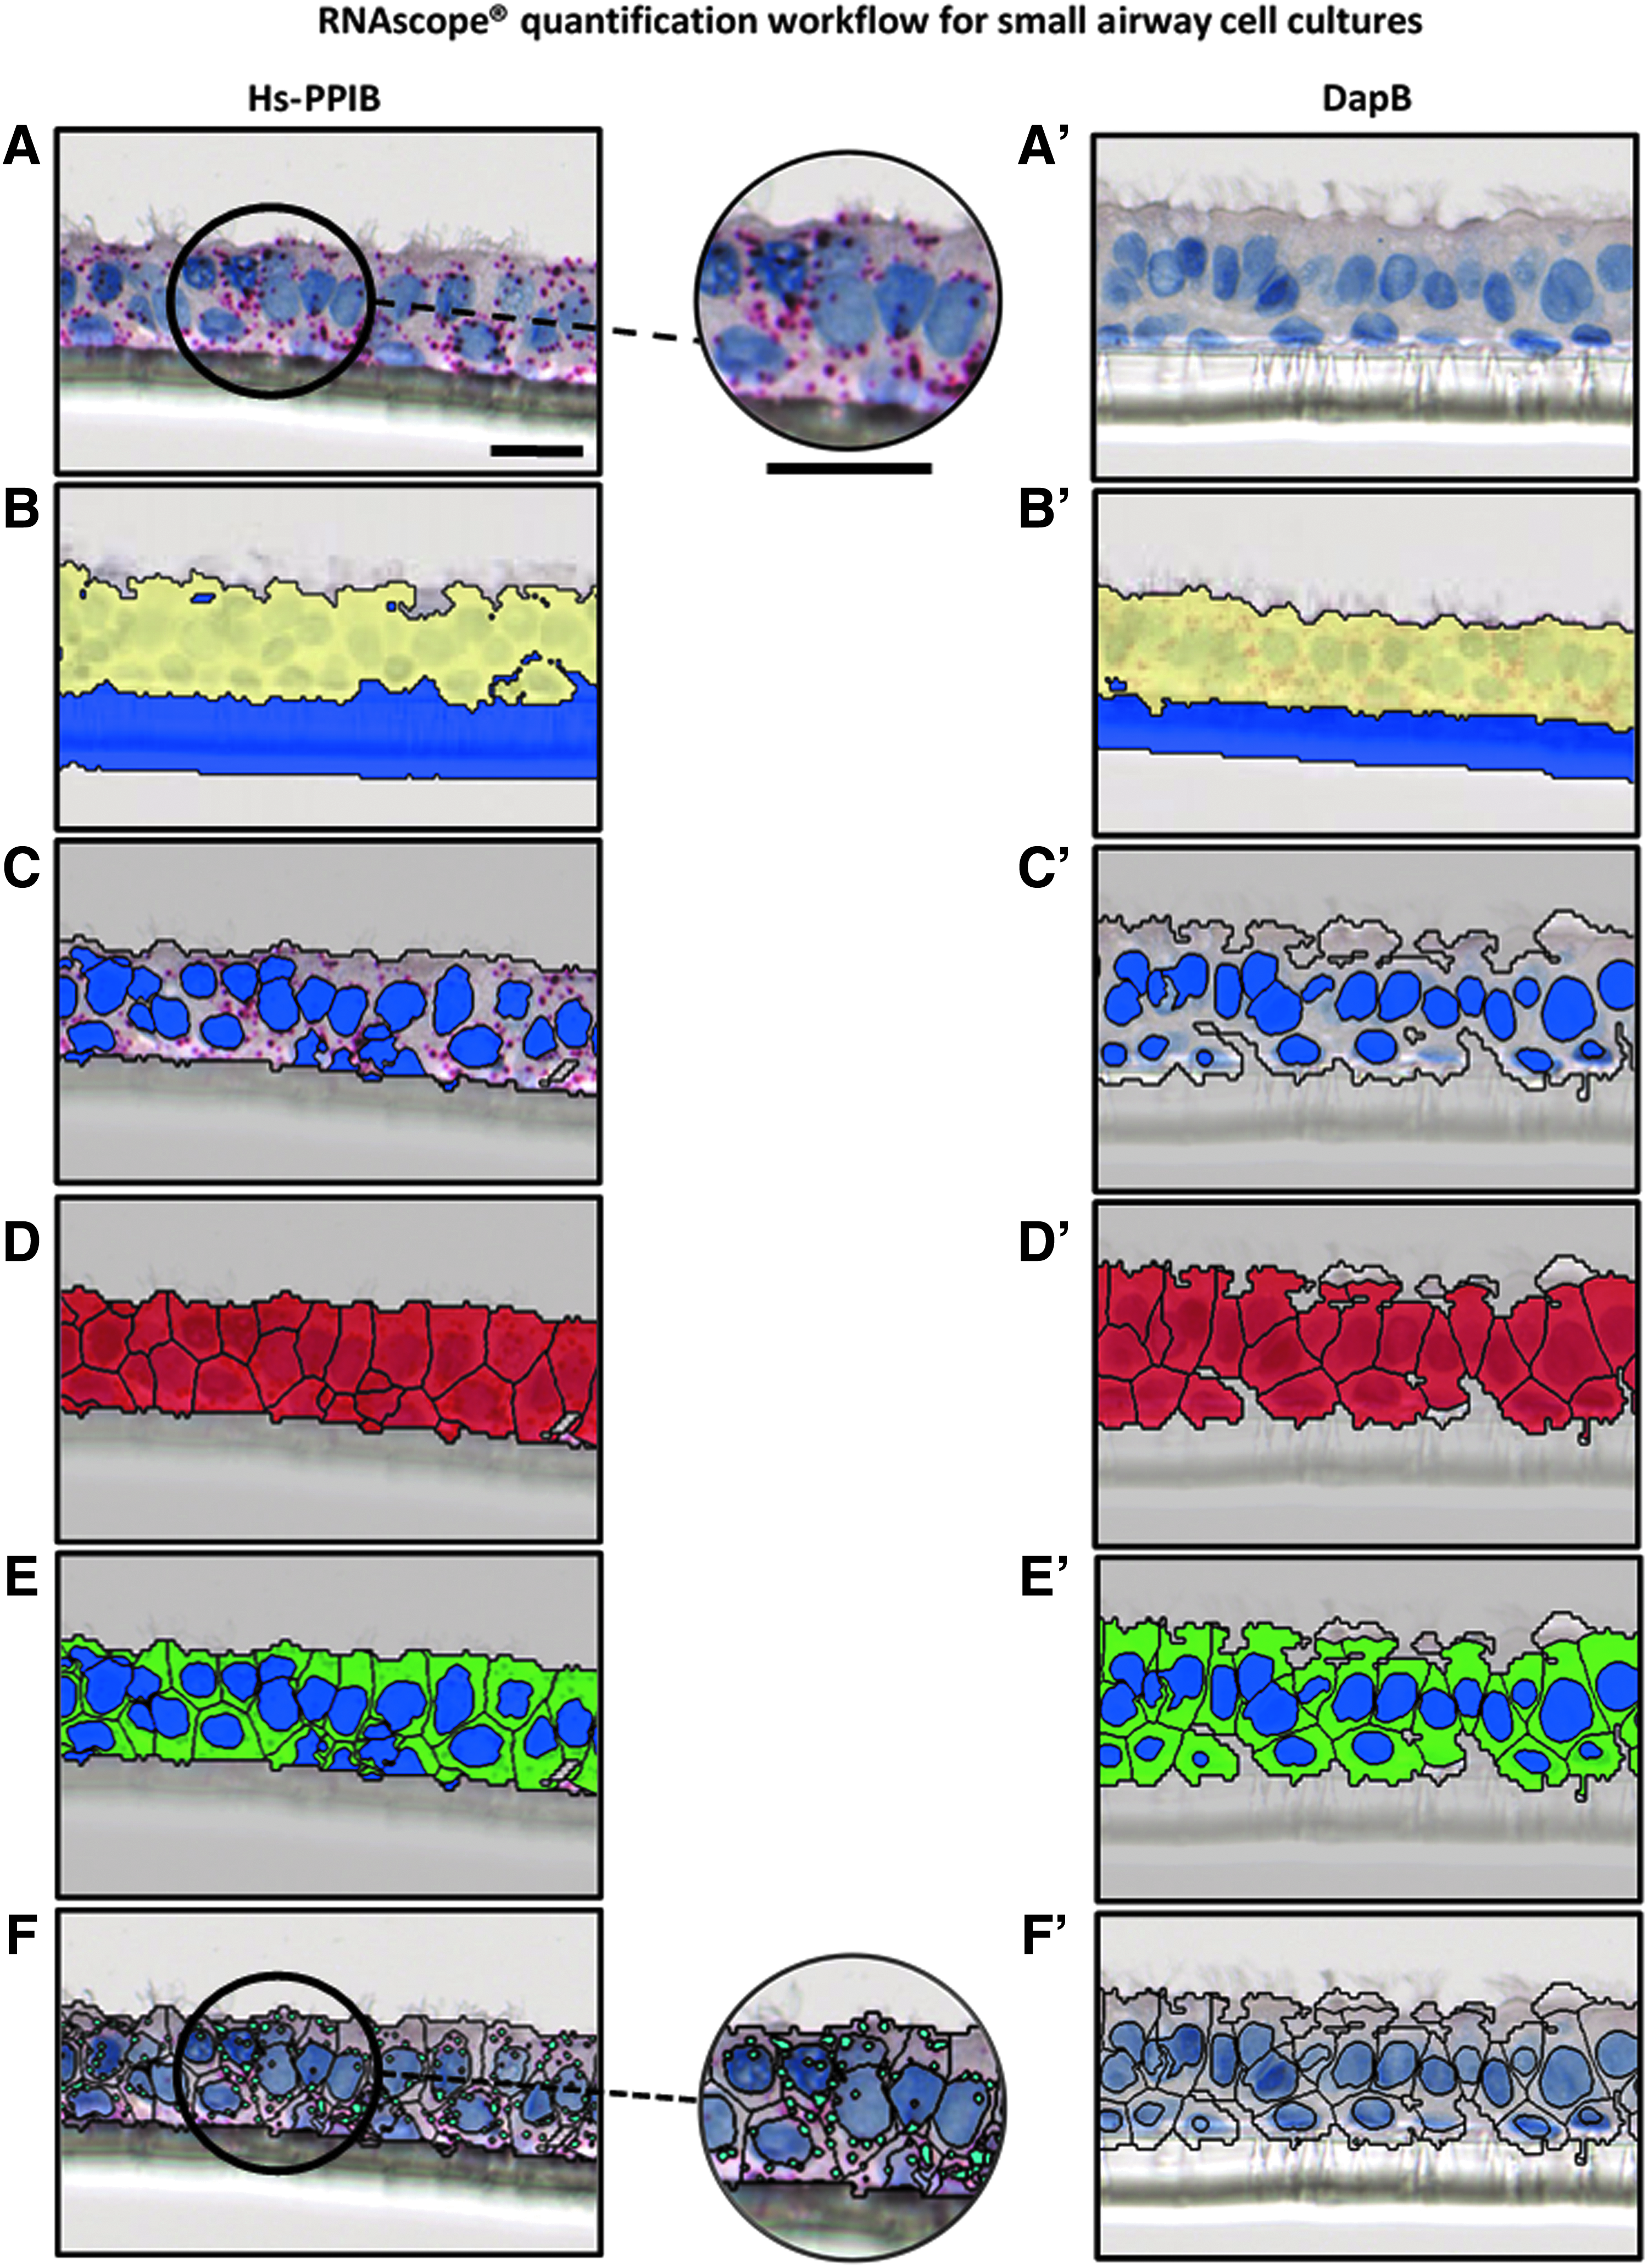
Analysis using Definiens software of Hs-PPIB RNA and dapB RNA stained small airway epithelial culture
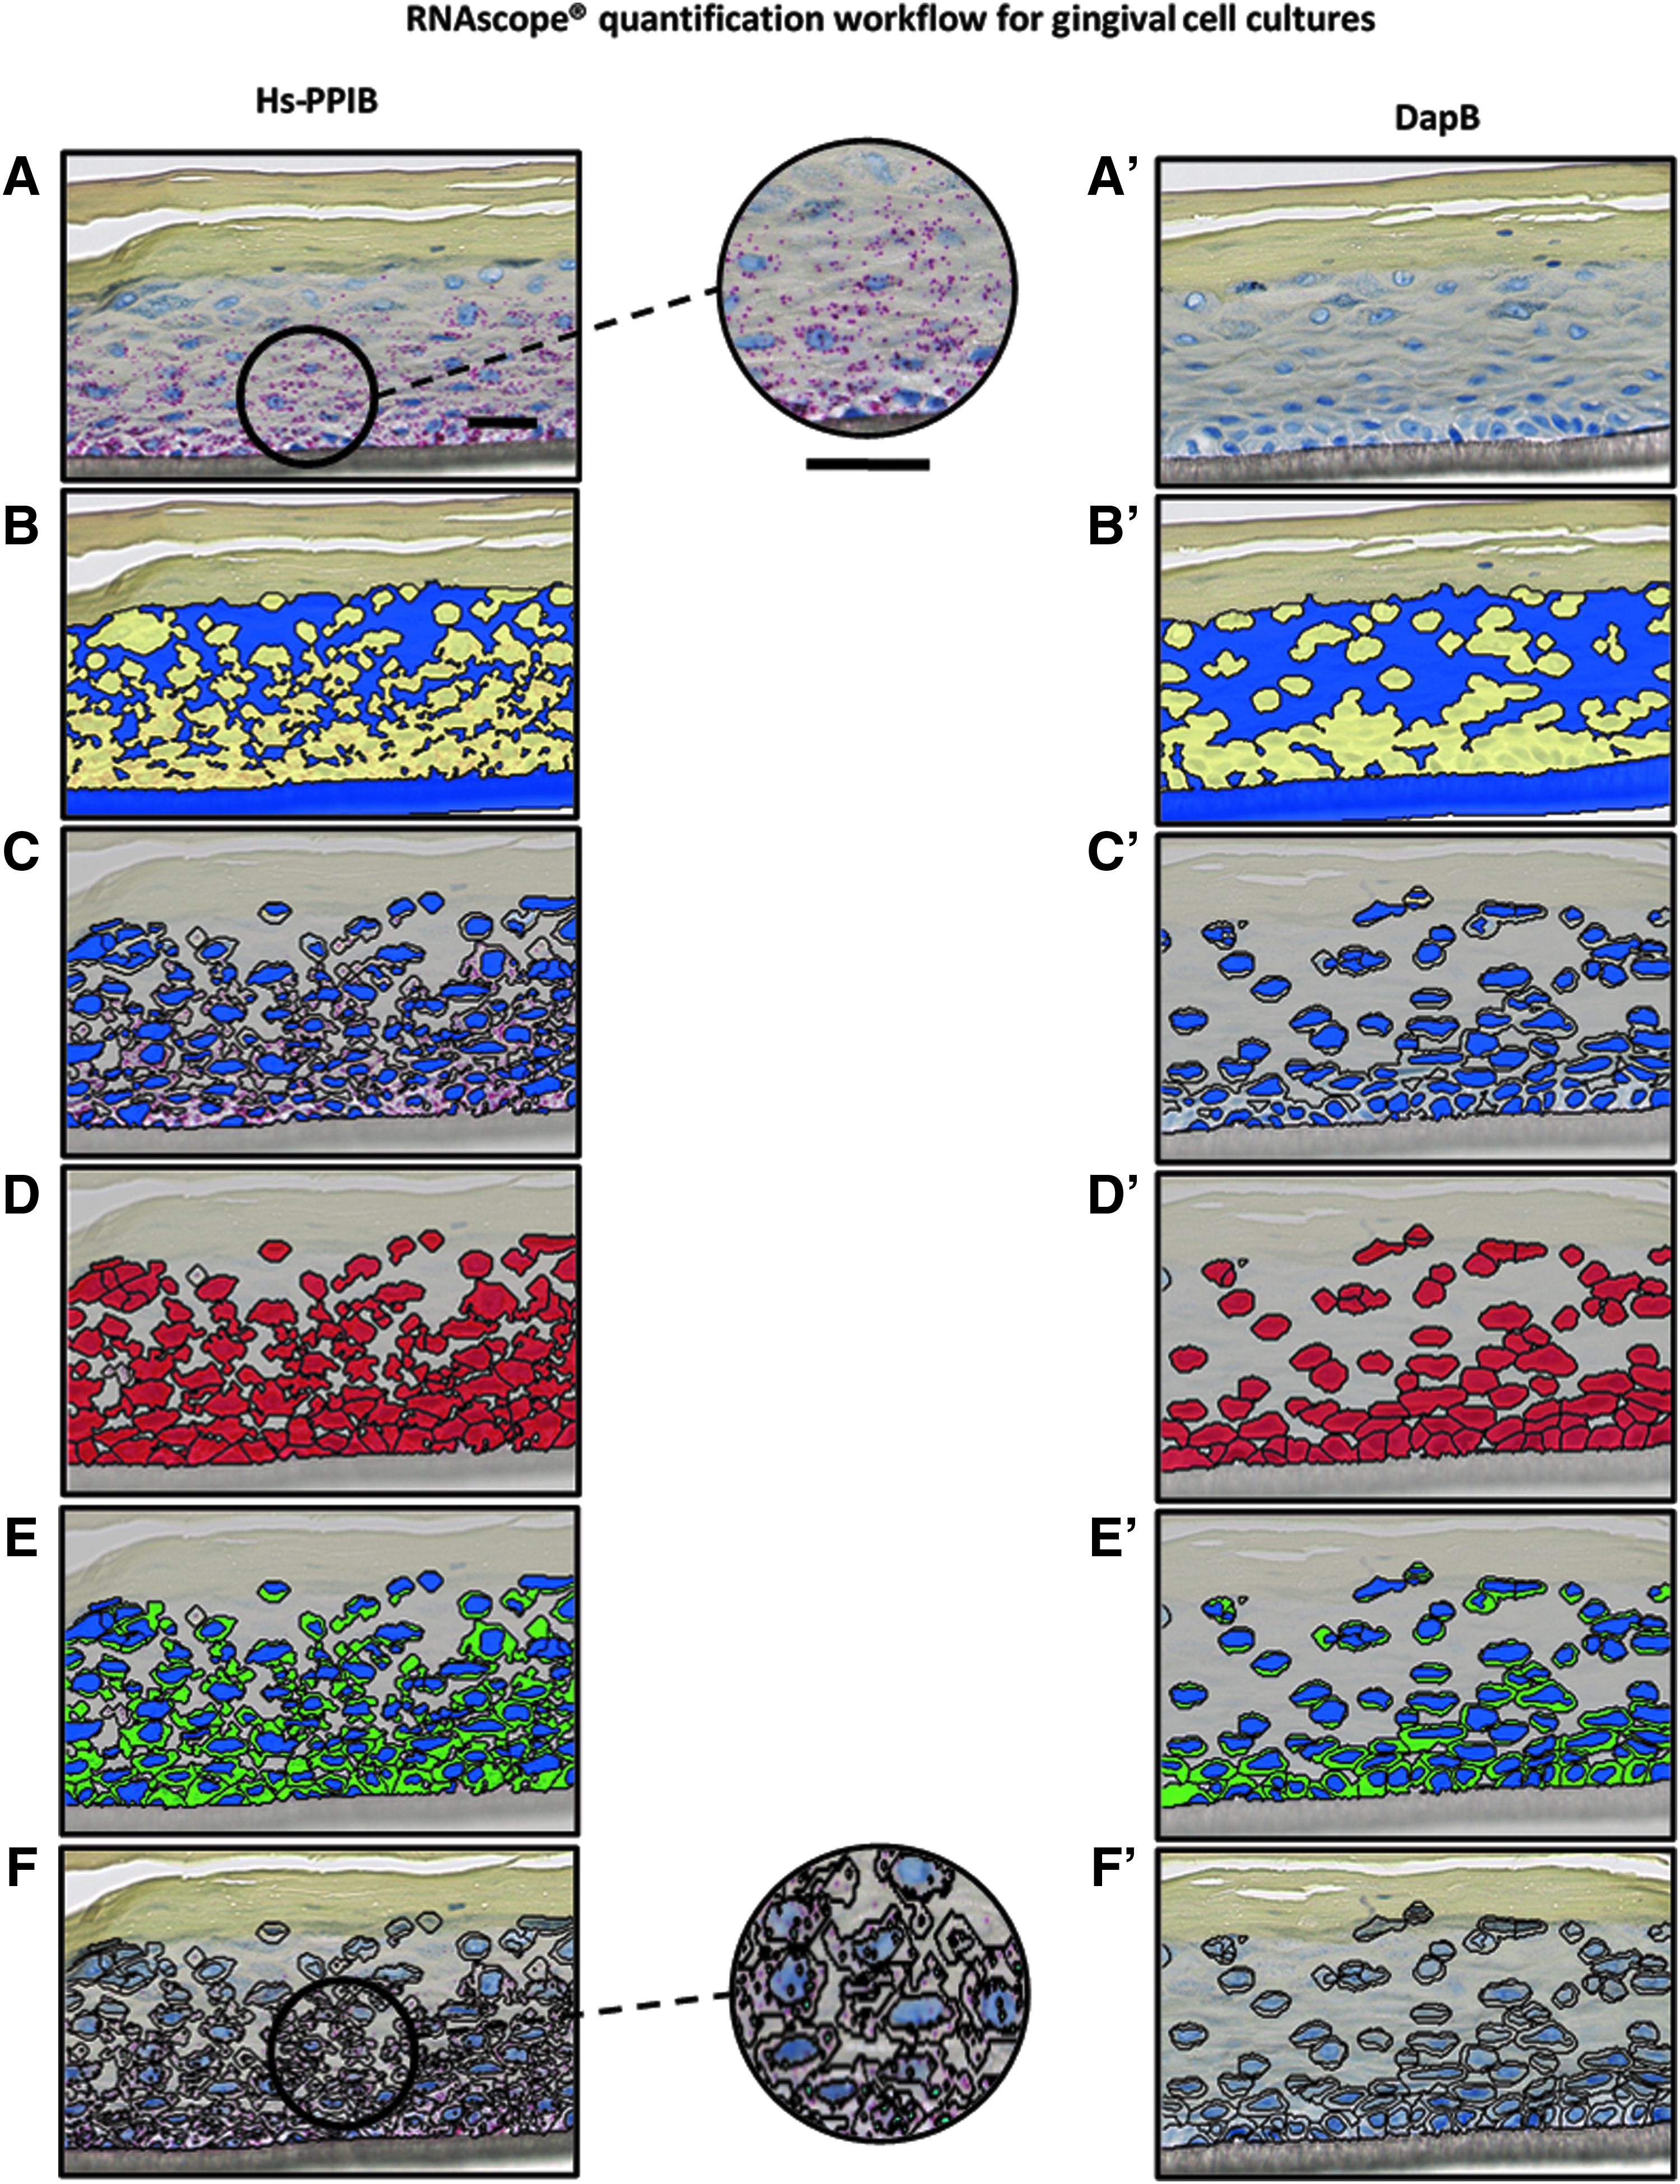
Analysis using Definiens software of Hs-PPIB RNA and dapB RNA stained gingival epithelial culture. (
This scoring of RNAscope was based on the number of spots per cell (Table 2). Successful staining should have a PPIB score ≥2 and a dapB score <1. If <5% of cells score 1 and >95% of cells score 0, a score of 0 will be given. If 5%–30% of cells score 1 and >70% of cells score 0, a score of 0.5 will be given.
Scoring Criteria for RNAscope Staining
Based on this criteria, as shown in Table 3, the analysis confirmed that the fixation and processing protocols were optimal to be used for RNAscope staining. The optimized protocols yielded a specific binding of the probes. Using the Hs-PPIB control probe, samples had an average number of spots per cell well within expected ACD guidelines 4 : in all samples, the Hs-PPIB score was ≥2, and the dapB score was <1.
Hs-PPIB and dapB RNA Expression on Organotypic Samples After RNAscope Quantification of Hs-PPIB and dapB RNA Per Cell (N = 5), Mean Average Spot Number and Score in Nasal, Small Airway, and Gingival Cell Cultures
Descriptively reports two-tailed raw p-values less than 0.05.
The percentage of dapB-stained cells with 0 spots and the percentage of Hs-PPIB-stained cells with more than four spots have been tested to be significantly more than 70% using a one sample t-test.
DapB, dihydrodipicolinate reductase; Hs-PPIB, human peptidylprolyl isomerase B.
Four out of the five nasal culture samples stained with Hs-PPIB probes had 12.75 to 13.37 spots per cell (Fig. 6A), while one sample had 15.46 spots per cell. For small airway cell culture samples, differences were not seen among the five samples tested for both Hs-PPIB (from 9.76 to 10.69 spots per cell) and dapB probes (0.15 to 0.62) (Fig. 6B). For gingival cultures, Hs-PPIB shows 9.02 to 12.15 spots per cell, while 0.36 to 0.55 spots were quantified for dapB probes (Fig. 6C). There was a high reproducibility among the five replicates of each tissue type.
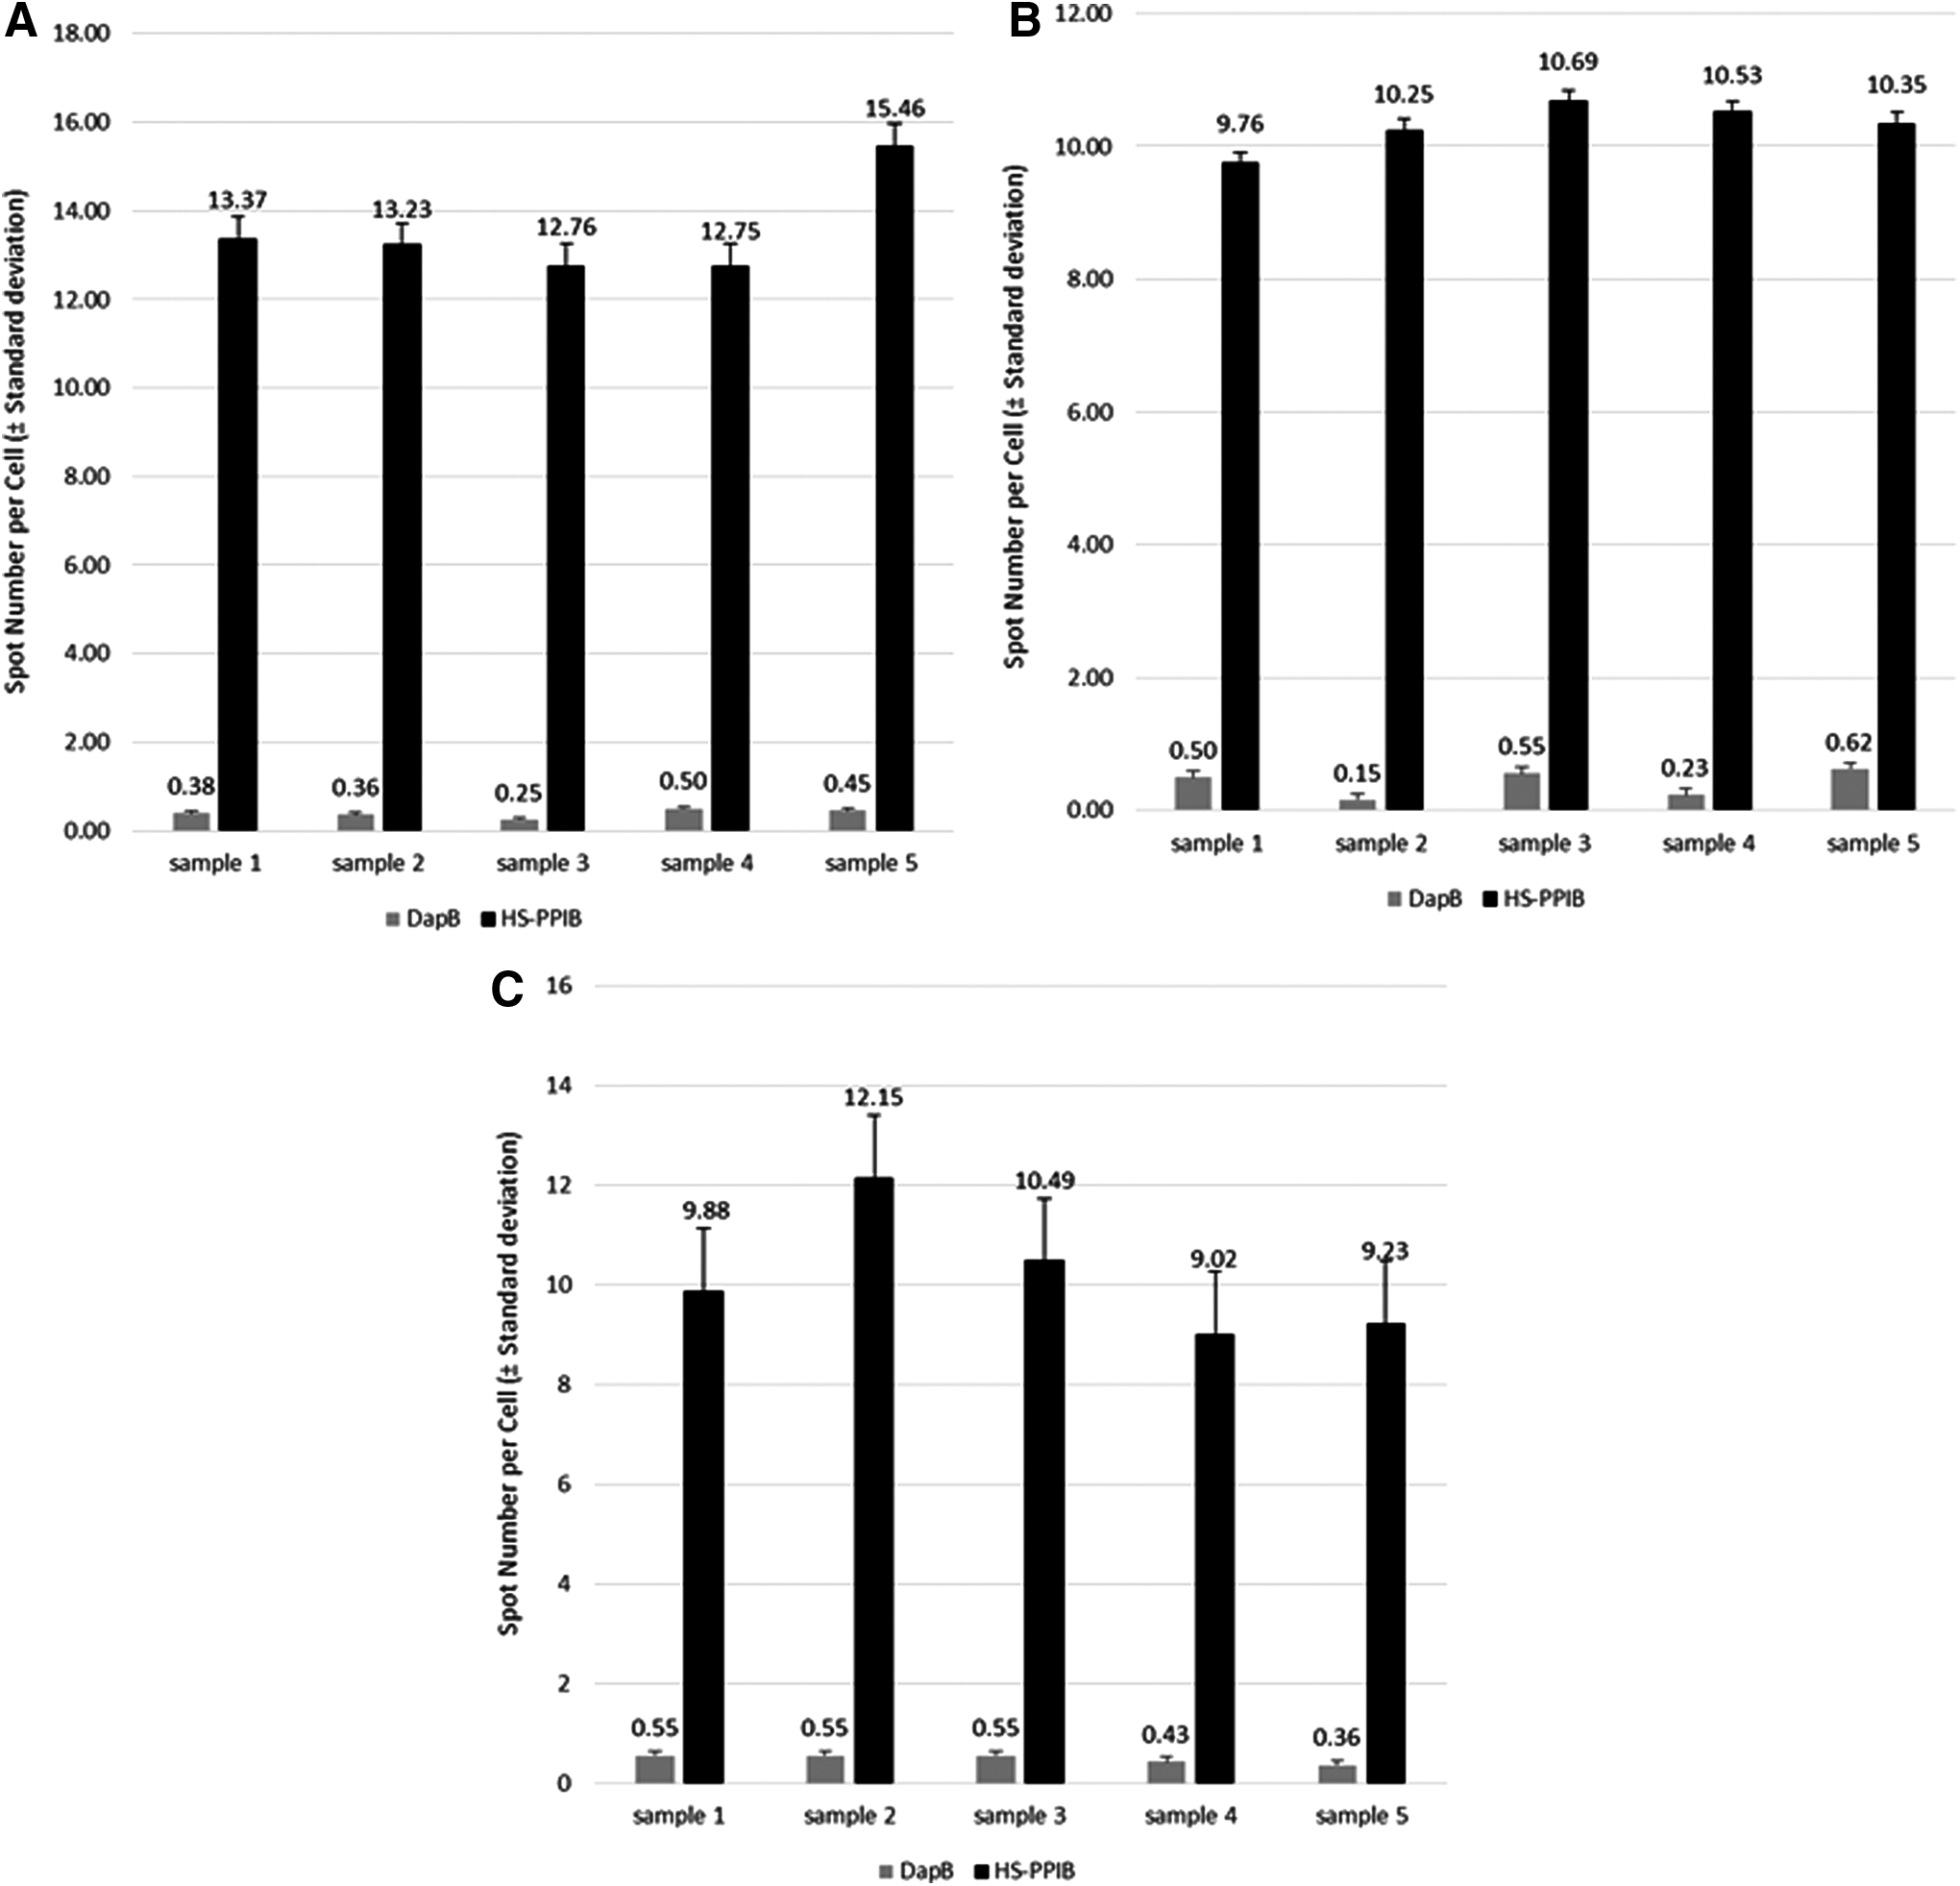
Quantification of the RNAscope for the Hs-PPIB and dapB probes. Number of spots per cell in
The spots per cell values of standard deviation were calculated from the five replicate samples for each organotypic cell culture type (Table 3). Low values of standard deviation suggested that there was less variability between each sample from the same tissue type.
In addition, a one-sample t-test was conducted (shown in Table 3) indicating that both the percentage of dapB-stained cells with 0 spots (score of 0) and the percentage of Hs-PPIB-stained cells with more than 4 spots (score of 2) are significantly more than 70%.
Discussion
The RNAscope technology is designed to tag and locate RNA molecules at cellular resolution; therefore, the staining is highly dependent on tissue integrity and RNA preservation.1,2,33 Here, we have developed a complete optimized protocol for RNAscope staining applicable to various organotypic culture models. The protocol includes specific histology workflow aimed at preserving the tissue morphology and RNA integrity for an accurate quantification of the RNAscope staining. Formalin is known to create cross-links between proteins and nucleic acid sequences, degrading RNA.33–38 However, here we showed that 10% NBF applied for 24 hours followed by 12 hours of processing was the most appropriate protocol to get maximum RNA quantity without compromising the tissue morphology of 3D organotypic cell cultures.
RNAscope protocols were customized for each tissue type by using Hs-PPIB positive control and dapB negative control Z probes. Hs-PPIB targets human mRNAs encoding for ubiquitous endoplasmic reticulum peptidylprolyl isomerases, while dapB targets soil bacillus subtilis transcripts encoding for dihydrodipicolinate reductases.39,40 We determined that epitope retrieval solution 2 applied for 5 minutes at 88°C followed by a protease incubation for 10 minutes at 40°C allowed optimum RNA detection to be obtained by conditioning Z probe access to targets. Following the hybridization of either Hs-PPIB or dapB Z probes for 2 hours at 42°C, many chromogenically labeled probes were linked mainly during AMP5. With this protocol design, targeted RNAs emitted an intense red spot signal while reducing background noise.,
The xenobiotic exposure such as drugs or pesticides modify cell transcriptome and produce molecules such as cytochrome P450s, CYP1A1 and CYP1B1 that can be detected, localized, and quantified using this technique.3,20,31,41 RNAscope can be a useful tool in exploratory toxicology to characterize cell-specific responses to toxic stimuli within 3D-organotypic tissue models as part of a tiered approach. RNAscope may be used here as a follow-up analysis after conducting (global) gene expression analysis to further investigate mechanisms behind a biological impact. RNAscope can therefore be part of a holistic approach complementing omics data and histopathological assessment.
Conclusion
In conclusion, we have optimized a complete workflow, from histology procedures to RNAscope ISH assay, on three different organotypic cell cultures: nasal, small airway, and gingival. It is important to note that histology workflox with tissue fixation and tissue processing has a critical role in maintaining tissue morphology and RNA preservation within tissues. The optimization of RNAscope staining protocols is based on three crucial parameters such as pretreatment, incubation with protease, and various amplification steps.
RNAscope provides high sensitivity and specificity for visualization of virtually any gene, expressed in any tissue, of any species. This technique opens new avenues on the development of innovative therapeutic biomarkers, toxicology studies, or RNA-based molecular diagnostics. RNAscope combined with organotypic cell cultures is a promising tool for a wide variety of research applications and implementation of 3R (replace, reduce, and refine animal testing) principles, as animal experiments are of ethical concern. Future work may include RNAscope on other types of organotypic samples, with the possibility of testing various targeted probes on 3D cell cultures.
Footnotes
Acknowledgments
We wish to thank the following individuals for contributing their technical expertise: Laura Ortega Torres for cell cultures, Camille Schilt for histology, and Filippo Zanetti for his scientific expertise.
Author Disclosure Statement
All authors are employees of Philip Morris International, except for C.L., who was employed by Philip Morris International at the time this research was conducted. Philip Morris International is the sole source of funding and sponsor of this research.
References
Supplementary Material
Please find the following supplemental material available below.
For Open Access articles published under a Creative Commons License, all supplemental material carries the same license as the article it is associated with.
For non-Open Access articles published, all supplemental material carries a non-exclusive license, and permission requests for re-use of supplemental material or any part of supplemental material shall be sent directly to the copyright owner as specified in the copyright notice associated with the article.