
Abstract
Abstract
Electronic nicotine delivery systems (ENDS) dispense nicotine by heating a solution (e-liquid) and generating an aerosol that is then inhaled by the user. ENDS have been previously reported by some as less harmful than conventional cigarettes. However, available data regarding the toxicity of ENDS devices and e-liquids are limited and further studies are needed to fully understand their biological effects. In this study, we investigated the toxicity of nonflavored e-liquids in primary human bronchial epithelial cells using a systems toxicology approach. The toxicity of e-liquids was compared to that of nicotine alone. Cells were exposed to solutions containing different proportions of propylene glycol (PG), vegetable glycerin (VG), and nicotine. The results were compared with those of exposing cells to nicotine alone. Multiparametric indicators of cellular toxicity were measured via real-time cellular analysis and high-content screening. This study was complemented by a whole transcriptome analysis, followed by computational approaches to identify and quantify perturbed molecular pathways. Exposure to PG and VG resulted in inhibited cell proliferation and cytotoxicity. These effects were proportional to the PG content in the mixture and consistent with the presence of hyperosmotic shock in exposed cells. Addition of nicotine increased the toxicity of the PG/VG mixtures and activated biological pathways ultimately leading to apoptosis/necrosis. Similar responses were observed on exposure to nicotine alone. Taken together, the results indicate that the toxicity of nicotine-containing PG/VG mixtures is similar to that of nicotine alone.
Introduction
C
In this study, the development of alternative sources of nicotine delivery that are less risky than conventional cigarettes would be beneficial for the purpose of tobacco harm reduction. In fact, recent studies suggest that switching even a small fraction of smokers every year to less harmful nicotine sources could potentially save thousands of lives over the next decades. 4
Electronic nicotine delivery systems (ENDS) comprise a wide variety of battery-powered devices that dispense nicotine by heating a solution (e-liquid) and generating an aerosol that is then inhaled by the user in a process commonly known as vaping. 5 E-liquids typically consist of a water-based solution containing different proportions of propylene glycol (PG), vegetable glycerin (VG), and flavoring agents. In addition, they may or may not contain nicotine. ENDS are designed to mimic the smoking ritual while, at the same time, delivering nicotine in the absence of combustion.
Available scientific evidence generally seems to support the notion that ENDS have considerably reduced toxicity compared with CS.6–9 For example, ENDS contain lower levels of harmful constituents than CS8,10 and ENDS-only users show lower urine levels of toxicants compared with regular smokers. 11 On the contrary, some studies have reported that toxicant levels are still detectable in ENDS aerosols and their biological effects can still be measured.7,12,13 These different results suggest that ENDS are not risk free and reinforce the concept that the potential health effects of e-liquids and their heated aerosols should be thoroughly investigated. Furthermore, to determine whether ENDS constitute a safer alternative for nicotine delivery than cigarette smoking, it will be useful to compare the toxicity of e-liquids with that of standard tobacco-cessation interventions, such as NRT.
The toxicological assessment of ENDS faces many challenges, such as the rapid evolution of e-liquids, the limited number of studies evaluating the biological effects of their main constituents on the respiratory system, and the lack of standardized testing protocols, which often hinders comparison of results from different laboratories.14–17
In a recent publication, 15 we described a layered framework for the systematic assessment of e-liquids and their aerosols using relevant in vitro systems and 21st century methodologies. The framework proposes to initially investigate the toxicity of e-liquid solutions, rather than their aerosols, using a combination of multiparametric indicators of toxicity and omics technologies. This type of approach eliminates the need to select an ENDS device among the many available in the market and, therefore, any results can be easily reproduced by other groups. At the same time, the use of liquid solutions has advantages in terms of sample throughput, allowing a large number of e-liquids to be screened in a timely and cost-efficient manner. On subsequent steps, the framework also proposes to investigate the toxicity of ENDS heated aerosols. This is a very relevant step, because these are the products users are ultimately exposed to and their toxicity may be different from that of the e-liquids depending on the device used to produce them.
In this study, we used the proposed approach to investigate the toxicity of different mixtures of PG, VG, and nicotine, mimicking the typical composition of nonflavored e-liquids. The results were compared with those of nicotine alone, used to mimic exposure to standard NRT. Experiments were carried out in primary normal human bronchial epithelial (NHBE) cells. Cellular toxicity was investigated by real-time cellular analysis (RTCA) and high-content screening (HCS)-based endpoints. This study was complemented with a microarray-based transcriptomics analysis followed by a quantitative systems biology-based approach leveraging mechanistic network models.18–20 This approach allowed the investigation of the molecular pathways perturbed on exposure to the different PG/VG/nicotine mixtures or nicotine alone and to demonstrate the applicability of a systems toxicology approach to contribute to the evaluation of the risk associated with e-liquids.
Materials and Methods
PG/VG/nicotine mixtures
Ten different mixtures, containing different proportions of PG/VG and nicotine, were used in this study. Their composition is detailed in Table 1. In addition, NHBE cells were exposed to nicotine alone. PG (CASRN: 57-55-6, purity: >99.5%, ref.: 82280), VG (CASRN: 56-81-5, purity: >99.5%, ref.: G9012), and nicotine (CASRN: 54-11-5, purity: >99.0%, ref.: N3876) were purchased from Sigma-Aldrich (St Louis, MO).
PBS, phosphate-buffered saline; PG, propylene glycol; VG, vegetable glycerin.
Cell culture
NHBE cells were purchased from Lonza (Catalog no. CC-2540; Lonza, Cologne, Germany). The donor was a 60-year-old Caucasian male with no history of smoking (ref.: CC2540, Lot No.: 0000140733). Replicating bronchial epithelial cells have a normal karyotype. 21 For all experiments described here, we used cells between passages five and eight. The cells were maintained in a humidified incubator at 37°C and 5% CO2 and cultured in a bronchial epithelial cell medium (Bullet Kit CC 3170; Lonza) as previously described. 22
Briefly, cells were seeded in uncoated T75 flasks with 20 mL medium at a density of 50,000 cells/mL grown until 80% confluence and changing the medium every 2 days. For harvesting, cells were trypsinized (Reagent pack CC-5034; Lonza), neutralized with trypsin neutralization solution, centrifuged at 1000 rpm for 5 minutes, and resuspended in NHBE cell culture medium. The cell concentration was adjusted according to the plate/flask format for subsequent analysis. NHBE cells were seeded into 96-well tissue culture plates at a density of approximately 37,500 cells per cm2 in 100 μL of culture medium and incubated for 24 hours at 37°C and 5% CO2. Exposure was performed by adding to each well 25 μL of a 5x stock solution containing the different treatments diluted in culture medium.
Cell viability
Cell viability was measured using a multielectrode array-based real-time cellular analysis system (ACEA Biosciences, Inc., San Diego, CA). NHBE cells were seeded into E-Plate View 96-well tissue culture plates (ACEA Biosciences) at a density of 37,500 cells per cm2 (7.2 × 10³ cells per well) in 100 μL of culture medium and incubated for 24 hours at 37°C and 5% CO2. Cells were then exposed (in triplicate) to seven different concentrations of treatment for an additional 24 hours. 50 μM Carbonyl cyanide m-chlorophenylhydrazine (CCCP; CASRN: 555-60-2, purity: 98%, ref.: C2759; Sigma-Aldrich) was used as positive control for the assay. Phosphate-buffered saline (PBS; ref.: D8537; Sigma-Aldrich) was used as negative control for PG/VG mixtures with and without nicotine, and water was used as negative control for nicotine alone in each experiment. Changes in cell index over time were monitored and recorded throughout the duration of the experiment.
Concentration–response curves were generated by calculating the area under the curve (AUC) during the 24 hours immediately after exposure at each tested concentration. At least three independent experiments were performed. Cell viability was measured as the change in cell index over time using the following formula: cell index (%) = −[(Ax–Ve)/(PC–Ve)] × 100, where Ax was the AUC in a 24-hour exposure period to a concentration x of a given treatment, Ve is the AUC in a 24-hour exposure period to the vehicle control (PBS), and PC is the AUC in a 24-hour exposure period to the positive control (CCCP). The resulting value was normalized to both vehicle and positive control. The vehicle, which did not induce changes in cell index, was assigned a 0% activity value, and the positive control, which induced the maximum decrease in cell index, was assigned a value of −100%. The values for the different treatments were between 0% and −100%. Raw and normalized values are included in Supplementary Data (Supplementary Data are available at www.liebertpub.com/aivt).
Measurement of osmolality
Osmolarity was measured with a Löser micro-osmometer (type OM806; Löser Messtechnik, Berlin, Germany). The instrument determines the osmolality by measuring the freezing point of aqueous solutions. The freezing point depression in comparison to pure water is used as a direct measure of the osmotic concentration.
High-content screening
NHBE cells were seeded into black, clear-bottom 96-well tissue culture plates at a density of 37,500 cells per cm2 (12,000 cells per well) in 100 μL of culture medium. The cells were incubated for 24 hours in the culture medium and then exposed (in three replicate wells) to increasing doses of the different PG/VG/nicotine solutions or vehicle control (PBS). The cells were exposed for 4 or 24 hours (24 hours only for the cell cycle endpoint) before running the HCS assays. In parallel, appropriate positive controls at three different concentrations were used for each assay: 50, 200, 500 μM CCCP (CASRN: 555-60-2, purity: 98%, ref.: C2759; Sigma-Aldrich) for mitochondrial membrane potential (MMP) and mitochondrial mass (MitoTracker®; Life Technologies, Carlsbad, CA), apoptosis (caspase 3/7 activity CellEvent™; Life Technologies), cell membrane permeability (YO-PRO™-1; Life Technologies), and cytochrome C release (antibody; Abcam, Cambridge, UK); 100, 400, 1000 μM tacrine (CASRN: 206658-92-6, purity: >99%, ref.: A79922; Sigma-Aldrich) or 100, 400, 1000 μM ethacrynic acid (CASRN: 58-54-8, purity: >99%, ref.: E4754; Abcam) for reactive oxygen species (ROS) (dihydroethidium; CASRN: 104821-25-2, purity: >95%, ref.: D7008; Sigma-Aldrich); 100, 400, 1000 μM ethacrynic acid for glutathione content (monochlorobimane; Sigma-Aldrich); 0.1, 0.4, 1 μM; nocodazole (CASRN: 31430-18-9, purity: 99%, ref.: M1404; Sigma-Aldrich) for cell cycle; a combination of 10, 40, 100 μM chlorambucil (CASRN: 305-03-3, purity: 99%, ref.: C0253) and 0.5, 2, 5 μM colchicine (CASRN: 64-86-8, purity: 98%, ref.: C9754; Sigma-Aldrich) for DNA damage (phospho-H2AX antibody; Millipore, Billerica, MA); a combination of 10, 40, 100 μM chlorambucil and 0.5, 2, 2.5 μM colchicine for cell stress (p-cJun antibody; Millipore). 0.5% Dimethyl sulfoxide (CASRN: 67-68-5, purity: >99.9%, ref.: D8418; Sigma-Aldrich) was used as the vehicle for all positive control treatments. Cell count was measured in all assays using a Hoechst 33342 (Life Technologies). Cell cycle analysis was performed by using 5-ethynyl-2′-deoxyuridine (EdU; CASRN: 61135-33-9) and the Click-iT® EdU Alexa Fluor® 647 Imaging Kit (Life Technologies). Cells were counterstained with nuclear dye Hoechst 33342 (Life Technologies) to measure DNA content based on nuclear staining.
Following staining of NHBE cells, fluorescence was analyzed by image acquisition with a Thermo Fisher Cellomics® ArrayScan VTI High Content Screening Reader (Thermo Fisher Scientific, Waltham, MA) and vHCS™:View software (Thermo Fisher Scientific). Twenty fields were imaged per well using a 10x wide field objective as previously described. 23 Supplementary Table S1 indicates the cellular compartment where the endpoint was measured as well as the output feature used by the software for quantification. Plots were generated by normalizing all values to the respective vehicle control, which was considered as 0% change in assay response. At least three independent experiments were performed for each treatment and assay. Raw and normalized values are included in Supplementary Data.
Statistical analysis
For cell viability experiments, normalized cell index values were plotted against treatment concentration using GraphPad Prism 5.01 (GraphPad Software, San Diego, CA; www.graphpad.com). A nonlinear regression with no parameter constraints was performed using the “half maximal effective concentration (EC50) shift” fitting model of the software to calculate EC50 values and 95% confidence intervals (CIs).
A one-sample t-test was used to determine whether the changes in cell viability or HCS assay responses observed on exposure to the different treatments were statistically different from the vehicle control. A two-sample t-test was used to determine whether the changes in cell viability or HCS assay responses observed on exposure to nicotine-containing PG/VG mixture were statistically different from a mixture containing the same concentration of PG and VG but no nicotine.
RNA extraction and microarray hybridization
NHBE cells were seeded into black, clear-bottom, 96-well tissue culture plates at a density of 37,500 cells per cm2 (12,000 cells per well) in 100 μL of culture medium. The cells were incubated for 24 hours in the culture medium and then exposed (in four replicates) for 24 hours to the selected concentrations of the different treatments or vehicle control (PBS). Cells were subsequently lysed using the RLT buffer (Qiagen AG, Hilden, Germany), which contains 1% beta mercaptoethanol. Isolation of RNA was performed with the RNeasy Micro Kit (Qiagen AG). For each concentration, four replicate wells were pooled together for RNA extraction. The concentration of isolated RNAs was measured using a NanoDrop ND1000 Spectrophotometer (Thermo Fisher Scientific). RNA quality was verified using an Agilent 2100 Bioanalyzer (Agilent, Santa Clara, CA). The minimum RNA integrity number was 6.8 (the average value in this study was 9.8).
For messenger RNA analysis, 50 ng of total RNA was processed as described in the Nugen Ovation RNA Amplification system V2 protocol (Nugen, San Carlos, CA). A GeneChip Human Genome U133 Plus 2.0 Array (Affymetrix, Santa Clara, CA) was used for hybridization, which simultaneously probed the expression of thousands of genes. Three biological replicates (three independent experiments performed on different days) were collected for each treatment and concentration. The number of technical replicates per experiment was one. Within each experiment, all RNA samples were processed in the same target synthesis batch.
Raw CEL files were background corrected, normalized, and summarized using frozen robust microarray analysis. 24 Background correction and quantile normalization were used to generate microarray expression values from all arrays passing quality control checks using the custom chip definition file (CDF) environment HGU133Plus2_Hs_ENTREZG v16.0. 25 A log-intensity plot, normalized unscaled standard error plot, relative log expression plot, polyA controls box plot, RNA degradation plot, spike-in controls box plot, and pseudo and raw images using R packages were generated for quality checks (AffyPLM; Bioconductor, Seattle, WA).26,27 The gene expression data used in this publication have been deposited in ArrayExpress (www.ebi.ac.uk/arrayexpress) and are accessible through accession number E-MTAB-5317.
Ingenuity pathway analysis
Core analyses using the QIAGEN Ingenuity Pathway Analysis (IPA®) software (content version: 28820210, release date: September 24, 2016; QIAGEN, Redwood City, CA) were performed using a false discovery rate (FDR) cutoff of 0.1. A comparison analysis was generated to compare the canonical pathways across all groups. To identify the most relevant canonical pathways affected in our biological system, we excluded pathways not relevant in the context of the lung and respiratory system. The comparison analysis was visualized using a heatmap displaying the z-score values. We selected the canonical pathways affected by at least two contrasts.
Upstream regulator analysis was also used to predict molecules whose activation/inhibition may explain the observed gene expression patterns. The activation/inhibition of the regulator is predicted from the consistencies among the expression patterns of the target genes, via the z-score. Subsequently, for the most significant network regulator downstream targets, we added all the canonical pathways involved in each of the three treatments using the “Path Designer” tool in IPA and the “Overlay-Canonical Pathways” option.
Network-based analysis
Network perturbation amplitude
The method was previously reported.18,19,28 Briefly, the methodology aims to contextualize transcriptome profiles (exposed vs. nonexposed) by combining the alteration of gene expression into differentiated node values (i.e., one value for each node of a causal network model 29 ). The network models represent the molecular mechanisms across a range of biological processes, including cell fate, cell stress, cell proliferation, and inflammation, relevant to the human respiratory physiology. Relevant network models used for the analysis in this study are listed in Supplementary Table S2.
For many nodes, literature-derived information supporting the relationship between a node and the expression of certain genes is available. Therefore, a transcriptome profile can be used to computationally predict the activity of certain nodes. The differential node values are determined by fitting procedures inferring the values that best satisfy the directionality of the causal relationships contained in the network model (e.g., positive or negative signs). Network perturbation amplitude (NPA) scores carry a CI accounting for the experimental variation and the associated p-values are computed. In addition, companion statistics, derived to inform the specificity of the NPA score to the biology described in the network models, are reported as *O and K* if their p-values fall below the threshold of significance (0.05). A network is considered to be significantly impacted by exposure if the three values (the p-value for experimental variation and *O and K* statistics) are below 0.05. The methodology has been described in greater detail previously.18,28
Biological impact factor
In addition to the impact/perturbation scores at network and subnetwork levels, the effects of exposure were further quantified as a systems-wide metric for biological impact: the biological impact factor (BIF).18,20 This positive value of BIF summarizes the impact of the exposure on the cellular system into a single number, enabling a simple and high-level evaluation of the treatment effects across various postexposure times. The calculation of the BIF required the collection of all applicable hierarchically structured network models (Supplementary Table S2) and involved aggregating the NPA values of the individual networks.
Results
Effect of PG, VG, and nicotine on NHBE cell viability
The effects of PG, VG, and nicotine on NHBE cells were initially investigated using RTCA. This method is based on the use of tissue culture plates with gold microelectrodes covering most of the bottom of each well. 30 The presence of cells on top of the electrodes affects the local ionic environment at the electrode/solution interface, leading to an increase in electrode impedance. The impedance depends on the quality of the cell interaction with the electrode, allowing for the detection of small changes in cell number, morphology, and how tightly the cells are interacting with the plate surface. The RTCA system uses a dimensionless parameter known as the “cell index,” derived as the relative change in measured electrical impedance, to represent cell status. This is used as the output signal. In a previous study, 31 we demonstrated that, in NHBE cells, decreases in the cell index correlate with the presence of cytotoxicity.
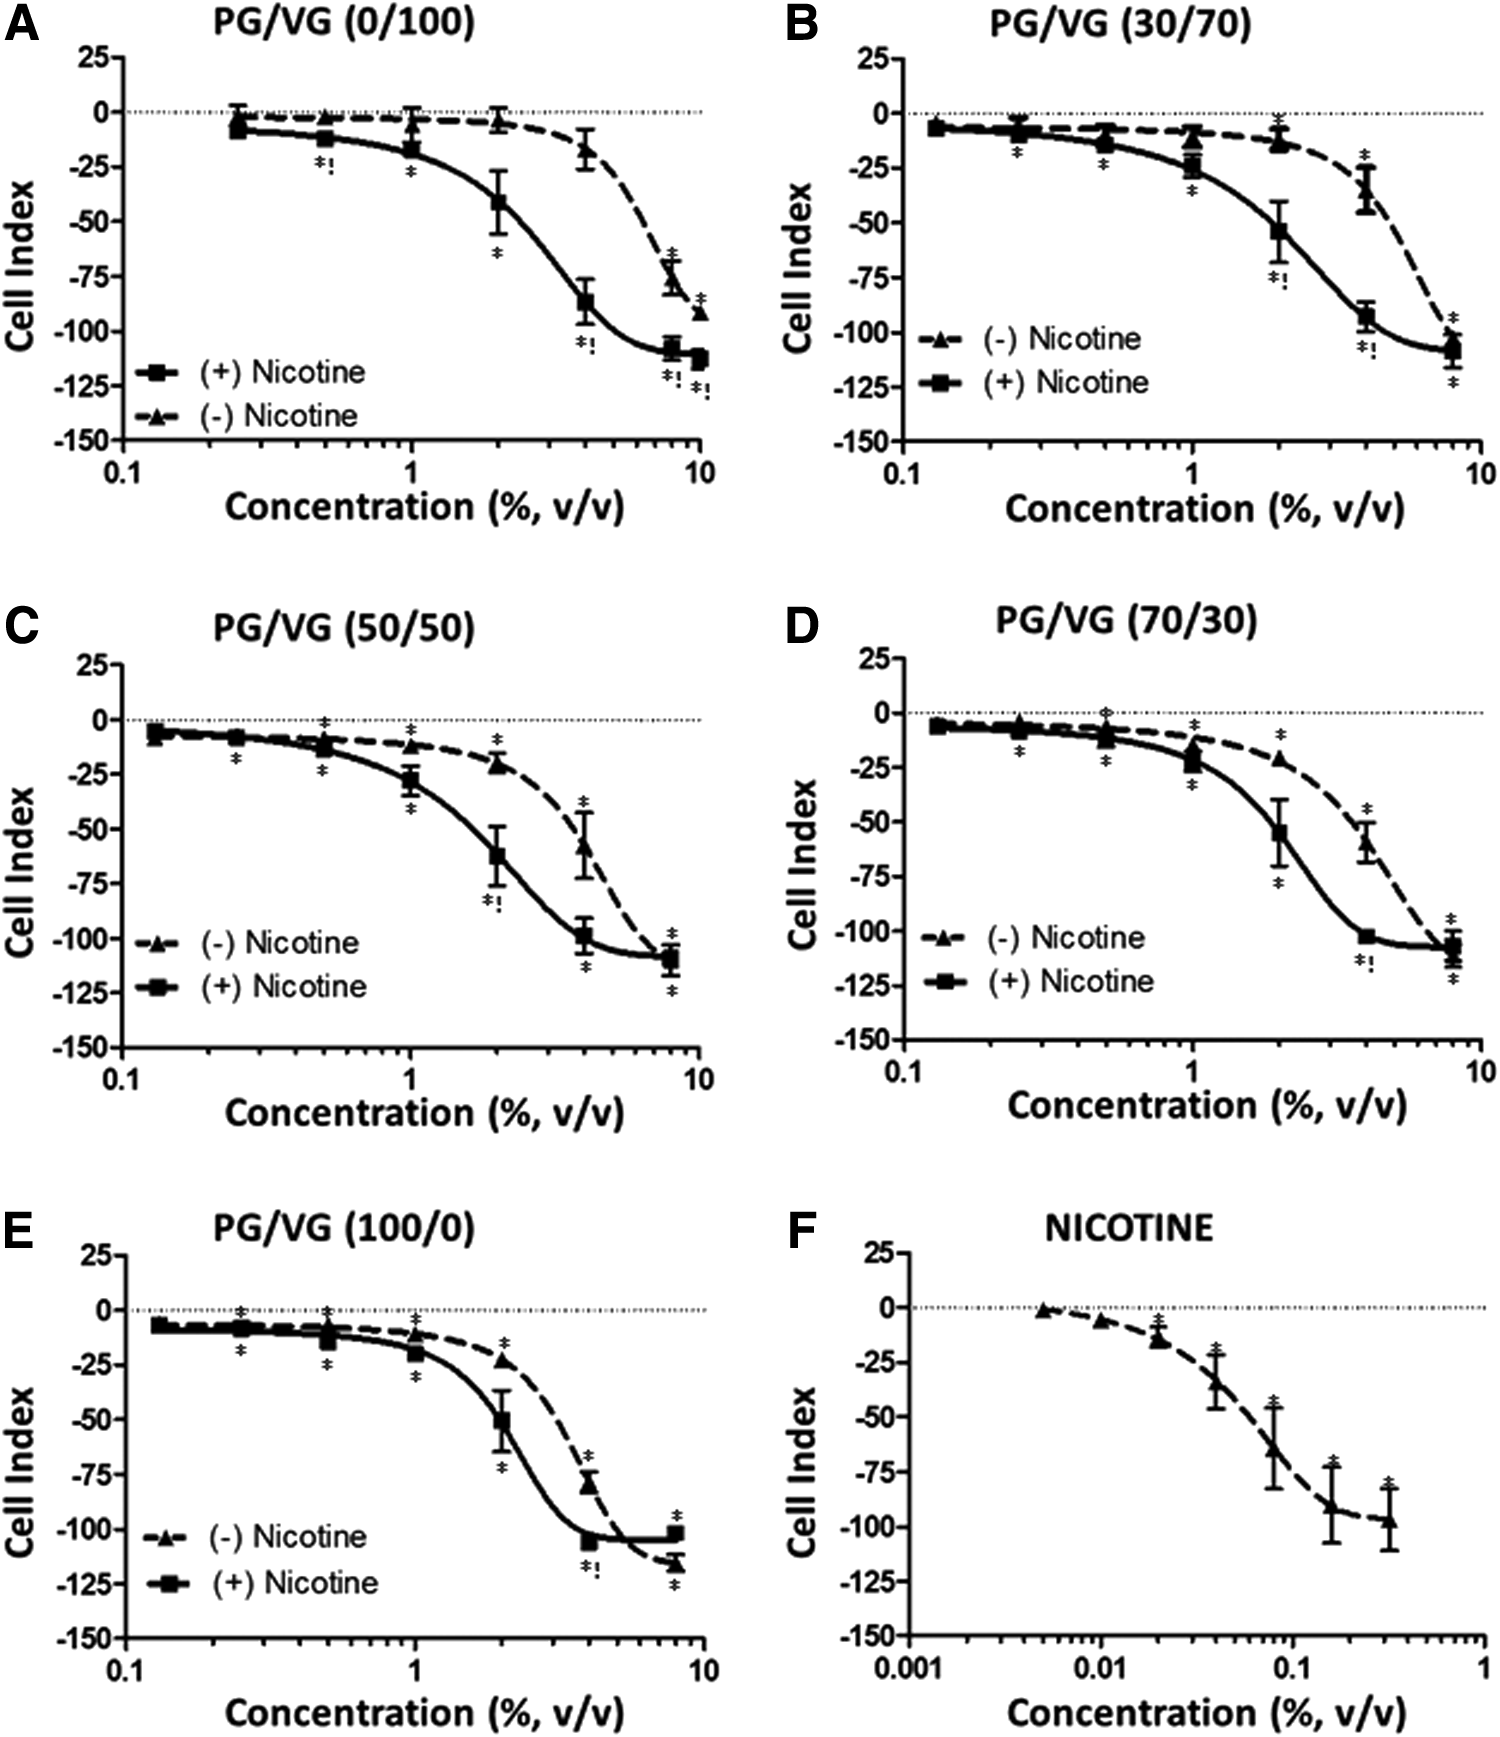
NHBE cells were exposed to increasing concentrations of either nicotine alone or 10 different mixtures containing various proportions of PG, VG, and nicotine. The composition of the different mixtures is detailed in Table 1. Cells were continuously monitored for 24 hours after exposure. Figure 1 shows the dose–response curves for the different treatments. A dose-dependent effect in the cell index was observed for all treatments at 24 hours, indicating the presence of cytotoxicity. When the data were fitted by nonlinear regression, EC50 values could be calculated (Table 2). In nicotine-free PG/VG mixtures, cytotoxicity increased together with PG content (Supplementary Fig. S1, panel A). The weakest response was observed for the PG/VG (0/100) mixture, with an EC50 value of 6.30%. The strongest response was observed for the PG/VG (70/30) and the PG/VG (100/0) mixtures, with EC50 values of 3.92% and 3.41%. These two values where significantly lower than the EC50 for the PG/VG (0/100) mixture (Table 2A). These results suggest that PG had a higher cytotoxic effect on NHBE cells than VG.
Changes in cell index in lung epithelial cells exposed for 24 hours to the different PG/VG mixtures
Column four shows 95% CIs for the EC50 values. In column six, a 2-sample t-test was performed comparing, within each table, the PG/VG (0/100) mixture against every other mixture. Column seven indicates nicotine content at the EC50 concentration of each PG/VG mixture.
Statistically significant values (p < 0.05) are indicated in bold.
95% CI, 95% confidence interval.
The presence of nicotine augmented the toxicity of all PG/VG mixtures when compared with their nicotine-free counterparts (Fig. 1). In this case, EC50 values ranged between 1.48% in the PG/VG/nicotine (50/50) mixture to 2.47% in the PG/VG/nicotine (0/100) mixture. No statistical differences were observed between the EC50 values of the different mixtures (Table 2B) and no clear correlation with PG content in the mixture was found (Supplementary Fig. S1, panel B). These results were confirmed via HCS in cells exposed to three different mixtures: PG/VG (0/100), PG/VG (50/50), and PG/VG (100/0).
The cell count endpoint measures the average number of cells that remain attached to the culture plate after exposure. A dose-dependent decrease in cell count was observed in all cases, and the response was stronger in the presence of nicotine (Supplementary Fig. S2–S4, panel A). Exposure of NHBE cells to nicotine alone also resulted in a dose-dependent decrease in the cell index (Fig. 1) and cell count after 24 hours of exposure (Supplementary Fig. S5, panel A). When the RTCA data were fitted by nonlinear regression, an EC50 value of 0.02% was obtained (Table 2). To facilitate the comparison, we calculated the concentration of nicotine in the PG/VG mixtures at their EC50 values. As shown in Table 2, nicotine values in the mixtures were within the same range of the EC50 for nicotine alone. These data suggest that the increased toxicity observed in nicotine-containing PG/VG mixtures was because of nicotine's inherent toxicity. No synergistic effect with PG or VG was observed.
Both PG and VG can have a dramatic effect on the osmotic concentration of a solution. Hyperosmotic solutions can induce hyperosmotic shock in exposed cells, eventually leading to cytotoxicity. To investigate if hyperosmolarity was responsible for the cytotoxic effects of PG, VG, and nicotine, we measured the osmolarity in all tested solutions at the different concentrations NHBE cells were exposed to. A dose-dependent increase in osmolarity was observed for all PG/VG mixtures. At concentration values above 2%, the osmolarity of all mixtures was well above physiological levels (300 mOsm/kg), indicating the potential to induce hyperosmotic shock in NHBE cells. Osmolarity values were higher in those mixtures containing PG (Supplementary Fig. S6, panels B–E) compared with the mixtures containing only VG (Supplementary Fig. S6, panel A). Interestingly, nicotine alone did not have an effect on osmolarity, and its presence did not increase the osmotic concentration of PG/VG mixtures. This suggests that different toxicity mechanisms are involved on exposure to PG/VG and nicotine.
Effect of PG, VG, and nicotine mixtures on HCS-based toxicity endpoints
Based on the results from RTCA, we selected three PG/VG mixtures, both with and without nicotine, for further analysis via HCS-based endpoints: PG/VG (0/100), PG/VG (50/50), and PG/VG (100/0). A summary of the results are included in Table 3. Nicotine-free PG/VG mixtures showed a positive response only in a few HCS endpoints, namely cell loss, MMP, mitochondrial mass, and cell cycle. The different responses were observed at higher concentrations in the PG/VG (0/100) mixture compared with PG/VG (50/50) and PG/VG (100/0) mixtures, further supporting the notion that PG is more toxic than VG to NHBE cells. Nicotine-containing PG/VG mixtures showed stronger responses in a higher number of endpoints compared with their nicotine-free counterparts. Exposure to nicotine alone showed a response profile similar to that of the nicotine-containing PG/VG mixtures, although the effects were only observed at the highest nicotine concentration tested.
Only endpoints for which a positive response was observed in at least one experimental condition are listed. Values indicate the minimum concentration (% v/v) in which a minimum twofold increase in signal above vehicle control was observed (50% decrease for cell count, GSH content, cell cycle, and mitochondrial membrane potential/mass). Cell cycle values represent the minimum concentration at which a 50% decrease in the percentage of cells in S-phase was observed.
Indicates a weak response (1.5- to 2.0-fold increase in signal above vehicle or 30%−50% decrease in cell count, GSH, and mitochondrial membrane potential/mass).
Indicates that the response was not dose dependent.
GSH, glutathione; N/A, indicates that the endpoint was not measured.
The presence of DNA damage was initially investigated by measuring the number of cells positively stained for phosphorylated histone 2A variant X (p-H2AX), a well-established marker of DNA double-strand breaks. 32 Neither the PG/VG mixtures (Supplementary Fig. S2–S4, panel B) nor nicotine alone (Supplementary Fig. S5, panel B) showed any effect on this endpoint. c-Jun is a key component in the AP-1 family of transcription factors, which are activated by different extracellular stimuli. c-Jun becomes phosphorylated in response to oxidative and other forms of cell stress. The presence of oxidative stress was measured both as an increase in the formation of ROS and as a decrease in the levels of the cellular antioxidant glutathione (GSH).
Exposure to the PG/VG mixtures (with or without nicotine) did not result in an increase in the levels of phosphorylated c-Jun N-terminal kinase (Supplementary Fig. S2–S4, panel C) or in ROS formation (Supplementary Fig. S2–S4, panel D). We did observe only a mild decrease in GSH levels, although the effect occurred with the presence of cell loss and could therefore be nonspecific (Supplementary Fig. S2–S4, panel E). By contrast, exposure to nicotine caused a moderate but dose-dependent increase in c-Jun phosphorylation (Supplementary Fig. S5, panel C). Little to no effect in ROS formation was found for the different PG/VG mixtures, and only a moderate decrease in GSH levels (Supplementary Fig. S5, panels D, E) was observed at the highest concentration.
We also investigated the effects of the PG/VG mixtures on cell proliferation by performing a cell cycle analysis (Supplementary Fig. S7). All PG/VG mixtures caused a dose-dependent decrease in the percentage of cells in S-phase and an increase in the percentage of cells in G0/G1 phase, consistent with the presence of cell cycle arrest. Similar effects were observed in nicotine-free and nicotine-containing mixtures. The decrease in S phase was again observed at slightly higher concentrations in the VG-only compared with the PG-containing mixtures. A decrease in cell count (compared with vehicle control) was observed at the highest concentrations of all tested mixtures. The decrease in cell count was higher in nicotine-containing mixtures when compared with their nicotine-free counterparts.
A slight increase in apoptotic cells was observed at the highest concentration of the PG/VG/nicotine (0/100) mixture, although the result was not statistically significant. The cell cycle endpoint was not measured in cells exposed to nicotine alone. Growth arrest allows cells to repair damage; however, if the cellular insult is severe or prolonged, it can permanently damage cellular components (e.g., proteins, lipids, or DNA) and eventually cause cell death.
To investigate the presence of apoptosis in the cells, we measured two markers of apoptosis: the release of cytochrome C from mitochondria and the increase in caspase 3/7 activity. In addition, we evaluated cellular integrity using YO-PRO™-1, a dye that stains the cell only when the cellular membrane becomes permeable, which typically occurs in late apoptotic or necrotic cells. Exposure to nicotine-free PG/VG mixtures did not show a response in any of the three endpoints. By contrast, the nicotine-containing PG/VG mixtures caused an increased in the apoptosis endpoints (Supplementary Fig. S2–S4, panels F, H). Exposure to nicotine alone also caused an increase in all three markers of apoptosis at the highest concentration (0.16%) (Supplementary Fig. S5, panels F–H).
Finally, we investigated the effects of VG/PG mixtures on mitochondrial function using a fluorescent dye (MitoTracker) that allows the measurement of MMP and mitochondrial mass. No effects in MMP were observed for the PG/VG (100/0) mixture, but a decrease in signal (compared with vehicle control) was observed for the PG/VG (0/100) and PG/VG (50/50) mixtures (Supplementary Fig. S2–S4, panel I), suggesting the presence of mitochondrial damage. The apparent lack of response observed at the highest concentration of PG/VG (0/100) and PG/VG (50/50) mixtures was likely because of the presence of high cellular loss. This decrease in MMP was independent of nicotine content. In fact, exposure to nicotine alone caused hyperpolarization of the mitochondrial membrane at the highest concentrations tested (Supplementary Fig. S5, panel I). All three PG/VG mixtures showed a bimodal response in mitochondrial mass, with decreased values at low concentrations and increased values at high concentrations (Supplementary Fig. S2–S4, panel J). This effect was observed only in nicotine-containing mixtures, suggesting a nicotine effect. The same type of response was observed in NHBE cells exposed to nicotine alone (Supplementary Fig. S5, panel J).
Gene expression analysis
Based on the results from the RTCA and HCS-based endpoints, we selected the PG/VG (50/50) mixture (with and without nicotine) to be further investigated using gene expression analysis. For comparative purposes, we also exposed the cells to nicotine alone. Cells were exposed for 24 hours to three different concentrations. The highest concentration was selected in each case so that at least 60% cell viability was observed after 24 hours of exposure. Additional concentrations were chosen so that the different solution's fractions could be compared (Supplementary Table S3).
We initially determined the changes in gene expression compared with vehicle control. No differentially expressed genes (DEG) were observed for the PG/VG (50/50) mixtures at the two lowest concentrations. At the highest concentration (2.0%), the PG/VG (50/50) mixture showed 126 DEG (29 upregulated and 97 downregulated) and the PG/VG/nicotine (50/50) mixture showed 683 genes (264 upregulated and 419 downregulated) with an FDR below 0.05 and a log2-fold ratio of 1.2. In the case of nicotine, only one DEG was found at a concentration of 0.04%; however, 236 DEG (112 upregulated and 124 downregulated) were observed at a concentration of 0.08% (Fig. 2).
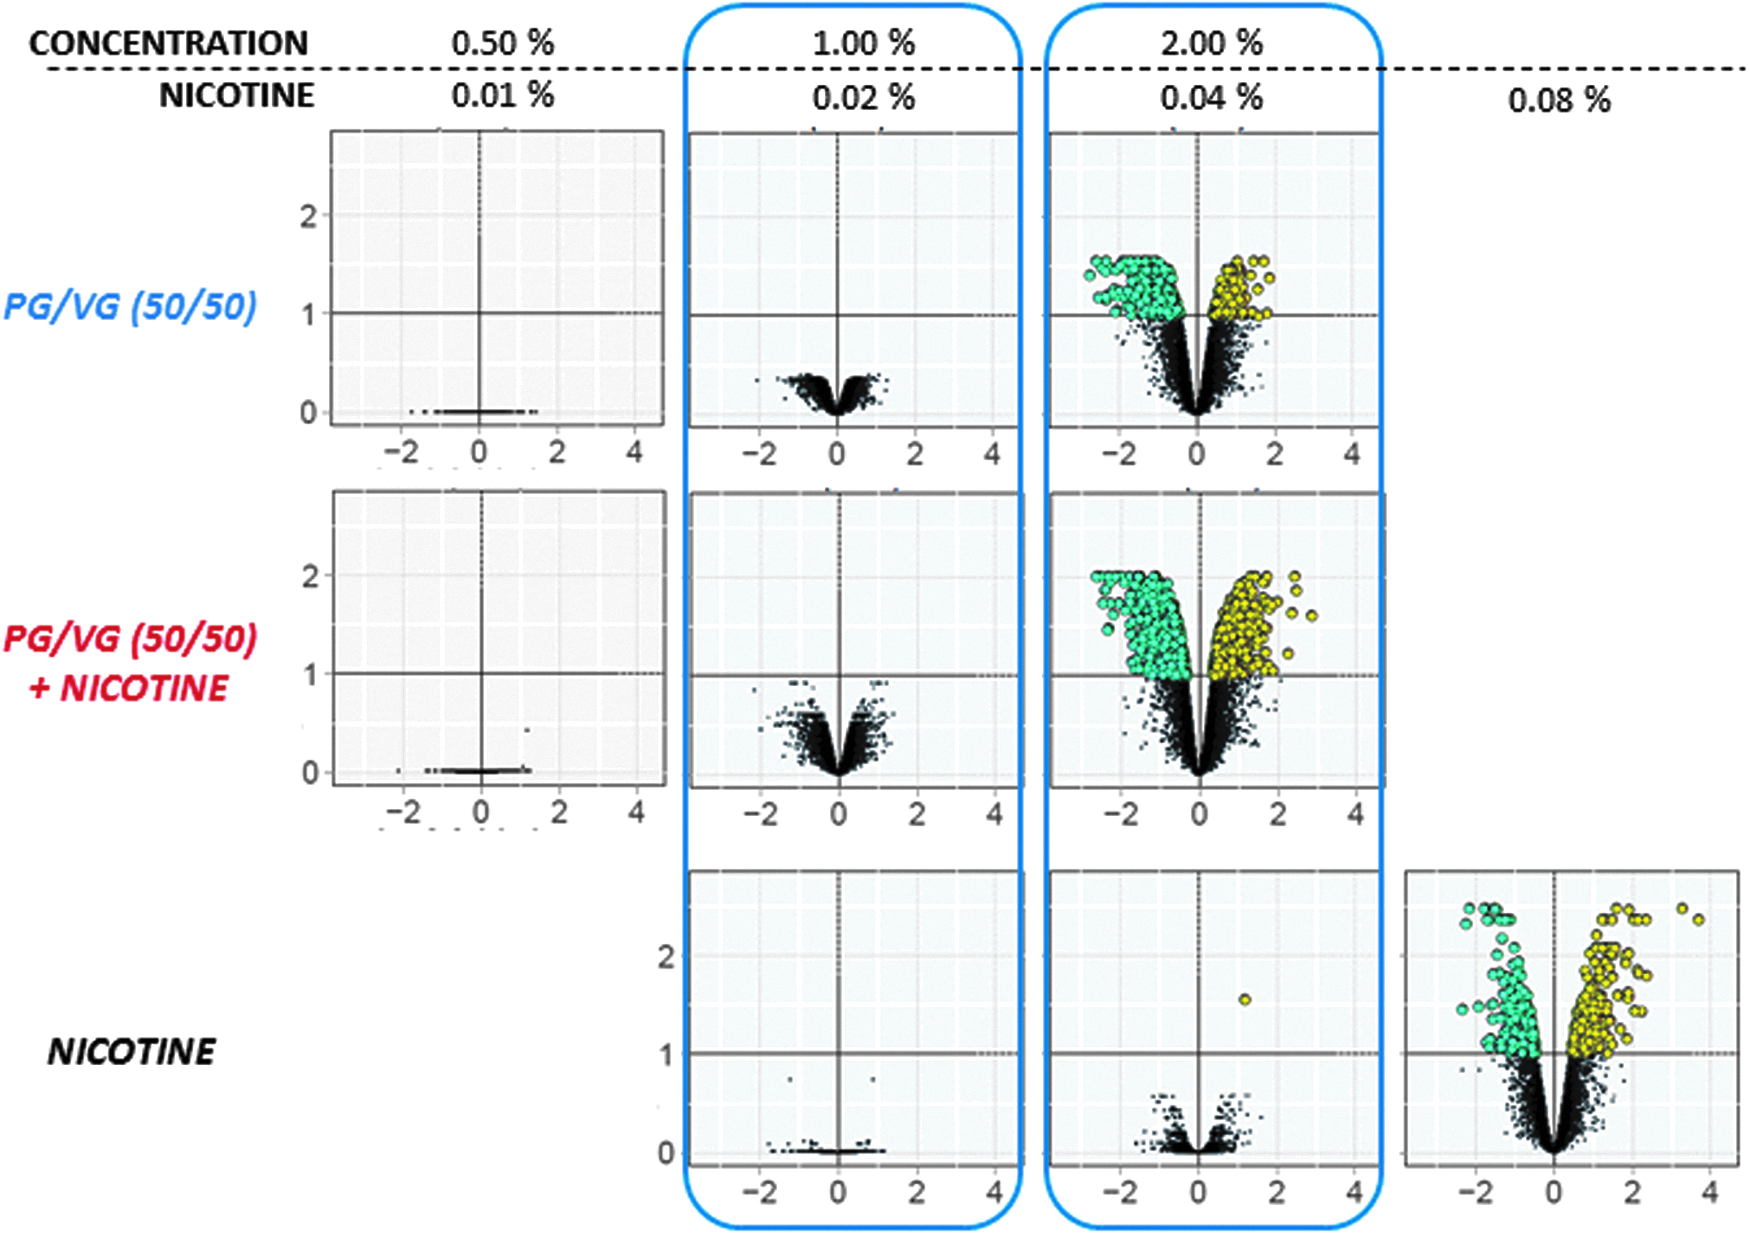
Gene expression changes in NHBE cells exposed for 24 hours to PG/VG (50/50) mixture (with or without nicotine) or nicotine alone. For each gene, the gene expression change was calculated as the log2-fold change and the statistical significance as −log10 (FDR). The log2-fold changes are shown on the x-axis. The −log10 (FDR) are shown on the y-axis. Negative fold changes are shown in the volcano plots in cyan and positive fold changes in yellow. Changes below an FDR of 0.05 are shown as dark dots. FDR, false discovery rate; NHBE, normal human bronchial epithelial cells.
Ingenuity pathway analysis
Ingenuity pathway analysis software was used for the functional annotation of DEG. This uses the ingenuity knowledge base to functionally annotate genes and to predict the biological functions of these changes (downstream effect analysis). The tendency (direction) of a biological function can in this way be predicted (activation with z-score >2.0; or inhibition with z-score ≤2). IPA typically requires the use of both fold change and p-value thresholds.
Given the overall low number of DEG observed using a p-value of 0.05, and to be able to perform an IPA-based analysis, we decided to increase the p-value to 0.1. Even under these conditions, a sufficient number of DEG were found only for the highest concentrations of PG/VG (2%), PG/VG/nicotine (2%), and nicotine alone (0.08%). The most significant canonical signaling pathways are shown in Figure 3. All three treatments share several canonical pathways that reveal a strong inhibition of cell cycle (cyclins and cell cycle regulation, ATM signaling, mitotic role of polo-like kinase, role of CHK proteins in cell cycle checkpoint).
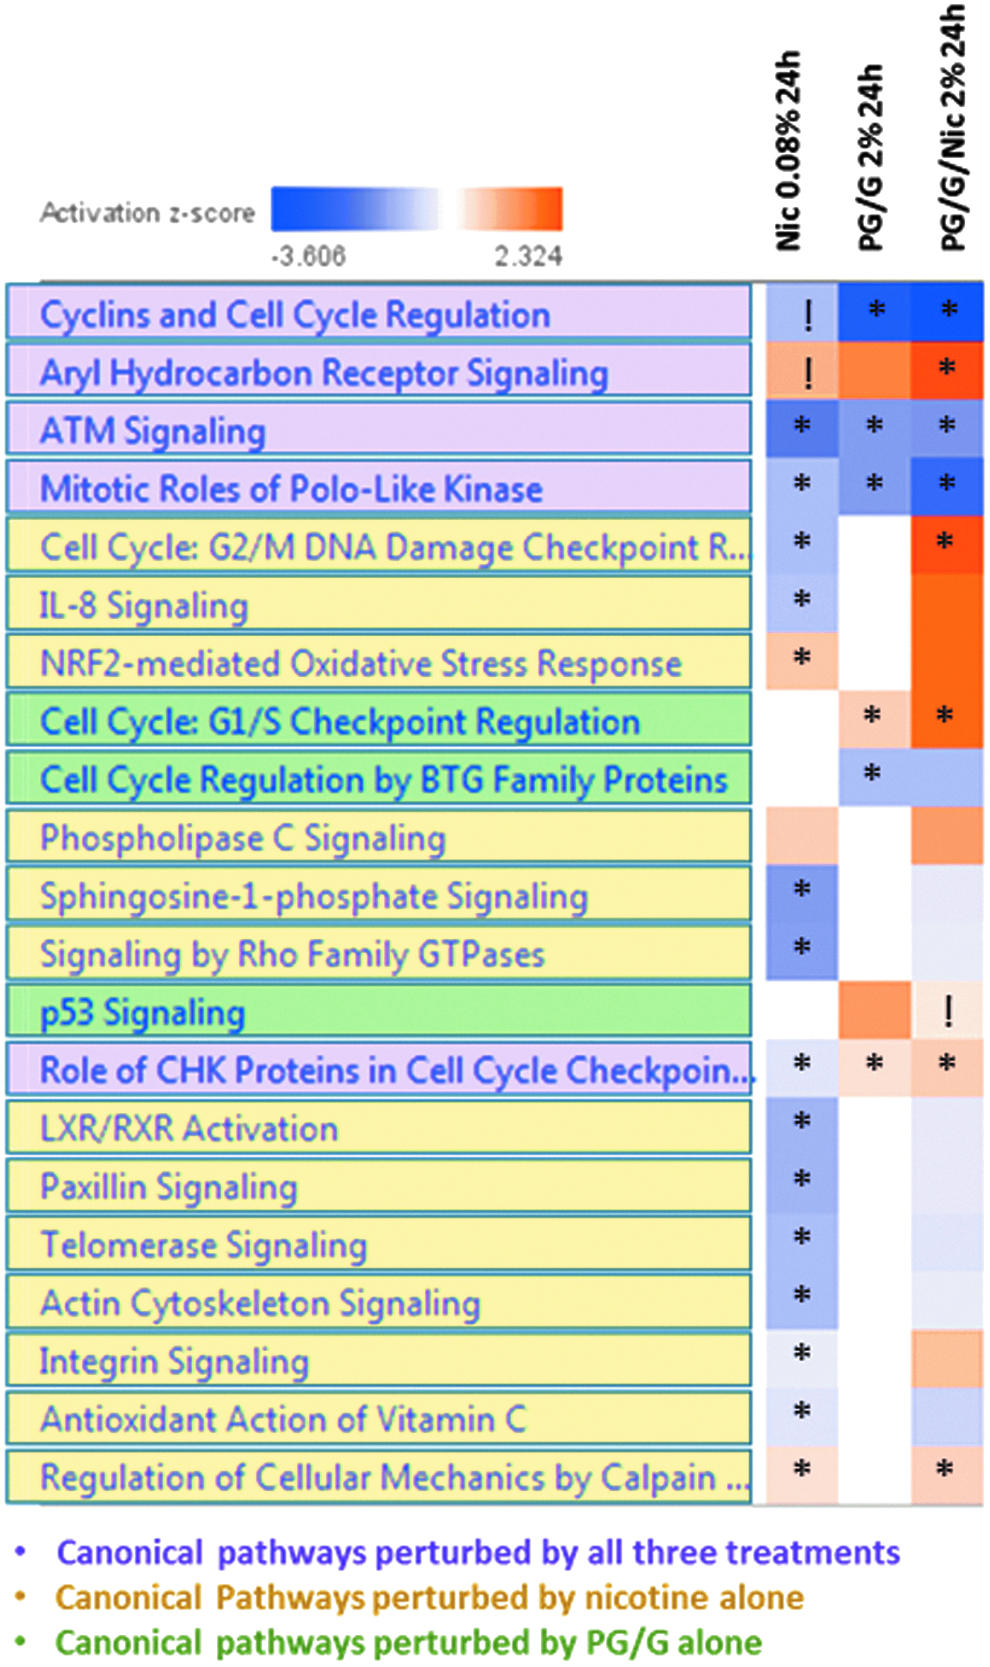
IPA® heatmap for canonical pathways after exposure to PG/VG, PG/VG/nicotine, or nicotine alone. Pathways are colored according to whether they were downregulated (blue), upregulated (orange), or unchanged (white) based on the z-score values. Canonical pathways commonly regulated by all three treatments are shown in pink. Nicotine-specific pathways are shown in yellow. PG/VG-regulated pathways are shown in green. *Indicates p < 0.05. !Indicates a p-value between 0.05 and 0.1 (Fisher's exact test).
In addition, we observed that PG/VG was able to activate additional pathways regulating cell proliferation (increased p53 signaling activation of G1/S checkpoint genes and repression of BTG family of proteins involved in the cell cycle). We analyzed canonical pathways affected by nicotine, such as activation of xenobiotic metabolism (aryl hydrocarbon receptor signaling). Upregulation of the oxidative response mediated by NRF2, signaling by Rho family GTPases, paxillin signaling, actin cytoskeleton signaling, and inhibition of different pathways involved in the cytoskeleton organization (sphingosine-1-phosphate signaling) were observed in all nicotine-containing treatments, but were only found to be significant on exposure to nicotine alone. In addition, we observed that nicotine induced inhibition of telomerase signaling and activation of phospholipase C signaling; this could suggest a perturbation in cell cycle progression. Other pathways affected by nicotine are cell cycle: G2/M DNA damage checkpoint response, IL-8 signaling, and integrin signaling. However, they seem to be inhibited by nicotine alone and activated in the presence of PG/G/nicotine.
IPA also provides an exploratory analysis platform to predict upstream regulators whose activation/inhibition may explain the observed gene expression patterns. In this study, we focused on the upstream regulators that are specifically altered in each of our treatments and whose target genes could explain the canonical pathways we found modified in Figure 3. The list of upstream regulators is shown in Supplementary Figure S8. Shown in Supplementary Figure S9, panel A, are the top upregulated and downregulated upstream molecules affected by all three treatments: FOXM1, NUPR1, RABL6, and p53. These regulators could affect the expression of different genes (CDC25, CDKs, PCNA, and E2F1) involved in cell cycle and xenobiotic metabolism pathways.
Interestingly, we found that SMARCA4 was the only upstream regulator that was specifically affected after nicotine treatment (Supplementary Fig. S9, panel B). SMARCA4 is able to control expression of genes involved in the canonical pathways that we found previously specifically perturbed after this treatment: ABCA1 (LXR/RXR signaling), E2F1 (telomerase signaling), GSTO1 (NRF2-mediated oxidative stress response), ITGA5 (paxillin, phospholipase C signaling), and MYLK and RAC2 (actin cytoskeleton signaling). Among the upstream regulators specifically affected by PG/VG treatment, we selected CREB1 (Supplementary Fig. S9, panel C), which is specifically expressed in bronchial cell types 33 and able to regulate expression of BIRC5, 34 a negative regulatory protein involved in apoptotic p53 signaling.
Network-based gene expression analysis
To gain further mechanistic insight into the molecular mechanisms behind the biological effects of nicotine, PG, and VG, gene expression data were interpreted through a series of biological networks purpose built for the lung and vascular tissue context (Supplementary Table S2). These networks included the following biological processes: cell proliferation, 35 cellular stress, 36 inflammatory processes, 37 and cell fate, 38 which comprise DNA damage, autophagy, apoptosis, necroptosis, and senescence. We used a threshold-free approach, which allowed us to include in the analysis those contrasts for which no DEG were observed. Relative biological impact factor (RBIF) values represent an aggregated biological impact in which the sum of all perturbations across all biological networks is calculated for each treatment. The resulting values are then normalized to both vehicle control, which is assigned a value of 0%, and to the reference, which is defined as the treatment showing the highest level of perturbation and assigned a value of 100%.
Figure 4 shows RBIF values for NHBE cells exposed for 24 hours to different concentrations of PG/VG (50/50), PG/VG/nicotine (50/50), and nicotine alone. The reference value used was the 0.08% concentration of nicotine, because this was the treatment with the highest level of overall network perturbation. The values of all other treatments are relative to this reference. In all cases, the RBIF values increased with treatment concentration. PG/VG (50/50) and PG/VG/nicotine (50/50) had similar RBIF values at all comparable concentrations. At a comparable nicotine concentration (0.04% nicotine), the RBIF value for PG/VG/nicotine was higher than that for nicotine alone.
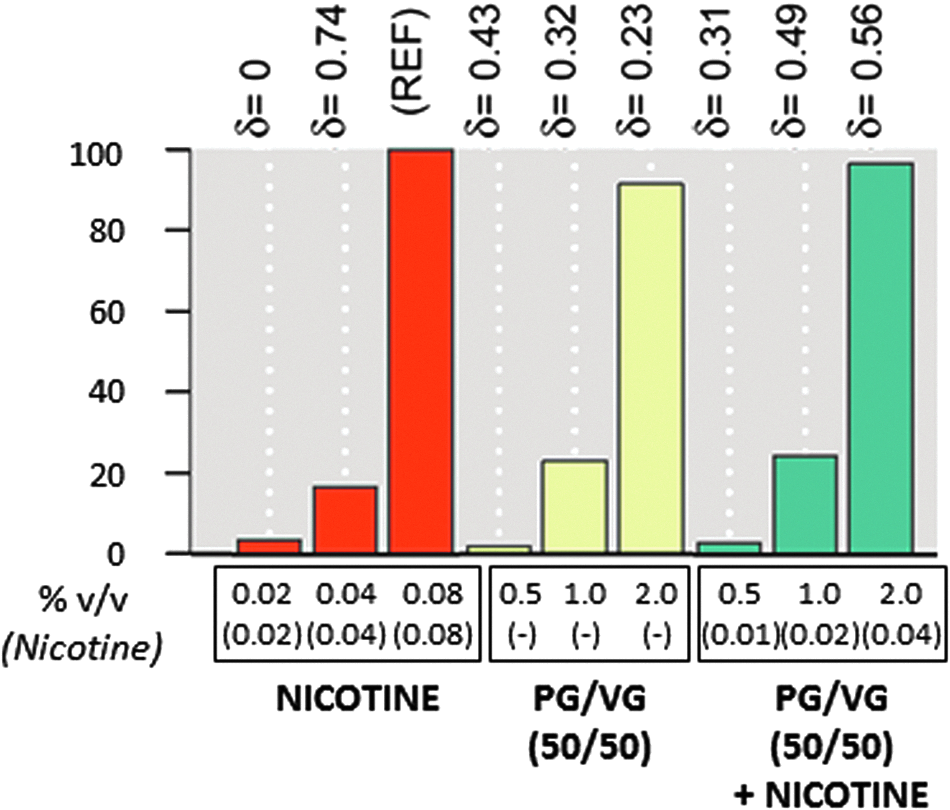
Network model-based analysis of the relative biological impact factor. The bar plot shows biological impact factor values normalized to both the vehicle control (which is given a 0% value) and the maximum response, used as REF and given a 100% value. The δ-values (−1 to 1) indicate how similar the underlying network perturbations are with respect to the REF. Scores were computed using transcriptomics profiling data from PG/VG (50/50), PG/VG/nicotine (50/50), and nicotine alone compared with vehicle-exposed cells. REF, reference.
RBIF values can be separated into the different mechanistic components contributing to the overall biological impact, namely cell fate, proliferation, cell stress, and inflammation. Figure 5 shows the biological processes that contributed most to the RBIF value in the form of a star plot. The surface area of each segment is proportional to the contribution within a particular treatment. Values are adjusted by the RBIF for the treatment compared with the reference, so that the sum of the segment areas for each treatment equals the BIF for the treatment. The results showed a very similar profile for PG/VG (50/50) and PG/VG/nicotine (50/50). The most perturbed network (that contributed the most to the RBIF values) in both cases was cell fate, followed by proliferation and cell stress. At comparable nicotine doses (0.02% and 0.04%), the overall level of perturbation in NHBE cells exposed to nicotine alone was lower compared with PG/VG/nicotine (50/50). Nevertheless, the profile was similar to that of the PG/VG mixtures. Cell fate was also the most perturbed network across all concentrations, followed by cell stress, inflammation, and proliferation.
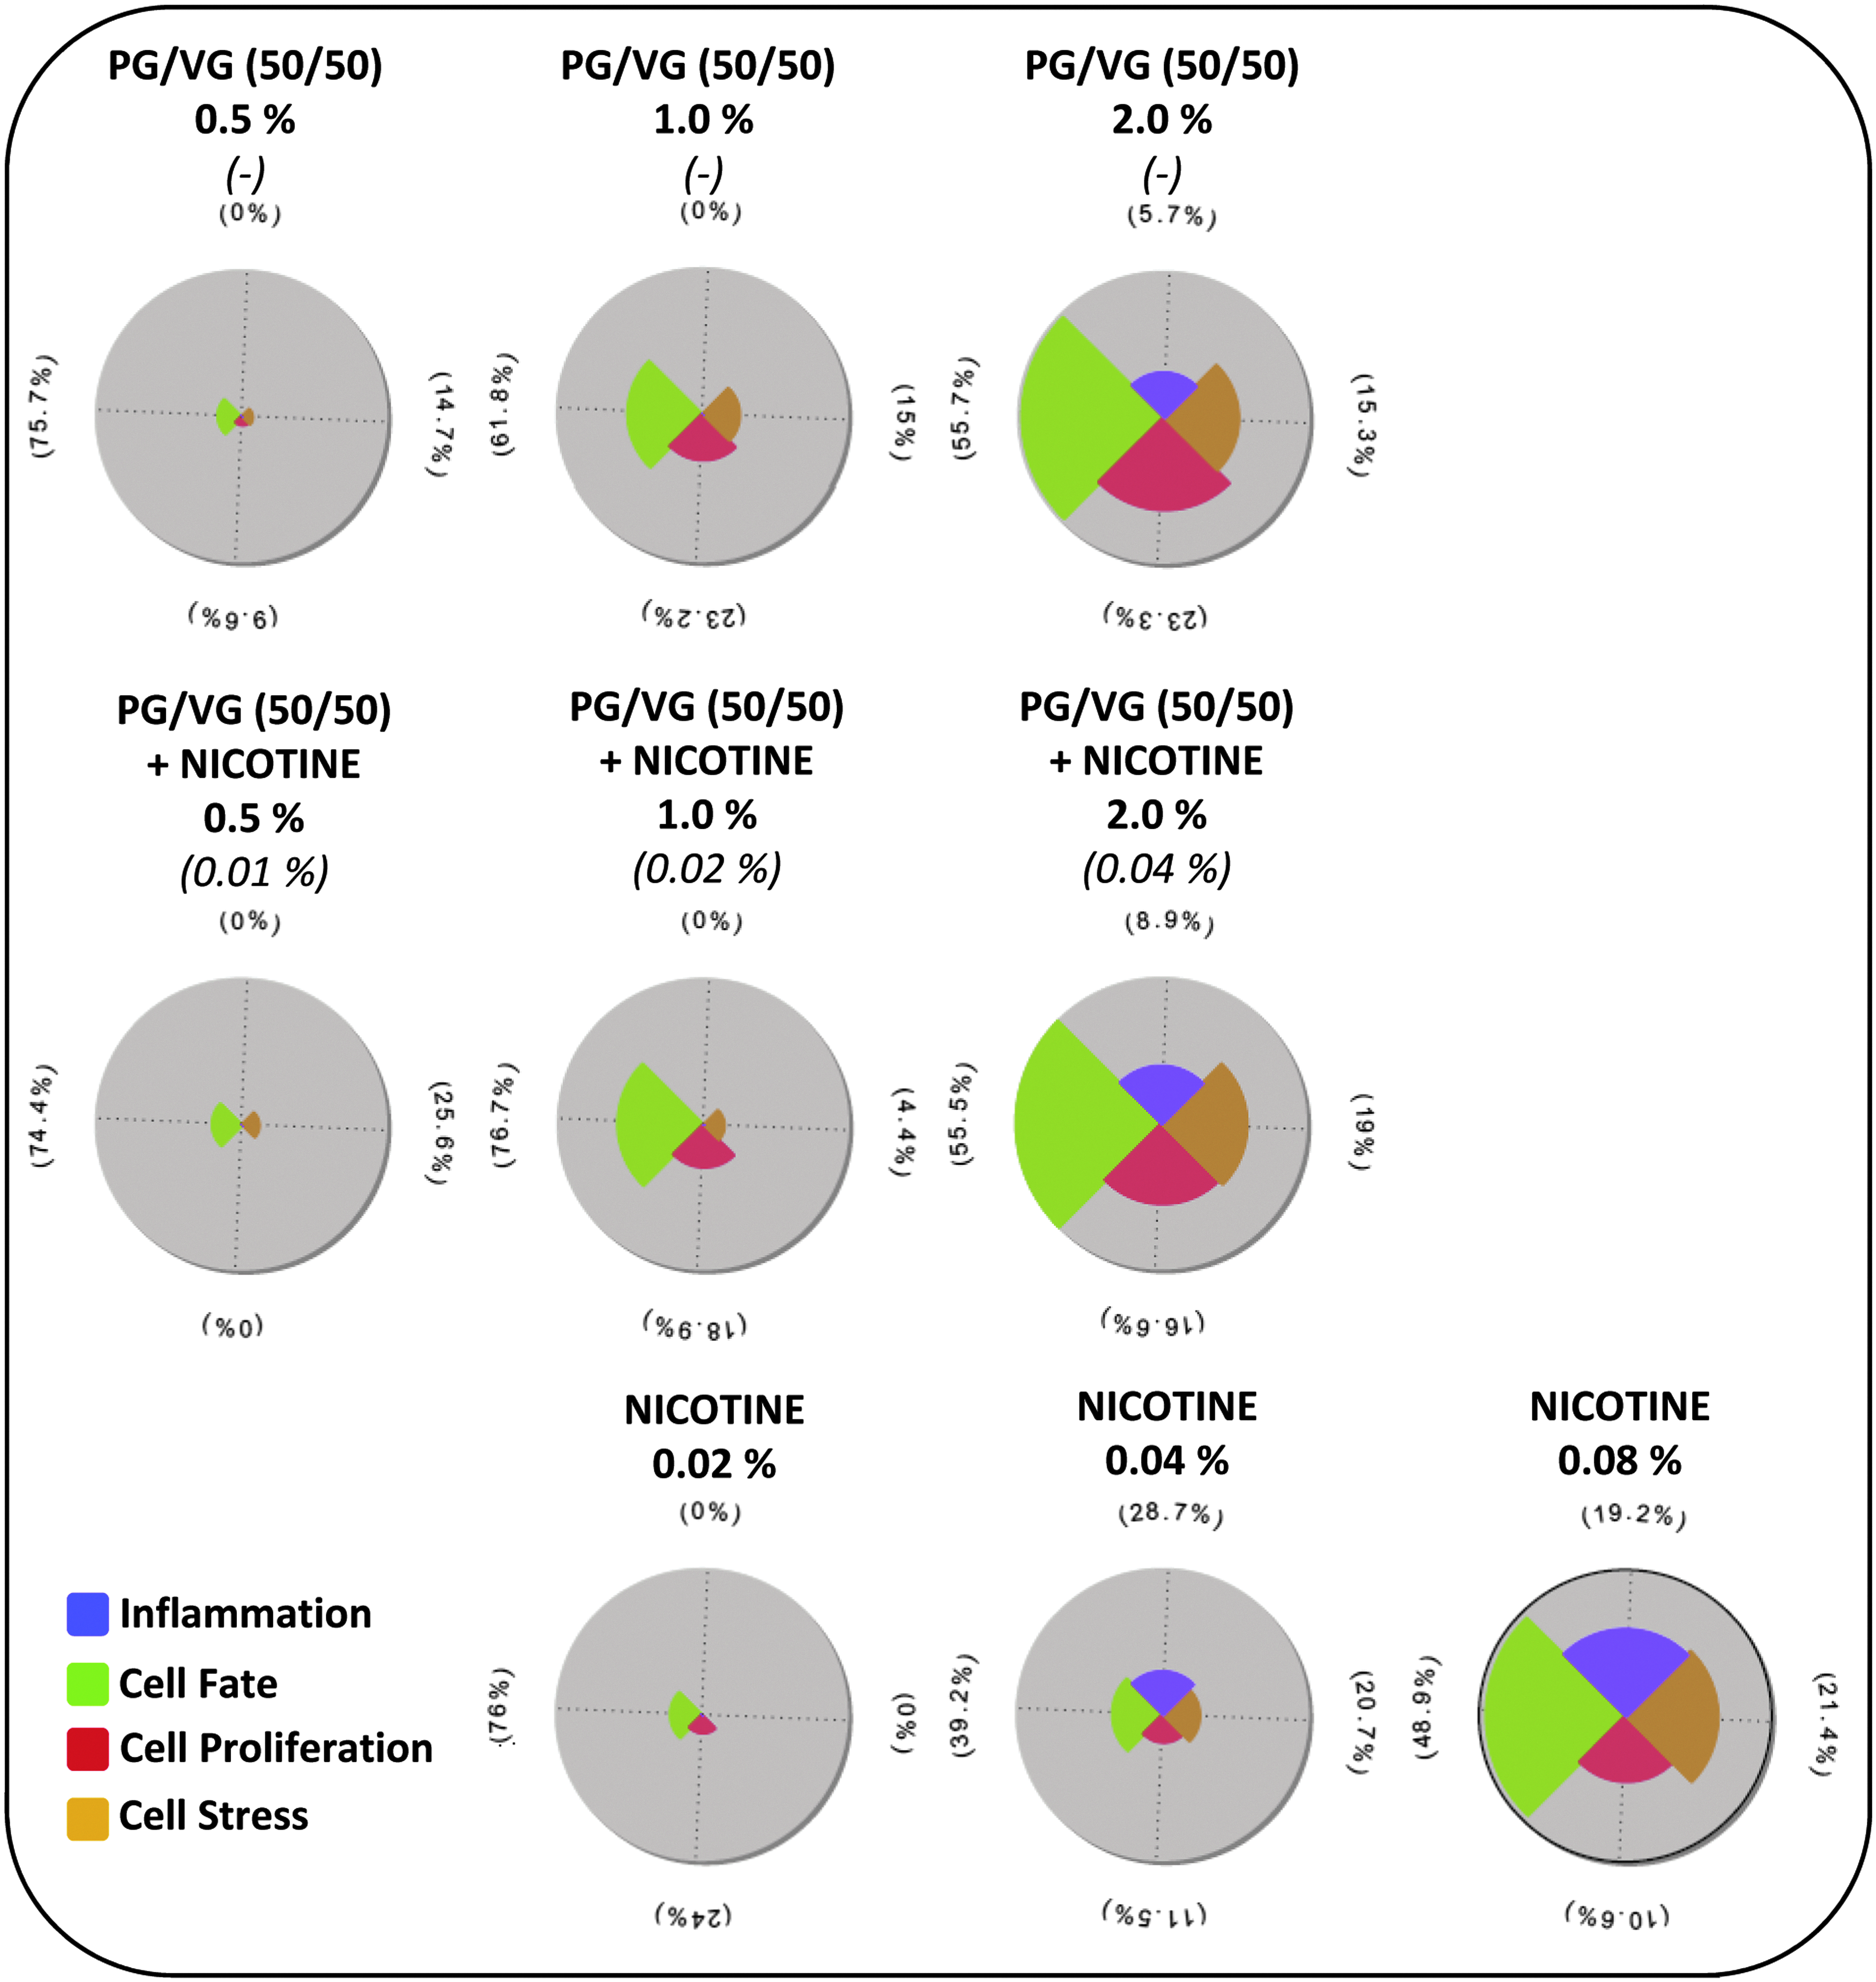
Biological impacts on the network models after 4 hours of exposure to PG/VG (50/50) mixtures or nicotine alone. The pie chart represents the distribution of the sum of contributions for each concentration across all biological networks. The surface area of the different segments within each plot is normalized to the dose showing the maximum level of network perturbation, which is used as a reference. The sum of all contributions for each treatment is 100%. Numbers outside the pie chart indicate the concentrations of the different fractions in % (v/v).
The mechanistic components contributing to the overall biological impact can be broken down into more specific subnetworks, therefore providing more granular mechanistic information. Figure 6 contains a heatmap of all the subnetworks that were significantly perturbed in at least one treatment. The level of network perturbation is determined by the NPA score. Values are normalized to the maximum NPA score within each subnetwork and plotted as a color scale. This type of representation allows for the comparison of the level of perturbation of a specific subnetwork across different solutions and concentrations. In general, exposure to PG/VG (50/50) and PG/VG/nicotine (50/50) showed again a very similar profile, both in terms of number of networks and the intensity of perturbation. At comparable nicotine levels, exposure to nicotine alone showed a lower level of perturbation compared with PG/VG/nicotine (50/50). At the highest nicotine concentration (0.08%), the number and intensity of the perturbed networks were more similar to the PG/VG (50/50) mixtures.
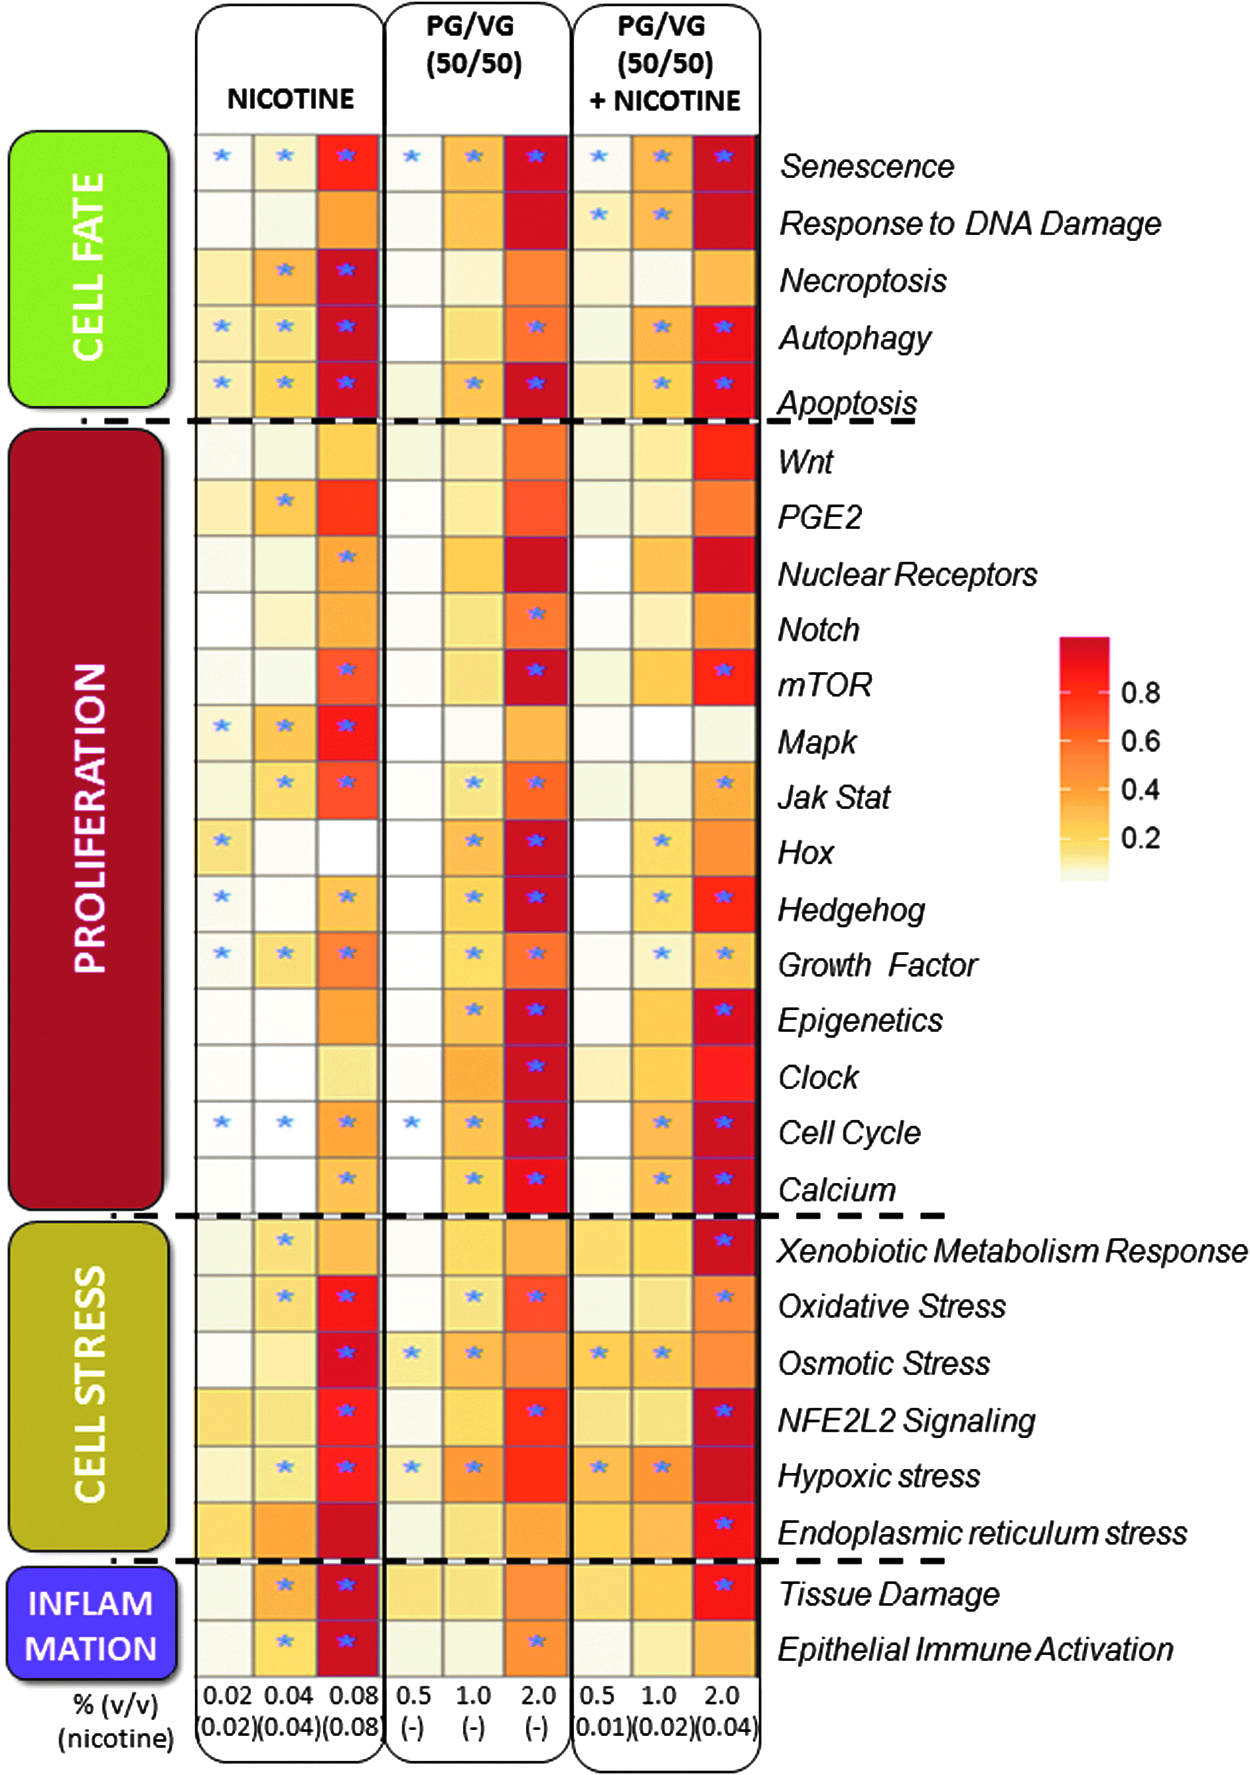
NPA heatmaps for NHBE cells exposed to PG/VG (50/50) mixtures or nicotine alone. The shading gradient for the NPA score was normalized to the maximum NPA score for each network. A network was considered to be significantly perturbed if the NPA score was significant after accounting for experimental variations and if the companion statistics O and K were significant (p < 0.05). The O and K statistics indicate the specificity of the NPA score with respect to the biology represented by the network. *Indicates that the NPA score was significant with respect to experimental variations and that the O and K statistics were significant. NPA, network perturbation amplitude.
Discussion
In this study, we investigated the biological effects of the most prominent ingredients of e-liquids, namely PG, VG, and nicotine, in primary human lung epithelial cells. The composition of the mixtures investigated matched the proportions of PG, VG, and nicotine commonly found in commercial e-liquids. Our goal was twofold. On the one hand, we wanted to determine the contribution of individual e-liquid constituents to the overall biological impact of nonflavored e-liquids. For this purpose, we exposed NHBE cells to a number of mixtures containing different proportions of PG, VG, and nicotine. On the other hand, we wanted to determine how the biological impact of e-liquids compared with standard NRT. For this purpose, the biological effects of the nicotine-containing PG/VG mixtures were compared with those observed when exposing NHBE cells to nicotine alone. We followed an approach that is in line with a recently proposed framework 15 for the systematic assessment of e-liquids and aerosols. Using a combination of multiparametric indicators of toxicity and gene expression analysis, we were able to identify and quantify the biological impact of exposure to different mixtures of PG, VG, and nicotine in lung epithelial cells.
Biological effects of PG and VG in NHBE cells
PG and VG are extensively used in the food, pharmaceutical, and cosmetic industries. They are also used in e-liquids as humectants and aerosol-forming agents. Both chemicals have low systemic toxicity and are generally considered safe when ingested or applied topically. However, their effects on the respiratory system are less well known, and available data are inconclusive. Some studies suggest that PG and VG may cause irritation in the airways.39,40 In two other studies, exposure to PG aerosols was associated with nasal hemorrhaging in rats 41 and alterations in goblet cells in the lungs of rabbits. 42 These effects were deemed as only moderate and likely to have been caused by irritation.
More recently, the toxicity of PG and VG was evaluated in the context of e-liquids, both in vivo and in vitro.12,13,43 A plethora of adverse effects, including changes in gene expression, release of inflammatory markers, increased oxidative stress, induction of DNA damage, and decreased cell viability, have been reported on exposure to e-liquids containing different proportions of PG and VG and no nicotine. Notably, all these studies were carried out using commercial e-liquid formulations that contained an undisclosed number of flavoring agents. Therefore, it is not possible to disentangle the contribution of the different constituents to the reported toxic effects.
In this study, the different PG/VG mixtures were prepared in-house using only high-purity chemicals. This allowed us to investigate the biological effects of PG and VG in the absence of potential confounding factors. We found that all tested PG/VG mixtures were able to induce cytotoxicity in NHBE cells, and the level of toxicity was proportional to the PG content in the mixtures (Table 2; Supplementary Fig. S1). These results were confirmed via HCS, where a dose-dependent decrease in cell count was observed in PG/VG (0/100), PG/VG (50/50), and PG/VG (100/0) (Supplementary Fig. S2–S4, panel A).
The molecular mechanisms of toxicity were further investigated in additional HCS-based endpoints. Exposure to PG/VG mixtures caused a decrease in MMP and/or mitochondrial mass, indicating the presence of damage to the mitochondria. These effects were also observed at slightly lower concentrations in the PG-containing mixtures compared with the VG-only mixture (Supplementary Fig. S2–S4, panels I, J). Impaired mitochondrial function may deplete cells of energy, which impacts key cellular functions. Consistently, all PG/VG mixtures showed an inhibitory effect on NHBE cell proliferation. We observed a decrease in the number of cells in S-phase and an increase in the number of cells in G0/G1 phase, suggesting cell cycle arrest (Supplementary Fig. S7).
These results were supported by the gene expression data generated in NHBE cells exposed to PG/VG (50/50), which showed downregulation of multiple pathways regulating cell cycle progression and proliferation (Fig. 3 and 6). Sustained mitochondrial damage will eventually lead to cellular death. However, despite robust evidence of the cytotoxic effect of PG/VG mixtures in NHBE cells, we did not observe an increase in any of the apoptosis/necrosis endpoints measured in this study.
These results were not entirely unexpected and similar effects have been previously described when cells are subjected to hyperosmotic stress. For example, exposure of HCT116 and HeLa cells to sorbitol caused a decrease in MMP, followed by the activation of caspase-independent apoptosis pathways. 44 The authors also observed that cytochrome C was not released into the cytoplasm, but was rather retained in the mitochondria. A similar decrease in MMP was also reported in sperm cells exposed to hyperosmotic concentrations. 45 The decrease in MMP was associated with increased cell death, without activation of caspases 3, 7, and 8, or an increase in cell membrane permeability.
Based on these results, we hypothesize that the toxic effects of the PG/VG mixtures on NHBE cells are likely because of osmotic shock. While it is true that none of the HCS assays specifically measured osmotic stress in the cells, the high osmotic concentrations measured in the PG/VG mixtures provide indirect, yet robust, evidence of hyperosmotic shock (Supplementary Fig. S6). Gene expression analysis in the PG/VG (50/50) mixture showed increased perturbation in the osmotic stress and apoptosis networks (Fig. 6). These results are in line with a previous study 15 where we observed a moderate increase in inflammatory mediators (i.e., Il-8 and CXCL1) and perturbation of the osmotic stress subnetwork in organotypic human bronchial epithelial tissues exposed to an aerosol generated by nebulization of PG/VG (70/30) mixtures with and without nicotine. Chemical analysis showed that the concentrations of PG, VG, and nicotine measured in exposed wells on aerosol exposure were in the same range as those used in this study.
Biological effects of nicotine in NHBE cells
Nicotine is a major constituent in tobacco smoke and can cause addiction. 1 Nicotine can also be toxic at sufficiently high doses, although it is generally not considered to be a major contributor to smoking-related diseases. 1 Nicotine poisoning has been documented in the article, mainly associated with oral or transdermal routes of exposure. However, the number of studies investigating acute toxicity of nicotine is limited, and the lethal dose in humans is still a matter of discussion.1,46 Another reason of concern is the potential adverse effects of repeated, low-dose exposure, as would be the case for ENDS users. Available data support the notion that nicotine can activate multiple molecular pathways regulating cell proliferation, although the long-term biological consequences of these effects are still unclear.1,47
In this study, the presence of nicotine increased the cytotoxicity of all PG/VG mixtures, independently of their composition. In this case, no correlation was observed with regard to PG content and all mixtures showed similar EC50 values by RTCA (Fig. 1; Supplementary Fig. S1). The results were then compared with nicotine alone. We observed that the concentration of nicotine at EC50 values of the PG/VG mixtures was similar to the EC50 value for nicotine alone (Table 2). This is a very relevant finding because it would indicate that nicotine is the main toxicity driver in nicotine-containing PG/VG mixtures and there is no additive toxic effect with PG and VG. In other words, the toxicity of nonflavored e-liquids would be similar to that of standard NRT at similar nicotine deliveries. Whereas the cytotoxic effect of PG and VG is likely because of the high osmolarity, nicotine did not affect the osmotic concentration of the PG/VG mixtures (Fig. 3). This suggests that additional biological pathways are being impacted in NHBE cells exposed to nicotine-containing PG/VG mixtures.
To further investigate the underlying molecular mechanisms, we measured a number of HCS-based endpoints in three mixtures containing the same nicotine levels but different proportions of PG and VG.
Contrary to their nicotine-free counterparts, nicotine-containing PG/VG mixtures showed a positive response in most HCS-based endpoints (Table 3). For example, we observed a decrease in GSH levels, indicating the presence of oxidative stress. In addition, we observed an increase in typical markers of apoptosis, such as caspase 3/7 activity and the release of cytochrome C from mitochondria. Furthermore, all nicotine-containing treatments except for the PG/VG (50/50) mixture showed an increase in cell membrane permeability, a well-known marker for late apoptosis or necrosis.
Similar responses have been previously reported on exposure to nicotine. For example, El-Sokkary et al. observed increased levels of lipid peroxidation and decreased GSH levels in the liver and lungs of nicotine-treated rats. 48 Similarly, Bodas et al. showed that exposure to nicotine alone caused an increase in ROS, leading to increased senescence and apoptosis in the bronchial epithelial cell line Beas2b and in the lungs of mice administered intranasal nicotine. 49 Finally, Ramage et al. observed an increase in cytochrome C release in A549 lung epithelial cells exposed to nicotine concentrations similar to those used in this study. 50
In this study, we observed similar response profiles when NHBE cells were exposed to nicotine alone (Table 3), further supporting the notion that nicotine is driving the increase in cytotoxicity observed in nicotine-containing PG/VG mixtures with respect to their nicotine-free counterparts.
By contrast, no major differences with regard to the inhibition of cell proliferation were observed between nicotine-containing and nicotine-free PG/VG mixtures (Supplementary Fig. S7). Reported effects of nicotine on cell proliferation, particularly in in vitro studies, are widely heterogeneous.
Some studies have shown that nicotine exposure can promote cell proliferation and survival,51,52 whereas other studies have reported the opposite effect, with nicotine inhibiting cell proliferation and causing apoptosis.53,54 The apparent lack of consistency is likely because the effects of nicotine depend on multiple parameters, such as cell type and context, type and duration of exposure, and the array of nicotinic receptors expressed in the cells.
In this study, our goal was not to investigate the role of nicotine in cell proliferation per se, but rather to determine whether its biological effects on the cells were different when used alone or in the context of an e-liquid. Based on the observed cytotoxicity, we would have expected an inhibitory effect of nicotine in NHBE cells. Unfortunately, the cell cycle endpoint was not measured in cells exposed to nicotine alone, and a clear conclusion cannot be drawn. Nevertheless, results from gene expression analysis provide evidence that nicotine is indeed inhibiting cell proliferation.
NHBE cells exposed to either nicotine alone or nicotine-containing PG/VG mixtures showed downregulation of the canonical pathways that promote proliferation, whereas pathways promoting cell cycle arrest were upregulated (Fig. 3; Supplementary Fig. S8 and S9). Furthermore, a number of cell proliferation subnetworks were also found to be significantly perturbed (Fig. 6). Most of these subnetworks were also perturbed in the nicotine-free PG/VG mixtures, suggesting that overlapping molecular pathways are being impacted by nicotine and PG/VG. Interestingly, when compared on the same-nicotine basis (0.04% nicotine), the intensity of the perturbation was higher in the nicotine-containing PG/VG mixtures compared with nicotine alone (Fig. 6).
The same effect was observed for the cell stress, cell fate, and inflammation subnetworks. Taken together, the data suggest that the biological effects of the nicotine-containing PG/VG mixtures are due to the combined toxicity of its different components. Gene expression analysis indicates that PG and VG had a higher effect than nicotine on the NHBE cell transcriptome. However, results from the HCS and RTCA indicate that nicotine is a major driver of toxicity in nicotine-containing PG/VG mixtures. Taken together, the data indicate that the biological effects of nicotine in NHBE cells are complex and likely involve transcriptional and nontranscriptional mechanisms.
Conclusions
This study demonstrates that systems toxicology approaches are useful to investigate the biological effects of e-liquids and standard NRT in lung epithelial cells. We found that both PG and VG can induce cytotoxicity in NHBE cells and that hyperosmotic shock is the most likely mechanism for this effect. We also demonstrated that nicotine increased the toxicity of PG and VG mixtures by activating additional, yet overlapping, molecular pathways that ultimately lead to increased apoptosis. Notably, we also showed that the toxicity of nicotine-containing PG/VG mixtures is similar to that of nicotine alone. The data strongly suggest that, in the absence of flavoring agents, the toxicity of e-liquids is similar to that of NRT.
The results of this study are relevant in the context of the toxicological assessment of e-liquids. On one hand, the composition of the tested mixtures represents well the levels of PG, VG, and nicotine typically found in commercial e-liquid formulations. On the other hand, mixture concentrations that showed biological activity in NHBE cells can potentially be achieved when exposing lung epithelial cells to ENDS aerosols. Taken together, our results support the notion that ENDS represent a less harmful alternative to cigarette smoking and thus can help to decrease the burden of CS-related diseases.
This study has some limitations that need to be addressed in future studies. For example, we used NHBE cells derived from a healthy human donor with no history of smoking. However, in the context of using ENDS as a potential cessation device, exposing lung epithelial cells from smokers and comparing the results against both standard NRT and vehicle-treated cells would be very helpful. NHBE cells were exposed to liquid mixtures containing PG, VG, and nicotine, but not to heated aerosols generated from an ENDS device. This approach allowed us to systematically screen a large number of e-liquids in a time-efficient manner and produce results that can be easily reproduced by other groups.
Given the numerous types of ENDS devices available on the market, this aspect would have been more challenging with aerosols. Nevertheless, our type of exposure does not recapitulate typical ENDS use and does not allow for the investigation of the effects of chemical species and particles that can potentially be generated during aerosolization. Evaluating the toxicity of heated aerosols is, therefore, an important step in the toxicological assessment of ENDS. Another limitation in this study is that we only focused on the acute effects of nicotine, PG, and VG on the cells. Therefore, future studies should compare the toxicity of ENDS and NRT over longer periods of time and on repeated exposures. In this study, the use of organotypic cultures would be an advantage. These systems can better recapitulate the tridimensional structure of the lung. At the same time, the existence of an air–liquid interface allows for exposure to aerosols, which better resembles the use of ENDS devices and NRT inhalers.
Footnotes
Acknowledgments
The authors thank Davide Sciuscio and Patrick Vanscheeuwijck for critical review of the article, Carine Poussin for useful suggestions with the statistical analysis, and Vincenzo Belcastro for the submission of the gene expression data to ArrayExpress.
Author Disclosure Statement
All authors were employees of Philip Morris International at the time of this study. Philip Morris International is the sole source of funding and sponsor of this project.
References
Supplementary Material
Please find the following supplemental material available below.
For Open Access articles published under a Creative Commons License, all supplemental material carries the same license as the article it is associated with.
For non-Open Access articles published, all supplemental material carries a non-exclusive license, and permission requests for re-use of supplemental material or any part of supplemental material shall be sent directly to the copyright owner as specified in the copyright notice associated with the article.