
Abstract
Background:
The cellular composition of the tumor immune microenvironment (TIME) is a key contributor to the response of the tumor to immunotherapy. Transforming growth factor-beta (TGF-β) signaling is known to promote immune exclusion, where CD8+ T cells are in the surrounding stromal tissue but not within the tumor itself. To better identify patients with an immune-excluded phenotype, we developed two machine learning (ML) models to quantify CD8+ cell positivity and classify the immunophenotype of a histological cancer specimen.
Methods:
Immunohistochemistry against CD8 was performed on nonsmall cell lung cancer (NSCLC) samples (N = 200) and digitized whole slide images (WSIs) were then generated. ML models, trained on these WSIs, identified relevant tissue regions (cancer epithelium, stroma) and cell types (CD8+ lymphocytes). Features related to CD8, including overall CD8+ count proportion, CD8+ count proportion in cancer epithelium, and CD8+ count proportion in cancer-associated stroma, were extracted for the ML-based approaches to predict immunophenotypes. In the cutoff model, data-driven cutoffs were applied to model-generated human interpretable features of CD8+ count proportion within cancer epithelium and cancer-associated stroma, whereas in the spatial model, all tissue and cell model predictions within the TIME were used to train a graph neural network to classify immunophenotypes.
Results:
An inverse correlation was observed between TGF-β signaling and manually determined CD8+ cell levels. CD8 quantification model predictions showed high concordance with pathologist consensus annotations for all model classes. Concordance of model-derived immunophenotype predictions with ground truth pathologist-derived immunophenotype consensus labels was comparable with concordance of an average pathologist with the same ground truth consensus. Significant associations were seen between immunophenotypes (derived from ground truth and model predictions) and relative abundance of T cell populations and PD-L1 activity gene signature scores, while a trend was observed between immunophenotypes and a gene signature indicative of TGF-β signaling.
Conclusions:
We developed a digital pathology approach that can characterize and classify the cancer immunophenotypes in a reproducible and scalable manner, paving the road for the application of such a method to identify patients who may benefit from immunotherapy and/or TGF-β blockade in NSCLC.
Introduction
Lung cancer remains the leading cause of cancer-related death in the United States and worldwide, and nonsmall cell lung cancer (NSCLC) is the most common histological subtype. 1 Many therapeutic strategies have been implemented to target actionable genomic alterations in lung cancer. However, these approaches have only provided incrementally improved prognosis for patients, as resistance to targeted therapeutics inevitably occurs in most patients.2,3
Another common treatment strategy for NSCLC is immunotherapy, especially immune checkpoint blockade (ICB). ICB strategies involve the suppression of T cell activation inhibitors, such as PD-1, PD-L1, and CTLA4. 4 The first ICB agent approved for NSCLC was nivolumab, a PD-1 inhibitor, based on results from the CheckMate 017 and 057 clinical trials.5–7 Subsequently, approvals for pembrolizumab (a PD-1 inhibitor) and atezolizumab (a PD-L1 inhibitor) were granted based on observed responses in ICB-treated patients.8–13
Long-term follow-up results are now available for many of the seminal ICB clinical trials in NSCLC. Four-year overall survival rates for atezolizumab were nearly doubled compared with those for docetaxel, 14 whereas 5-year overall survival rates for nivolumab and pembrolizumab showed similar results.15,16 More recently, the PD-1 inhibitor cemiplimab, either as monotherapy or in combination with chemotherapy, was assessed in the EMPOWER-1 and EMPOWER-3 trials, respectively. In these trials, cemiplimab was shown to significantly reduce the risk of death and extend overall and progression-free survival compared with chemotherapy alone in the first-line setting, leading to FDA approval for this drug for patients with specific PD-L1 levels.17–19
Furthermore, although some NSCLC patients treated with ICB do show prolonged responses, including in excess of 5 years, the median overall survival remains under 2 years.14–16 The ability to accurately predict patients who are likely to respond would greatly aid in the design and execution of future ICB clinical trials in NSCLC. The low median overall survival that has been observed for ICB agents may be due to mechanisms that promote tumor immune evasion. It has been reported that a large number of immune cells present in the tumor stroma could impact tumor progression, including cytotoxic CD8+ T cells (CTLs).
Tumor immune microenvironment (TIME) classifications depend on the relative location of these CTLs. Classifications include immune inflamed (immune cells infiltrated into tumor core), immune excluded (CTLs present but not infiltrated into tumor), and immune desert (CTLs largely absent from tumor and stroma).20–23 TIMEs classified as immune excluded and immune desert are typically not immunogenic. In contrast, inflamed TIMEs are considered immunogenic and are characterized by PD-1(+) CTLs. Tumors with immune-inflamed TIMEs are, typically, more likely to respond to ICB.
In cancer settings, transforming growth factor-beta (TGF-β) demonstrates a profound influence on the cancer cells themselves, the TIME, and the antitumor immune response.24,25 Targeting the TGF-β pathway in patients who have relapsed or shown resistance to checkpoint inhibitors is an active area of research. The TGF-β pathway plays a critical role in immune suppression and tumor progression by inhibiting the immune response and promoting tumor growth and metastasis. 26 In addition, TGF-β signaling in the tumor microenvironment can contribute to immune cell exclusion, a phenomenon wherein immune cells are unable to effectively infiltrate the tumor and mount an antitumor immune response. 27
By inhibiting TGF-β signaling, the immunosuppressive effects of the tumor microenvironment can be reduced, thereby promoting immune cell infiltration, potentially leading to enhanced antitumor immune responses. Since TGF-β signaling in the tumor microenvironment can contribute to the immune cell exclusion phenomenon, a major barrier to successful immunotherapy, patients with an immune-excluded phenotype might benefit from TGF-β blockade, alone or in combination with ICB. Nevertheless, the translation of TGF-β inhibitors into the clinical setting has been hampered by the lack of effective patient-selective approaches. As such, improved predictive biomarkers are necessary to maximize the potential of this therapeutic strategy. 28
Given the potential importance of the immune milieu of a tumor for response to both ICB and TGF-β blockade, we hypothesize that immune phenotypes have the potential to act as a biomarker in this regard. Gold standard methods for immune phenotyping using CD8 immunohistochemistry (IHC) involve the manual scoring of CD8+ T cells within the tumor microenvironment to assess their distribution, density, functional state, and spatial organization. Despite the importance of CD8+ T cell localization as a potential biomarker in cancer, it is extremely difficult for pathologists to make these classifications during standard manual review of clinical specimens.
Unlike for PD-L1, for which there are multiple FDA-approved IHC assays,29,30 there are currently no standardized assays for clinical CD8 assessment. Furthermore, the cellular complexity of the TIME, as well as pathologist variability and subjectivity, makes the manual determination of TIME status incredibly challenging.24,30–34 In this regard, approaches such as digital pathology—computational analyses of digitized images of histological specimens—may prove useful. Indeed, computational models are proving to perform at least as well as manual assessment in biomarker analyses of oncology clinical trial specimens. 35
Given the potential for digital pathology approaches in oncology, we sought to develop an approach that uses computer vision models to predict TIME features in NSCLC. Herein, we describe two distinct machine learning (ML) models that predict immune phenotypes from CD8-stained NSCLC tissue, and we validate their performance through concordance with manual pathologist assessment and correlation with relevant gene expression signatures.
Methods
Data set description
Formalin-fixed paraffin embedded NSCLC tumor blocks (N = 200) were acquired from commercial sources (BioIVT and Cureline) and subsequently sectioned onto slides, stained, imaged, and manually scored at a central laboratory (Labcorp., Indianapolis, IN). Staining with hematoxylin and eosin (H&E) and IHC to detect CD8 (SP57; Ventana Benchmark XT) was performed on these slides. H&E and IHC slides were scanned at a resolution of 0.25 μm per pixel (40 × objective) using the Aperio AT2 scanner (Leica Biosystems, Vista, CA) to generate whole slide images (WSIs).
Images were manually assessed to establish a consensus score by two board-certified pathologists, who provided the percentage of CD8+ T cells present within the whole tumor region and expressed in increments of 5% for those areas containing >10% positive cells. Samples with infiltrations greater than the median level (10%) were classified as CD8-high, and samples with infiltrations less than or equal to the median level were classified as CD8-low.
Development and validation of an ML model to quantify CD8 positivity
ML models were developed to quantify CD8 expression in digitized WSI of NSCLC samples. Three deep convolutional neural networks were trained to classify tissue regions and cell types. An artifact model was trained to distinguish regions of artifact (e.g., blur and tissue folds) from slide background and evaluable regions of tissue free of artifact. Within regions of evaluable tissue, a tissue model was trained to classify cancer epithelium, cancer-associated stroma, necrosis, and normal (nontumor) tissue. Within the tumor region, a cell model was trained to detect and classify CD8+ lymphocytes, CD8– lymphocytes, and other nucleated cells. No other CD8 detection software was used for these studies.
Annotations used to train models (e.g., artifact, cancer epithelium, CD8+ cells) were provided by board-certified pathologists, and quality control review of annotations was completed before training. Training and validation of all models occurred with CD8-stained WSIs from 199 unique cases. Corresponding negative control slides stained with an isotype control reagent (DA1E; Cell Signaling Technology, Danvers, MA) 36 and H&E samples were utilized as reference during annotation collection and model validation.
Three additional cases were excluded from model development because they did not contain enough evaluable tissue, due to a high percentage area of blur and tissue folds. The cases used for model development were randomly split into training (60%), validation (20%), and held-out test (20%) slides while ensuring splits were balanced across relevant metadata including (1) adenocarcinoma, squamous versus other (solid+neuroendocrine), (2) vendor, and (3) individual cases. The final split was 125/36/38 cases.
The 38 test cases were completely held out from all development until model training was complete, at which point the finalized locked models were deployed and assessed on these cases. Evaluation of the cell model performance occurred through comparison of model predictions with a consensus of five pathologist annotations on eighty-two 75 × 75 μm regions of interest, or “frames,” which were sampled throughout the tumor area of the test slides to ensure adequate representation. 37
Correlation analysis was used to compare the median number of cells of each cell type (e.g., CD8+ lymphocyte, CD8– lymphocytes, other cells) identified by pathologists and the cell model. Adequate performance was defined as the Pearson correlation between model and consensus counts being within the confidence intervals for average annotator versus consensus correlation.
Development and validation of models to predict immunophenotypes
For immune phenotyping, ML-generated tissue region and cell type predictions were used together with pathologist consensus ground truth immunophenotype labels. For each sample, five pathologists estimated intratumoral CD8+ cell density within cancer and cancer stroma regions, which was used to derive majority consensus labels of desert, excluded, and inflamed phenotypes. The data set was divided into training, validation, and test sets, and two methods were compared (Fig. 1A).
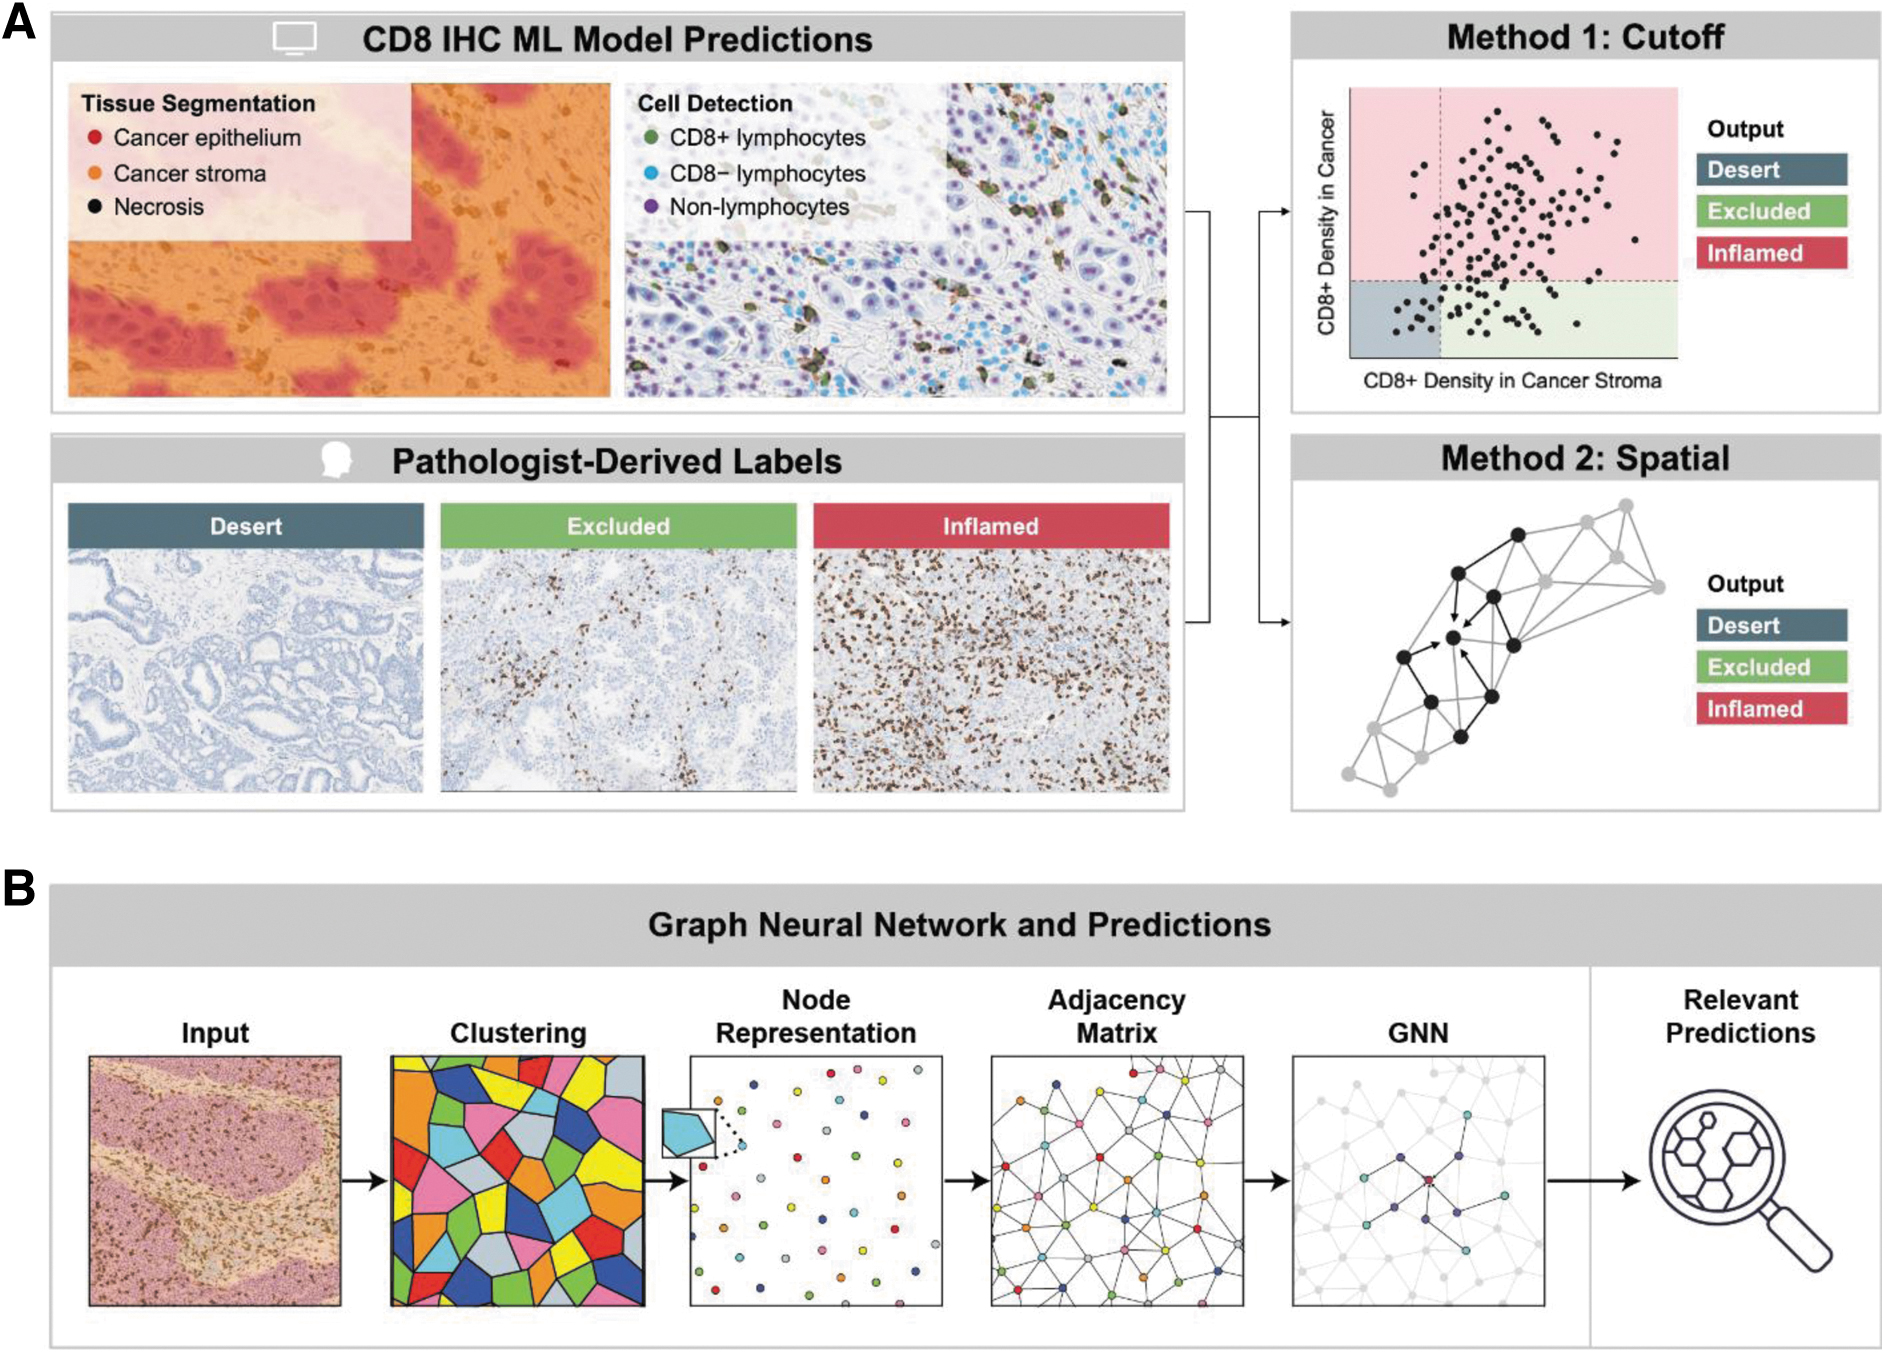
Digital pathology approaches to immune phenotyping.
In the cutoff method, elected cutoffs were applied to model-generated features to assign immunophenotypes. For this method, a two-parameter classifier was trained based on two model-generated features that capture immunophenotype patterns in the tumor: count proportion of CD8+ cells in the stroma and count proportion of CD8+ cells in the cancer epithelium. These two features form a pair of coordinates for each patient WSI. For each WSI and pair of coordinates in the training and validation sets, we performed a cutoff search across both coordinates and measured the weighted F1 between labels derived from the cutoffs and labels from pathologist ground truth.
This metric was generated after computation of the agreement (F1) for each label (desert, excluded, and inflamed) and was weighted by the number of data points for each label, accounting for any label imbalance. Bootstrapping grid search procedure was executed for cutoff pairs. The 25th-percentile of the score was measured for each cutoff pair across bootstrap replicates, and the cutoffs maximizing this statistic were selected as it combines search for efficacy with some weight toward lower variance across data resampling.
In a parallel approach, model-generated tissue and cell overlays were used to train a spatial model, a graphical neural network (GNN)38–40 (Fig. 1B), to predict immunophenotypes. Immunophenotyping classification using a 20% cancer CD8 positivity threshold and 20% cancer associated stroma CD8 positivity threshold is presented. GNN predictions for each WSI were clustered into superpixels to construct the nodes of the graph. To improve computational efficiency, pixels were randomly sampled from each WSI and clustered based on their spatial coordinates using the Birch clustering method.
Each GNN pixel prediction was assigned to the cluster of its nearest neighbor in the clustered subset of ∼5000 pixels. This process reduced the hundreds of thousands of pixel-level predictions to thousands of superpixel clusters. WSI regions predicted as background and normal tissue were excluded from the clustering process. A directed graph with edges between each node and its five nearest neighbors was constructed using the K nearest neighbor algorithm, and self-loops were also incorporated. Each graph node was represented by three classes of features generated from previously trained GNN predictions, which were predefined to be biological classes of known clinical relevance.
The spatial features included the mean and standard deviation of the (x, y) coordinates of the node. The topological features included the area, perimeter, and convexity of the cluster. The logit-related features included the mean and standard deviation of the logits for each of the classes of GNN-generated overlays (Fig. 1B).
RNA-seq analysis
RNA-seq data were processed as follows: sequencing reads were mapped to the reference genome GRCh 38 using Spliced Transcripts Alignment to a reference aligner. 41 The gene expression was initially measured in FPKM (fragments per kilobase million) by cufflink, 42 and the gene-level FPKM was converted into TPM (transcripts per kilobase million). The TPM values were log2 transformed and quantile normalized for the downstream analysis including differential gene expression analysis. A computational method, gene set variation analysis, was utilized to calculate gene signature scores such as the TGF-β pathway activation scores.43–45 In addition, the abundances of immune and stromal cells were estimated by a deconvolution method, MCP counter. 46
Statistical analyses
To evaluate the performance of the cutoff and spatial models, weighted F1 scores and unweighted Cohen's kappa scores were calculated on both the held-out test set and the combined training and validation set. These metrics were qualitatively compared with individual pathologist concordance and with the consensus. Descriptive statistics were computed for biomarker characteristics. For comparisons of gene expression signatures, one-way analysis of variance (ANOVA) was used to compare variances across the means of predefined subgroups. p values from the ANOVA were considered significant if <0.05. Plots were generated using R software version 4.0.4. (R: a language and environment for statistical computing).
Results
Association between TGF-β gene expression with CD8 levels in NSCLC
Given the known association between TGF-β cytokine levels and tumor immune exclusion,28,47 we sought to correlate the relationship between TGF-β and CD8 levels in a cohort of NSCLC samples. CD8+ cell levels were assessed by manual scoring after CD8 IHC (LabCorp.), and the activated TGF-β pathway signature score levels 43 in the tumor sample were assessed by RNAseq in matched tissues from these cases. Infiltration of CD8+ cells was classified as low (≤10% infiltration) or high (>10% infiltration). As shown in Figure 2, higher levels of the TGF-β pathway activation score were observed in cases with lower CD8+ cell infiltration.
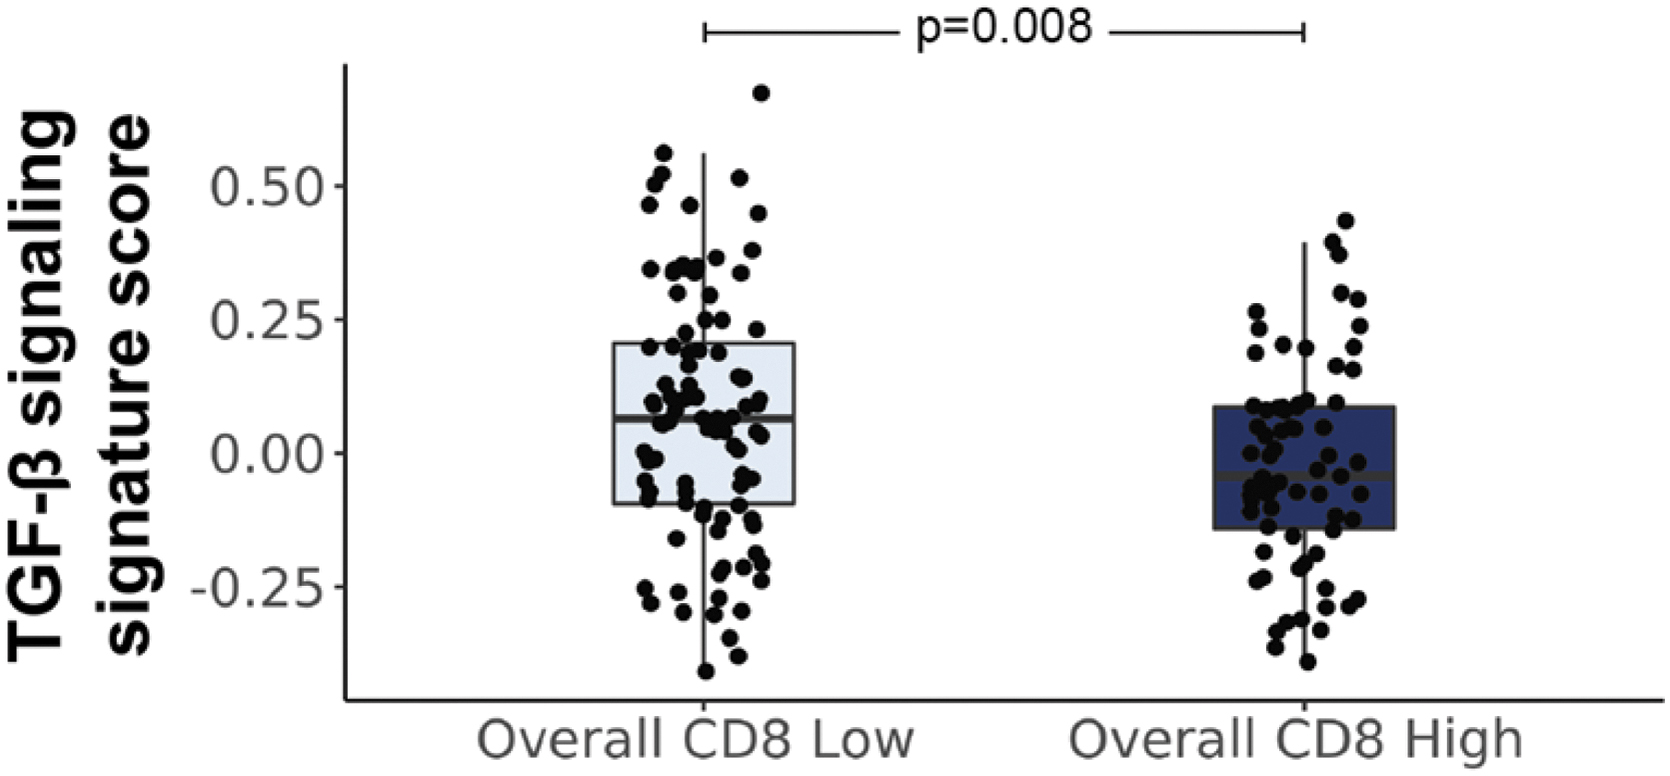
Association between TGF-β gene expression signature and CD8 infiltration. Levels of CD8 were assessed by manual scoring of CD8 IHC and compared with a TGF-β transcriptomic signature from patient-matched tissue (For CD8 IHC low, N = 96, median = 0.06, mean = 0.07, SD = 0.23; for CD8 IHC high, N = 71, median = −0.04, mean = −0.02, SD = 0.19). An inverse relationship between TGF-β gene signature scores and CD8 levels was observed. Median gene signature levels ±1.5 times the interquartile range are shown. SD, standard deviation; TGF-β, transforming growth factor-beta.
ML-based immunophenotyping in NSCLC
Although our observed inverse association between TGF-β gene signature levels and manually annotated CD8 levels in NSCLC was intriguing, manual analysis of the TIME, including CD8+ scoring, is challenging due to inter-reader variability and lack of established standardized manual assays.24,30–34 Therefore, we sought to develop a more quantitative approach to assess CD8+ cell numeration and infiltration. As such, we developed a digital pathology approach for quantifying CD8 infiltration and predicting immune phenotyping in NSCLC (Fig. 2).
ML models were developed using digitized WSIs to identify relevant tissue regions (cancer epithelium, stroma, necrosis; “tissue model”) and cell types (CD8+ lymphocytes, CD8– lymphocytes, and other cells; “cell model”). From these models, human interpretable features (HIFs) relating to CD8 were extracted, including overall CD8+ cell count proportion, CD8+ count proportion in cancer epithelium, and CD8+ count proportion in cancer-associated stroma.
To assess the performance of our cell model, model predictions were compared with a consensus of annotations from five expert pathologists using Pearson correlation. The average correlation of a single manual pathologist annotator with consensus was also calculated. Model predictions showed high concordance with consensus for all cell model classes, with Pearson values comparable with those of the average annotator versus consensus (Fig. 3).
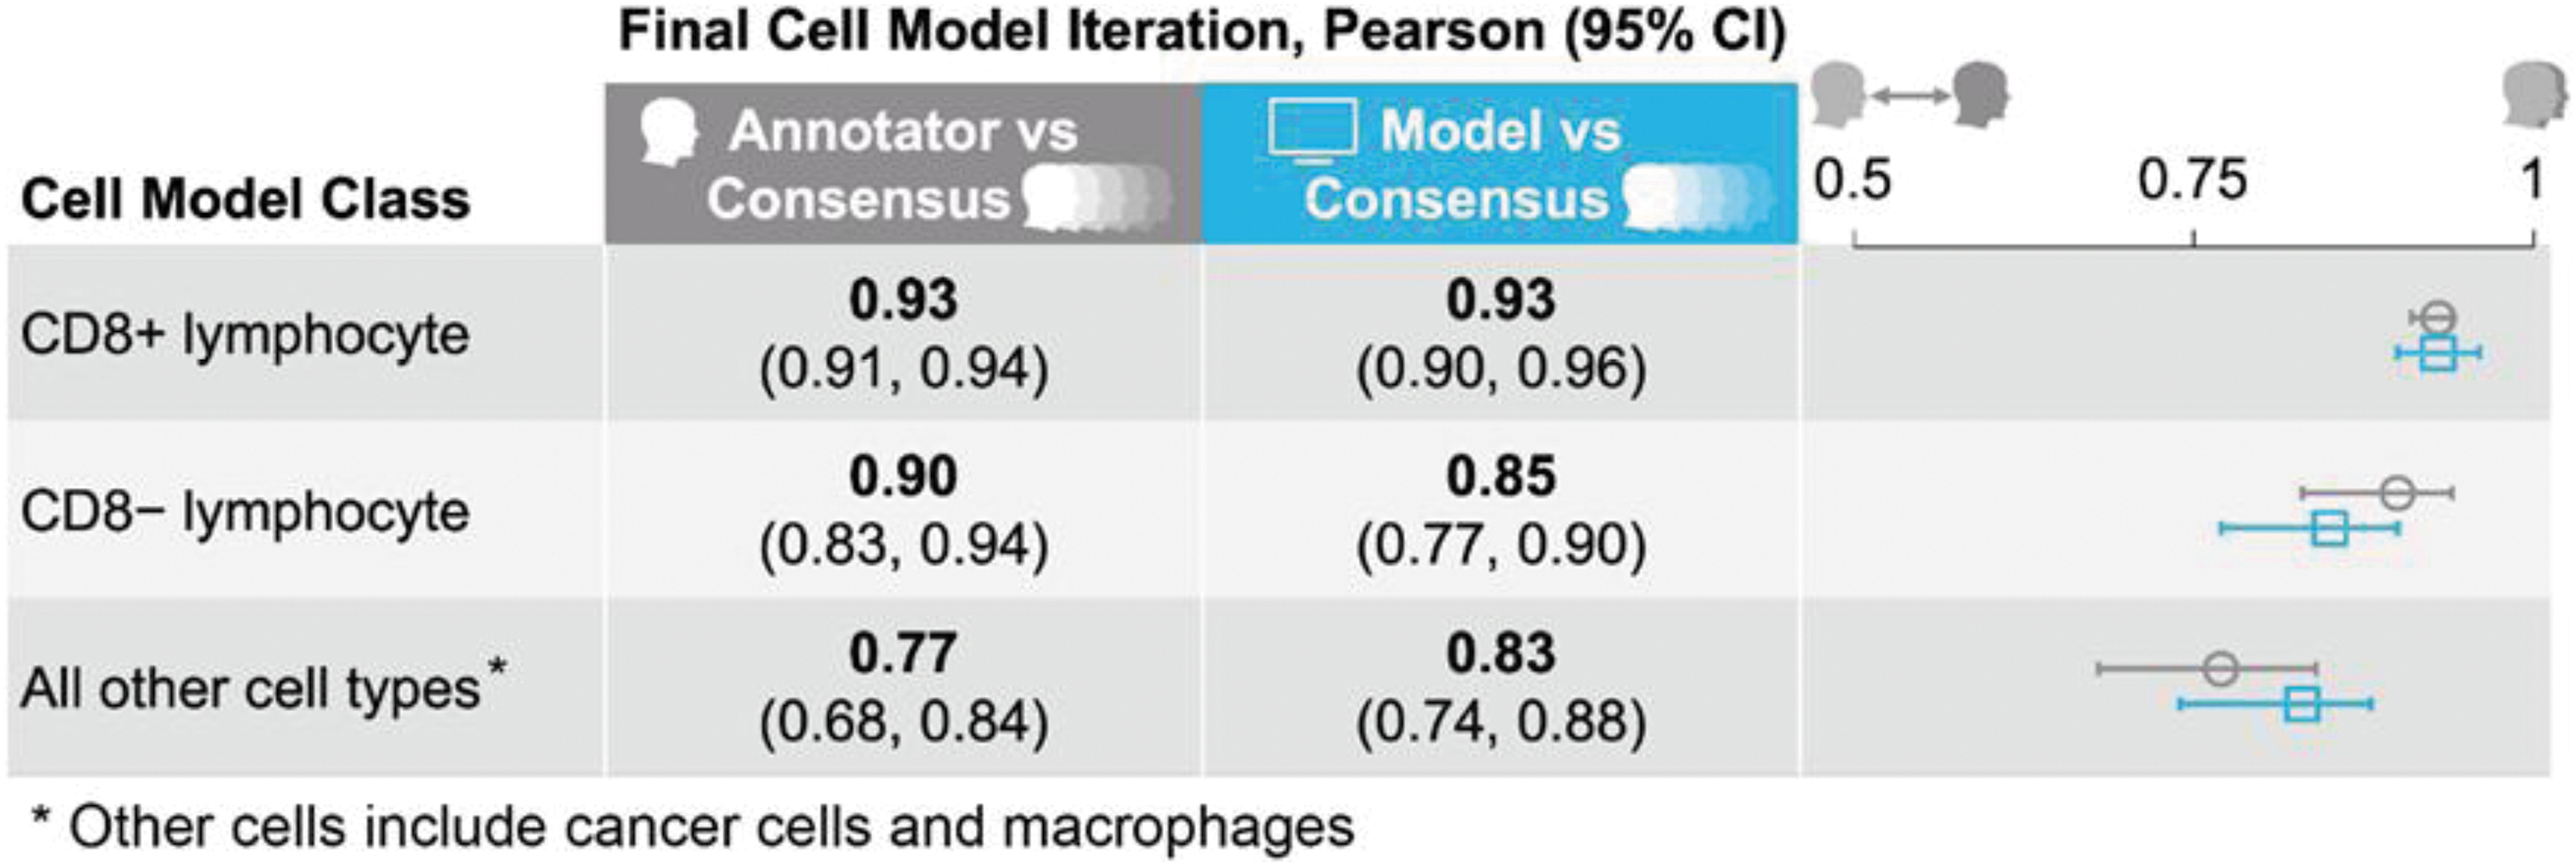
Performance of our ML model in predicting CD8+ lymphocytes. Model predictions were compared with a consensus of annotations from five expert pathologists using the Pearson correlation. The average correlation of a single manual pathologist annotator with consensus was also calculated. Model predictions showed high concordance with consensus for all cell model classes; this concordance was comparable with that of the average annotator versus consensus.
Two ML model-derived approaches were taken to predict immunophenotypes based on tissue and cell model outputs (Fig. 1). In the first approach, data-driven cutoffs were applied to model-generated HIFs of CD8+ count proportion within cancer epithelium and cancer-associated stroma to classify samples as immune desert, excluded, or inflamed. In the second approach, all tissue and cell model predictions within the TIME were used to train a GNN to classify samples as immune desert, excluded, or inflamed. Results from both approaches showed moderate concordance with a 5-way pathologist consensus in a held-out test set, comparable with the concordance of an average pathologist with consensus (Fig. 4).
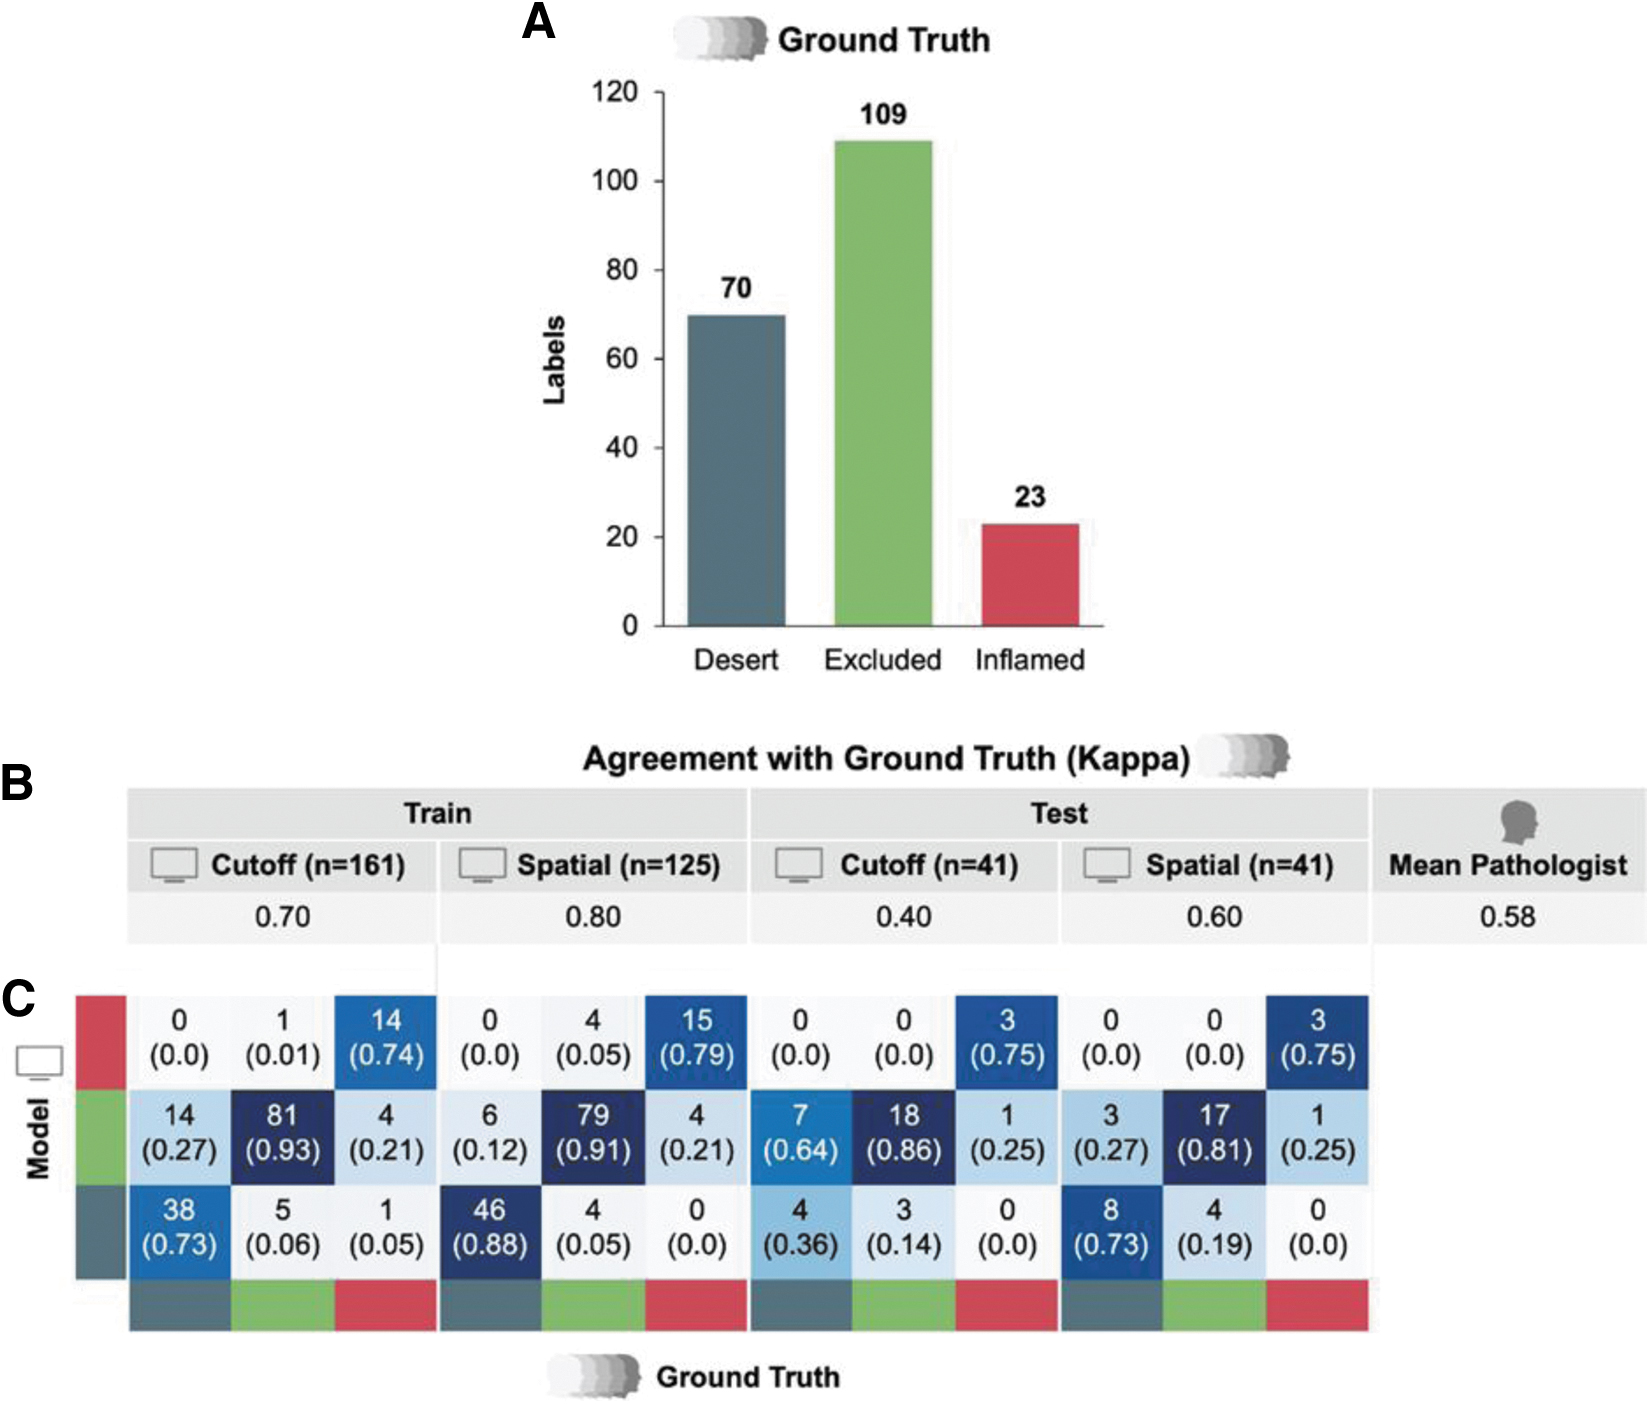
Comparison of digital pathology-based immunophenotyping methods.
Functional validation of immunophenotyping model
Given the strong performance of our model in predicting both CD8 levels and immunophenotypes in our NSCLC cohort compared with pathologists, we sought to functionally validate our models by comparing model-predicted immunophenotypes with relevant gene expression signatures. Samples determined to be immune inflamed (either by pathologist-labeled ground truth, cutoff model prediction, or spatial model prediction) showed elevated relative abundance of T cells, CD8+ T cells, cytotoxic lymphocytes, and overall CD8+ cell positivity (Fig. 5). Interestingly, relative abundance of other immune cell populations was more variable.
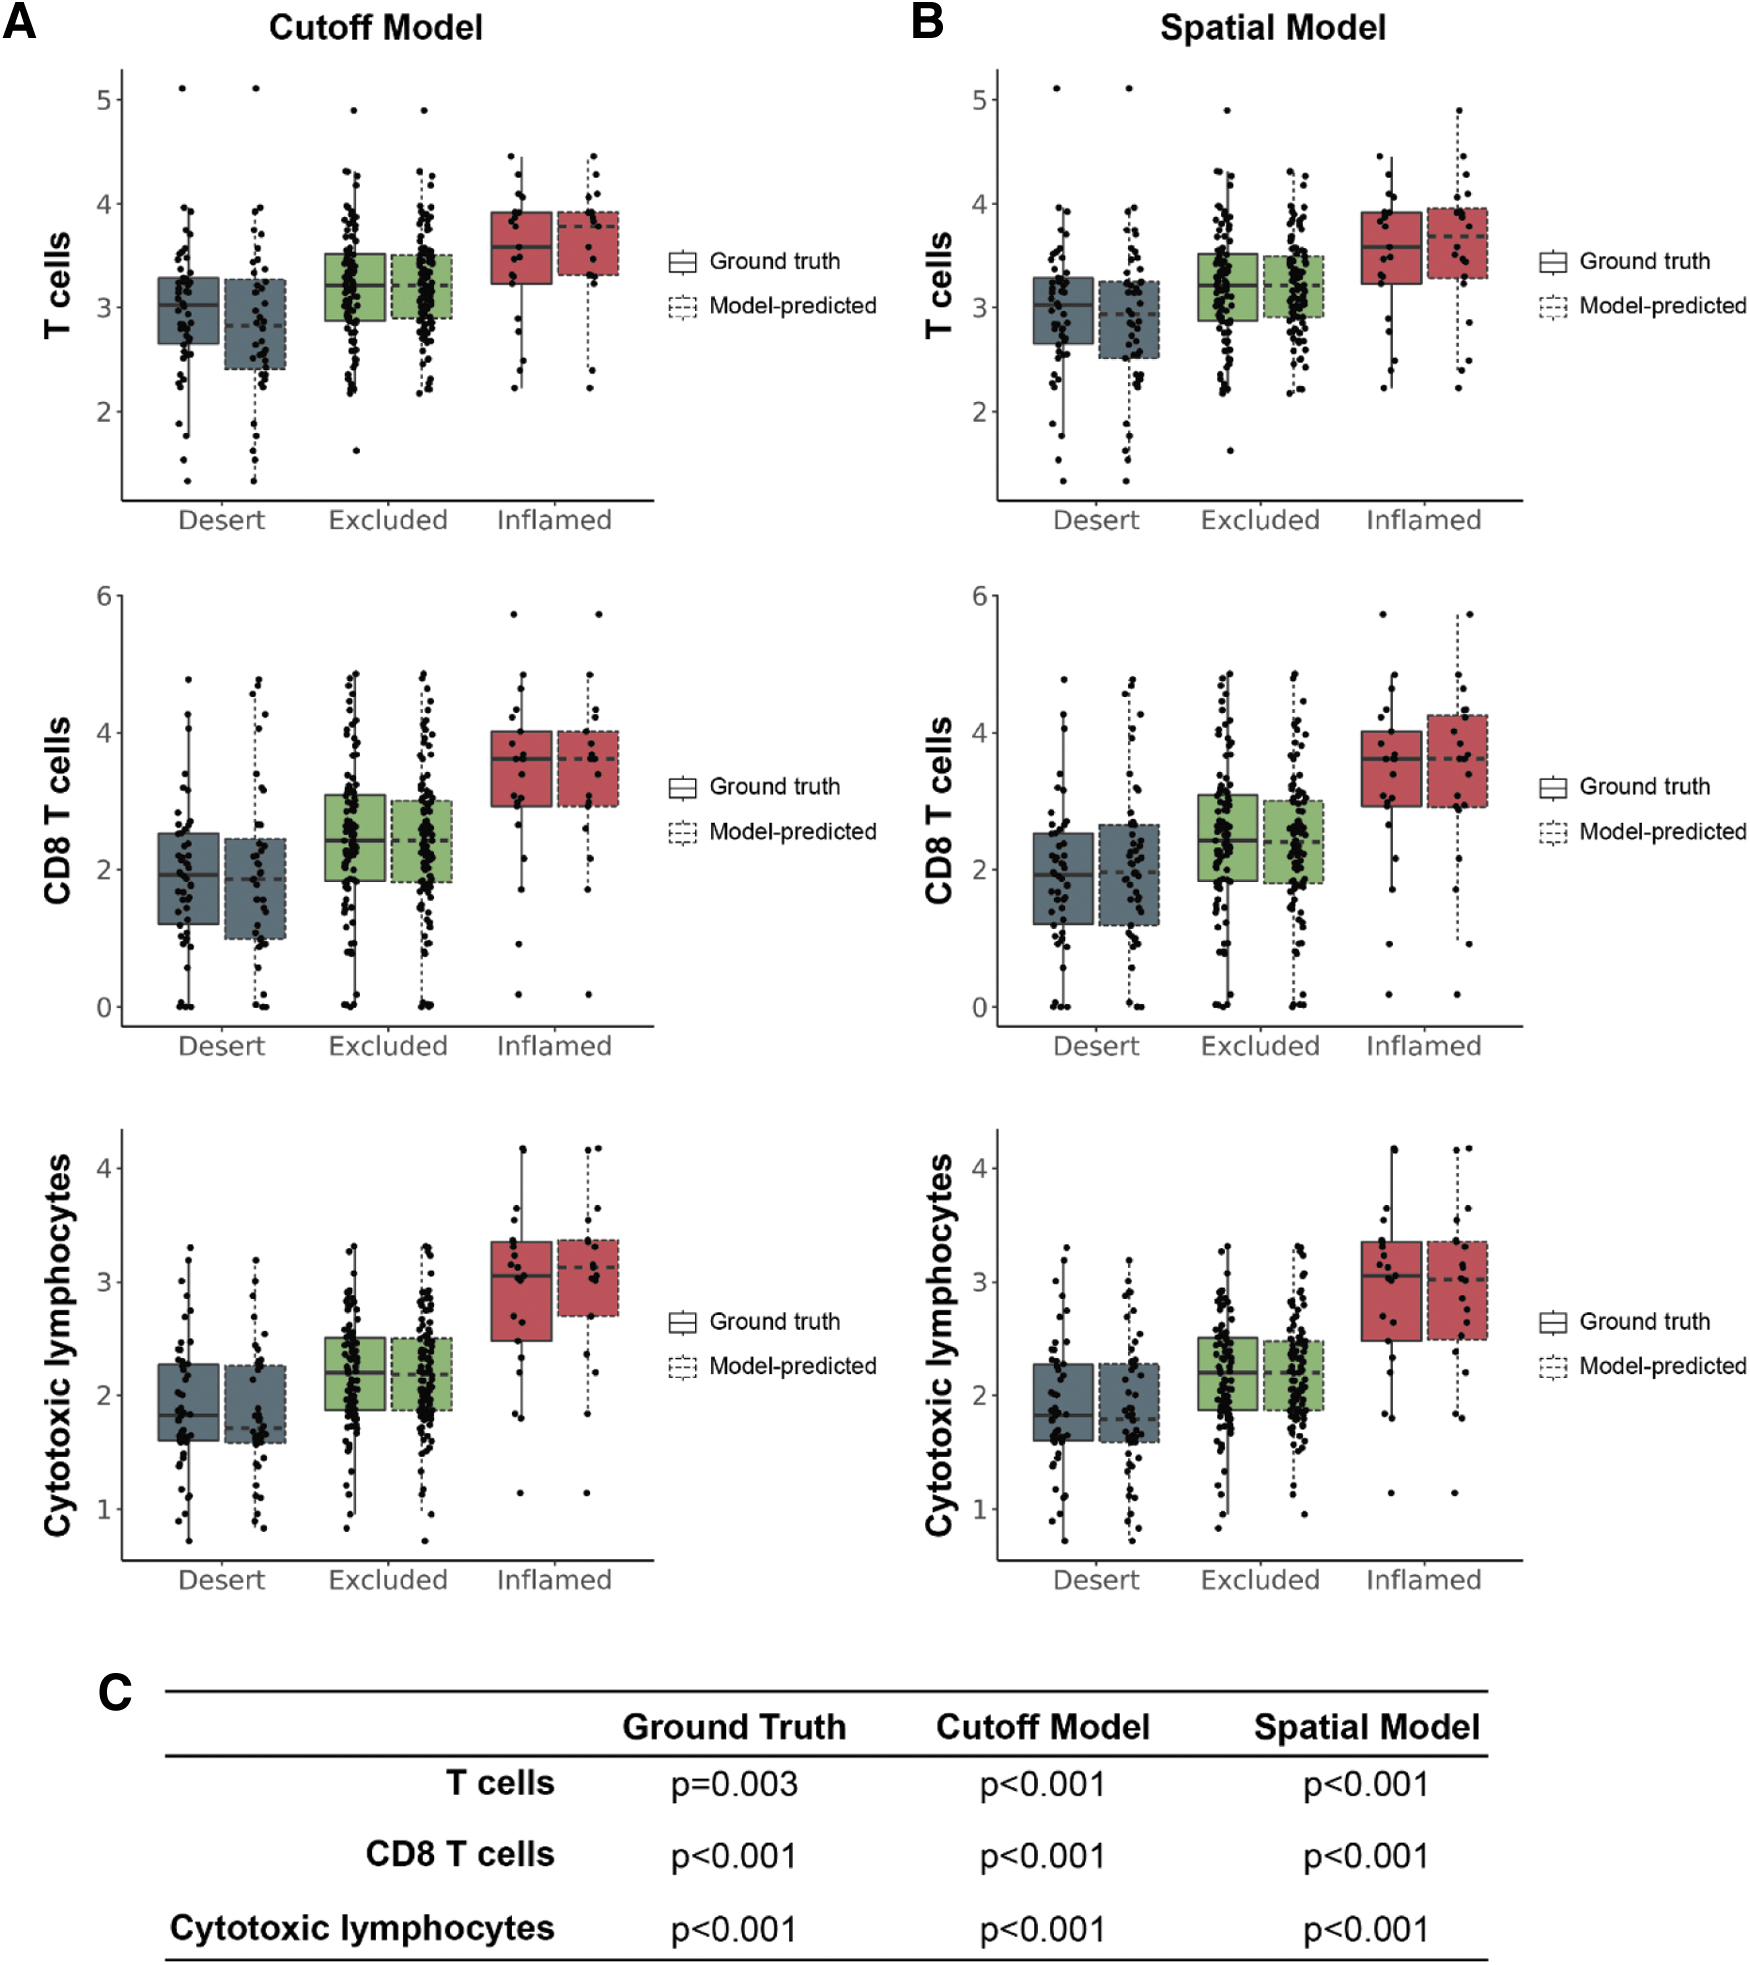
Abundance of T cell populations in model-predicted immunophenotypes. Transcriptomic analyses were performed to compare abundance of T cell populations estimated by associated gene expression signatures with immunophenotypes predicted by the
Samples determined to be immune inflamed (either by pathologist-labeled ground truth, cutoff model prediction, or spatial model prediction) showed elevated expression of gene signatures associated with monocytes (Fig. 6). Samples labeled as immune inflamed by pathologists showed elevated relative abundance of B cell and NK cell populations; although not significant, a similar trend was observed for cutoff-predicted and spatial-predicted inflamed samples (Fig. 6). No significant associations were observed between immunophenotype and relative abundance of myeloid-dendritic cells, neutrophils, fibroblasts, or endothelial cells (Fig. 6 and, Supplementary Fig. S1).
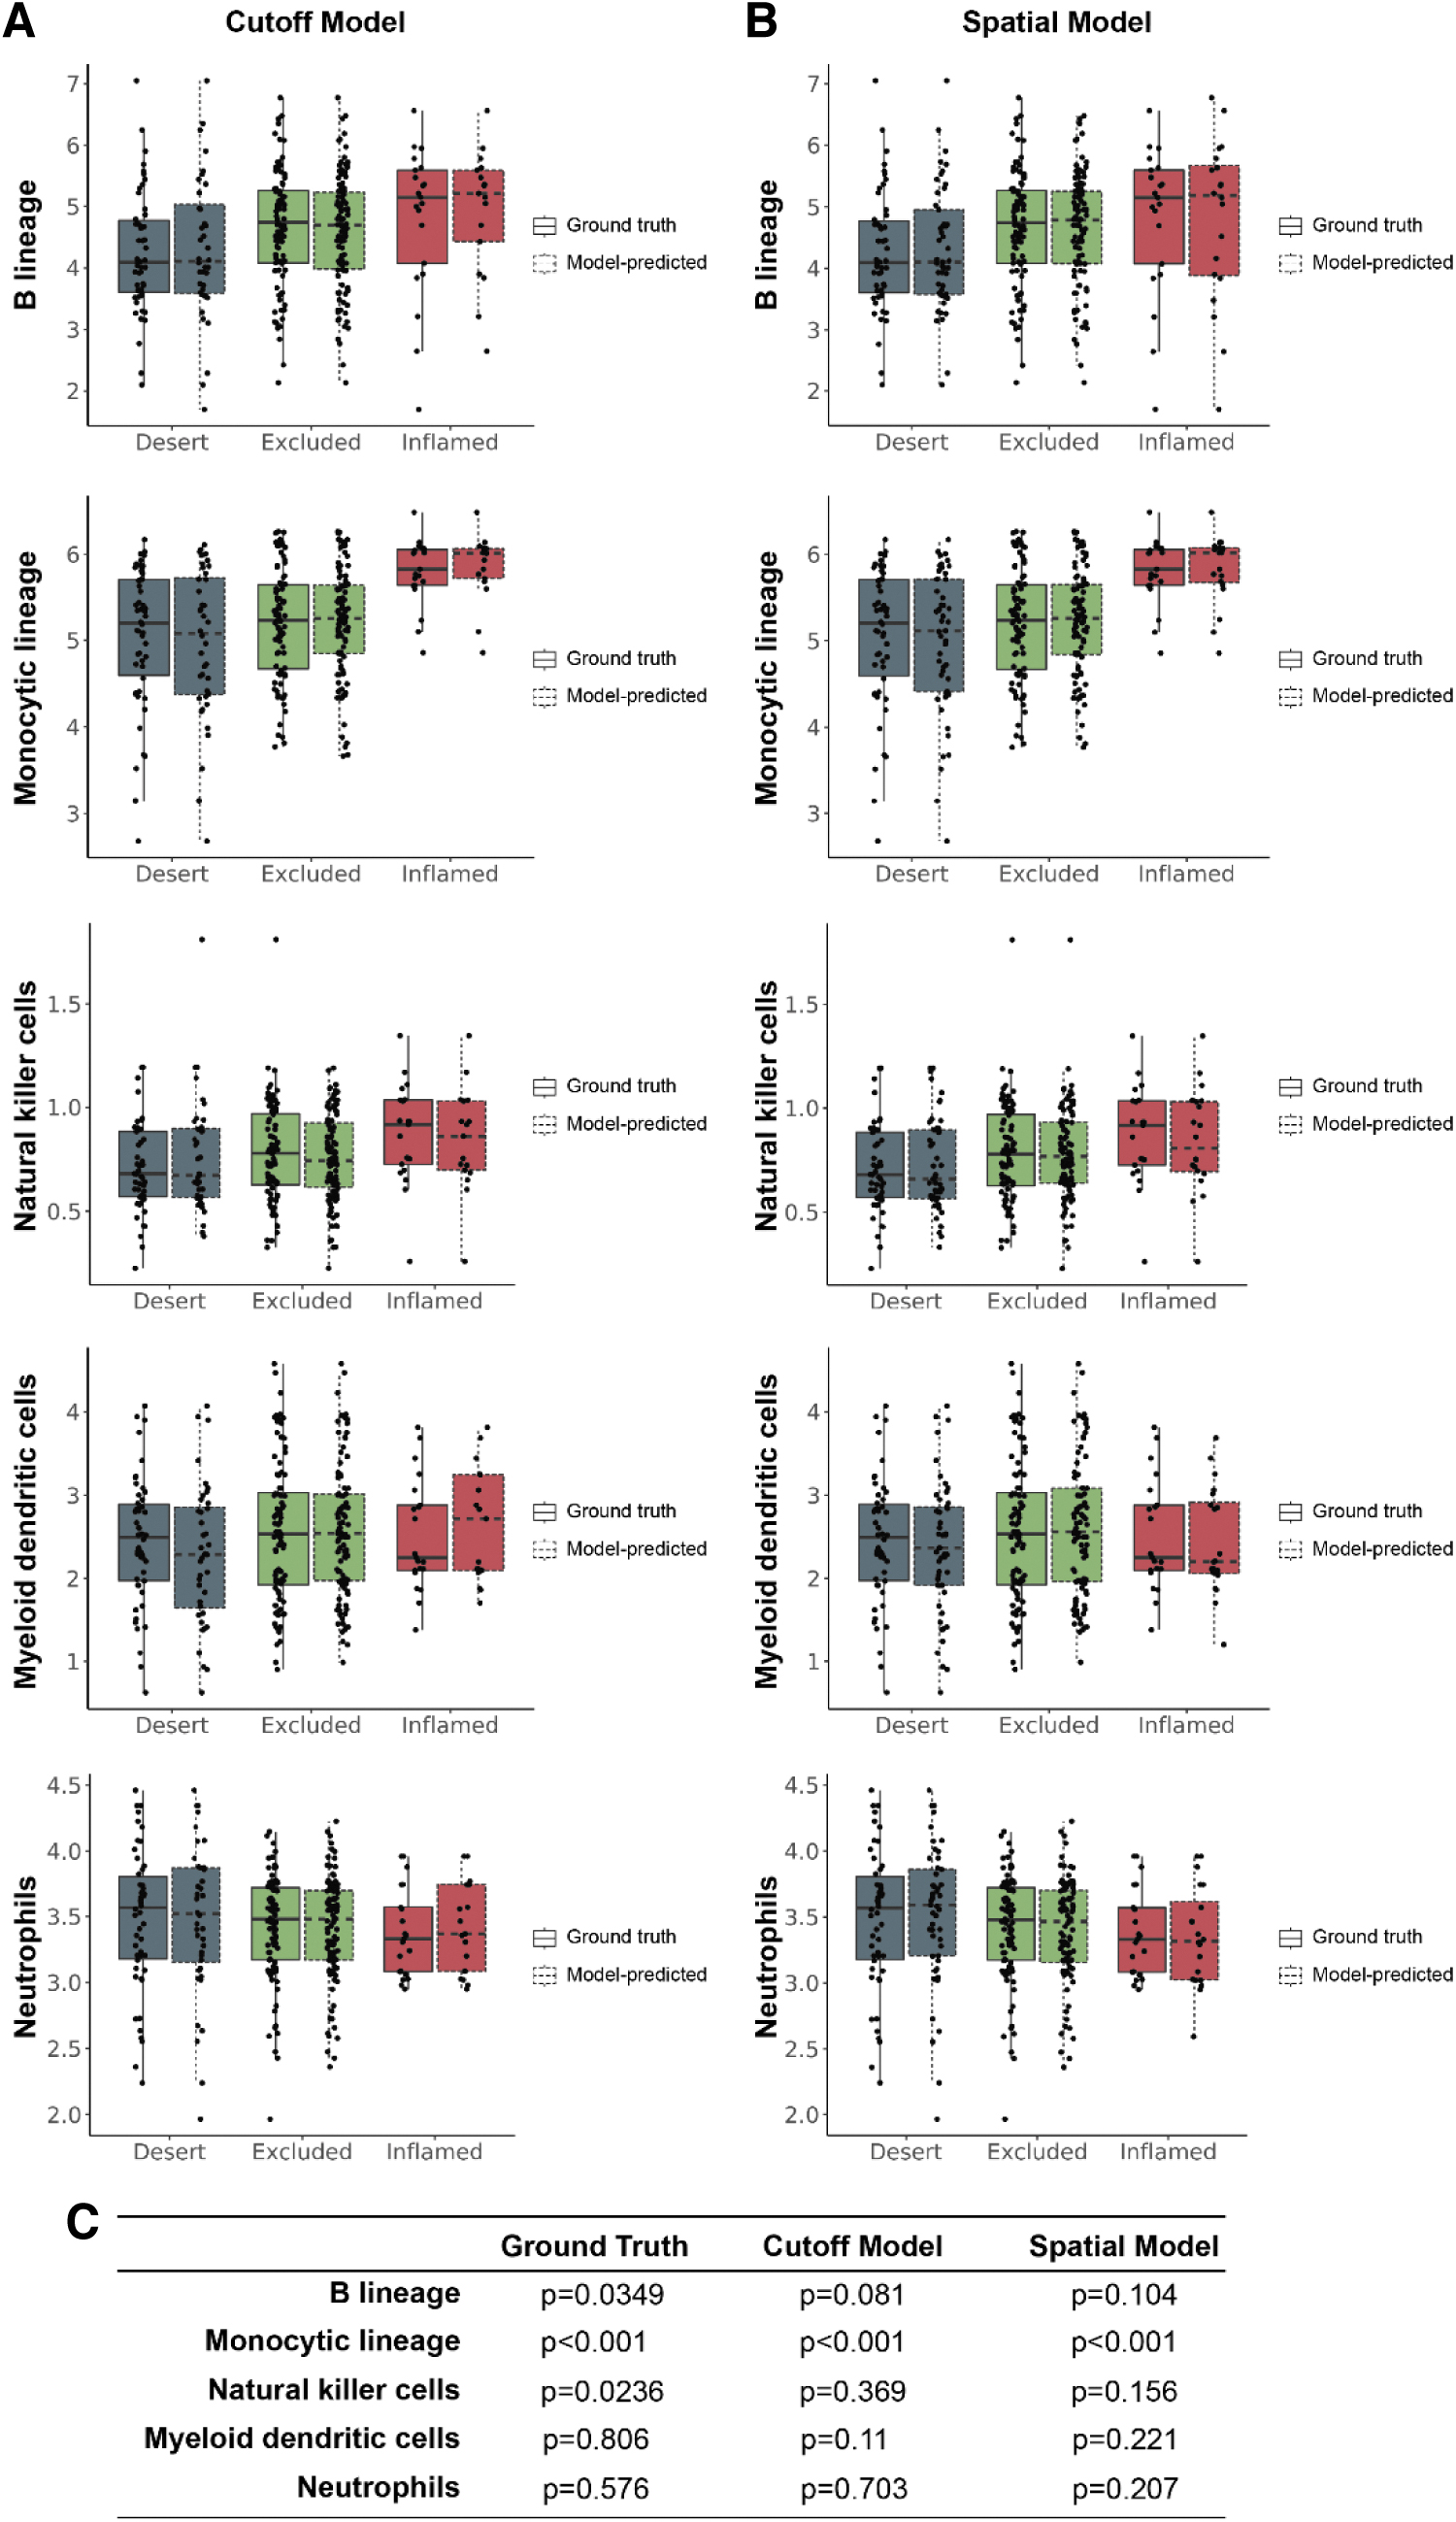
Estimated abundance of non-T cell immune populations in model-predicted immunophenotypes. Transcriptomic analyses were performed to compare estimated abundance of non-T cell immune cell populations estimated by gene expression signatures with immunophenotypes predicted by the
In all instances, no significant differences were observed between our model predictions and ground truth, supporting our models' accuracy in predicting immunophenotypes. These results support the specificity of our models in predicting the CD8+ landscape within H&E-stained cancer specimens.
Having confirmed that tumors predicted to be inflamed by our model harbor functional evidence of increased immune infiltration at the T cell level, we sought to assess the relationship between our model predictions and proposed gene signatures indicative of molecular pathway activity. The “T cell inflamed signature” has been proposed as a biomarker of response to anti-PD-1 treatment. 48 Tumors predicted to be inflamed by our spatial and cutoff models showed significantly elevated scores of this gene signature, further suggesting that our model predictions may have the capability to function as a surrogate biomarker for response to PD-1 blockade.
In addition, given the association between T cell infiltration and TGF-β, we assessed how our model predictions compared with a gene signature indicative of TGF-β signaling. 43 Although we did observe a trend toward lower TGF-β signature score in immune-inflamed samples, no significant associations were observed. Still, given the performance of our model more broadly, we hypothesize that this digital pathology approach could be used as a biomarker to predict response to immuno-oncology therapeutics.
Discussion
In the context of cancer immunology, different immune profiles have been described in the tumor microenvironment, represented as “immune inflamed,” “immune excluded,” and “immune desert.”21–24 Recent study has confirmed the role of TGF-β signaling in promoting immune exclusion, a state in which immune cells, especially CD8+ T cells, are found in the stromal tissue surrounding the tumor, but not infiltrated into the tumor itself. 44 It has been theorized that inhibiting TGF-β signaling might promote the infiltration of immune cells into the tumor and enhance the overall antitumor immune response, alone or in combination with immunotherapy.27,43
In this study, we have also shown an inverse correlation between TGF-β pathway activation and CD8+ cell infiltration (Fig. 2). We believe that this relationship between TGF-β and immune infiltration has the potential to inform the identification of patients with an immune-excluded phenotype who may benefit from TGF-β blockade as part of their therapeutic regimen.
Despite this potential, the clinical development of TGF-β inhibitors has been hampered by the lack of effective predictive biomarkers. Largely, these studies have focused on either transcriptional expression/protein expression of the TGF-β superfamily of ligands, TGF-β receptors, and downstream transcription factors 49 and associated independent intracellular signaling pathways.25,50 However, TGF-β signaling is notoriously modular and complex—multiple ligands, receptor–dimer combinations, receptor-associated SMAD effectors (R-SMADs), coactivators, corepressors, and transcription factor complex partners render a “one-size-fits-all” biomarker for TGF-β activity difficult. 27
In addition, R-SMAD activation occurs through phosphorylation, and phosphorylated proteins have limited clinical utility as biomarkers. 51 Furthermore, TGF-β activation often leads to activation of non-SMAD effector pathways, further limiting the clinical utility of SMAD activation as a biomarker. 52 To circumvent these issues, gene expression signatures associated with TGF-β activation have been proposed as surrogate markers of pathway activation.53,54 However, the incorporation of these transcriptomic signatures into the clinical workflow has been hampered by the fact that performing these assays is time consuming (especially relating to data analysis), costly, and requires considerable high-quality tissue.55,56
Conversely, although immunophenotyping using IHC against CD8 and other immune cell markers has shown promise for clinical application, this strategy has been hindered by low concordance among pathologists in providing manual slide-level immunophenotypes.24,30–34 To overcome these challenges, we developed ML models to predict immunophenotypes, which were shown to be concordant with pathologist ground truth labels of immune inflamed, immune excluded, and immune desert (Figs. 3 and 4). These results support the growing body of evidence that digital pathology approaches have utility for patient selection strategies in oncology.35,57–59
Furthermore, we observed that the distribution of relevant immune cell gene expression signatures, as well as a gene signature associated with PD-L1, correlated with immunophenotypes predicted by our models (Figs. 5–7), providing key functional support to our model's performance. Specifically, we observed a significant relationship between our model predictions (derived from both the cutoff model and spatial model) and gene signatures associated with T lymphocytes (Fig. 5).
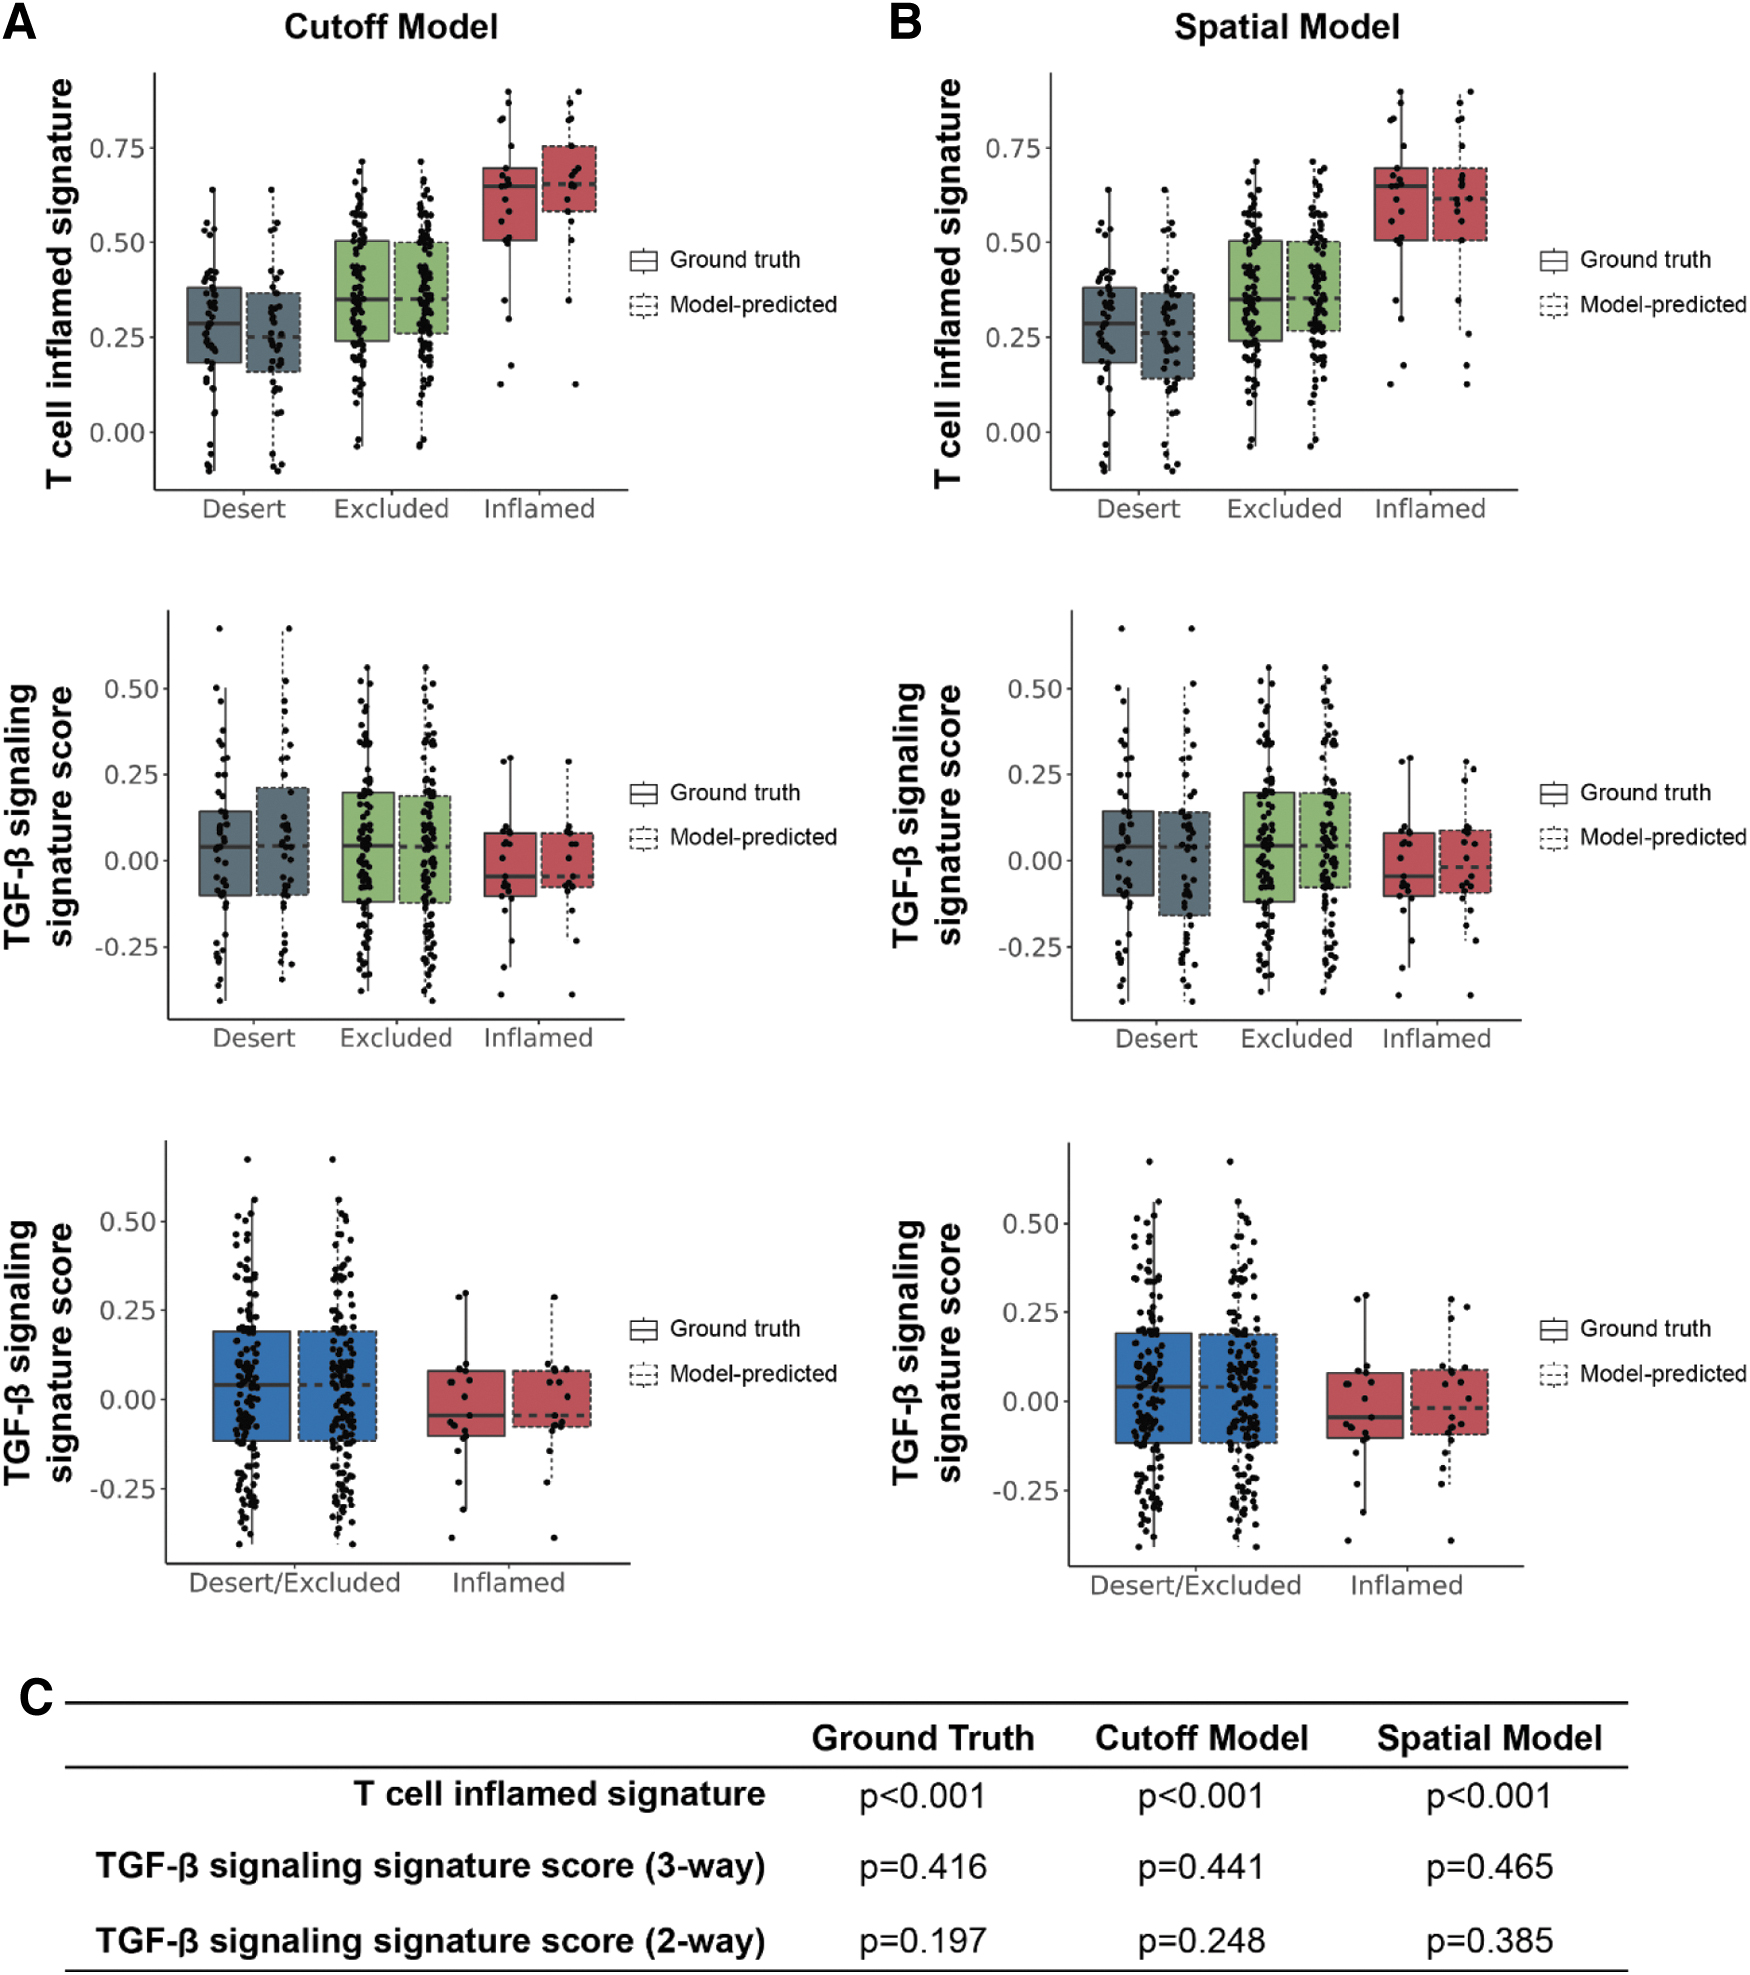
T cell inflamed and TGF-β gene signature scores in model-predicted immunophenotypes. Transcriptomic analyses were performed to compare T cell inflamed and TGF-β gene expression signature
43
scores with immunophenotypes predicted by the
However, with the exception of monocytes, gene signatures associated with other non-T immune cell types did not show significant associations with our model predictions (Fig. 6), supporting the specificity of our models in quantifying CD8+ cells. In addition, although the association between model-predicted immunophenotypes and TGF-β gene signature was not significant, we did observe a trend toward reduced TGF-β signature levels in immune-inflamed samples using ground truth predictions, as well as predictions from both our cutoff and spatial models (Fig. 7).
In all instances, no significant differences were observed between our model predictions and ground truth, further supporting our models' accuracy in predicting immunophenotypes. The observed differences in the association between our model predictions and signatures associated with PD-L1 and TGF-β can likely be explained, in part, by the pleiotropic nature of TGF-β signaling. Collectively, out of our full cohort (N = 163), the number of samples determined to be inflamed was quite low for ground truth (N = 21), cutoff model (N = 17), and spatial model (N = 20). Therefore, our sample size may have been insufficient to detect significant differences in TGF-β signaling within these populations. Future analyses will involve deployment of these models on larger cohorts to further understand their potential clinical utility.
Conclusion
In conclusion, these findings established a ML-based digital pathology approach that can quantify CD8+ cell positivity and classify the cancer immunophenotypes in a reproducible and scalable manner, paving the road for the application of such a method to clinical studies. Our results support the potential of using ML-predicted cancer immunophenotypes to identify patients who may benefit from immunotherapy and/or TGF-β blockade in NSCLC.
Footnotes
Acknowledgments
The authors thank Jingjing He (Sanofi) for supporting data reconciliation and Charles Biddle-Snead (PathAI) for aiding in conceptualization, methodology, and investigation in immune phenotyping. They also extend gratitude to the software engineering and ML teams at PathAI for developing the systems and pipelines used in model development and feature extraction. In addition, the authors thank Bioscience Communications for its help with figure design (funded by Sanofi), Jacqueline Brosnan-Cashman (PathAI) for assistance with article writing and figure design (funded by Sanofi), and Kaushik Kuche (Sanofi) for aid in editing and formatting the article.
Authors' Contributions
Conceptualization of the study was carried out by R.J.P., R.W., S.B., and C.H. Methodology was done by R.W., J.S.L., C.H., A.S-.M., A.K., M.G., H.W., Q.T., and R.T. Investigation was done by R.J.P., R.W., H.W., J.S.L., C.H., A.S-.M., A.K., M.G., and S.B.
Visualization was carried out by R.W., H.W., M.G., and A.S-.M. Funding acquisition: N/A. Project administration was by S.B. Supervision was done by R.W. and S.B. Writing—original draft was taken care by R.J.P., R.W., S.B., A.S-.M., A.K., M.G., H.W., J.S.L., and S.M.B.
Writing—review and editing was by R.W., H.W., J.S.L., S.B., C.H., A.S-.M., A.K., M.G., B.D., and S.M.B. All authors have reviewed and approved the article for submission.
Authors' Information
R.J.P., H.W., S.M.B., Q.T., R.T., J.S.L., B.D., and R.W. are employed by Sanofi and may hold stock and/or stock options. A.K. reports holding stock and/or stock options at PathAI. A.S.M. reports receiving support for attending meetings and/or travel support from PathAI, holding stock or stock options at PathAI, and receiving equipment, materials, drugs, medical writing, gifts, or other services from PathAI. M.G. reports holding stock or stock options at PathAI and having financial and nonfinancial interests at PathAI. C.H. reports consultation fees from HistoGeneX LLC and PathAi, along with financial interests in HistoGeneX LLC and PathAi. S.B. reports holding stock or stock options at PathAI.
Data and Materials Availability
Model parameters for CD8 quantification and immunophenotyping models are not disclosed. Access requests for such a code will not be considered to safeguard PathAI's intellectual property. All source code for reproducing analyses and predictions will be deposited to GitHub before publication, and the link will be provided at that time. Access requests can be made to: (publications@pathai.com).
Author Disclosure Statement
No competing financial interests exist.
Funding Information
This study was funded by Sanofi.
References
Supplementary Material
Please find the following supplemental material available below.
For Open Access articles published under a Creative Commons License, all supplemental material carries the same license as the article it is associated with.
For non-Open Access articles published, all supplemental material carries a non-exclusive license, and permission requests for re-use of supplemental material or any part of supplemental material shall be sent directly to the copyright owner as specified in the copyright notice associated with the article.