
Abstract
A novel dye-based method for measuring cell death in image-based screens is presented. Unlike conventional high- and medium-throughput cell death assays that measure only one form of cell death accurately, using multivariate analysis of micrographs of cells stained with the inexpensive mix, red dye nonyl acridine orange, and a nuclear stain, it was possible to quantify cell death induced by a variety of different agonists even without a positive control. Surprisingly, using a single known cytotoxic agent as a positive control for training a multivariate classifier allowed accurate quantification of cytotoxicity for mechanistically unrelated compounds enabling generation of dose–response curves. Comparison with low throughput biochemical methods suggested that cell death was accurately distinguished from cell stress induced by low concentrations of the bioactive compounds Tunicamycin and Brefeldin A. High-throughput image-based format analyses of more than 300 kinase inhibitors correctly identified 11 as cytotoxic with only 1 false positive. The simplicity and robustness of this dye-based assay makes it particularly suited to live cell screening for toxic compounds.
Introduction
Quantification of cytotoxicity is a common readout for many drug discovery endeavors. 1 Programmed cell death occurs in response to a range of stresses or signals and results from the activation of one or more signaling cascades, including those characteristic of apoptosis, anoikis, necrosis, necroptosis, and autophagic cell death, and the limitations of the various current assays have been recently reviewed. 2,3 Furthermore, death is generally cell autonomous and results in loss of cell adhesion complicating image-based assays of adherent cells. Detachment from the growth support or neighboring cells is not only a cell death response but also leads to cell death through anoikis; therefore, flow-based methods can overestimate cytotoxicity.
While many assays have been developed to quantify specific aspects of cell death, it has been suggested that to detect the broad spectrum of cell death cascades with high sensitivity, measurements of multiple relatively early indicators should be integrated. 3 Such an approach is generally impractical for high-content screening because of the cost and time associated with multiple often incompatible assays. Most techniques for image-based analysis of the effects of small-molecule compounds use techniques such as immunostaining that are expensive, require extensive optimization, and are incompatible with living cells, 4 or multiple dyes necessitating fixation and multiple processing steps (typically 5–10 steps in commercial kits). 5
We propose an alternative image-based cytotoxicity assay for adherent cells that integrates measurement of organelle ultrastructural changes and alterations in mitochondrial function associated with programmed cell death. Unlike many cell death assays, this method uses only two dyes that can be added to cells together without a washing step, requires minimal handling or optimization, and is easily analyzed using multivariate methods available in multiple commercial and open-source software packages to enable quantification of single cells. Multivariate image analysis algorithms attempt to integrate as much of the information of each cell that can be extracted. This approach takes a broad variety of measurements (referred to as “features”) from each cell to obtain a “feature-fingerprint.” These are then compared to reference “feature-fingerprints,” and each cell is classified to the closest matching reference dataset. Using these techniques, subcellular localization of proteins, 6,7 cellular subpopulations, 8 and drug mechanism of action 4,5,9 have been correctly classified with often greater than 95% accuracy.
In this study, we describe a simple approach to quantify cytotoxicity in adherent cells based on multivariate analysis of cells stained with the inexpensive dye, nonyl acridine orange (NAO), and a nuclear stain (MVA-NAO). NAO is a lipophilic cationic dye with some preference for binding cardiolipin and has been shown to also be partially sensitive to the mitochondrial membrane potential. 10 We compare MVA-NAO classification with more traditional measures of apoptosis and find that it provides improved classification in screening, quantified as improved Z′ factor (Z′), a standard screening assay metric. Moreover, this dye combination can be used to quantify EC50 values when used in a dose–response format. With an average cost that ranges from $0.1–10 per plate (depending on the nuclear stain), compared to commercial kits that average $50 per plate, this method is particularly well suited for applications involving large numbers of samples, such as high-content screening.
Materials and Methods
Cell Culture and Reagents
Human breast cancer cells MCF-7 were maintained in the α-minimal essential medium (α-MEM; Life Technologies, Carlsbad, CA) supplemented with 10% fetal bovine serum (HyClone, Logan, UT). Cells were seeded, treated, and stained under Biosafety level 2 conditions using a custom Sample Preparation WorkCell platform (Thermo Fisher CRS, Burlington, ON, Canada) that contains a CRS VAL 3-axis robot (Thermo Fisher) for plate handling, Combi Multidrop dispensers (Thermo Fisher), ELx plate washers (Biotek, Winooski, VT), and a STARlet 96-tip robot (Hamilton, Reno, NV) for precise liquid dispensing. Cells were seeded at a cell density of 5,000 cells per well to a 384-well plate (Cell Carrier; PerkinElmer, Waltham, MA) and grown for 24 h before drug treatment, or transfected with a plasmid encoding the caspase sensor (a kind donation from Dr. R. Truant, McMaster University) using NanoFect (QIAGEN, Venlo, Limburg, Netherlands) reagent according to the manufacturer's standard protocol, 24 h before drug treatment.
Drug Treatments
Drugs were dissolved in (DMSO; Bioshop, Burlington, ON, Canada) and diluted to the final assay concentrations in α-MEM. Tumor necrosis factor-alpha (TNFα), cycloheximide, thapsigargin (TG), brefeldin A (BFA), dithiothreitol (DTT), actinomycin D, staurosporine, tamoxifen, and tunicamycin, were purchased from Sigma-Aldrich (St. Louis, MO). The panel of 320 kinase inhibitors was obtained from the Ontario Institute for Cancer Research.
Cell Staining
Cells were incubated under culture conditions with fluorescent dyes for 30 min before image acquisition, using either 100 nM NAO (Sigma-Aldrich) or 10 nM tetramethylrhodamine, ethyl ester (TMRE; Life Technologies) in α-MEM, or 1 μM propidium iodide (PI; Sigma-Aldrich) and 1:100 Annexin V Alexa Fluor 488 (Life Technologies) in 0.01 M HEPES pH 7.4, 0.14 M NaCl, and 2.5 mM CaCl2. For the experiments reported here we used 5 μM DRAQ5 (Biostatus, Leicestershire, UK) as a nuclear dye for cell identification and segmentation; however, we have successfully used other nuclear dyes, including Hoescht and DAPI for this purpose.
Biochemical Assays
For analysis of poly ADP-ribose polymerase (PARP) cleavage, light chain 3 (LC3), and glucose-regulated protein (Grp) 78 and Grp94 levels, proteins were separated on 8% denaturing sodium dodecyl sulfate–polyacrylamide gel electrophoresis (SDS-PAGE) gels and transferred to polyvinyl difluoride membrane, incubated with a 1:1,000 dilution of PARP C-2–10 monoclonal antibody or KDEL antibody to detect Grp78 and Grp94 from Enzo Life Sciences (Farmingdale, NY), LC3 antibody from Cell Signaling Technologies (Danvers, MA), and the antibody to actin used for normalization was from Santa Cruz Biotechnology (Dallas, TX). These antibodies were detected with a 1:10,000 dilution of the corresponding horseradish peroxidase-conjugated secondary antibody from Jackson ImmunoResearch Laboratories (West Grove, PA), and Enhanced Chemiluminescence reagents (EMD Millipore, Billerica, MA) and band intensities were recorded using a CCD camera-based imager (MicroChemi 4.2; FroggaBio, Toronto, ON, Canada). Where required, band intensities were corrected for unequal loading by reprobing the blots for actin.
Microscopy
All cells were imaged at 37°C and 5% CO2 using an Opera QEHS high-content screening system (PerkinElmer) with environmental control for the imaging chamber and a tunable Ti:Sapphire pulsed laser and frequency doubler from Coherent (Santa Clara, CA). Images were acquired using 40 × 0.9 NA and 20 × 0.7 NA water immersion objectives. Data shown were recorded with the 40× lens, however, similar results were obtained with either lens. Images of NAO and Annexin V Alexa Fluor 488 staining were acquired with 488 nm excitation and 520/35 emission filter; PI and TMRE with 561 nm excitation and 600/40 emission; DRAQ5 with 633 nm excitation and 690/50 nm emission. Because the fluorescence intensity of NAO is as high as most nuclear stains, it is possible to image 384-well plates rapidly. Generally, for imaging multiple fields of view per well (here 3–8), the time depends primarily on the instrument used and typically ranges from 15 to 30 min. Fluorescence images of monomeric Cerulean (mCer) in the caspase sensor were collected with 430 nm nanosecond pulsed excitation and 475/50 emission, using a fast gated CCD camera. For ratiometric Förster resonance energy transfer (FRET), mCer was excited as above and fluorescence was recorded from the Venus fluorescence protein using the 520/35 emission filter.
Image and Data Analysis
Images collected on the Opera were analyzed using Acapella 2.5 (PerkinElmer). Assay-specific features of fluorescence intensity and texture features, including Haralick texture
10
features and threshold adjacency statistics,
6
were calculated using custom algorithms (scripts available from
In MATLAB, the cell-level data were transformed to z-scores and well averages calculated for each feature. Support vector machine (SVM) classifiers were trained (MATLAB function svmtrain()) using well-level data and then used to classify cell-level data (svmclassify()). The fraction of individual cells per well per classified group was calculated. Various measures of cell death were compared by Z-factor analysis, using the mean and standard deviation of eight untreated negative control and four TNFα-treated positive control replicate wells per assay.
Results
MVA-NAO of Images of Dye-Stained Cells Is More Sensitive and More Robust than Standard Fluorescence Imaging Methods for Measuring Cell Death
Several conventional image-based assays used to quantify cell death are illustrated for MCF-7 breast cancer cells 24 h post-treatment with TNFα and cycloheximide (referred to here as TNFα treatment), a standard method for inducing extrinsic apoptosis (Fig. 1). Annexin V binding measures the externalization of phosphatidylserine that occurs during apoptosis when cells no longer retain the plasma membrane lipid asymmetry. However, as seen from the images in Figure 1, Annexin V binding was useful for a limited number of TNFα treatments, because at higher doses staining decreases as cells fragment and die. PI staining measures the loss in integrity of the plasma membrane that occurs early in necrosis, but late during apoptosis, but also has a narrow detection range (Fig. 1A). TMRE, a cell-permeant, cationic, red-orange fluorescent dye sequestered by active mitochondria and used to quantify mitochondrial membrane potential, has an intermediate detection range (Fig. 1B).
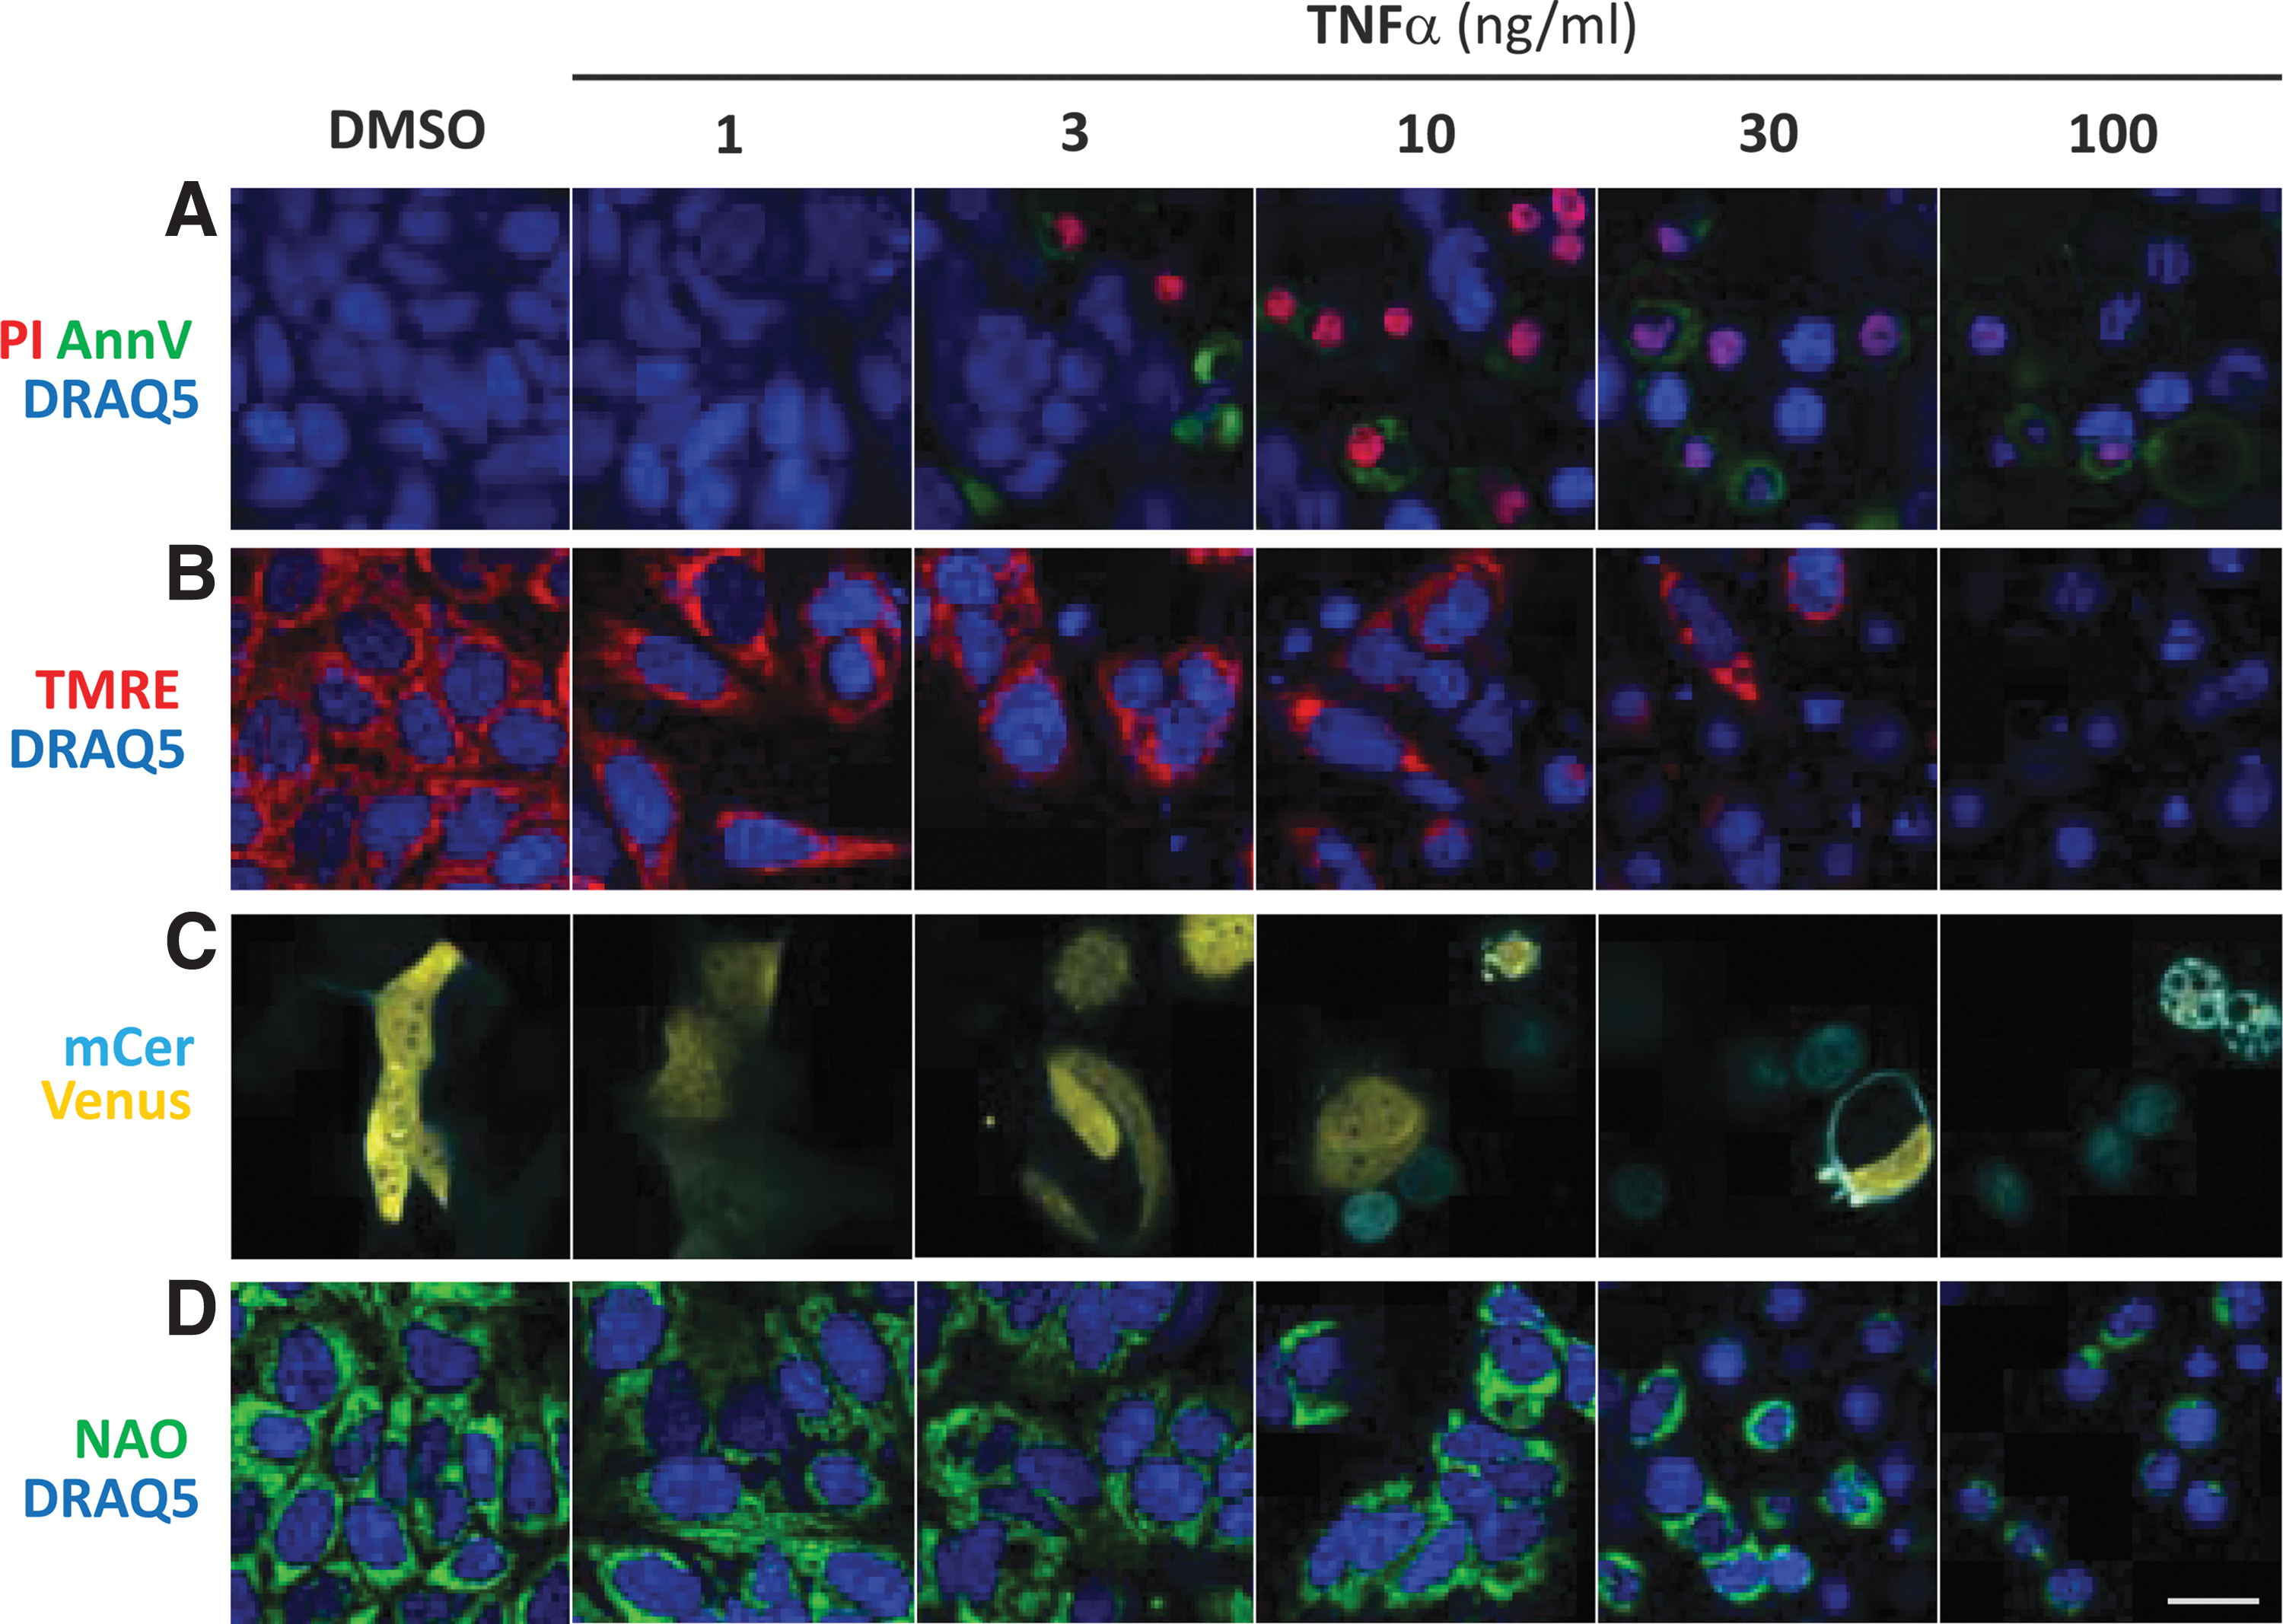
Image-based cell death assays. Example images of cells 24 h after TNFα treatment by the fluorescence assays under evaluation. For each assay, the relevant channels were merged, pseudocolored, and adjusted for brightness and contrast.
Caspase activation, a hallmark of apoptosis, was measured using a Cerulean and Venus fluorescence protein FRET-based caspase reporter (Fig. 1C). Cleavage of the sensor at the caspase 3/7 site DEVD separates the donor (mCer) from the acceptor yellow fluorescence protein (Venus) abolishing FRET and decreasing the fluorescence of the acceptor. This assay reliably detects apoptosis, but no other forms of cell death, and requires the cells be transfected to express the sensor. Nuclear condensation and cell counts were derived from DRAQ5 staining in cells (Figs. 1A, B, D, and 2B).
Cell death measurements using conventional image-based assays are not as sensitive as MVA-NAO and immunoblotting.
In contrast to these conventional assays, NAO stains multiple subcellular membrane structures, emphasizing the mitochondria due to their high membrane potential and cardiolipin content and reports on cell death indirectly (Fig. 1D). Under these conditions, changes in cell ultrastructure characteristic of cell death due to TNFα are visually obvious, and the assay has a large detection range and requires minimal optimization.
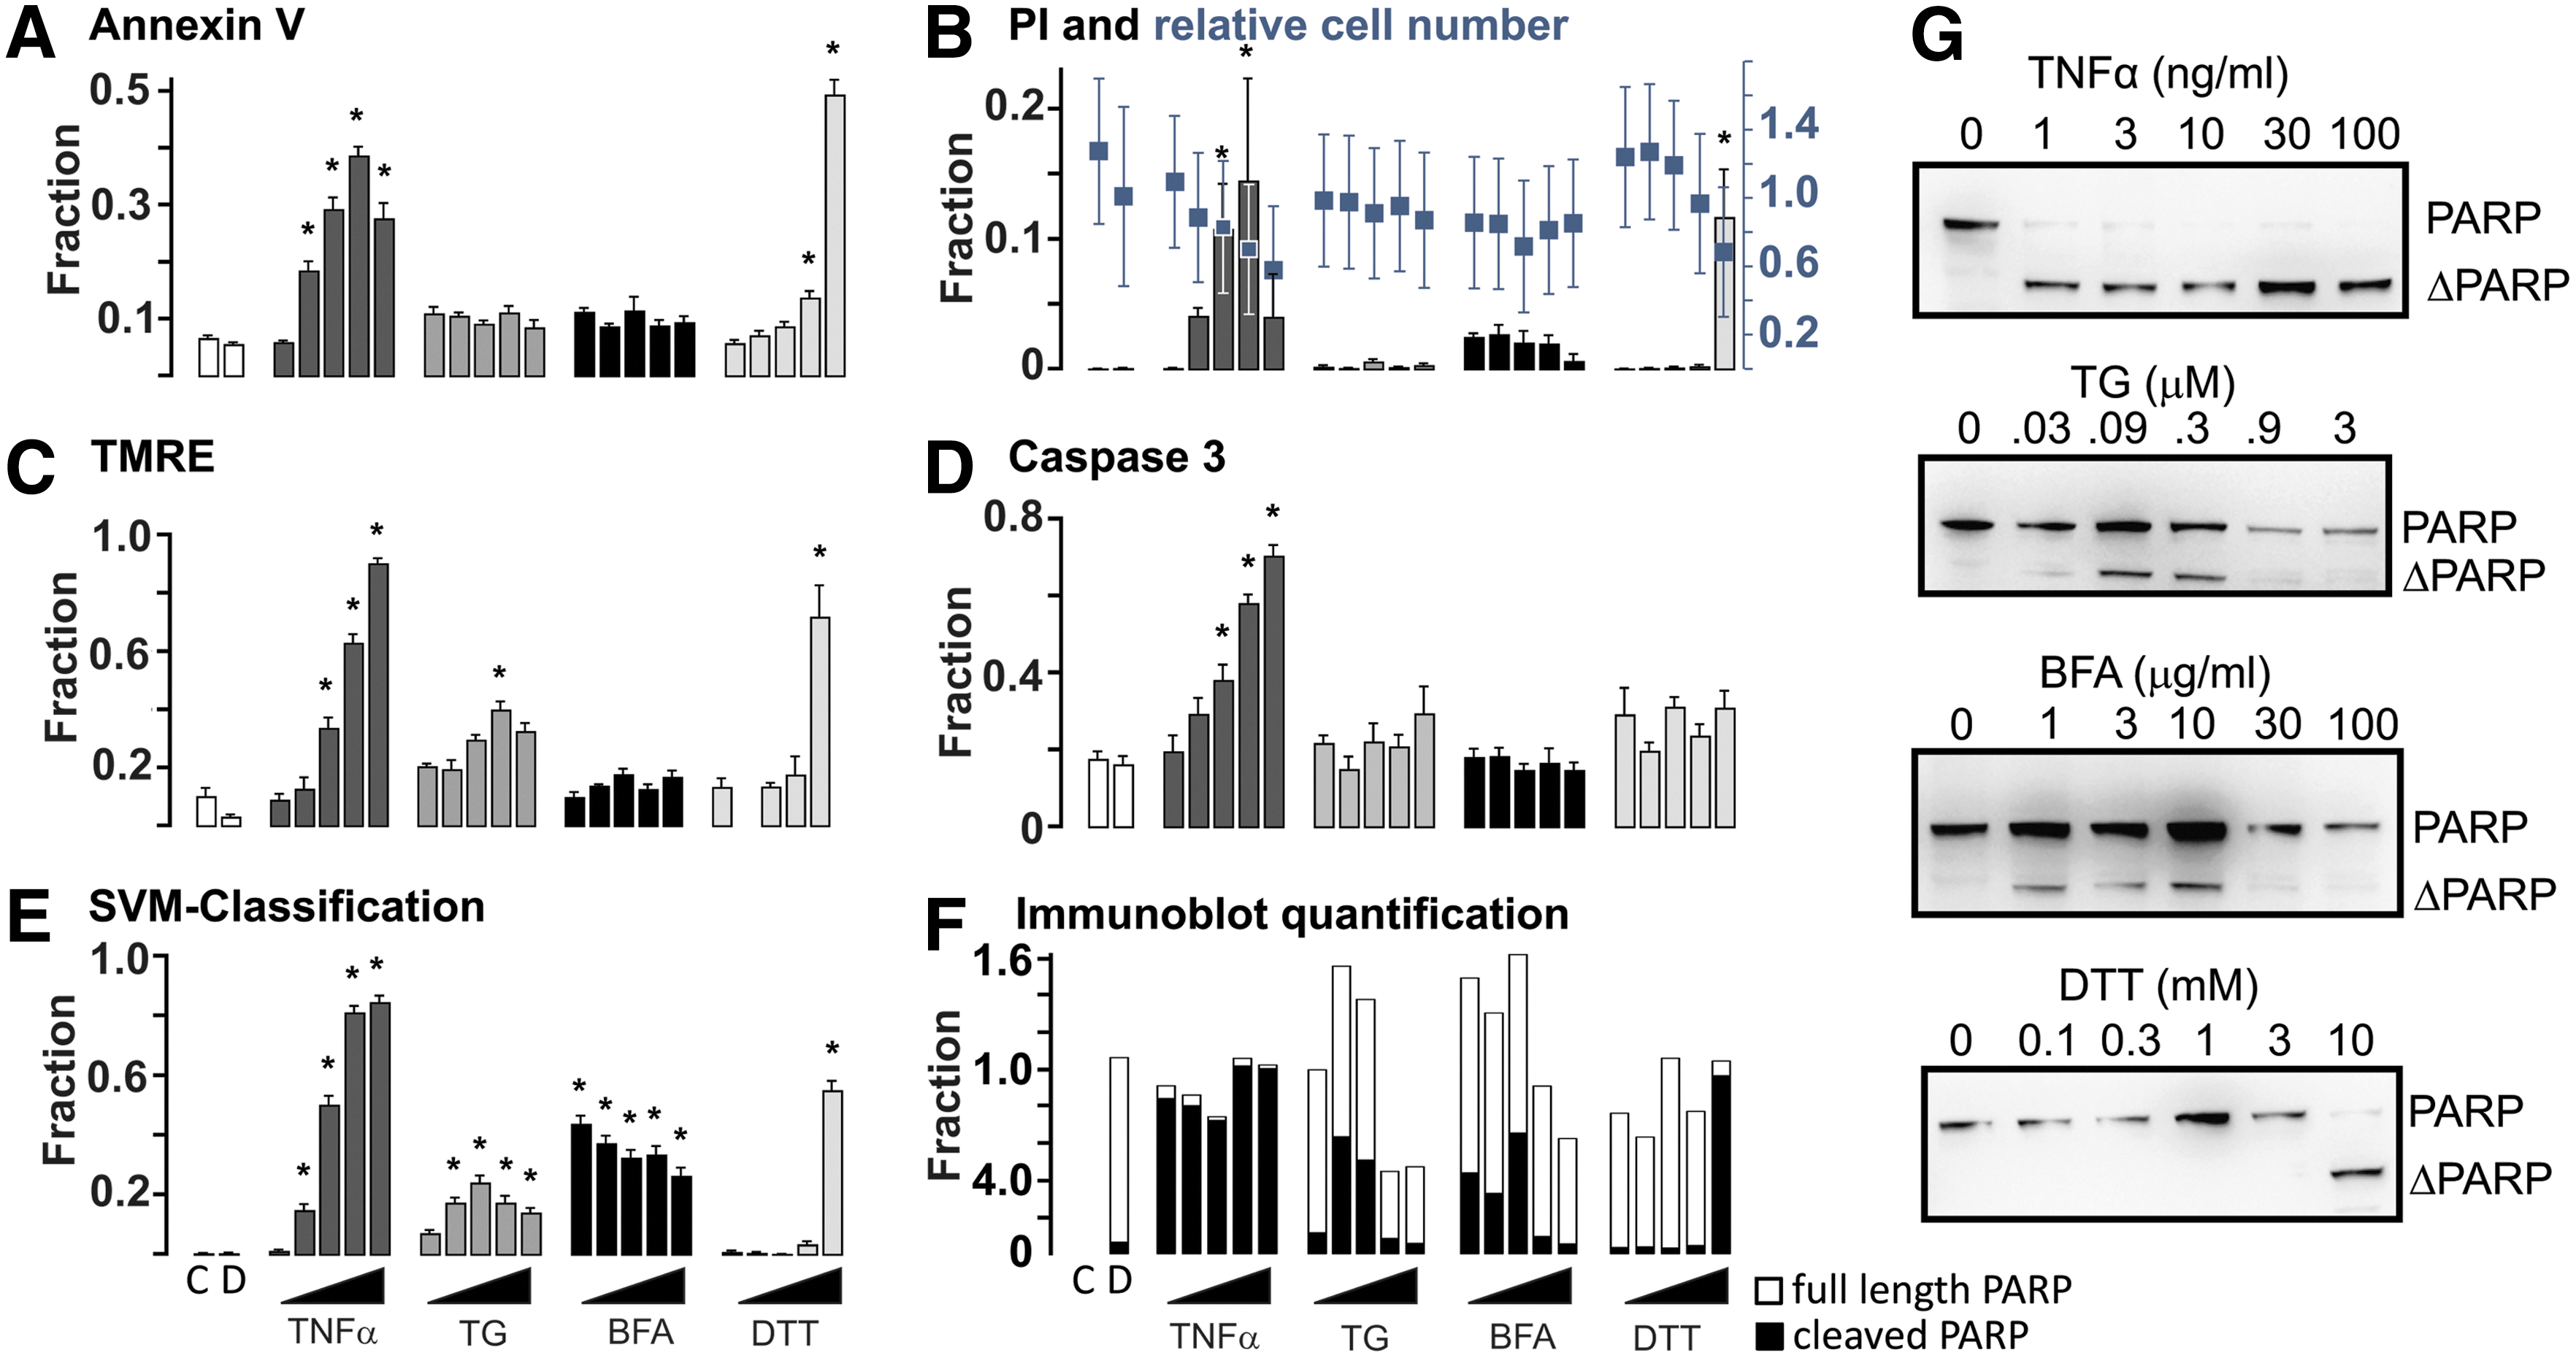
For the conventional image-based assays, response to drug treatment was detected on a cell by cell basis by segmenting the micrographs using the DRAQ5 image and applying an intensity threshold established from the untreated samples to the other channel. As little as 10 ng/mL TNFα treatment was detected by all of these assays (Fig. 2). Annexin V staining was the most sensitive and allowed detection (P < 0.005) at 0.3 ng/mL, very similar to biochemical analyses that detected caspase-dependent cleavage of PARP to the characteristic cleaved form (ΔPARP), in response to treatment with 1.0 ng/mL TNFα (Fig. 2F, G). The biochemical assays provide a wealth of information that is unfortunately convolved, including increased total PARP in response to DNA damage or stress, cleaved PARP due to apoptosis, and degraded PARP due to necrosis. 11 As expected, TNFα treatment induced only apoptosis while most of the other drugs elicited stress, necrosis, and apoptosis. As a result, the correlation of the blotting results and the high-content methods requires close examination of the quantified data.
The fraction of Annexin V-positive cells peaked at 40% for TNFα treatment and decreased at higher doses due to loss of staining of the cells (Fig. 1). Other assays suggest this is an underestimate of cells undergoing cell death as caspase activation, and TMRE staining identified 70%–90% of cells as having responded to TNFα treatment (Fig. 2C, D). Interestingly, the highest concentration of TNFα, shown by other measures to produce the highest level of cell death, results in a low measure of death as quantified by PI (Fig. 2B). As shown in Figure 1, at the latter stages of cell death there is sufficient DNA degradation to reduce PI staining leading to false negatives. Furthermore, cell count based on DRAQ5 staining was highly variable and at our assay time point was for most treatments relatively unchanged, thus limiting its usefulness to detect cell death (Fig. 2B).
Conventional image-based assays were not sensitive for detecting changes in cells induced by TG, an endoplasmic reticulum calcium pump inhibitor, BFA, a toxin that blocks forward vesicular transport between the endoplasmic reticulum and Golgi, or DTT, a reducing agent that causes protein misfolding in the endoplasmic reticulum by preventing proper disulfide bond formation. Concentrations of 0.09 μM TG and to a limited extent 1–10 μg/mL BFA were found to induce PARP cleavage 24 h post-treatment in immunoblot-based assays. However, cellular responses, as assessed by PARP immunoblots, are complicated for TG and BFA as the drug induced damage results in increased PARP levels in cells, while apoptosis caused PARP to be cleaved at a site specific for caspases 3 and 7, and necrosis results in degradation of both PARP bands (Fig. 2F, G) as seen previously for other drug treatments. 11
After 0.9 μM treatment with TG, a small but statistically significant response was detected using TMRE. A response to BFA treatment was not detected for any concentration using any of the conventional image-based readouts of cell death (Fig. 2A–D). These results demonstrate that conventional image-based assays fail due to the limited range of drug treatments they respond to and inaccurate scoring of cells undergoing nonapoptotic responses to drugs such as TG and BFA.
Only the highest concentration of DTT (10 mM) showed significant change in PI positivity, TMRE negativity, and Annexin V staining. The latter was significantly different (P < 0.01) between control and 3 mM DTT. Consistent with this result and expectation based on the known propensity of DTT to cause cell stress that only leads to the unfolded protein response triggering apoptosis in extreme conditions, 10 mM DTT was also required to induce apoptosis detected biochemically (Fig. 2G). Caspase 3 positivity reliably detected only TNFα treatment (Fig. 2D) and death due to the highest concentration of DTT. This may be because activation of caspase 3 is a response to apoptosis and the PARP western blots reveal minimal PARP cleavage in response to TG or BFA. Instead, PARP degradation characteristic of necrosis 2 is seen at the higher concentrations of these drugs (Fig. 2F, G).
To improve the detection of cytotoxicity due to all of these agents, we used MVA-NAO. Images were acquired (Table 1), and the DRAQ5 images were used to identify the cell nuclei and cytoplasmic masks. These masks were then used to quantify 235 features for each cell from the NAO and DRAQ5 images. These features included texture, intensity, shape, and size descriptors for the cytoplasm and nuclei.
MVA-NAO Screening Protocol
1. Cells dispensed at all wells of a black wall clear-bottom cell culture plate.
3. Added to columns 1, 2, 23, and 24.
4. Added to columns 3–22.
8. Imaging performed at constant 37°C, 5% CO2.
9. A completed list of measured features is available from the authors on request.
10. Performed if positive and negative experimental controls are present.
12. Performed if only negative experimental control is present.
DMSO, dimethylsulfoxide; NAO, nonyl acridine orange; SVM, support vector machine; TNFα, tumor necrosis factor-alpha.
A simple threshold cannot be used with multiparametric data; therefore, to process the features from NAO- and DRAQ5-stained cells, we used classification with a SVM, a standard multivariate approach (Fig. 2E). An SVM was generated that maximally classified random subsets of the control cells as either negative (untreated) or positive (treated), based on images of the cells either untreated or exposed to 100 ng/mL TNFα, respectively. Traditionally, an SVM is calculated based on a positive and negative control for each treatment. However, to mimic screening data, the images from TNFα-treated and vehicle-treated wells were used as high and low controls to train a classifier that was then applied to all of the drug treatments. The fraction of cells classified as positive (number of positive cells/well divided by the total number of cells/well) was then expressed for each well as a measure of cytotoxicity.
MVA-NAO showed significant differences in the fraction of cells classified positively between control and 3 ng/mL TNFα treatment, the lowest TNFα concentration detected by conventional image-based approaches (compare Fig. 2A–D with E). SVM classification resulted in a similar high fraction response for TNFα treatment as seen with TMRE and caspase activity (∼0.8). However, unlike the conventional methods, multivariate analysis detected responses to all concentrations of BFA and to all but the lowest concentration of TG. Biochemical assays, in which caspase mediated cleavage and degradation of PARP, were used to assess apoptosis and necrotic cell death, respectively, and to detect only population averages not individual cells. Nevertheless, inspection of the immunoblots used to assess PARP cleavage and degradation suggests that the biochemical data are qualitatively most similar to the results obtained using multivariate analysis of images of cells stained with NAO and DRAQ5 (Fig. 2E, F), consistent with these techniques being superior to other image-based techniques. For both TG and BFA, MVA-NAO was less sensitive at the two highest drug concentrations where the biochemical assays suggested there was significant cell death due to necrosis (degradation of both PARP bands). In contrast, the PARP immunoblots for cells treated with TNFα show evidence only of apoptosis (cleavage of full-length PARP to ΔPARP). Since images of cells treated with TNFα were used as the training group, the absence of necrosis in the positive control may explain why the classifier was less sensitive for images of cells undergoing necrosis (Fig. 2E compared to F).
To compare the different methods quantitatively, Z′-values were calculated for a range of conventional measures of cell death, including those shown in Figure 2A–D and MVA-NAO. The highest performing conventional assay was TMRE with a Z′ of 0.57. Other measures such as cell count, nuclear condensation (i.e., nuclear area), and loss of membrane integrity (PI positivity) were poor screening assays with Z′ of less than zero in this assay format (Table 2). To derive a Z′ value for MVA-NAO, we used the readily interpretable “percentage of cells per well classified as positive.” The resulting Z′ value of 0.91 outperformed all of the conventional image-based cell death assays (Table 2).
Z′ Calculated from Untreated and 100 ng/mL TNFα Treatments
PI, propidium iodide; TMRE, tetramethylrhodamine ethyl ester.
Derivation of Dose–Response Curves Using MVA-NAO
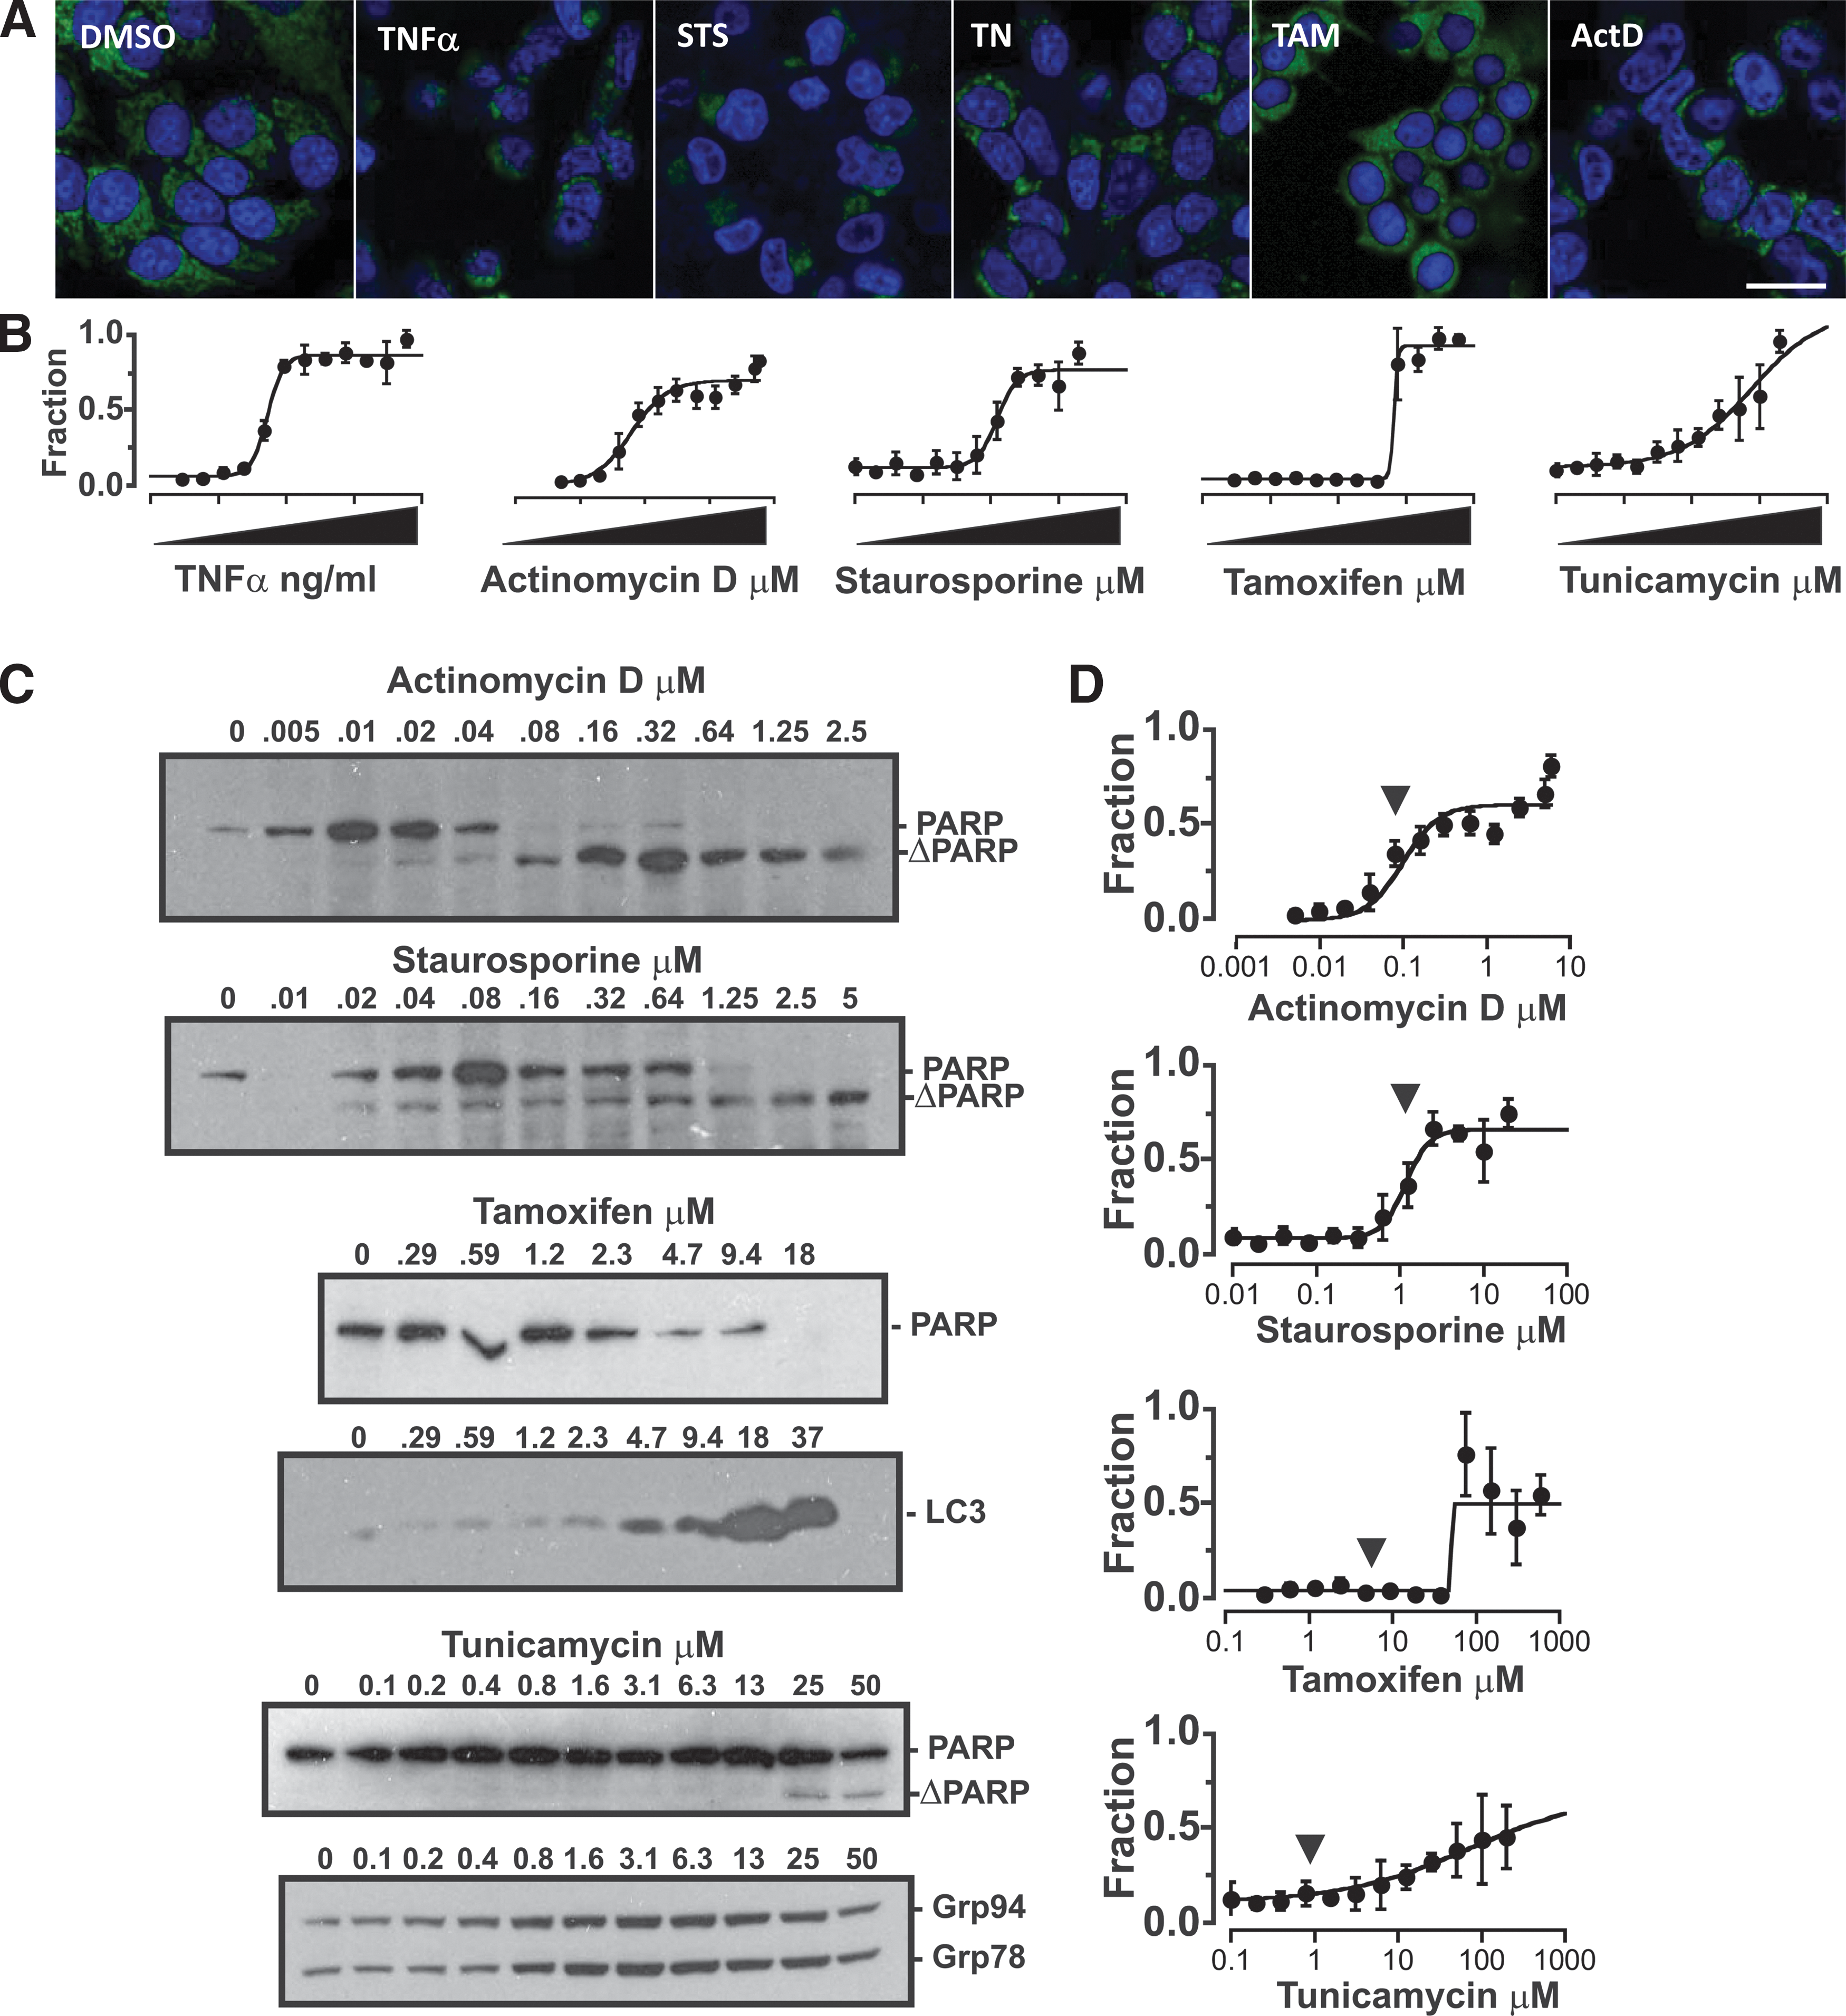
Secondary assays in screening campaigns often aim to derive the EC50 concentration of active compounds based on their dose-dependent effects on cells. To further test the utility of MVA-NAO for high-content screening, cells were treated with a range of concentrations of compounds chosen to target a variety of cell death or stress pathways. As above, the extrinsic apoptosis pathway was targeted by TNFα treatment. In addition, drugs were added to cause endoplasmic reticulum stress (tunicamycin); intrinsic apoptosis (staurosporine), 12 autophagy (low-dose tamoxifen), and mitotic catastrophe (actinomycin D) 13 (Fig. 3A) and the percentage of cells classified positive for each treatment were quantified. Unlike the experiments described above in which we used images of only TNFα-treated cells as the positive controls, here we used the highest concentration of each treatment as its respective positive training set and derived EC50 values for the response (Fig. 3B). Using this approach, it was possible to generate dose–response curves for each of the cell treatments.
Cell death dose–response curves generated for cytotoxic compounds by MVA-NAO are comparable to those obtained by immunoblotting.
The dose–response curves for the drugs that induce apoptosis (TNFα, actinomycin D and staurosporine) exhibit the expected S-shape curves with EC50s of 5 ng/mL, 60 nM, and 125 μM, respectively, and these drugs show similar dose-dependent apoptosis as assessed by the cleavage of PARP (Fig. 3C). Moreover, both actinomycin and staurosporine exhibit a marked transition in PARP cleavage at a drug concentration near the EC50 determined by NAO-MVA.
As expected, the PARP cleavage does not correlate nearly as well with the dose–response curves obtained by MVA-NAO for tamoxifen and tunicamycin, drugs that cause autophagy and endoplasmic reticulum stress, respectively. Biochemical assessment of autophagy for tamoxifen-treated cells by immunoblotting for activated LC3 permits detection of autophagy at 5 μM and shows a sharp increase between 9.4 and 18 μM. Cleavage of PARP indicative of apoptosis is not detected for tamoxifen-treated cells, but degradation is pronounced by 5 μM. MVA-NAO was less sensitive and detects a sharp transition in phenotype at around 60–70 μM tamoxifen. For tunicamycin, biochemical detection of endoplasmic reticulum stress as increased levels of Grp78 and Grp94 is apparent at 0.8 μM. In contrast, MVA-NAO does not detect phenotypic changes in tunicamycin-treated cells until around 10 μM with an EC50 that can only be estimated in the absence of saturation of almost 80 μM. These results for tamoxifen and tunicamycin are consistent with MVA-NAO trained on the highest dose of the drugs detecting common features of dying cells and, therefore, being less sensitive at detecting changes due to autophagy or endoplasmic reticulum stress.
While MVA-NAO enabled comparing cell death induced by different concentrations of a single treatment, in most screens the effect of unknown compounds is compared to a single positive control. To mimic this situation, images of cells treated with the highest concentration of TNFα and stained with NAO and DRAQ5 were used to train an SVM, as above, which was then applied to all of the other sets of images. In this situation, the different doses of the various compounds act as surrogates for compounds with different activities. The resulting dose–response curves were surprisingly similar to those generated using a separate SVM for each drug treatment (Fig. 3D), suggesting that MVA-NAO can be used in a screening format to examine a variety of drugs suffering only a small loss in sensitivity compared to an optimized assay.
MVA-NAO Identification of Cytotoxic Kinase Inhibitors
The data above strongly suggest that MVA-NAO can be used to identify toxic compounds in libraries of small molecules. To test this directly, an annotated small-molecule kinase inhibitor library was assayed at 1 μM with TNFα (at 29 ng/mL based on Fig. 3A) and 0.1% DMSO as high and low controls, respectively. At 1 μM, most of the kinase inhibitors in the library are not expected to be toxic. Afterward, drug treatment cells were stained with NAO and DRAQ5 as above. To validate the assay for high-throughput-type experiments, where image acquisition is often the rate-limiting step, we reduced the magnification used to 20× and the numbers of fields acquired to 3. At this magnification and resolution, the Z′ was still high (Z′ = 0.62) and throughput was much increased (a 384-well plate could be imaged in less than 30 min).
A heat map for the results illustrates the fraction of cells in each well scored as similar to the positive control (Fig. 4). Based on compound annotation for other cell lines (Table 3), we defined as toxic compounds in which more than 50% of the cells scored similar to TNFα. To confirm that this was a sufficiently stringent arbitrary criterion to identify toxic compounds, we treated cells with 1 μM of the 11 kinase inhibitors that scored positive as above and then assessed 6 days after treatment whether cells exposed to these compounds were still viable. With the exception of Dasatinib, all of the cells treated with the compounds designated as toxic by MVA-NAO eventually died (data not shown). This result confirms that MVA-NAO can be used to identify toxic compounds in a screening-type assay.
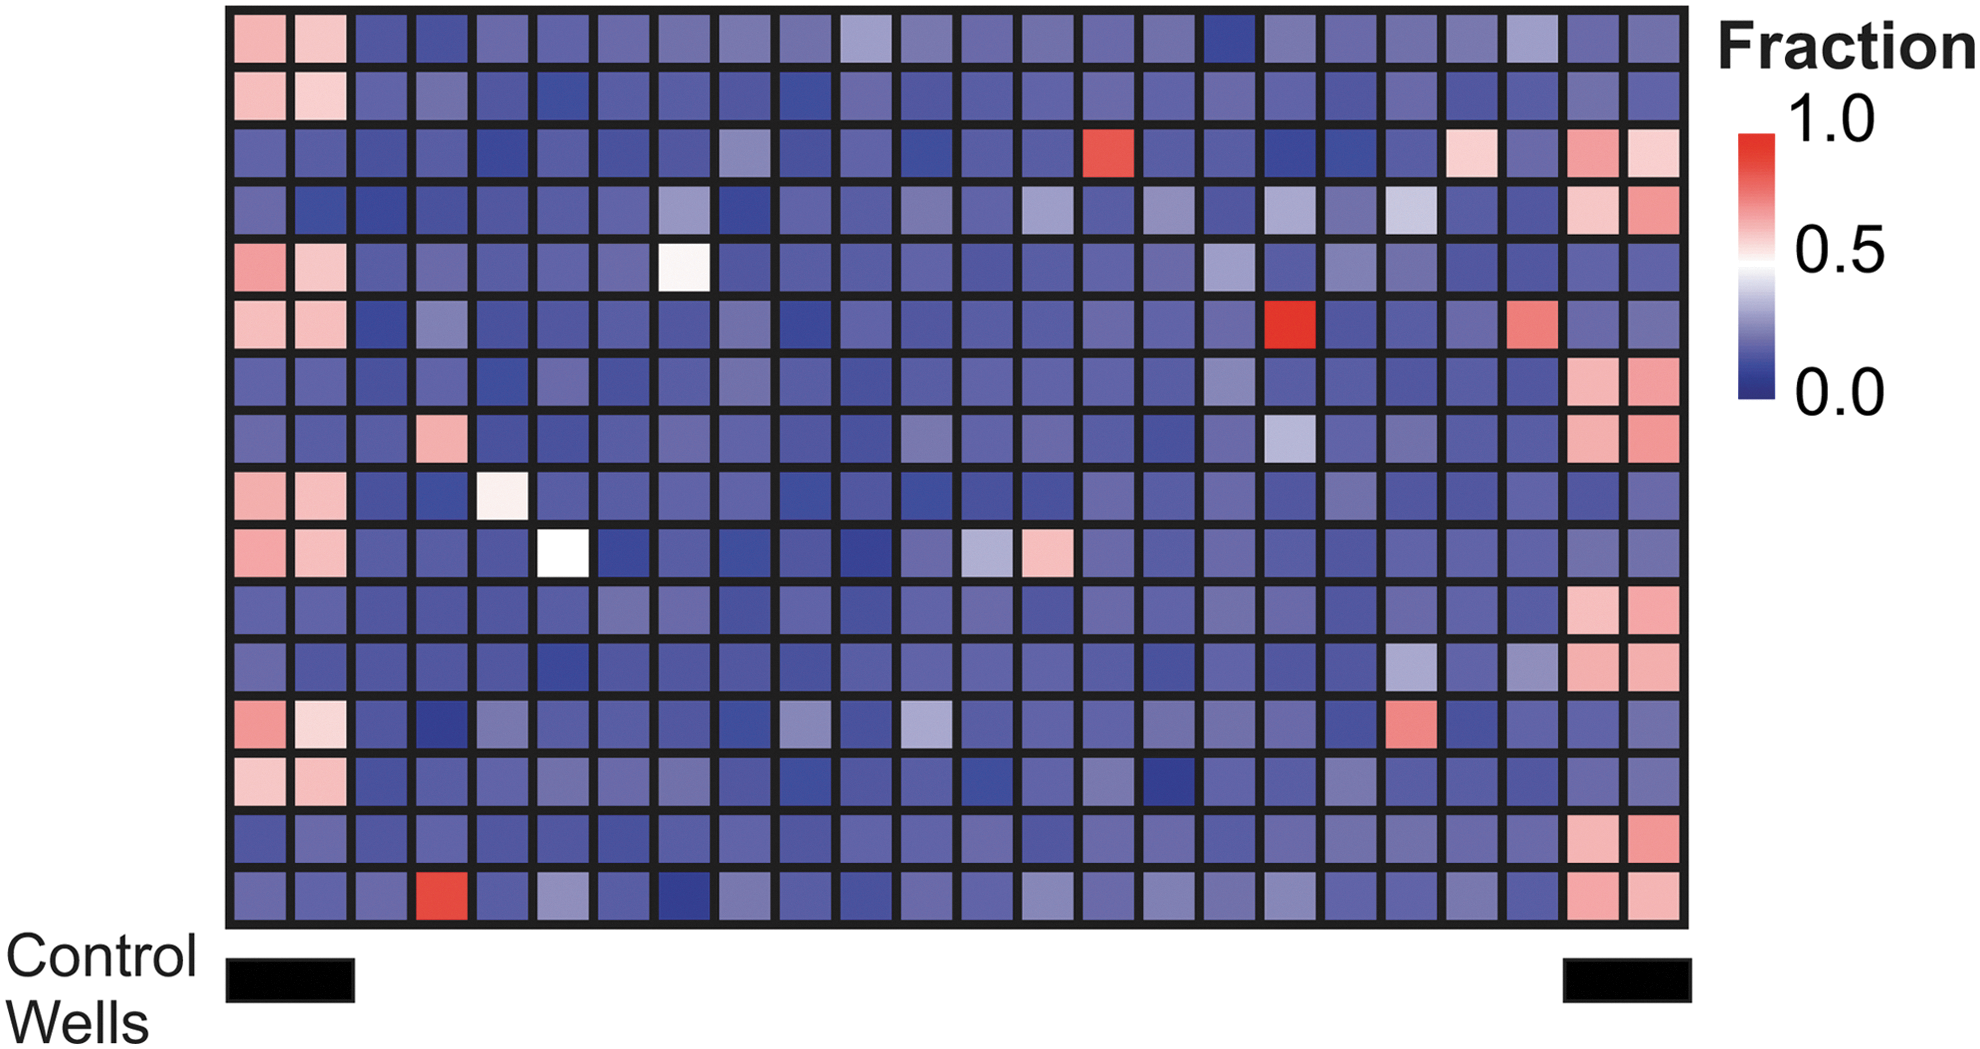
Cytotoxic kinase inhibitors identified by MVA-NAO screening. MVA-NAO heat map where the color indicates the fraction of cells per well classified as affected (similar to TNFα treated), as indicated to the right of the panel. Columns of control wells containing cells treated with either TNFα or DMSO (pink or blue, respectively) are indicated below the panel.
Cytotoxicity of Kinase Inhibitors
Discussion
A cell is considered dead in vitro when it loses plasma membrane integrity 2,3 ; however, a cell can be committed to dying long before this point is reached. Initiation of cell death processes is associated with a wide range of measurable changes within the cell. 2 Biochemical assays based on immunoblotting permit such determinations for averaged cell populations, but are labor intensive and slow. While image-based techniques are amenable to a high-throughput report on individual cells and can report statistically significant changes, currently available image-based techniques require multiple steps, optimization, and are expensive, making them suboptimal for a drug screen aimed at providing biochemical-quality data (Fig. 2).
For a screen, the assay needs to be able to identify compounds as either active or inactive based on data from one sample (i.e., well), so any overlap in the distribution of response between active and inactive treatments results in false readouts. Moreover, the mechanism of cell death by any one compound may be very different than the positive control used in the screen. Ideally, the assay should not score stress responses as cytotoxic unless the stress is so acute that the cells will eventually die. Our results suggest that MVA-NAO fulfills all of these criteria as the dye is inexpensive, requires only a single addition step, no wash, and relatively little optimization. Due to the excitation sources available, we chose DRAQ5 as the DNA stain. Similar results would be obtained with a UV-based DNA stain (DAPI or Hoechst) on instruments capable of UV excitation, making this approach broadly applicable. Furthermore, the multivariate techniques needed to interpret the image data are commonly included in image processing software packages.
The quality of a screening assay is typically measured through calculation of a Z′ value based on high and low control treatments. 14,15 In our hands, 24 h post-treatment, traditional measures of apoptosis such as cell count, nuclear shrinkage, and Annexin V staining all showed highly significant changes between our low controls (untreated) and high controls (TNFα), but low Z′ values (Table 2). Other measures gave better Z′ values, such as measures of mitochondrial membrane potential and caspase activation, but the highest Z′ values were obtained using MVA-NAO. As well as giving improved Z′ values for TNFα as a high control, MVA-NAO was able to identify toxicity induced by TG and BFA—known activators of cell death—at concentrations much lower than was detected by other image-based apoptosis assays (Fig. 2). In fact, only MVA-NAO detected activity in BFA at concentrations found to induce PARP cleavage in immunoblot.
In multivariate image analysis, a classifier is trained using features from cells known to be from the two classes to be separated. Selection of data for each class for training can be data from individual cells that a user has manually selected and identified 16 or from a random subset taken from cells treated with or without known modulators of the response under study. Screening experiments are typically designed with in-plate controls, which inherently lend themselves to use as training data. In our case, we used the in-plate controls as training sets to remove the laborious manual classification step. Furthermore, to remove concerns about outlier cells affecting the reproducibility of the classifier when making random selections, we have taken a pragmatic approach using population averages from the high and low control wells as positive and negative controls, respectively, to train the classifier. This also simplifies and expedites the training of the classifier. While we used well-level averages to train the classifier, we used cell-level data, not well-level averages, for classification of unknown compounds. Using well-level averages would have resulted in a binary decision for the well and not have allowed sufficient granularity for ranking activity or derivation of dose–response curves.
Surprisingly, we found that a single activator of apoptosis (TNFα) could be used to correctly, although with reduced sensitivity compared to the appropriate biochemical assay, classify activators of other cell death pathways. Comparison of the MVA-NAO data with the results of biochemical analyses for apoptosis, necrosis, endoplasmic reticulum stress, and autophagy suggests that when the classifier is trained on a positive control that kills cells exclusively by apoptosis, it is less sensitive at detecting cells dying by necrosis and does not incorrectly score endoplasmic reticulum stress or autophagy as cytotoxic unless the drug concentration is sufficiently high to kill cells. This is supported by the dose–response curve for tunicamycin, which does not plateau over the concentrations we have tested here.
Many drug trial failures and withdrawals can be attributed to unexpected organ toxicity. As such, predictive toxicity assays play a key role in drug development. Many idiosyncratic drug toxicities are correlated with mitochondrial function. Since NAO-related features will be correlated to mitochondrial function and structure, this assay should be useful for early identification of drug toxicity. 17
Footnotes
Acknowledgment
This work was supported by CIHR grant FRN10490 to DWA.
Disclosure Statement
No competing financial interests exist.