
Abstract
Measuring target coverage of small molecule inhibitors is paramount–first, for selection of molecules to progress through the drug development process and second, once a candidate drug moves to clinical testing, for guiding dose/schedule selection. Single cell network profiling (SCNP) using multiparameter flow cytometry can measure compound effects on multiple signaling cascades in a cell-type-specific manner. We applied SCNP to a panel of compounds with reported inhibitory effects on Jak/Stat signaling using a novel system where modulation of multiple signaling cascades are simultaneously measured in discrete cell subsets in whole (ie, unfractionated) blood. Jak2 vs. Jak3 selectivity as well as “off-target” effects on other cell signaling pathways were measured using a combination of cytokines that target different white blood cell subsets, namely GM-CSF (monocytes/granulocytes), IL-2 (T cells), and CD40L (B cells). The compounds were then rank-ordered by potency and selectivity against the different pathways tested. Notably, SCNP performed in whole unfractionated blood compared to fractionated peripheral blood mononuclear cells (PBMC) from the same donors revealed potency loss for all compounds, with one exception. These studies show that SCNP can be used to efficiently measure a drug candidate's potency and selectivity in a physiologically relevant environment (eg, whole blood) and that robust IC50 are attainable from rare subpopulations (<100 cells). The ability to generate in vitro IC50 measurements in whole blood can be used not only for the preclinical selection of lead molecules, but also to determine the target plasma concentration for clinical studies and to measure target coverage after drug administration in early phase clinical trials. Knowledge of the compound plasma concentration necessary to achieve biochemical coverage permits rational design of clinical trials based on biologically active dose vs. the traditional maximum tolerated dose (MTD) design, which is better suited for cytotoxic, nontargeted drugs.
Introduction
A growing body of evidence suggests that drug and target interactions occur within a complex and intricate network of biological effects, 1,3 and therefore a network approach to the study of human disease and drug–therapy interactions is likely to improve efficiency in all phases of drug development. 4 –9
This paradigm shift, from a reductionist to a complex network approach, has been driven by the development of high-throughput/high-content technologies and the advent of the post-genomics era. 10 These technologies enable the interrogation of multiple data points, such as components within one and/or parallel cellular signaling pathways, in a simultaneous, high-throughput fashion. These new molecular tools provide a systematic assessment of the functionality of cellular biochemical pathways, both in homogeneous as well as heterogeneous cell populations. However, in heterogeneous cell populations such as peripheral blood, bone marrow, or tumor samples, the results often times reflect only the average cell population. Effects on rare cell subpopulations within the complex tissue can be missed.
Here, we show the application of single cell network profiling (SCNP) in different phases of drug development. SCNP is a novel flow cytometry-based approach that allows simultaneous multi-parametric analysis of modulated signaling networks at the single cell level in complex tissues (such as peripheral blood or bone marrow) without need for preassay cell separation. 11 –14 For illustrative purposes, we investigated 2 cellular pathways currently of great interest in oncology drug development—the phosphoinositide 3-kinase (PI3K) pathway, PI3K being a member of a multigene family that mediates numerous physiological processes including cell growth and proliferation, and the Janus kinases (Jak) signal transducers and activators of transcription (Stat) pathway. We show how the SCNP platform can be used to simultaneously measure the effects of multiple stimulators and inhibitors on different signaling networks at the single cell level in multiple cell types. We also show that SCNP can quantify differential inhibition in important rare cell populations.
The potential of SCNP as a means to interrogate signaling pathways and to screen for modulating effects of small molecule inhibitors has been previously reported in the academic setting by Krutzik et al. 15 The current study extends SCNP to a broader use in an industrial setting by the generation of robust and reproducible, high-throughput assays.
Materials and Methods
Figure 1 shows the schema for profiling small molecule kinase inhibitors using SCNP.
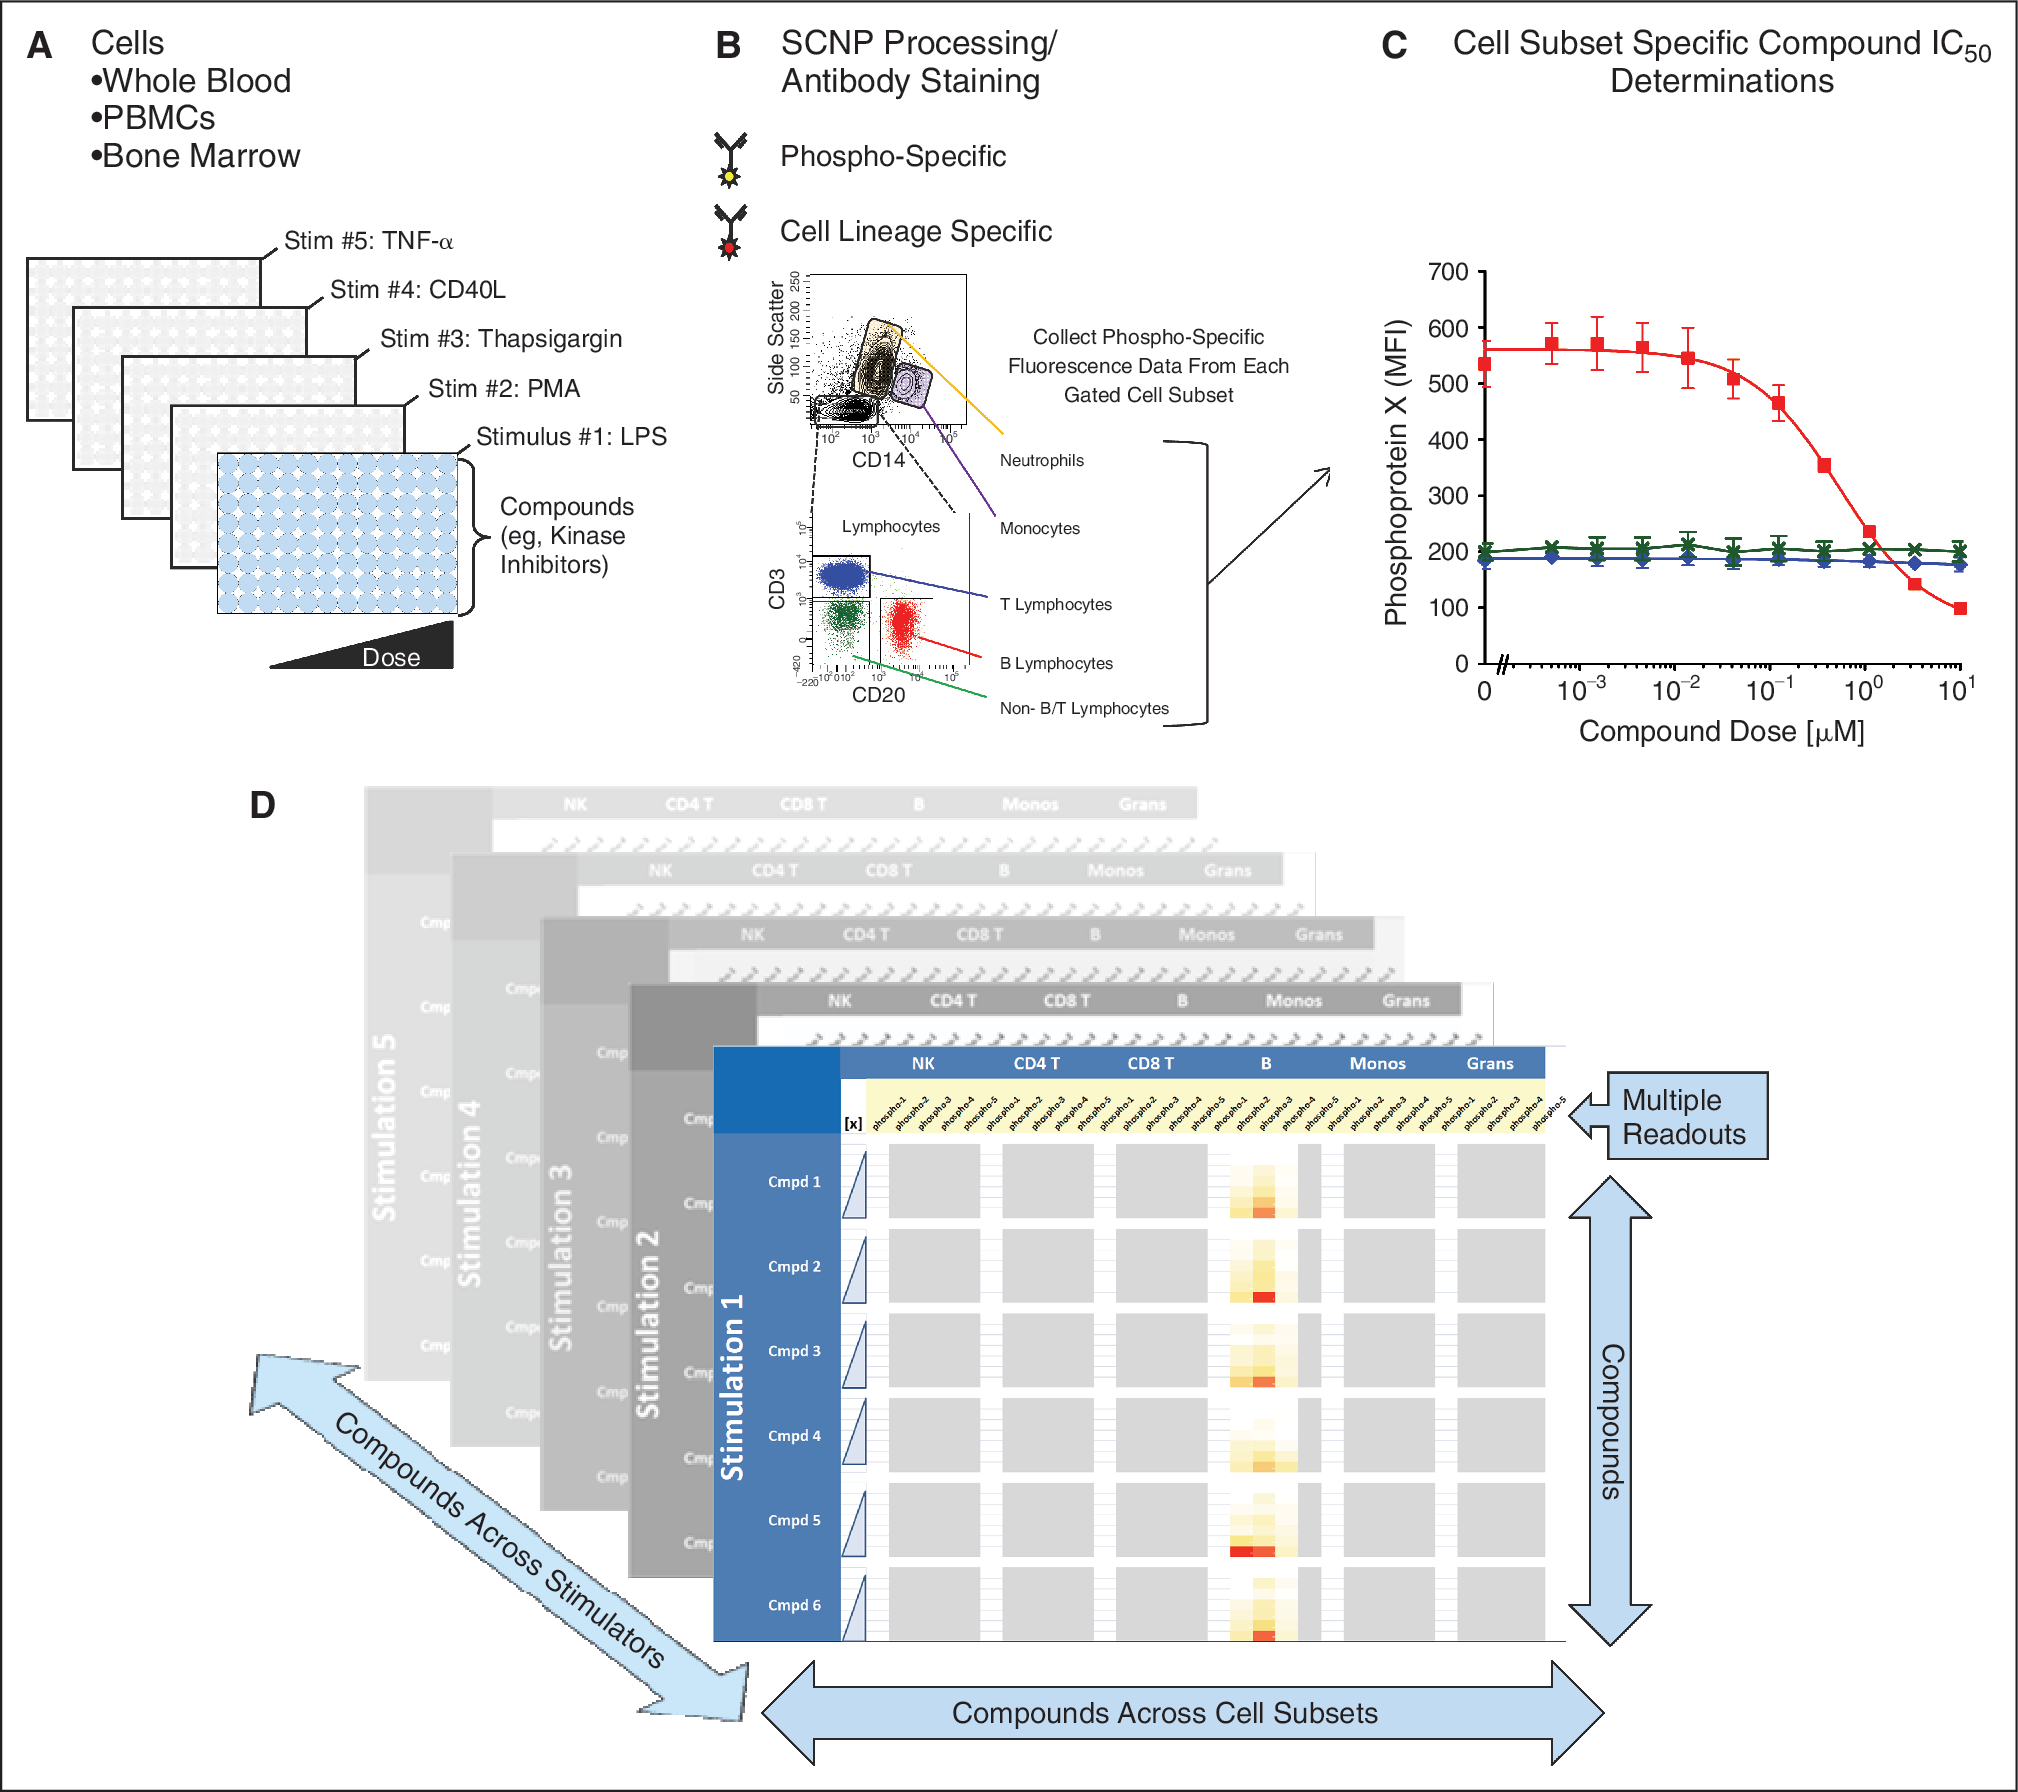
Experimental workflow: typical schema for profiling small molecule kinase inhibitors using single cell network profiling (SCNP). (
Cellular Populations
Whole blood from healthy consented donors (IRB approval #07017-0) was collected in heparin-coated Vacutainer tubes (BD Biosciences, San Jose, CA). Peripheral blood mononuclear cells (PBMC) were isolated using Ficoll-Hypaque (Pharmacia, Uppsala, Sweden) and then plated into polypropylene U-bottom 96 deep well plates (Nunc, Rochester, NY) at 1 × 10⁵ cells per well in RPMI/1% fetal calf serum (FCS). For whole blood assays, 90 μL/well were aliquoted. Cryopreserved, Ficoll fractionated, bone marrow samples from healthy individual were purchased from AllCells (Emeryville, CA). Cells from cryogenic storage were thawed in a 37°C water bath, diluted with RPMI/1% FCS, washed 2 times, and then plated at 1 × 10⁵ cells per well in RPMI/1% FCS. For PBMC and bone marrow preparations, cells were incubated for 2 h at 37°C prior to addition of a small molecule.
Stimulators and Small Molecule Inhibitors
Appendix Tables 1 and 2 summarize the stimulators and small molecule inhibitors that were used in the experiments. All small molecule inhibitors were dissolved to 10 mM in 100% dimethylsulfoxide (DMSO). The 3-fold dilutions were made in DMSO across a standard 96-well plate followed by a 100-fold dilution into RPMI/1% FCS. For each well, 10 μL was then transferred to the deep well plate containing 90 μL of cells or whole blood at a final DMSO concentration of 0.1%, and then incubated for 1 h at 37°C. Control wells without compound also contained 0.1% DMSO. Reagent addition was performed using a Matrix Hydra DT (Thermo Scientific, Waltham, MA). Stimulants were then added to the cell plate separately or in combination (as stated in Results) for the incubation times summarized in Appendix Table 1. All stimulations were performed at 37°C. In experiments where bone marrow or fractionated mononuclear cells were used, fixation was performed using 3.2% paraformaldehyde (Electron Microscopy Sciences, Hatfield, PA) diluted in phosphate-buffered saline (PBS) and added to cells for a final concentration of 1.6% and incubated for 10 min at 37°C. When unfractionated whole peripheral blood was used, fixation was performed by adding 1.5 mL/well of 1× Phosflow Fix/Lyse buffer (BD Biosciences, San Jose, CA) followed by incubation for 10 min at 37°C. Plates were then centrifuged and cell pellets were resuspended, and cells permeabilized with 600 μL/well 100% ice cold methanol (Sigma-Aldrich, St. Louis, MO) were added while vortexing. Cells in methanol were stored overnight at −80°C.
Surface and Intracellular Cell Staining
Plates from −80°C storage were centrifuged, supernatant aspirated, and cell pellets washed twice with FACS Buffer (PBS 0.5% BSA, 0.05% NaN3). Standard cell staining methods for flow cytometry were performed. The phenotypic antibodies used to discriminate cell subsets as well as the antibodies used to measure intracellular phosphorylated proteins are listed in Appendix Tables 3 and 4 Approximately 30,000 cell events were acquired on a 3-laser LSRII flow cytometer running FacsDiva software (BD Biosciences). Data were analyzed using FlowJo software (Treestar, Ashland, OR) for cell surface gating and extraction of median fluorescence intensity (MFI) values.
IC50 determinations and statistical analysis
IC50 curves and 95% confidence intervals were generated in GraphPad Prism (La Jolla, CA) by fitting sigmoid dose–response curves with variable hill slope to the MFI values and the log concentration. In some cases, the MFIs were then normalized in Excel (Microsoft, Redmond, WA) to percent of control (POC) with the control being the stimulated condition without inhibitor as follows:
The Z' factor assay robustness measure has been described previously. 16 All P values were generated using the R Software (V2.9.2) package. 17
Results
Evaluation of Inhibitor Potency
IC50 calculation by measuring a single protein (node) in a signaling pathway in a heterogeneous cell population. Freshly fractionated PBMC were used as an example of a complex cell population in which kinase inhibitor potency was evaluated. An anti-IgM antibody, specific for the B-cell receptor (BCR) cell population, was used as a stimulant. A single phosphoprotein readout, p-Akt (S473), an established marker for evaluating the PI3K pathway, was measured in the presence and absence of LY294002, a noncovalent competitive inhibitor of PI3K.
As shown in Figure 2A, compared to basal levels, BCR stimulation by anti-IgM antibody evoked a ∼4-fold increase in p-Akt (S473) specifically in the CD20+CD3− gated cell subset as expected for this B-cell-specific stimulation. Preincubation (before stimulation) with LY294002 inhibited the evoked p-Akt (S473) activation in a dose-dependent manner with a half-maximal inhibitory concentration (IC50) of 0.54 μM (R 2 = 0.996) (Fig. 2B), which is consistent with the values reported in the literature for this molecule. 18
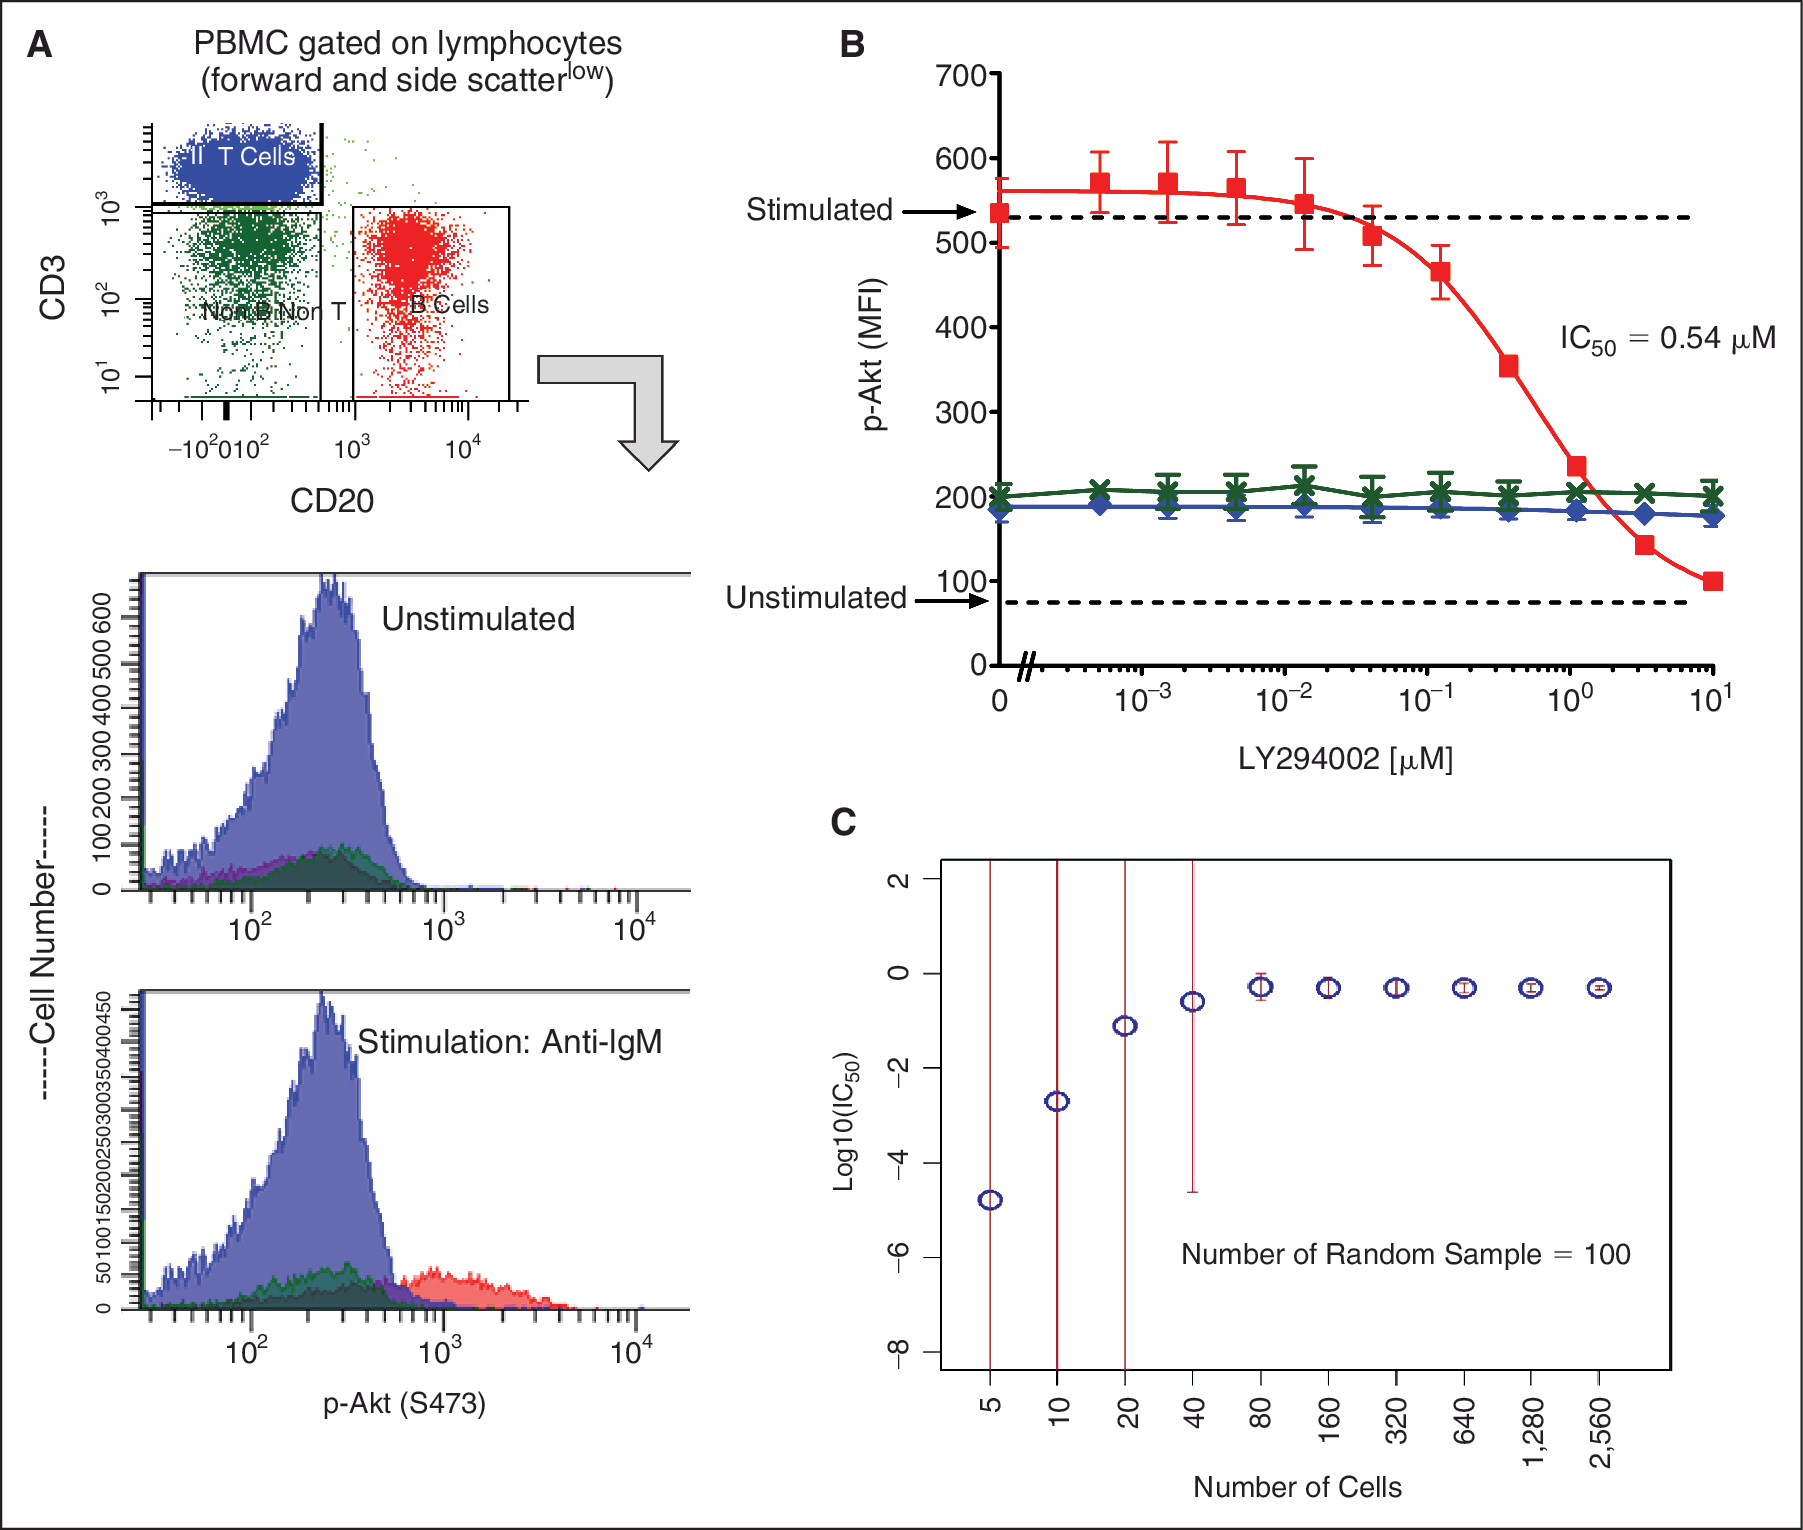
Quantifying potency of a phosphoinositide 3-kinase (PI3K) inhibitor in a single cell subset by SCNP flow cytometry. (
An in silico estimate of the minimum number of cells needed to generate robust IC50s was performed. Random samplings of 5 cells were made for each concentration of the inhibitor. An IC50 was calculated using the data from only these cells. This process is repeated 100 times to provide an estimate on the standard deviation of the IC50 for that number of cells. The process was repeated for sampling sizes of 10, 20, 40, 80, 160, 320, 640, 1,280, and 2,560 cells. Figure 2C shows the calculated IC50 values and standard deviation for each of these sampling sizes. The standard deviations of the IC50 estimates remain small even down to the 80-cell sampling size estimate. Increasingly inconsistent IC50 estimates are observed with samples sizes below 40 cells. This data demonstrate that quantitative IC50 estimates can be calculated from relatively few cells within a heterogeneous sample using the SCNP platform. This is particularly relevant for the oncology setting where cancer stem cells and minimal residual disease are critical targets to address pharmacologically.
IC50 determination of a specific pathway inhibitor measuring multiple proteins (multiple nodes) simultaneously in multiple cell populations in unfractionated whole peripheral blood. In this experiment, p-Stat3 was first measured in response to stimulation with IFN-α added directly to whole peripheral blood without prior cell fractionation. The advantages of using whole peripheral blood as a source of complex tissues are both practical (fewer laboratory manipulations) and increased clinical relevance. A single antibody cocktail, including cell surface and phospho-specific antibodies, conjugated to distinct fluorophores, was used to discriminate the signaling response in 7 cell populations depicted in Figure 3A (see Appendix Fig. 1 for gating scheme). For each cell subset, the MFI for p-Stat3 was captured in the basal and stimulated condition (Fig. 3B). In contrast to the BCR-specific stimulator in Figure 2, IFN-α induced signaling in all cell subsets, as would be expected based on the broad expression of the IFN-α receptor (Fig. 3B). However, the magnitude of the p-Stat3 response varied depending on the cell subset. Inhibition of p-Stat3 phosphorylation could be seen by pretreatment with Pyridone 6, a commonly used pan-Jak inhibitor. 19 As a measure of potency, the IC50 on evoked Stat3 activation was calculated for the different cell subsets, shown in Figure 3B.
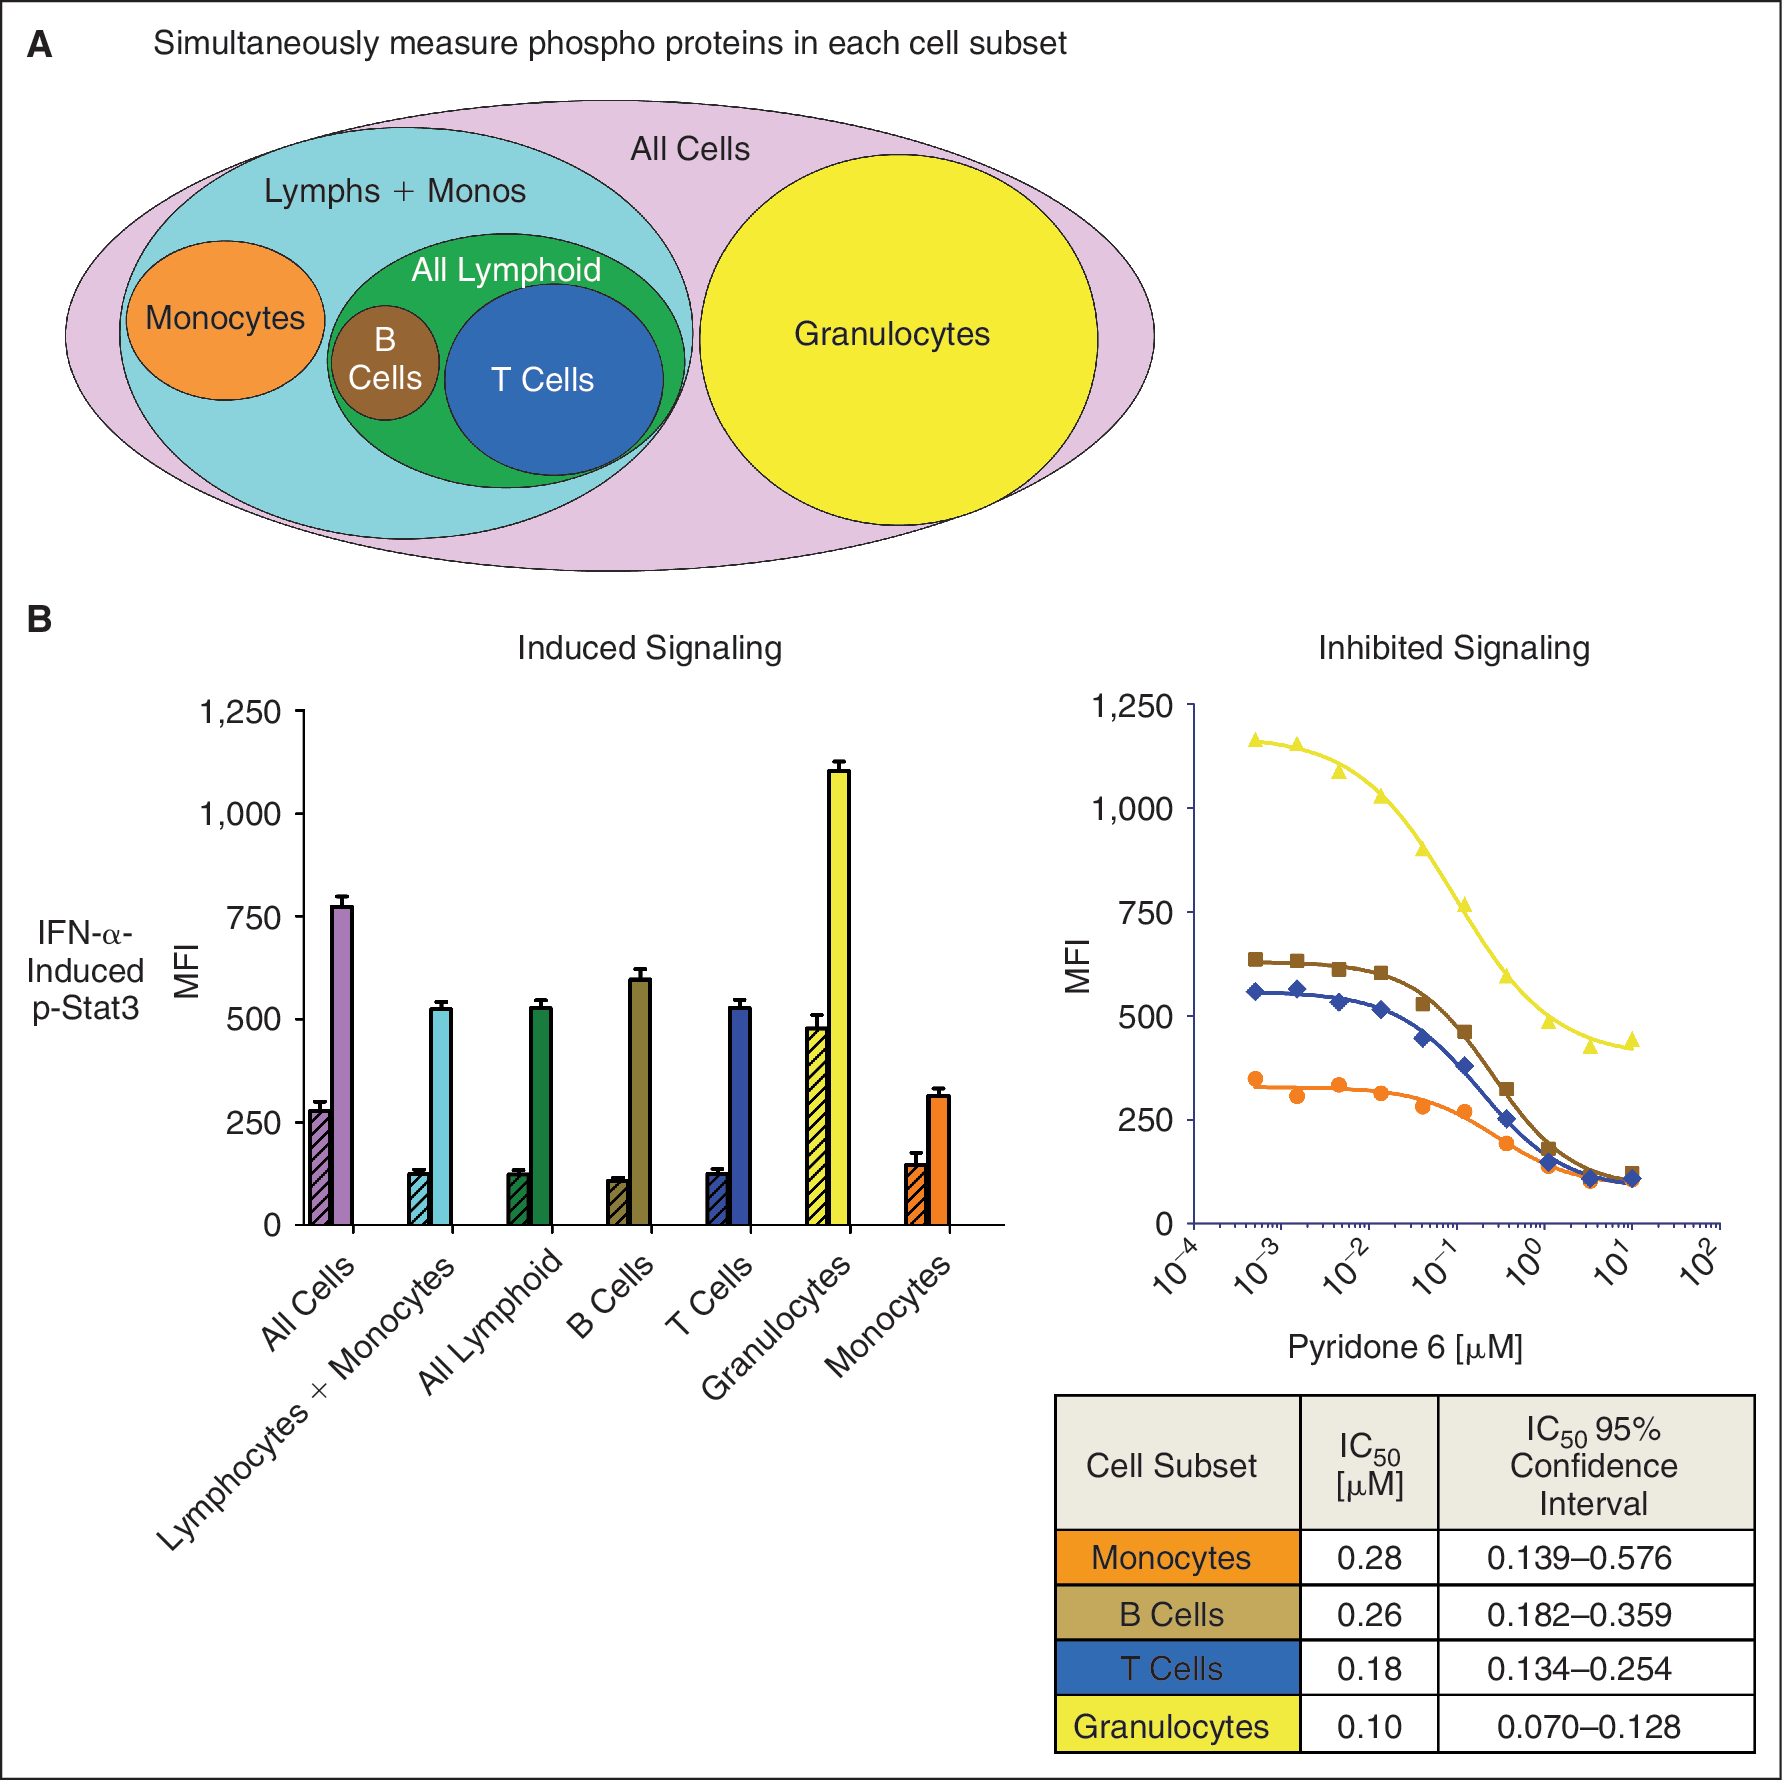
Simultaneous measurement of IFN-α-induced Stat3 phosphorylation in various cell subsets in whole blood by SCNP. (
In the same experiment, p-Stat1 (Y701) and p-Stat5 (Y694), 2 other signaling nodes in the same Jak/Stat pathway were also measured simultaneously with p-Stat3 in response to stimulation with IFN-α added directly to whole blood. For each subpopulation, the MFI for p-Stat1 and p-Stat5 was captured in the basal and stimulated condition (Fig. 4A). As expected, IFN-α induced the phosphorylation of Stat1 and Stat5 in all cell subsets (Fig. 4A) and inhibition of p-Stat1 and p-Stat5 phosphorylation could be seen by pretreatment with Pyridone 6 in all these subsets (Fig. 4B). However, the potency of Pyridone 6 in inhibiting IFN-α-induced Stat activation was different for the different phospho-Stats in the different cell subsets (Figs. 3B and 4B). Thus, the simultaneous analysis of multiple phosphoproteins at the single cell level allows one to quantitatively measure the varying magnitudes of signaling in multiple cell populations in the same sample, and thus, to develop a more comprehensive IC50 profile for a specific inhibitor.
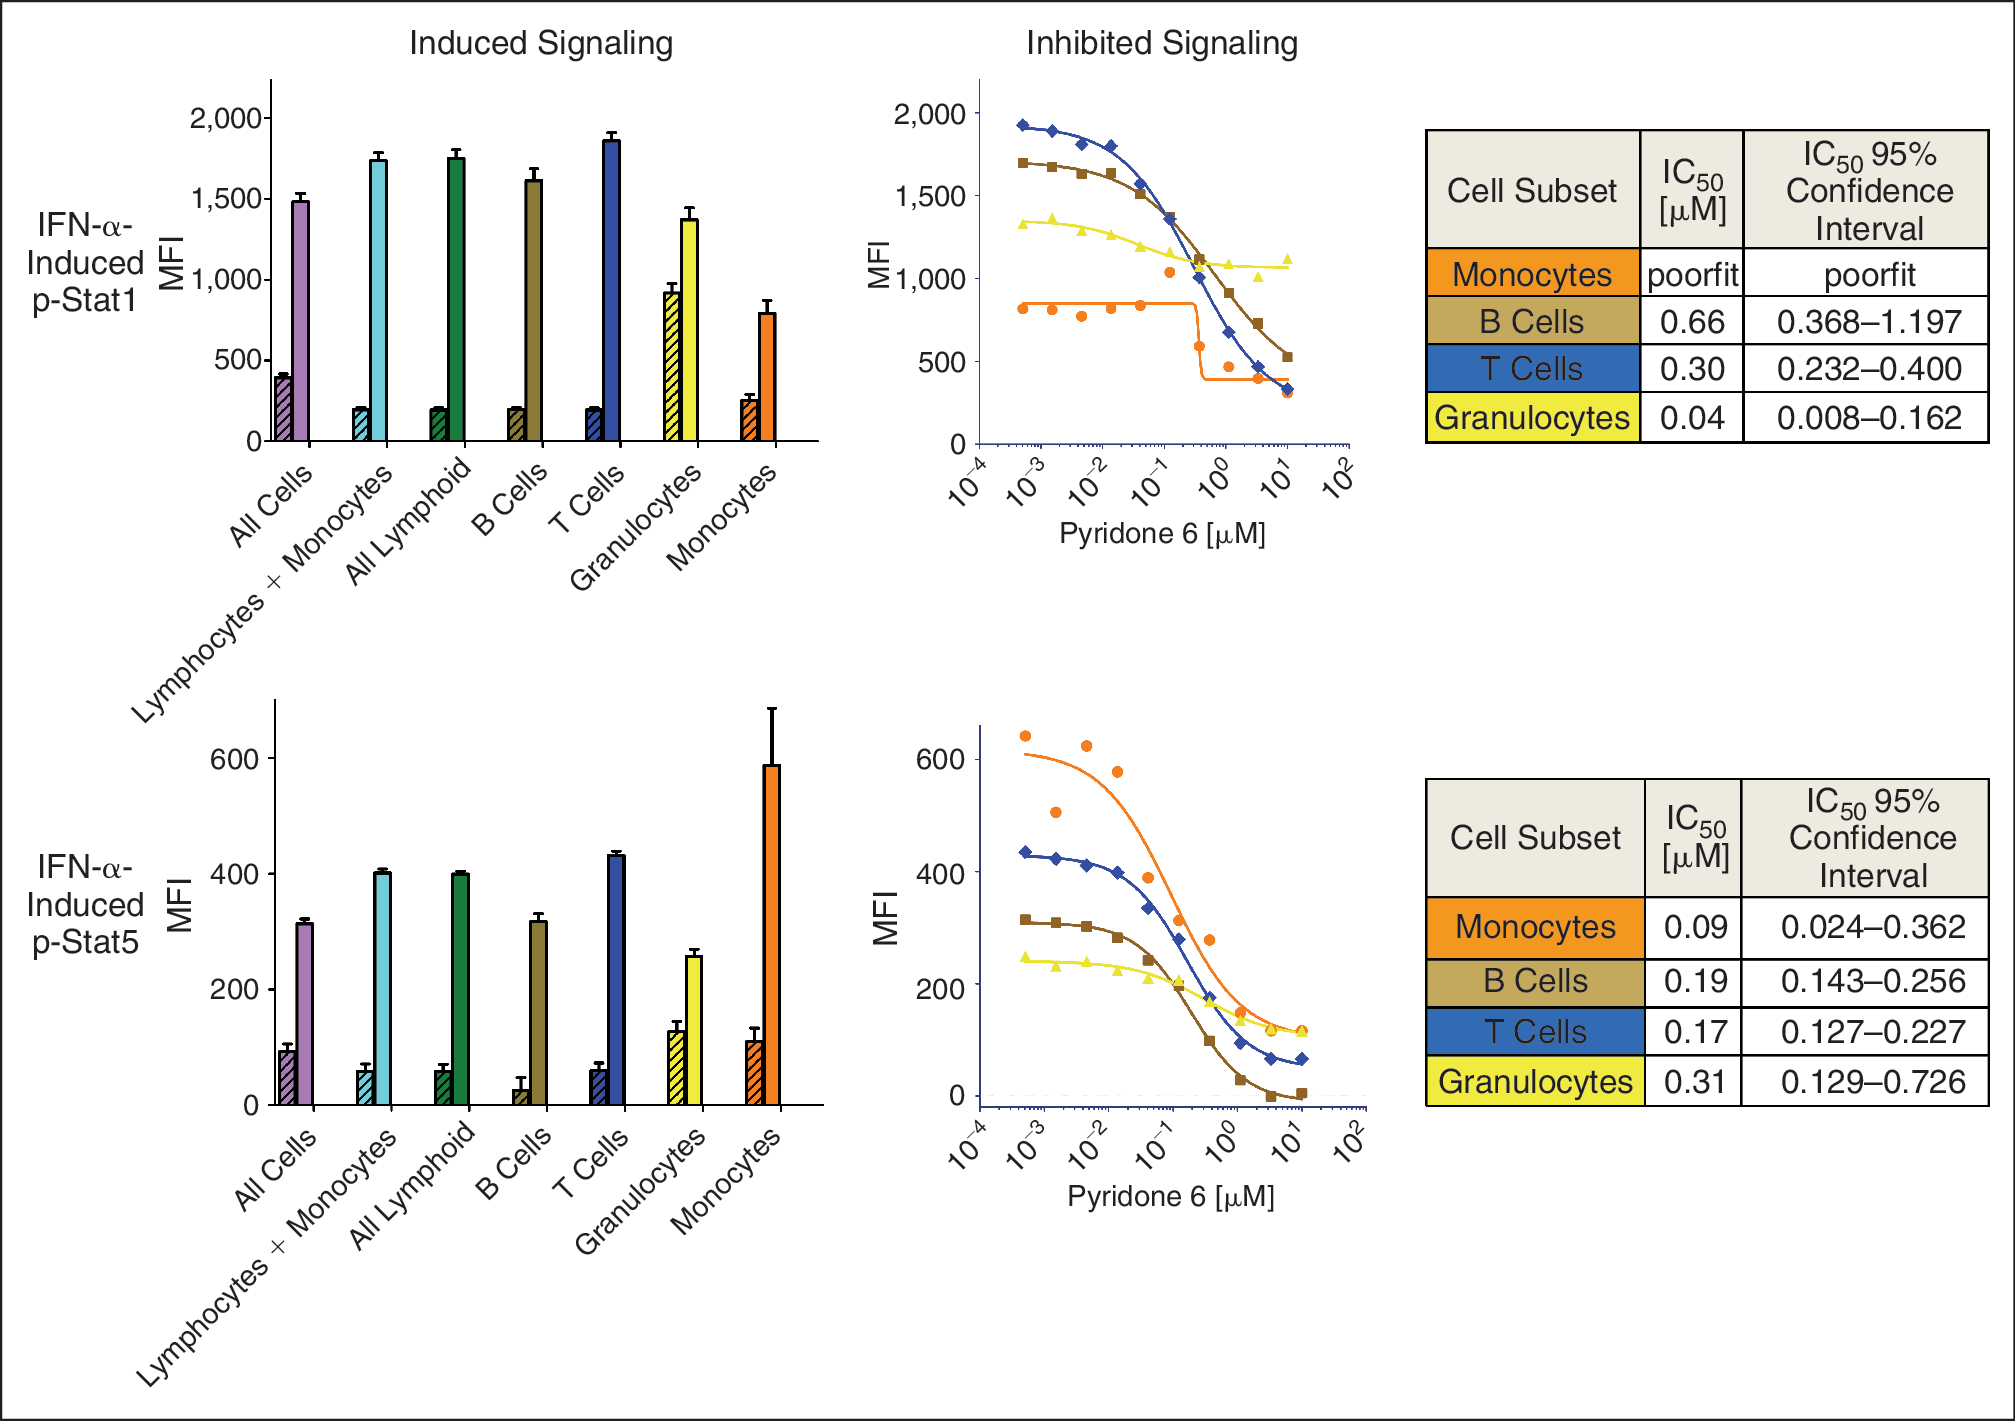
Simultaneous measurement of IFN-α-induced Stat1 and Stat5 phosphorylation in various cell subsets in whole blood by SCNP. (
Assessment of Inhibitor Target Selectivity
Measurement of target selectivity in the Jak/Stat pathway in multiple cell populations in whole blood. It has been reported that GM-CSF-driven p-Stat5 activation is mediated through Jak2, while IL-2-induced Stat5 activation is mediated through Jak3. 20 Since assessing the target selectivity of different inhibitors is an important aspect in different phases of drug development, the ability of SCNP to measure the target selectivity in the Jak/Stat pathway was assessed in multiple cell populations in unfractionated whole blood. Specifically, p-Stat5 was measured in response to stimulation with IL-2 and GM-CSF. Each cytokine induced a distinct pattern of p-Stat5 signaling in the cell population that expressed its cognate receptor (Fig. 5A). IL-2 activated p-Stat5 in T cells and GM-CSF activated p-Stat5 specifically in monocytes and granulocytes, cell types known to express the GM-CSF receptor.
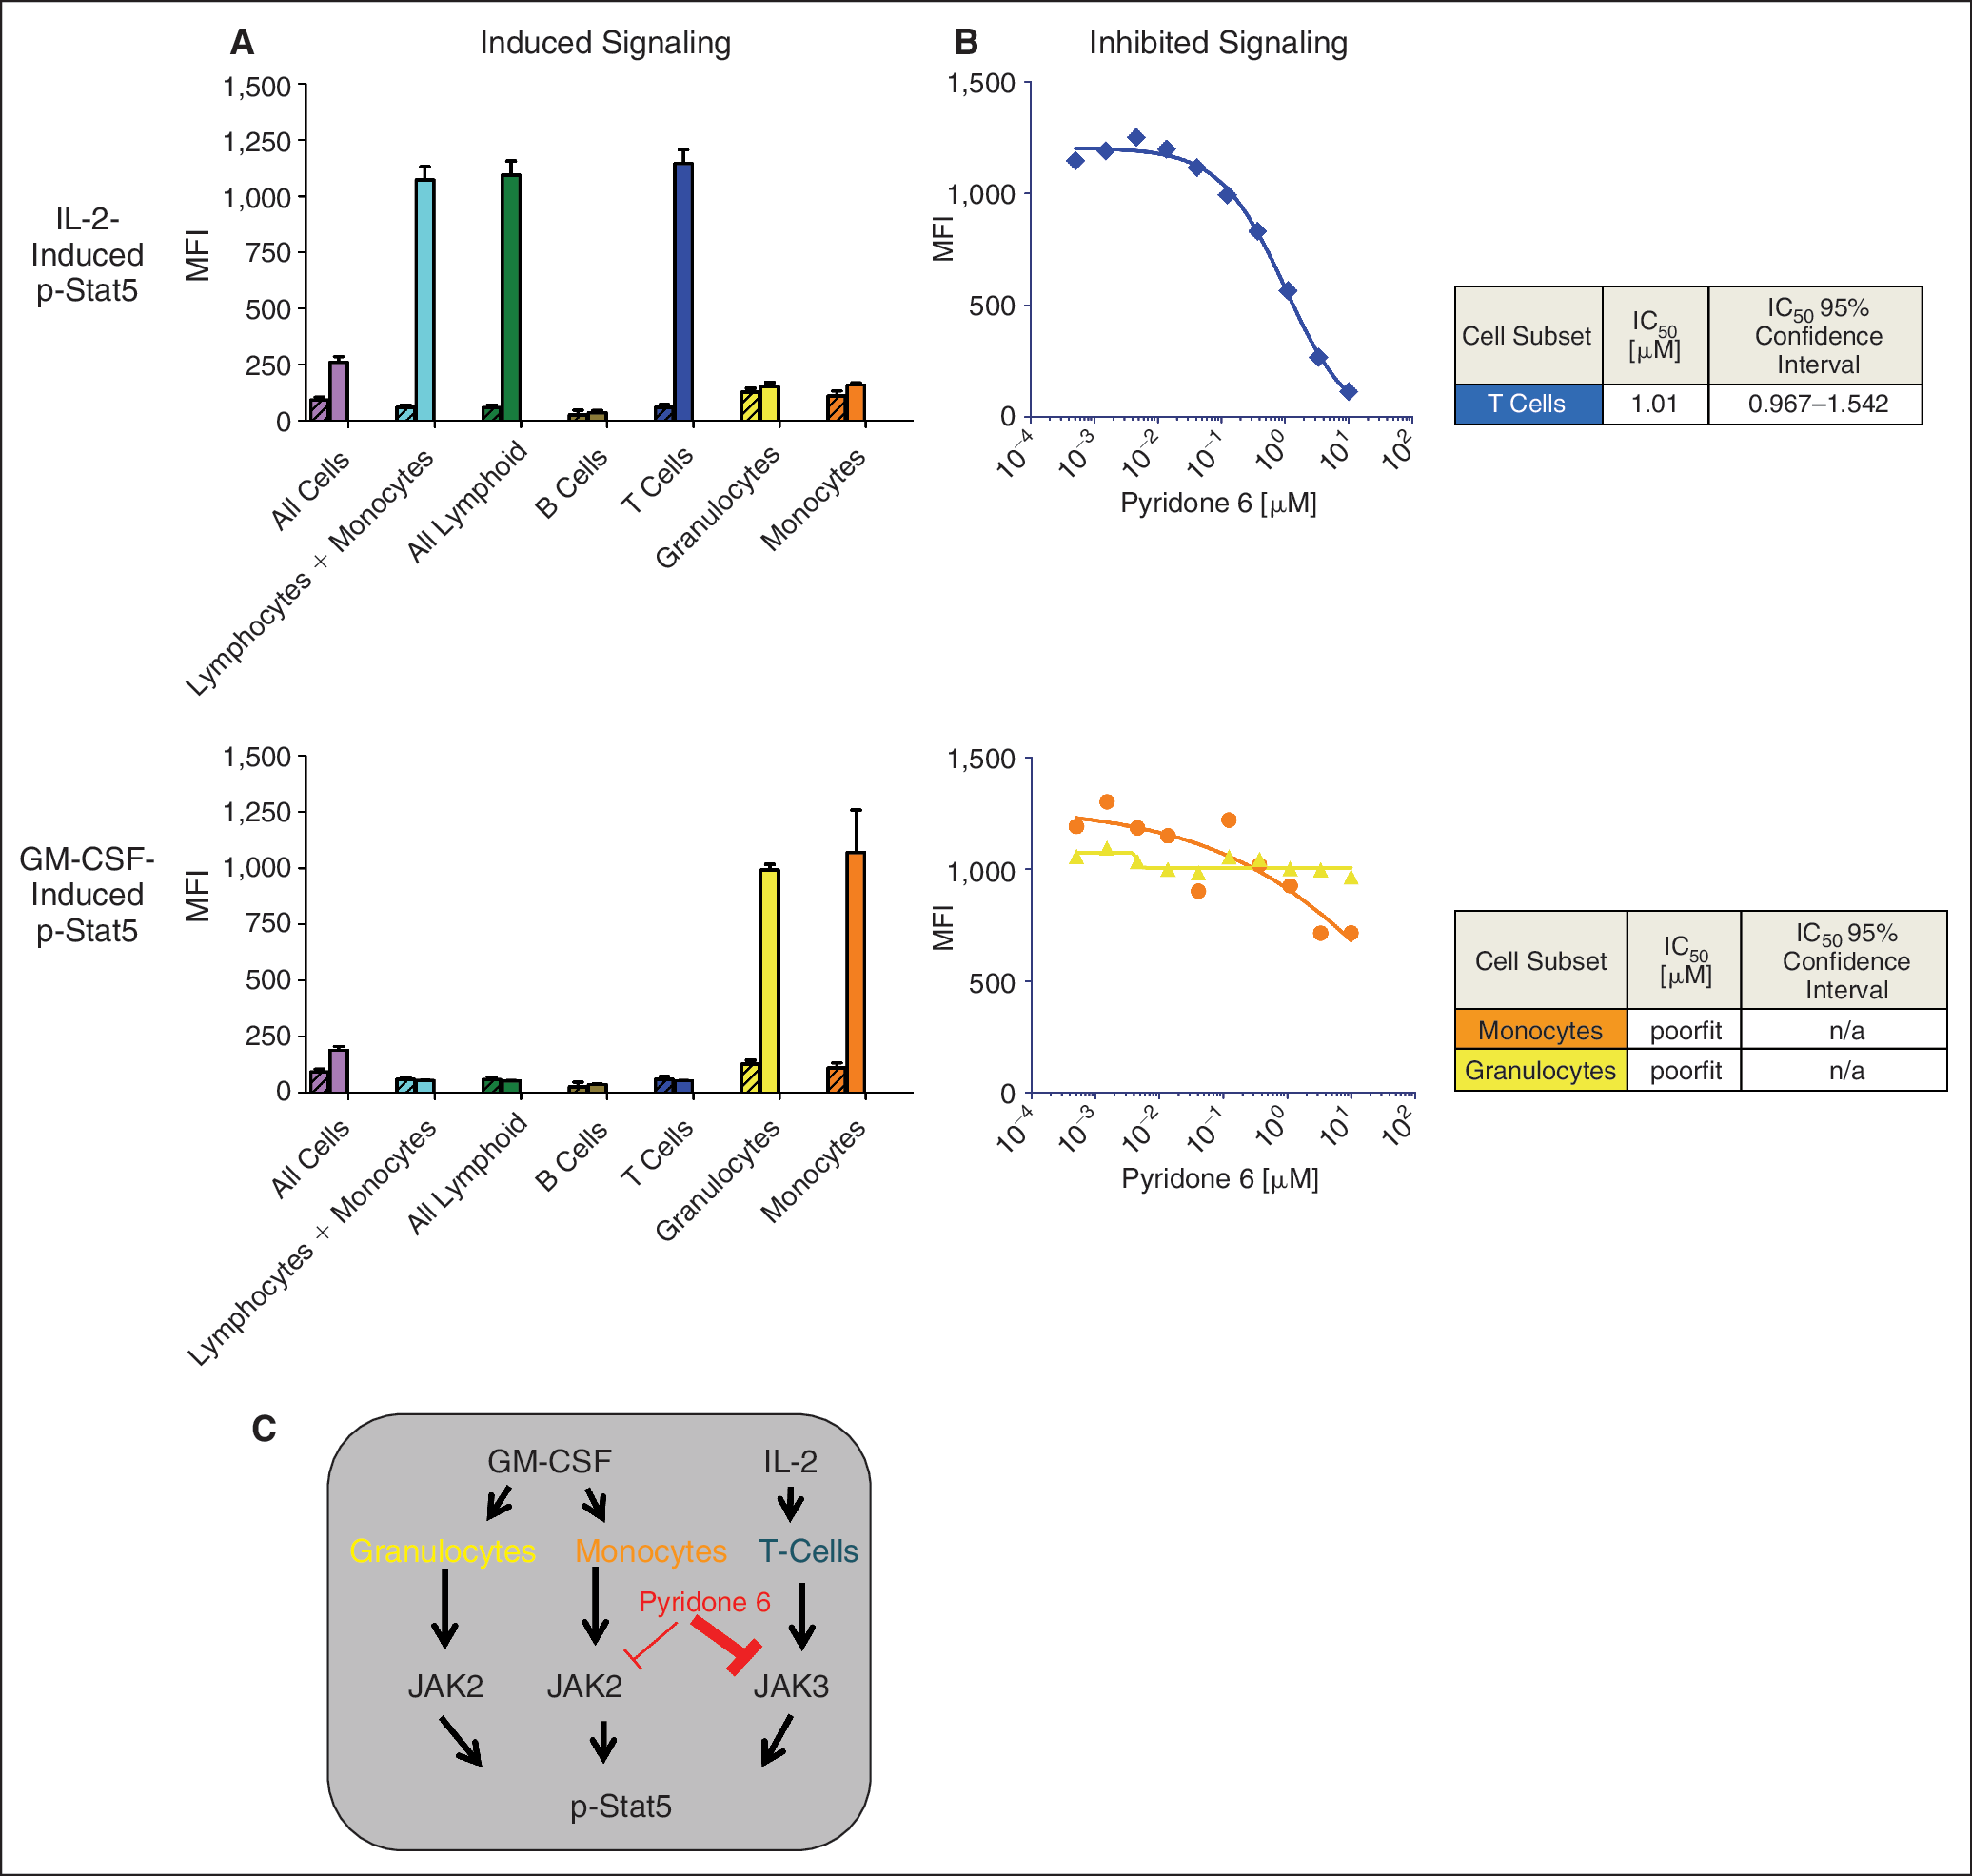
Measurement of IL-2 and GM-CSF-induced Stat5 phosphorylation in whole blood by SCNP. (
Inhibition of p-Stat5 phosphorylation could be seen by pretreatment with Pyridone 6. Pyridone 6 was more potent in inhibiting p-Stat5 signaling in IL-2-induced T cells (IC50 =1.01 μM) compared with GM-CSF-induced monocytes (IC50 >10 μM) (Fig. 5B) suggesting that, in whole blood, Pyridone 6 exhibits greater selectivity for Jak3 than Jak2. Further, there was no effect of Pyridone 6 on GM-CSF-induced Stat5 phosphorylation in granulocytes. This target selectivity is illustrated schematically in Figure 5C.
Measurement of target selectivity using a single high-content signaling profiling assay in whole blood
To increase the throughput of this platform, the possibility of combining multiple assays into a single profiling system was explored. By combining multiple signaling stimulators in the same well—each one targeting a different cell type—one could potentially measure the impact of a small molecule on many signaling cascades and in many cell types in one multiplexed assay. Using this multiplexed design, all cells are exposed to identical experimental conditions, and therefore, results can be easily compared between signaling pathways and stimulators.
For this experiment, 3 cell-specific stimulants were used: GM-CSF, IL-2, and CD40L (“triple stim”). Multiple phosphoprotein readouts, including p-Erk, p-Stat5, p-NFκB p65, and p-p38 were measured. Signaling inhibition was assessed using the pan-Jak inhibitor Pyridone 6. The receptors for IL-2, GM-CSF, and CD40L are expressed in specific and different cell types in whole blood. As a result, we expect a unique signaling response involving different signaling proteins for the distinct cell populations (Fig. 6B). In order to confirm that “triple stim” conditions would provide equivalent data as compared to individual stimulations, whole blood from a healthy donor was incubated with a titrated dose of Pyridone 6 and then stimulated for 15 min with IL-2, GM-CSF, CD40L separately or together in one cocktail (Fig. 6A). As expected, the magnitude of the signaling response was the same in both conditions for all gated cell subsets (Fig. 6C), suggesting no cross talk or synergism had occurred between pathways in this system.
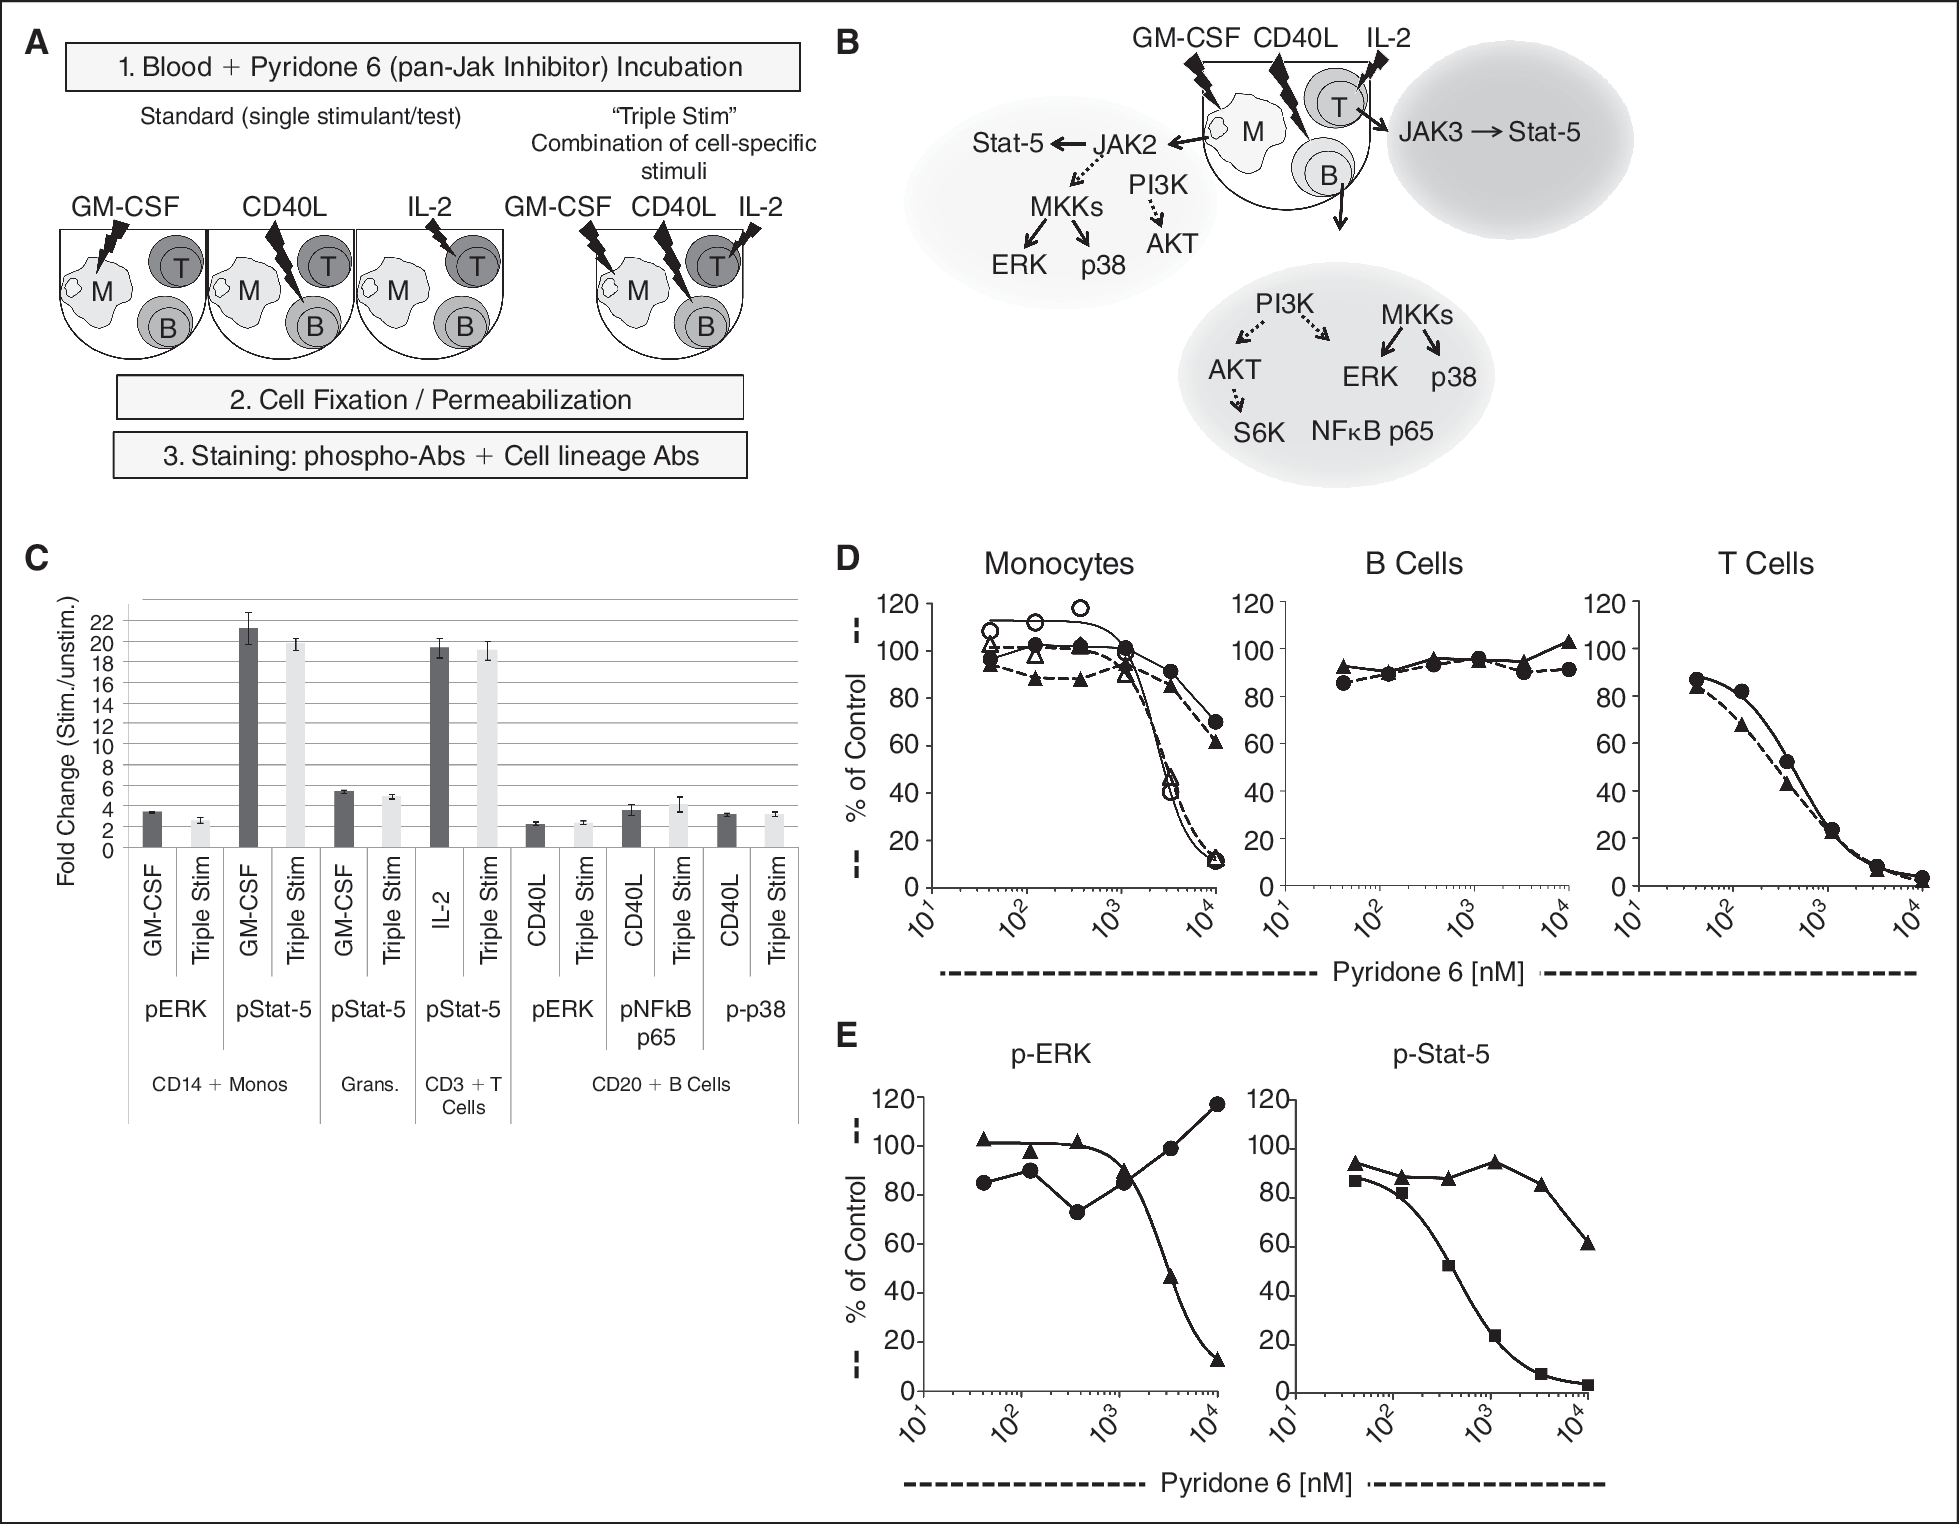
Comparing single vs. combination stimulation conditions in whole blood. (
Likewise, the inhibitory activity of Pyridone 6 was nearly equivalent when tested in the single or “triple stim” condition (Fig. 6D). Specifically, in the T-cell subset, the IC50 of IL-2-induced p-Stat5 activity is 0.47 μM in the single stimulation condition and 0.38 μM in the triple stim condition (Fig. 6D). In monocytes, Pyridone 6 led to the same reduction with IC50s of 2.4 μM in the single stimulant conditions and 2.2 μM in the triple stim condition (Fig. 6D).
This multiplexed approach can be used to efficiently probe the activity of an inhibitor across multiple signaling pathways in order to define its on-target and off-target activity simultaneously by gating on different cell populations. In contrast to its effect in monocytes, Pyridone 6 did not decrease p-Erk levels in B cells (Fig. 6D and 6E), suggesting this compound has no direct inhibitory activity on the Ras-MEK-MAPK pathway. The inhibition of GM-CSF-induced p-Erk activation in monocytes is likely a result of Jak2 inhibition, which is “upstream” of p-Erk in this signaling cascade.
Quantifying potency and target selectivity in a panel of kinase inhibitors in fractionated PBMC
In a similar manner, the “triple stim” (GM-CSF, IL-2, and CD40L) conditions were used to evoke cell-type-specific signaling responses in PBMC. The inhibitory effect on signaling activity in the Jak/Stat pathway was assessed using a panel of commercially available inhibitors reported to have inhibitory activity on Jak kinases.
The relative selectivity of Jak3 vs. Jak2 inhibition for the different compounds could be measured by plotting p-Stat5 inhibition curves from gated T cells (Jak3-mediated signaling) and monocytes (Jak2-mediated signaling) (Fig. 7A). This analysis enabled the rank ordering of compounds based on their potency and selectivity. Notably, CP-690550, currently in clinical trials for a variety of autoimmune diseases, was 36-fold more potent in T cells (Jak3-mediated) than in monocytes (Jak2-mediated). This compares to 13.7- and 2.2-fold for Pyridone 6 and “Stat3 Inhibitor VII,” respectively (Fig. 7B).
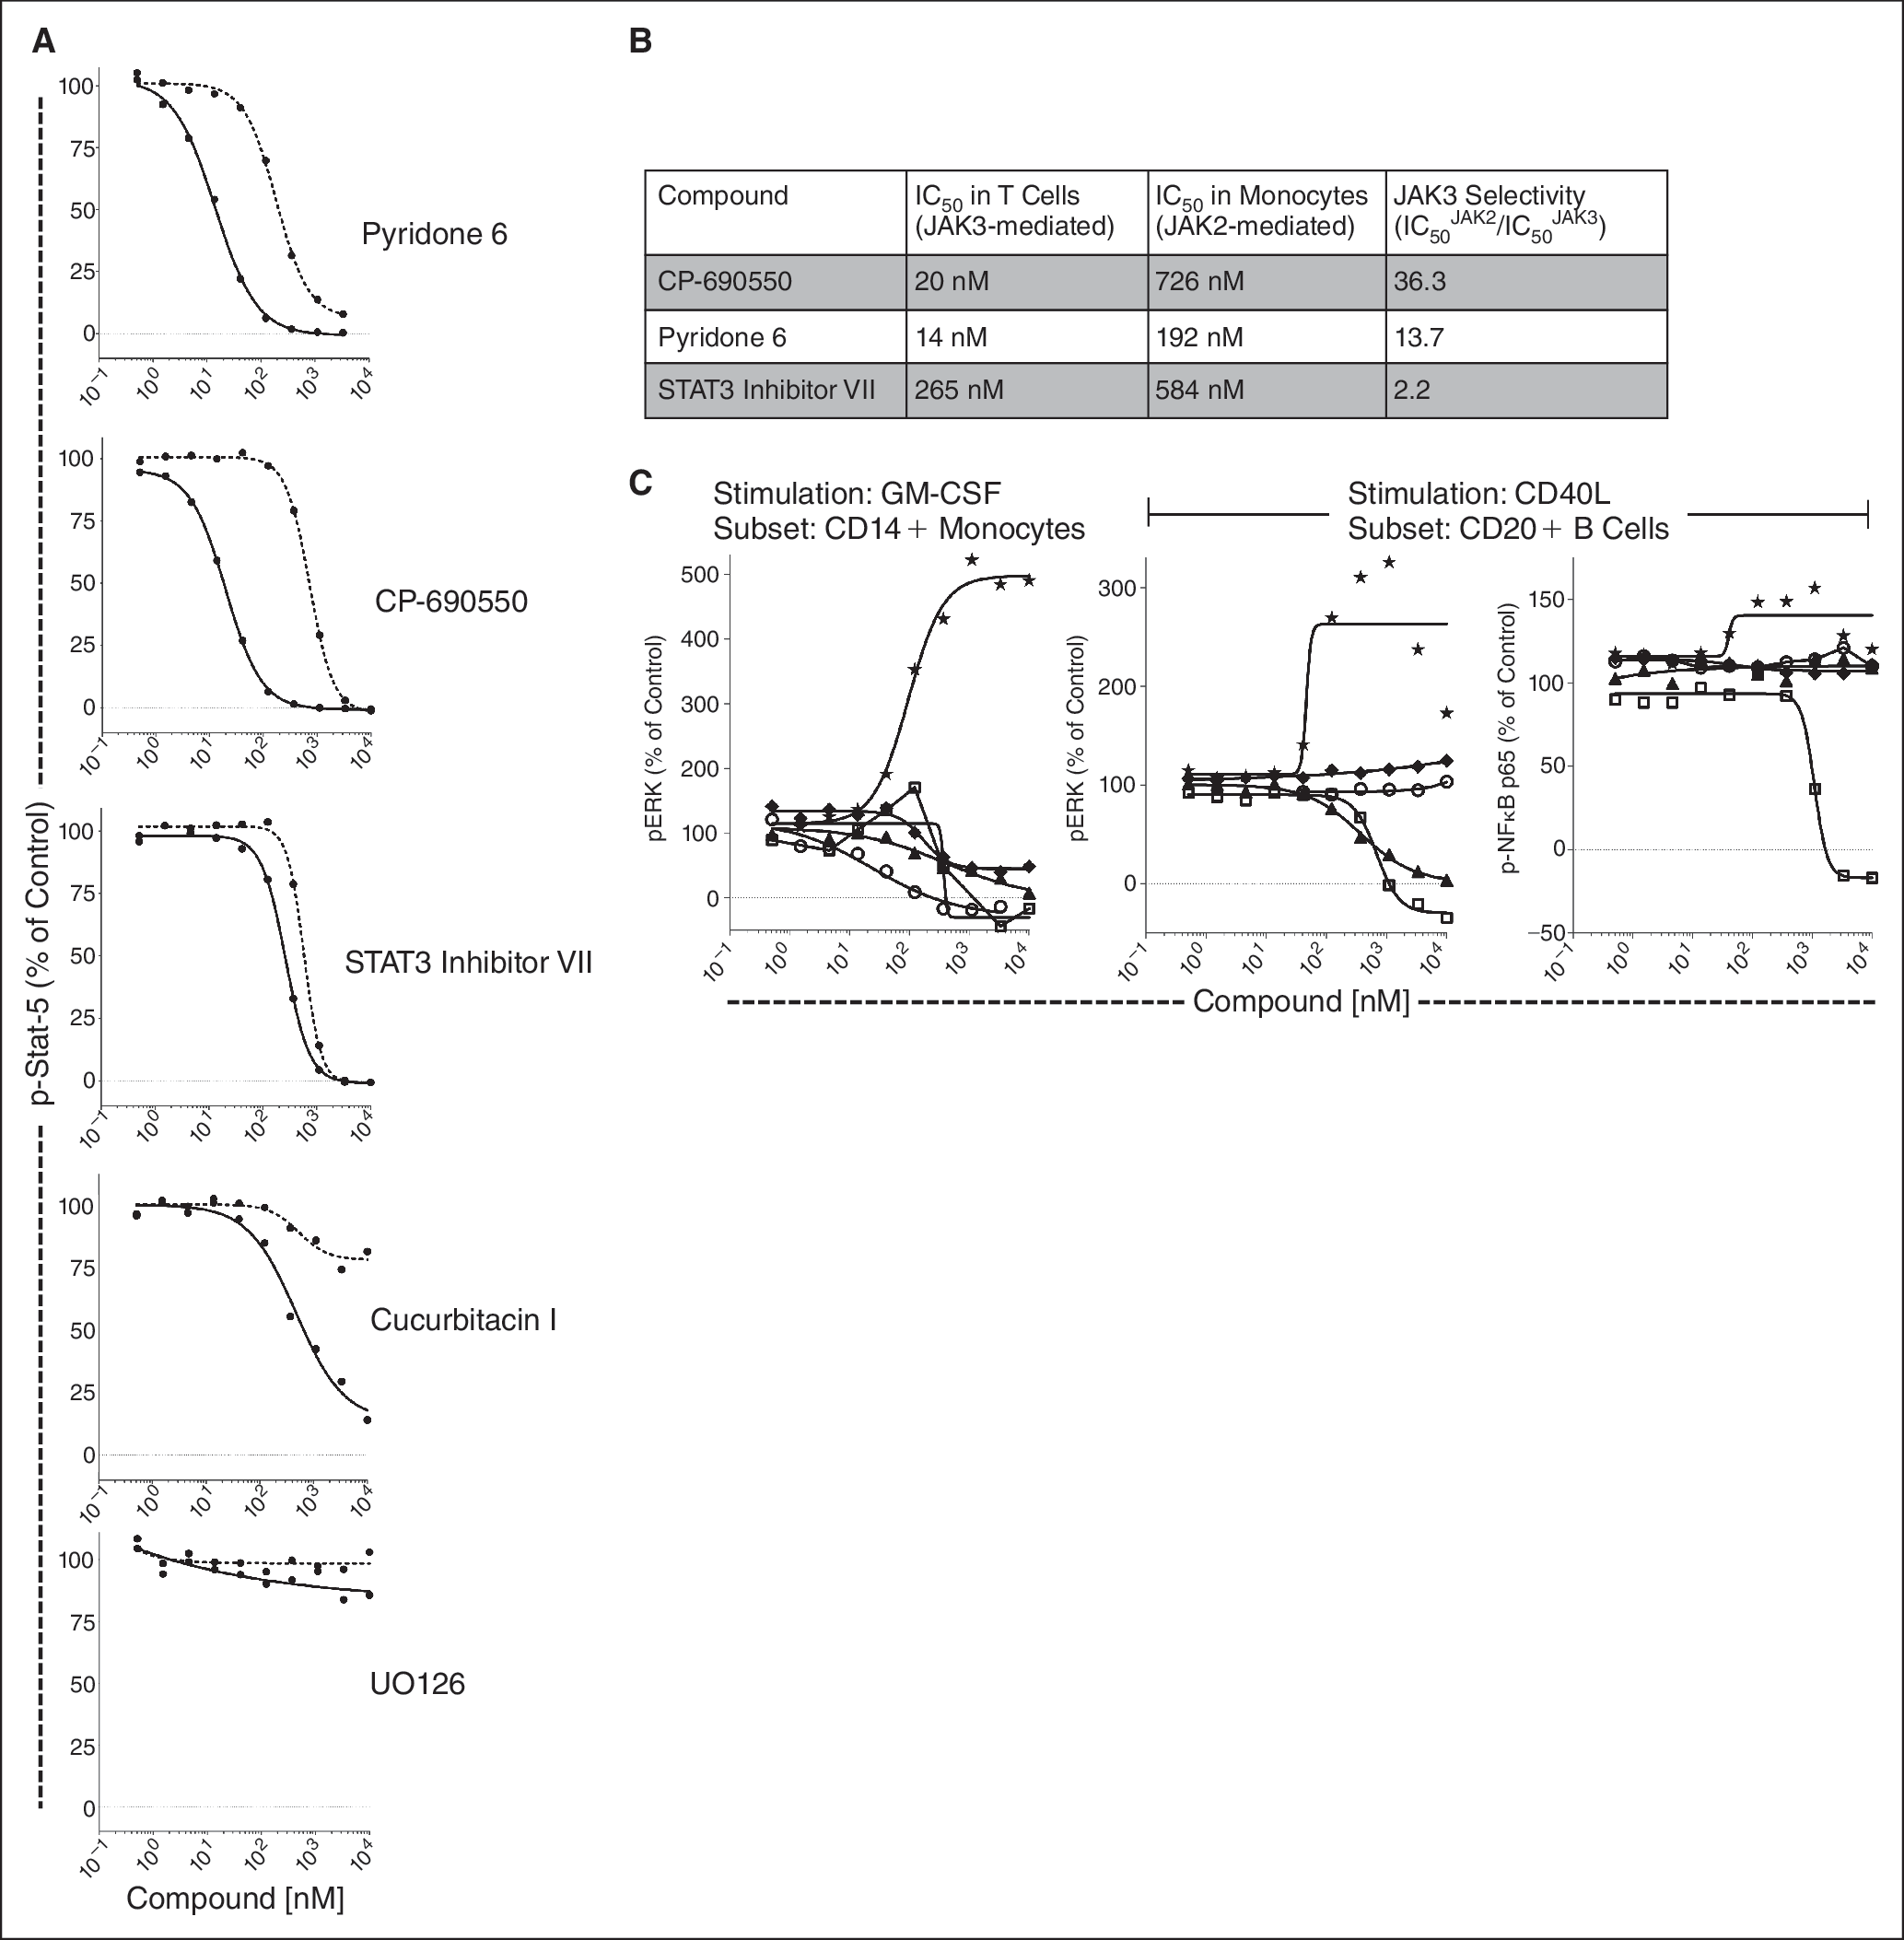
Simultaneous measurement of target selectivity and “off-target” activities in PBMC by SCNP using “triple stim” conditions (IL-2, GM-CSF, and CD40L). ( Cucurbitacin I-induced Erk and NFκB p65 phosphorylation.
This compound profiling assay also simultaneously revealed non-Jak-associated signaling effects. For example, “Stat3 Inhibitor VII” inhibited CD40L-stimulated p-Erk and p-NFκB p65 in B cells (Fig. 7C). Additionally, an unexpected increase in phosphorylation for some phosphoproteins was observed for Cucurbitacin I. This compound induced a dose-dependent increase in p-Erk in the monocyte subset in PBMC (Fig. 7C) and in whole blood (data not shown).
Comparison Between High-Content Signaling Profile Assays in PBMC and Whole Blood
The panel of kinase inhibitors was tested for potency and selectivity in whole blood, a setting more relevant for clinical applications. Multiple stimulators, multiple phosphoproteins, multiple inhibitors, and multiple cell populations were analyzed simultaneously in unmanipulated whole blood samples. Similar to the experiment in PBMC, the relative Jak3 vs. Jak2 selectivity of CP-690550 was measured in whole blood (Fig. 8A). Here, the medium-shaded region shows the estimated drug exposure necessary to provide biochemical coverage on Jak3, while avoiding potentially undesirable impact on Jak2. These results can use be applied to inform on in vivo dosing in a clinical setting.
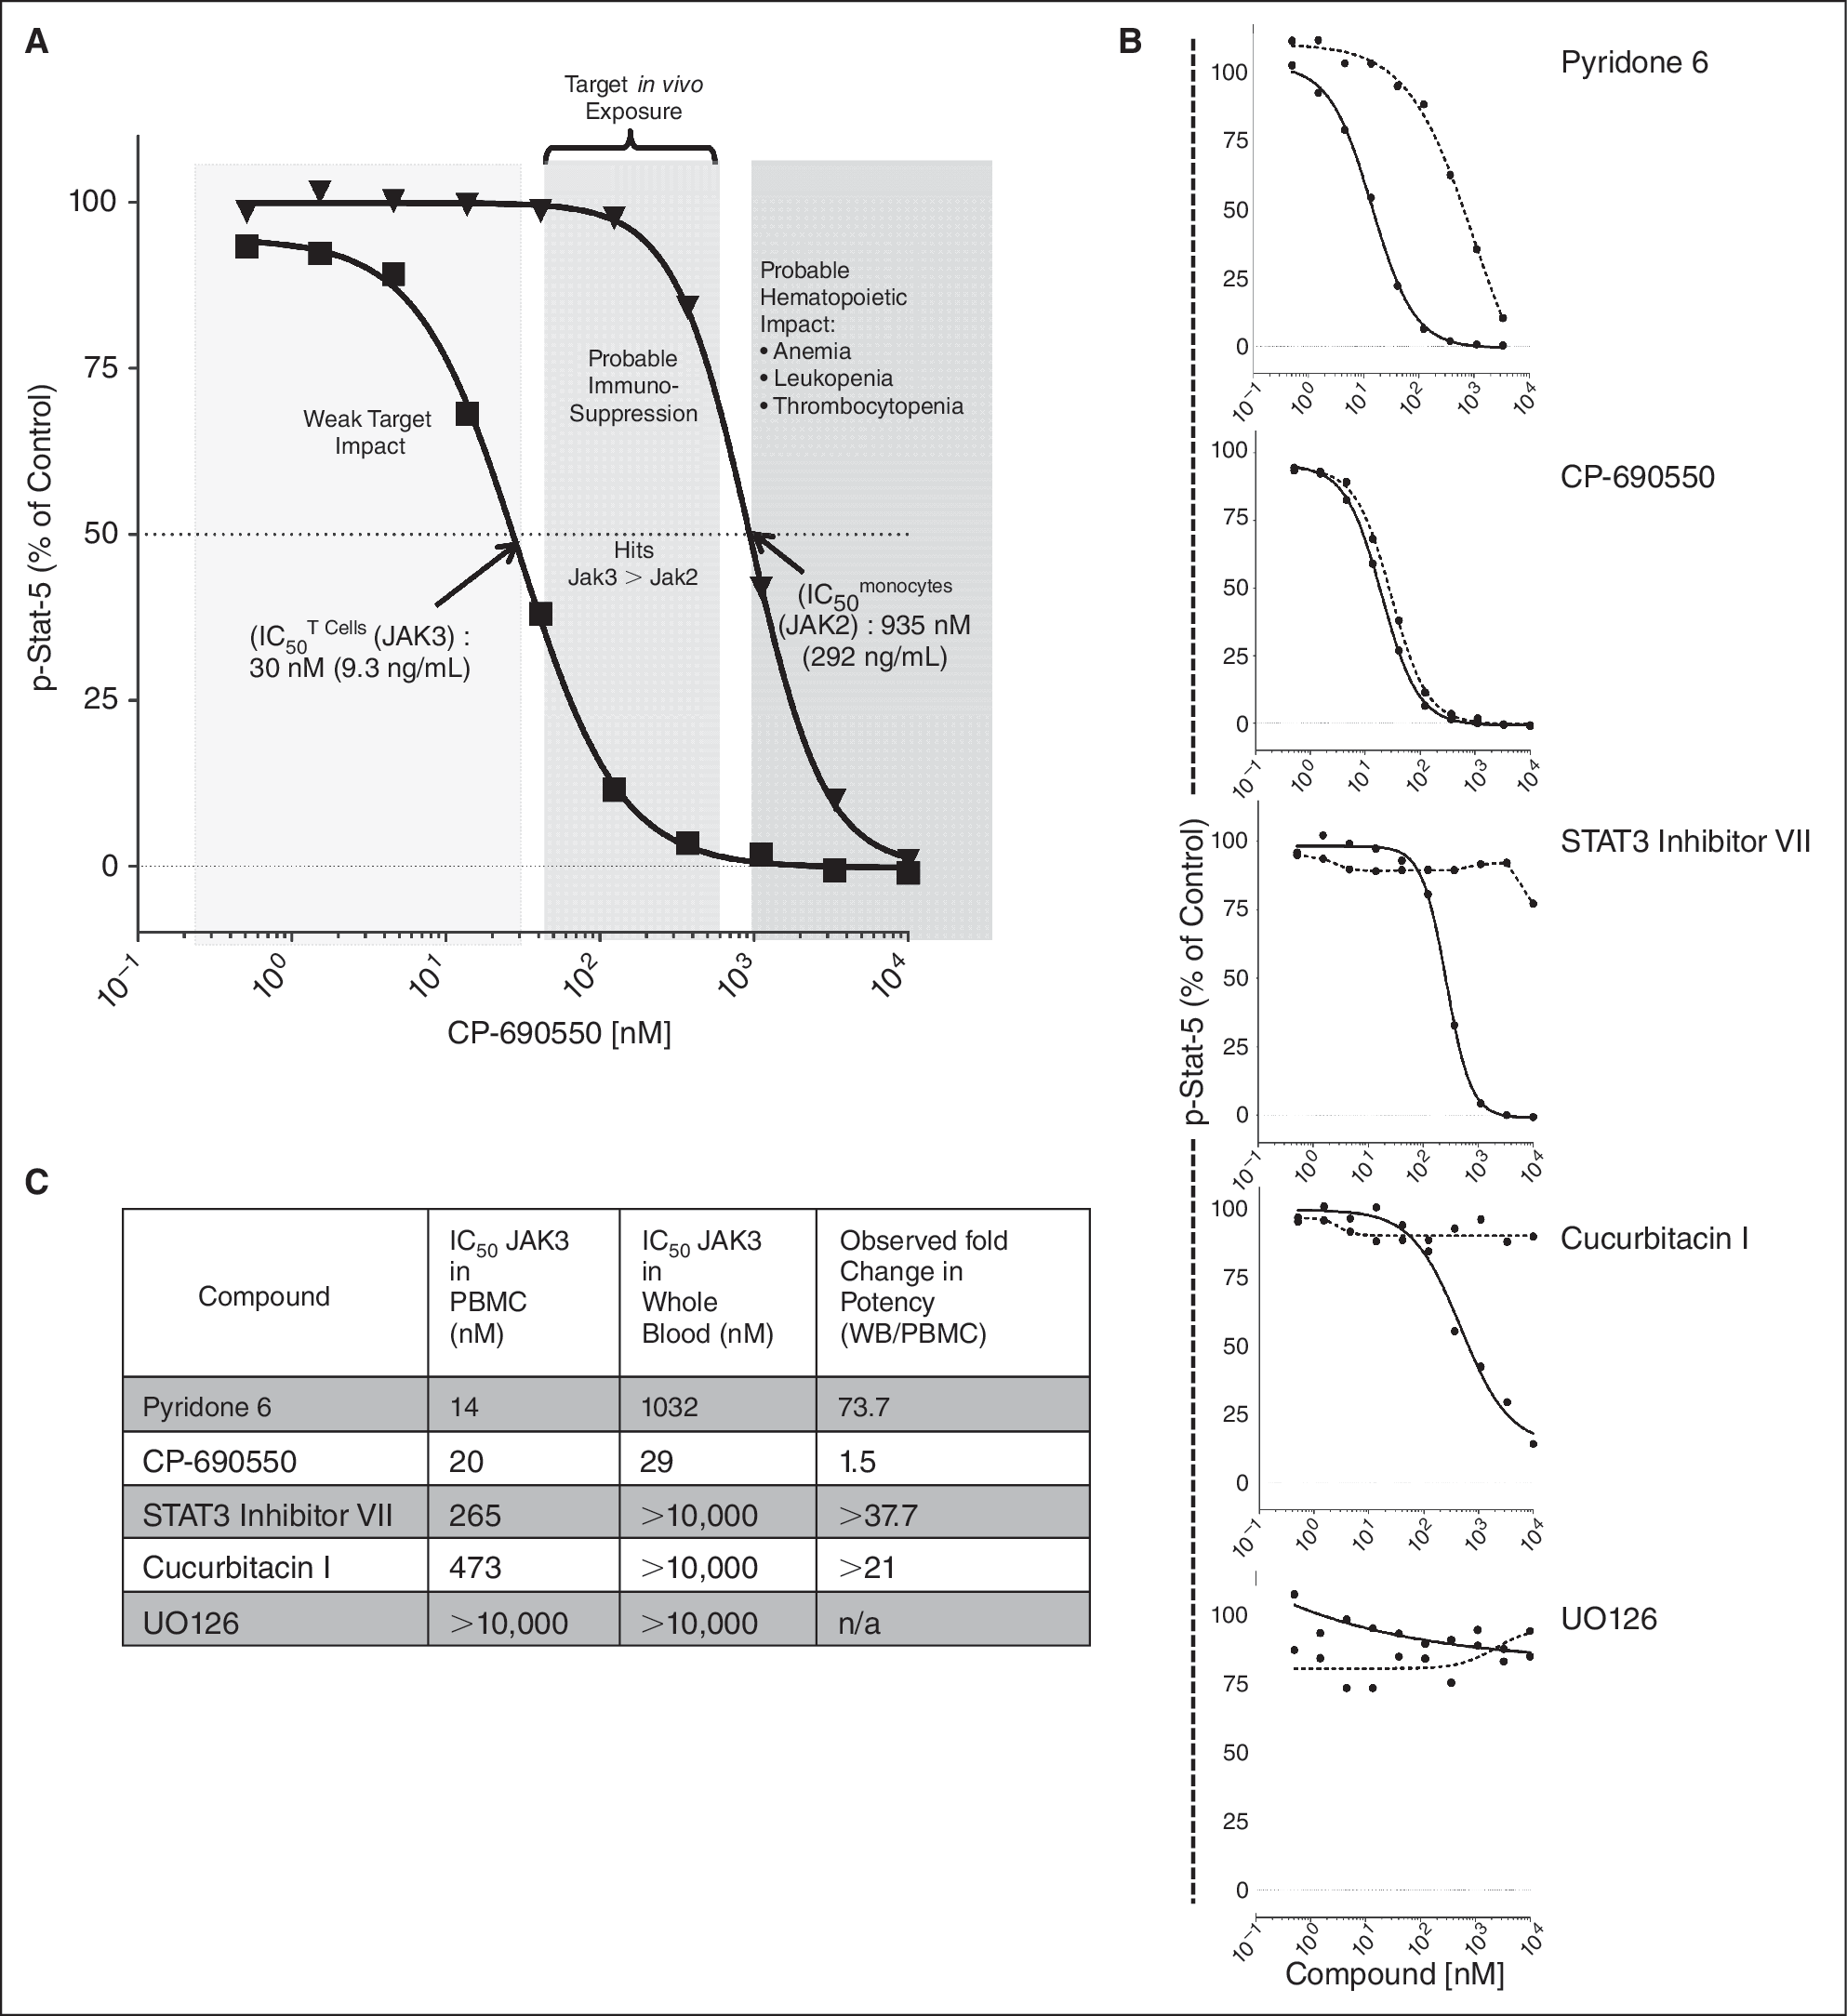
Calculating loss of potency in whole blood vs. peripheral PBMC. Simultaneous measurement of potency and target selectivity in unprocessed whole blood for clinical applications. Whole blood and freshly prepared PBMC (from same donor) were treated with small molecule kinase inhibitors for 1 h prior to stimulation with the “triple stim” cocktail (IL-2, GM-CSF, and CD40L). MFI values were normalized to percent of control, with the control being the stimulated condition without inhibitor (see Materials and Methods). (
Dramatic changes in IC50 (all increases) were observed for most compounds when tested in whole blood compared with those in PBMCs (Fig. 8B and 8C). For example, in gated T cells, Pyridone 6 IC50 on p-Stat5 increased 73.7-fold (14 nM in PBMC vs. 1,032 nM in whole blood), while CP-690550 showed only a slight (1.5-fold) reduction in potency (IC50 = 19.9 nM in PBMC vs. 29.8 nM in whole blood).
Measurement of Compound Effects in Rare Cells in Heterogeneous Cell Mixtures
We evaluated the potential of using SCNP to measure compound effects in rare cells amid a heterogeneous cell mixture. This aim is highly relevant to cancer drug development where cancer stem cells and minimal residual disease are the relatively rare cell populations responsible for tumor relapse and intrinsically resistant to conventional therapies. CD34+ CD11b− CD45med progenitor cells were identified in 2 cryopreserved samples of healthy bone marrow and PBMC (Fig. 9A; for gating scheme see Appendix Fig. 2). CD34+ progenitor cells from the PBMC samples were rare (<40 cells) and accounted for 0.11% of the total live cells acquired on the cytometer. Despite the low numbers, IL-27-induced p-Stat1 and p-Stat5 responses could be measured. Results from the bone marrow CD34+ cells (2.5% of total) were similar to the PBMC CD34+ cells in signaling magnitude and sensitivity to inhibition by the compound. The inhibitory activities of Pyridone 6 on the IL-27-evoked signaling responses were statistically significant as measured by calculating Wilcoxon P values across doses (Fig. 9B).
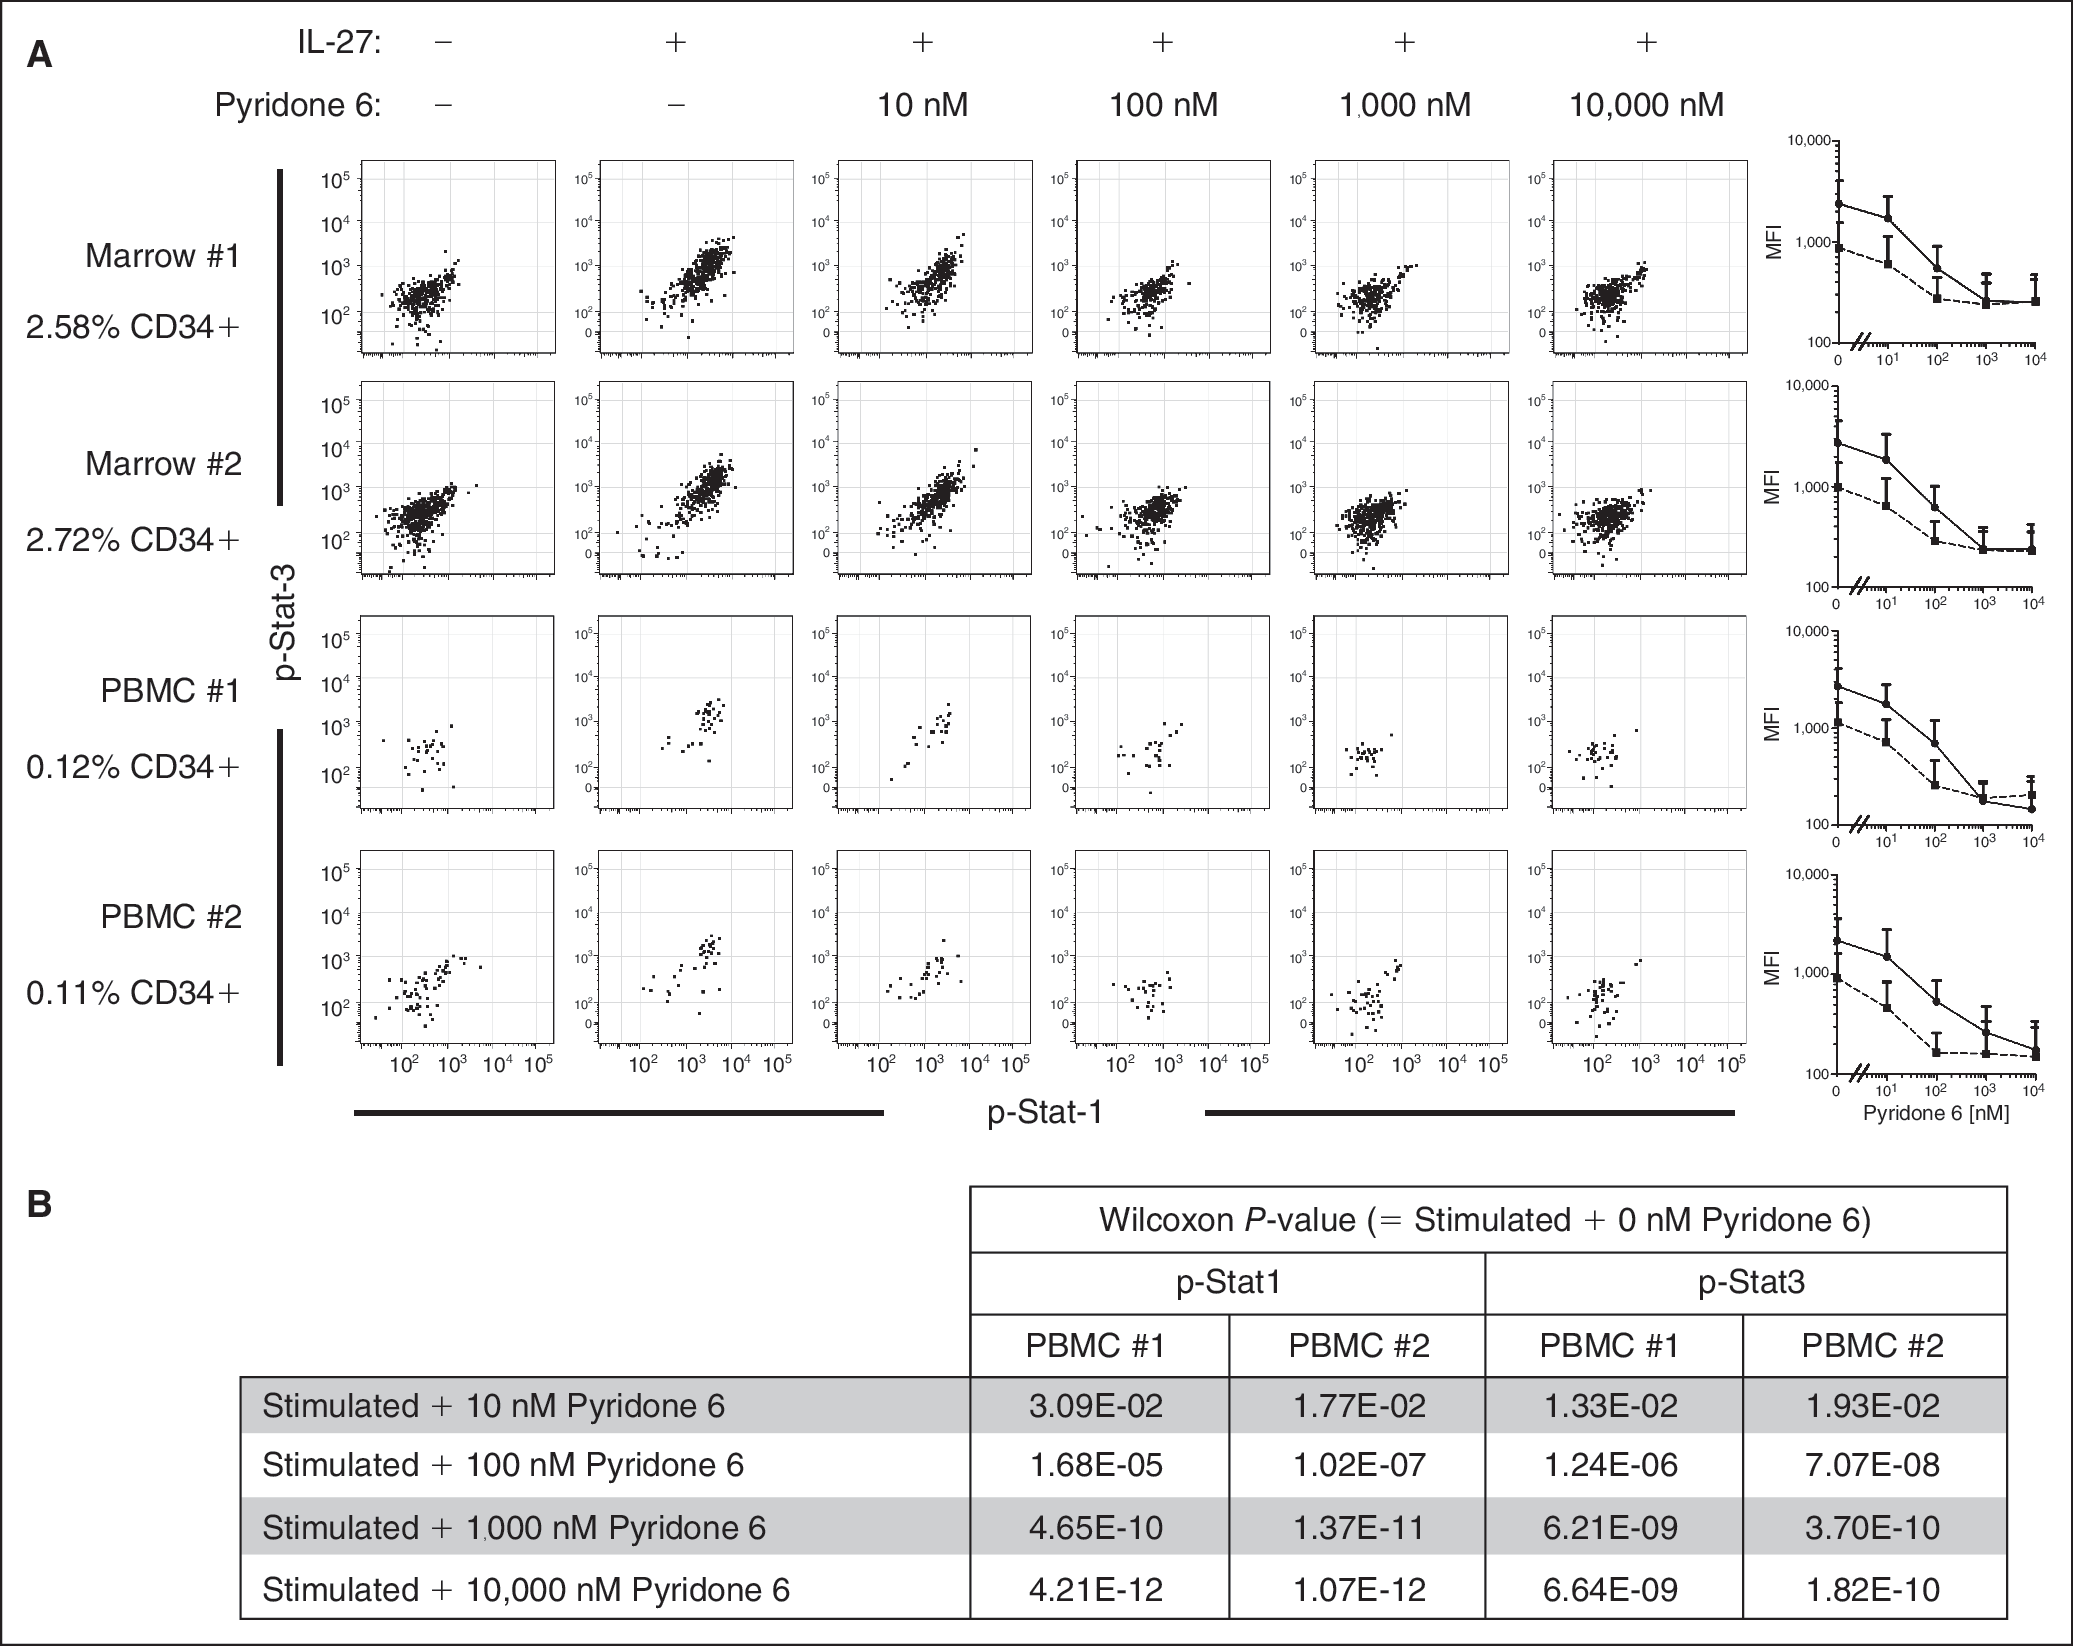
Measuring kinase inhibition in rare cell populations by SCNP in bone marrow and PBMC. Two samples each of cryopreserved bone marrow and PBMC (donors not matched) were treated for 1 h with increasing concentrations of Pyridone 6 followed by stimulation with IL-27 to induce Jak/Stat signaling. Samples were prepared following the SCNP method and cells stained using a panel of antibodies to identify hematopoietic progenitors. Cells with the phenotype CD34+ CD11b− CD33− were gated and identified as progenitors (supplementary data in Fig. 4 for gating scheme). (
Quantification of Whole Blood SCNP Assay Robustness
In order to quantify the robustness of various whole blood SCNP assay readouts, the fold change and Z' factor measurements were calculated for multiple stimuli, cell populations, and phosphoprotein combinations. Z' factor, used in qualifying high-throughput screening assays, combines the assay's dynamic range and standard deviations in the stimulated and unstimulated condition. Z' factor data suggest that the whole blood SCNP assays presented here are robust (Z' factor > 0.5, Appendix Table 5). In some cases, the Z' factor was high even when the dynamic range was relatively small.
Discussion
The SCNP technology provides a comprehensive view of signaling networks at the single cell level in relevant tissues without the need for cell separation, making it a powerful tool for drug development. The potential application of SCNP to the drug discovery process has been previously reported in the academic setting. 15,21 –30 The current study demonstrates the use of this technology platform in an industrial setting by the generation of robust and reproducible high-content assays.
Specifically, the results of a novel SCNP schema that provides multidimensional data on modulating activities of signaling pathway inhibitors in a single assay are described here using a panel of commercially available kinase inhibitors.
The multidimensional nature of SCNP analysis allows for a comprehensive evaluation of inhibitor potency and selectivity. IC50 profiles were generated for each of the inhibitors in the panel. The simultaneous analysis of multiple phosphoproteins at the single cell level allows one to quantitatively measure the varying magnitudes of signaling in multiple cell populations in the same sample, and thus, develop a more comprehensive IC50 profile for a particular inhibitor. This multidimensional analysis enabled the rank ordering of compounds based on their potency and selectivity. Using this analysis, CP-690550, currently in clinical trials for a variety of autoimmune diseases, was shown to be a highly potent and selective (within a defined concentration range) compound for Jak3. Comparing the IC50s from IL-2-stimulated T cells (JAK3-mediated) to GM-CSF-stimulated monocytes (JAK2-mediated) allowed us to determine selectivity of CP-690550, which closely matches the reported selectivity of 30-fold. 31 These results demonstrate how the SCNP platform can be used efficiently for drug potency and selectivity studies.
Moreover, the SCNP assay can be used to measure potency and selectivity in clinically relevant tissues, such as whole blood. Our results demonstrate a dramatic reduction in potency, as evidenced by increased IC50 values, for most compounds when tested in whole blood. Assays on CP-690550, however, showed only a minimal reduction in potency. Incorporating whole blood SCNP assays in early phases of drug development can help select ideal compounds that also demonstrate superior in vivo activity.
These results highlight a number of key technical advantages associated with the SCNP platform as compared to alternative technologies currently used in early phases of potency and selectivity characterization of compounds. Understanding compound effects in whole blood is especially important for establishing pharmacokinetic/pharmacodynamic (PK/PD) data and for interpreting data from clinical studies. In a clinical trial setting, measuring the PD of the therapeutic is important to assure that the intended target has been impacted by the drug. Since whole blood is likely the most accessible tissue, SCNP assays have the unique advantage of not requiring sample fractionation before testing. This is important for 2 reasons. First, fractionation and sample manipulation can itself lead to modulated signaling. 32 Second, the compound concentration in blood would likely be altered upon cell fractionation leading to inaccurate PK/PD assessment.
Whole blood is a challenging tissue for other signal transduction assay platforms. Western blotting, phospho-ELISA, or any other technology that requires making cell lysates is unsuitable for whole blood assays, primarily due to the predominance of plasma proteins and presence of red blood cells. Further, cellular heterogeneity in whole blood results in phosphoproteins from minority cell subsets being “averaged” with all the proteins in the lysate “soup.” In SCNP, this problem is solved by incorporating antibodies useful for distinguishing the individual cell types within the whole blood milieu.
Moreover, the SCNP technology does not average data across multiple cell populations. Rather, it allows for analysis at a single cell level within each simultaneously identified cell population. This capability enables the analysis of rare, clinically relevant cell subsets, such as cancer stem cells and other cells associated with minimal residual disease.
Although the whole blood SCNP assay represents a leap forward in revealing modulating activity in a relevant physiological context, the throughput limitations of the assay can hamper its implementation in early phase drug development. However, there have been a number of improvements on this front. Advances in robotic sample handling, plate-based acquisition, and analysis have contributed to its application in drug development. 33 New method for labeling samples with distinct fluorescent intensities, termed fluorescent barcoding, enables the multiplexing of samples for compound screening. 34 Also, orthogonal posttreatment pooling protocols have shown promise for compound screening using flow cytometry. 35,36 The result of these improvements is a reduction in antibody costs as well as the time required for data acquisition. For the data in this report, we routinely collected upward of 30,000 cells per well, which took ∼20 s/well to acquire. Our data showing that good IC50 curves can be generated from far fewer cells (80 at the lower limit, Fig. 2C) suggest that additional increased throughput can be obtained by acquiring fewer cells per well.
Potential drawbacks to this technique include the lack of a “loading control” in order to account for variation in the total amount of target protein. 21 However, this issue is less important due to the normalization resulting from acquiring data from single cell events. Comparing samples from longitudinal experiments with extended treatment times (hours to days) may require that the total protein of interest be measured to account for protein expression changes. Other drawbacks include a relative lack of qualified antibody reagents; however, this has improved recently. Antibodies to phosphoproteins must have high avidity and show very low cross-reactivity to other epitopes. Also, cell surface antibodies need to be qualified in the fixative and cell permeabilization protocol due to possible epitope modulation. In addition, it should be emphasized that assay performance is dependent on several factors, which include the following: preanalytical parameters; concentration and kinetics of the particular stimulation; the particular phosphoprotein antibody clone and concentration used in the staining; the fluorochrome conjugates chosen; and the flow cytometer configuration.
Despite these limitations, SCNP's ability to measure multiple compound attributes in whole blood is well suited for structure–activity relationship (SAR) research and lead-optimization studies aimed at achieving desired potency while monitoring potential off-target activities. The changes in activity due to compound modifications can be tested quickly in SCNP with results possible in 1 day, improving the efficiency of early phase drug discovery. Therefore, SCNP can be used to quantify the potency and selectivity of multiple inhibitors in a simultaneous, multidimensional, and clinically relevant fashion.
Footnotes
Acknowledgment
We are especially grateful to Michael Gulrajani for excellent flow cytometry support and to Katie Kong for critical reading/design of the manuscript.
Author Disclosure Statement
All authors are employees of Nodality, Inc. (South San Francisco, CA).