
Abstract
This article aims to construct theoretical model and program of a new adaptive layering algorithm (ADR) by setting optimal volumetric deviation thresholding and matching printing speed. It can optimize both printing efficiency and dimensional accuracy simultaneously, which the traditional ADRs based on area deviation and volumetric deviation metrics have not taken into account. First, the optimal volumetric deviation ratio (OVDR) model was studied considering the overall volumetric deviation and printing time of the model. Second, a process for obtaining the OVDR of the model and an ADR process with the OVDR as the threshold was constructed. For bunny model, the overall volumetric deviation is reduced by 15.46% when the printing time is the same as the area deviation ratio-based ADR. When the overall volumetric deviation is the same as the volumetric error (VE)-based ADR, the printing time is reduced by 13.96%. Through data and thermal coupling analysis, the effects of layer number, volumetric deviation ratio, printing speed, and temperature on extrusion deformation were investigated finally. The article shows this new ADR and the optimal speed selection for continuous printing layers, where the volumetric deviation ratio is below the threshold value of volumetric deviation ratio, are effect in improving both printing efficiency and molding accuracy. For bunny model, the printing time has increased by about 4% and the surface roughness has decreased by 47.5% at the optimal printing speed. These conclusive results support enunciating recommendations for use in the industrial environment. This article fulfills the demand to improve both printing efficiency and molding accuracy by investigating a novel ADR and optimal printing speeds. It demonstrates better adaptability for printing complex models with significant differences in interlayer area.
Introduction
3D printing is a technology based on digital model files (STL format), which form physical objects by layer.1,2 With the development of technology, the molding quality and efficiency for finial products have received more attention. Studies have shown that increasing layer thickness can improve efficiency. The remarkable step error causes the lack of model features and the decline of the printing accuracy.3,4 In order to balance the printing efficiency and printing accuracy, the layer thickness needs to be optimized reasonably.
The adaptive layering algorithm (ADR) can change the thickness according to the characteristics of the model itself adaptively, so it can improve the printing accuracy while optimizing the printing time. Lv 5 proposed an algorithm based on the principle of minimum errors to achieve adaptive layers. It can have a better layering effect in the model feature area, but it will lead to an increase in printing time. Zhang 6 separated the surface of the model, the curved surface layer of the model was achieved in the curved layered area through the surface bias, but it was only applicable to simple models. Siraskar 7 proposed an algorithm based on the data structure of the octopus-based parameters of parts. Wang 8 used the angle of the triangular dough and the angle of the forming direction as the basis of the adaptive layering, the characteristics of the model are effectively retained, but it will cause the molding time to become longer. Han et al. 9 proposed an improved adaptive layering method. At the height of the identified characteristics, the top height method was used for adaptive layers, but when there were too many characteristics of models, the printing time would be very long. Taufik 10 proposed that the selection layer thickness is adaptive in the range of specified volumetric error (VE) value. This method can control the overall accuracy effectively, but it is not ideal for feature parts of the model. Zhong et al., 11 Moodleah et al., 12 and Xu et al. 13 proposed sliced point cloud data through adaptive method. This method has better mold accuracy and print speed, but the algorithm is more complicated. Zhao et al. 14 and Hu et al. 15 adopted an adaptive layered algorithm based on the area deviation ratio, which can improve the printing efficiency under the premise of ensuring surface quality, but there are some questions to recognize models. Hayasi et al., 16 Demir et al., 17 and Zhao et al. 18 presented a layering method for improving printing efficiency by a decomposition and recombination approach. Wang et al. 8 proposed a method to optimize the layer thicknesses based on a new saliency metric, which can save printing time and preserve the visual quality of the printing results. Toprak et al. 19 proposed a constraint optimization program to improve the reference value of simulation. Alaa Almansori 20 proposed a method to improve the parts’ surface performance by using roughness as the main indicator. Marković et al. 21 and Kozior et al. 22 proposed that printing angle, layer thickness, and temperature have some influences on the mechanical properties of the parts by optimizing printing process parameters. Luberto et al. 23 analyzed the thermal cycling pattern during fused deposition modeling (FDM) printing process.
In this article, a new ADR based on optimal volumetric deviation ratio (OVDR) is carried out to save printing time and improve printing accuracy, especially for complex models with significant differences in inter layer area. It has three parts, including the methods for theoretical model construction of the OVDR, process of the ADRADR based on volumetric deviation ratio and setting optimum printing speed based on this new ADR.
Methodology
Theoretical model construction of the optimal volumetric deviation ratio
Source of volumetric deviation
When using FDM to print models, there are two main sources of volumetric deviation, one is the loss of model features caused by slicing, the other is the step effect caused by printing.24-26
It shows the layering of bunny model at the minimum printing thickness in Figure 1. By local magnification of the selected part of the frame, it can be found that when the layer thickness reaches the minimum thickness of the printer, some triangular surfaces (the shaded part in Fig. 1) still cannot be tangent to the minimum stratified section, that is, the model information contained in these surfaces cannot be identified. Therefore, the actual contour of the model in the adjacent two layers of printed contour area cannot be presented.
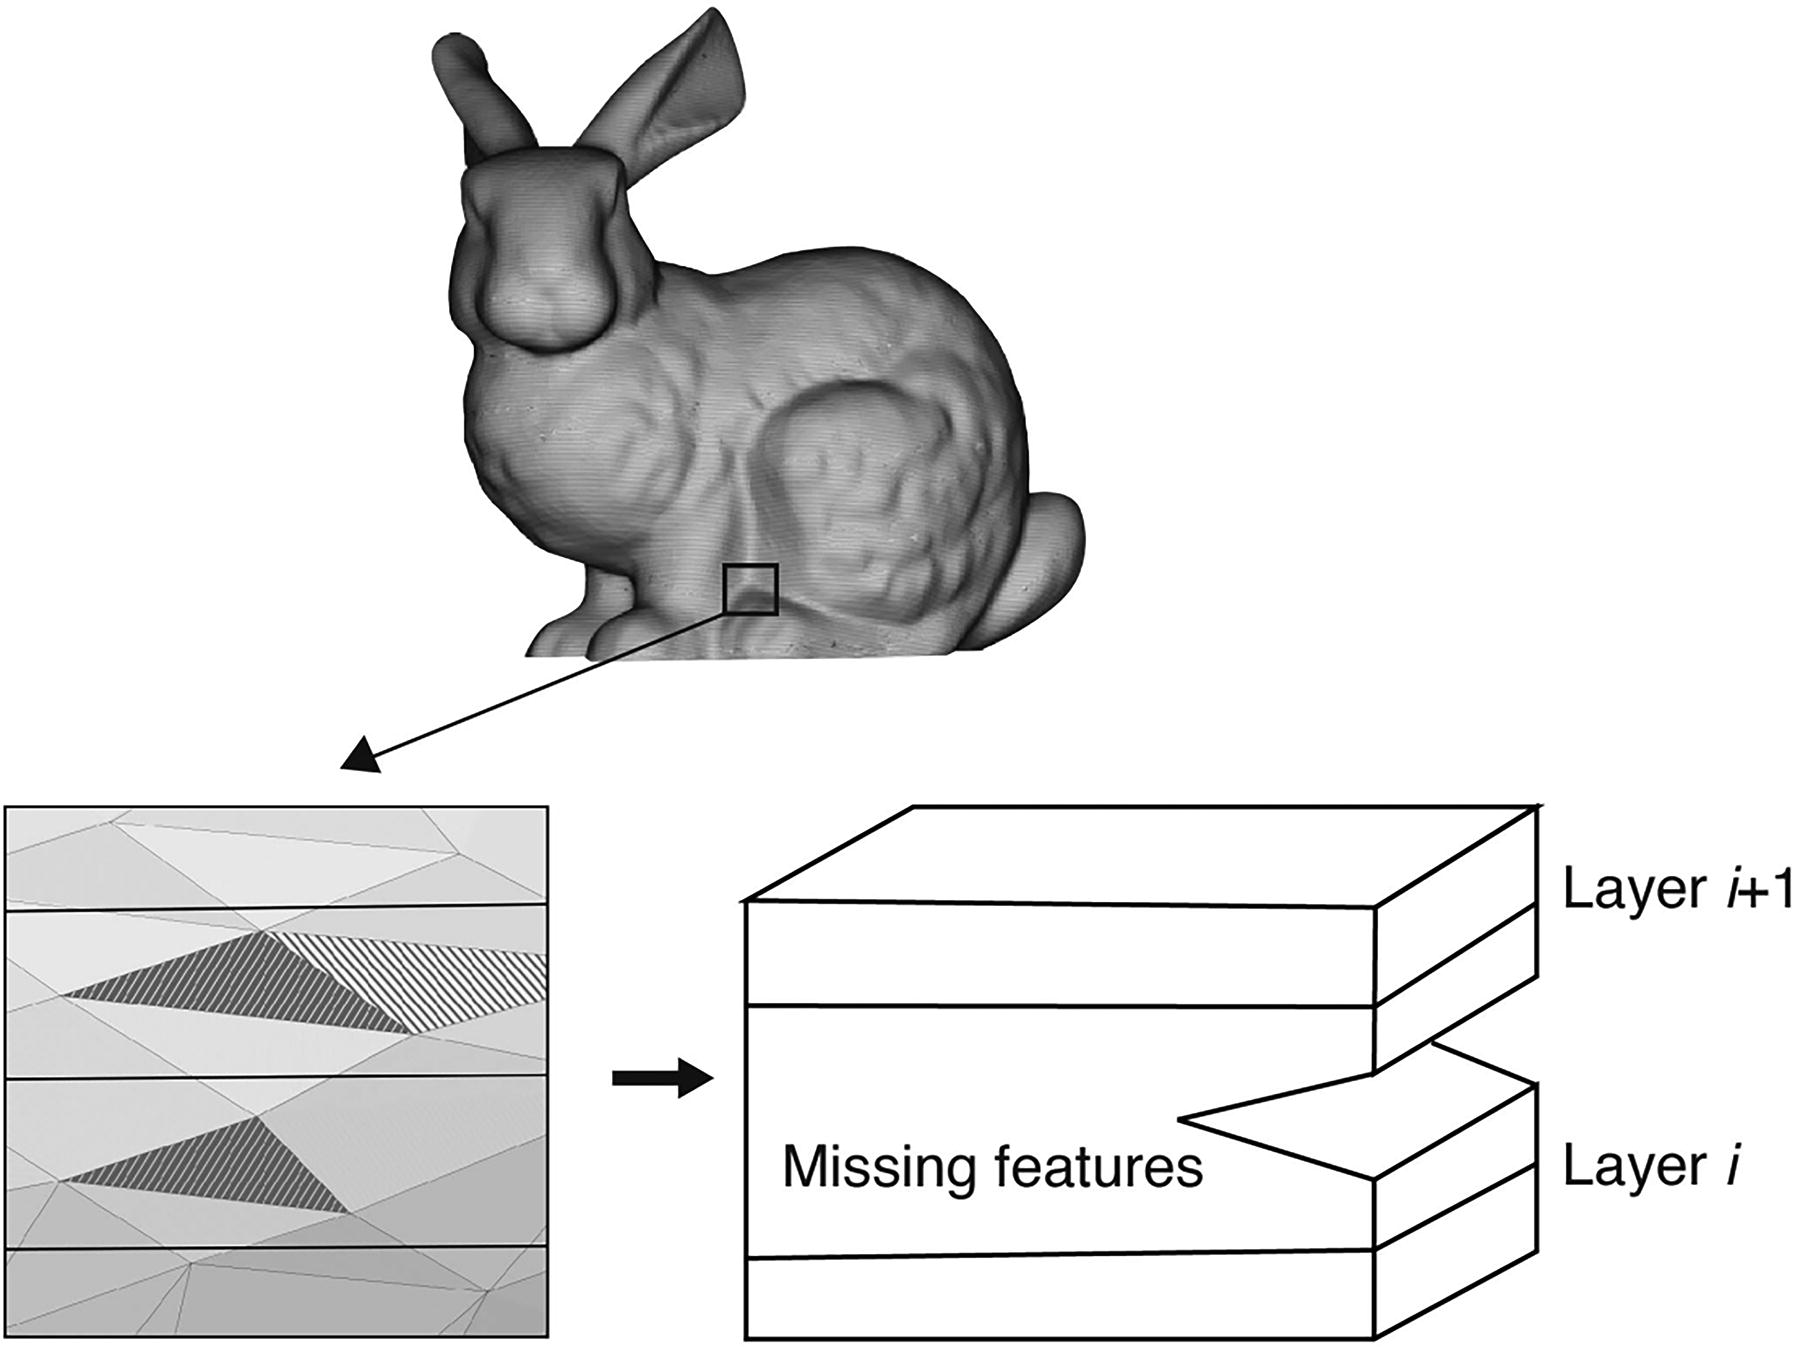
Model feature loss of bunny model.
If the fine model feature exists between two adjacent layers of printed contour, and the contours are generated by the minimum printing thickness, then this part of the model feature is missing. Due to slicing operation, part of the geometric information of the model will be lost, and the volumetric deviation caused by the lost geometric information cannot be identified and calculated.
The forming principle of FDM-3D printing is to slice the model and accumulate the model layer by layer to form the structure composed of columnar structure. Therefore, FDM-3D printing cannot reproduce all surface features of the original model with a certain slope on the outer surface well. It is called the step error. For complex models, because the slope of the surface varies greatly, the step error is inevitable. Therefore, the step error of complex models is the main reason for the volumetric deviation for printing parts.
Calculation method for volumetric deviation ratio
For complex models such as bunny model, since the models are composed of a large number of adjacent triangles, the contours formed during slicing are complex polygons. The polygons are arranged parallel at slice thickness intervals. Prism is a polyhedron in which all vertices lie in two parallel planes, as shown in Figure 2.

Schematic diagram of the prism.
Since the slicing behavior will cause the loss of the actual contour of the model, the shape formed by the contour of the adjacent two layers of slices (layer
i
and layer
i+
1) can be regarded as a prism. The two layers of slice contours are the bottom surface of the prism, and the contour spacing namely slice thickness is the height of the prism. The formula for calculating the volumetric of the prism is as equation (1).
Where Vi is the prism volumetric between layer i and layer i+ 1, h is the layer thickness, Si and Si+1 represent the area of the slice contour in layer i and layer i+ 1, Sh/2 is the area of the middle section of layer i and layer i+ 1.
The area of Sh/2 is simplified by equation (2):
Substitute equation (2) into equation (1), then Vi is simplified as equation (3).
Therefore, the volumetric calculation formula of the complex model is as equation (4).
Before volumetric calculation, it is necessary to obtain the area of the slice contour. If the slice contour contains holes, the positive or negative area of the contour is judged by the parity of the contour. Contour parity is specified as follows: the odd-numbered polygon intersecting a given ray has a positive area and the even-numbered polygon has a negative area. Then the area S
i
of the slice contour of layer
i
can be calculated by equation (5).
Sm is the area of the contours of the polygon and can be calculated by equation (6).
Xn and Yn are the horizontal and vertical coordinates of a point on the polygon.
The actual volumetric of the model can be obtained by equations (4) and the section area of each layer can be calculated by equations(5). The layer thickness of bunny model was calculated by taking 0.1 mm and 0.6 mm. The results are shown in Table 1. It can be seen that the use of prism volumetric calculation has a certain accuracy.
Bunny Model Volumetric Calculation Results
Volumetric deviation refers to the difference between the original volumetric of the model and the printed volumetric. The volumetric deviation formed by the contour of two adjacent layers of slices is given by equation (7).
Vdev,i is the volumetric deviation generated by layer i , namely the step error. Sint,i is the polygon area after Boolean intersection operation of layer i and layer i+ 1 section polygon contours.
Volumetric deviation refers to the difference between the original volumetric of the model and the printed volumetric, and the main source of this difference is the step effect. 27 If the value of volumetric deviation is obtained by finding the numerical difference, it may lead to erroneous results. Therefore, the volumetric deviation is found by Boolean intersection operation of graphs. 28 Boolean intersection operation rules are shown in Figure 3. There are three cases such as including, intersect, and nonintersect.

Boolean intersection operation rules of bunny model.
If adjacent slices are displayed along the z axis, it can be found that the volumetric deviation of the contour is the step effect. The volumetric of this part is calculated by equation (1), the area of the upper surface is 0, and the area of Sh/2 is half of the area of the lower surface. The volumetric deviation can be achieved by equation (8).
Sdev,i is the area deviation between the upper and lower surfaces of layer
i
, and it can be given by equation (9).
Because the results of equation (7) and equation (8) are consistent, equation (8) can be used to calculate the volumetric deviation caused by the step effect.
The volumetric deviation ratio of layer
i
(εi) is defined as equation (10).
Vdev,i is obtained from equation (8), Vi is obtained from equation (3), and the two calculation formulas are substituted into equation (10) and simplified to obtain equation (11).
It can be seen that the lower the volumetric deviation ratio, the higher the precision after slicing the layer. Therefore, εi can be used as a measure in the adaptive slice.
Calculation method of the optimal volumetric deviation ratio
In theory, as long as the layer thickness is small enough, FDM technology should be able to produce the same print as the original model. However, due to the limitation of the nozzle diameter of the printer, stacking printing can only be carried out with limited range thickness. Therefore, for a definite complex model, the volumetric deviation ratio always fluctuates within a certain region, and the volumetric deviation ratio is related to the range of printing thickness supported by the printer. If the size is artificially too small or too large during adaptive layering, the thickness will not change. At the same time, if the given value of ε is unreasonable, it may cause the irrationality of adaptive layering adjustment of the model. So, it is important to get a reasonable value for ε.
The main parameters to be considered in FDM printing include volumetric deviation and printing time. In general, both volumetric deviation and printing time are affected by layer thickness. In the range of printing thickness that the printer can support, the smaller the layer thickness is, the more similar the printing model is to the real model, and the smaller the volumetric deviation is, and the longer the printing time is required.
In this section, the calculation methods of the overall volumetric deviation and printing time of the model based on the ADR. Furthermore, the OVDR εbest can be obtained.
Based on equation (8), the overall volumetric deviation Vdev of the model in case of adaptive layering is calculated by equation (12).
Where the layering height hi of layer i is obtained by subtracting the slice height of the upper and lower layers by calling the Adaptation list in the ADR. It is important to reduce the overall volumetric deviation to maintain the shape accuracy of the printing model. Therefore, the overall volumetric deviation Vdev can be used as an important index when selecting suitable values for adaptive layering.
Printing time is a key index in FDM technology, which directly affects the printing cost. The selection value of ε in adaptive layering has an important impact on the printing time, because different values will lead to changes in the total layers number. The greater the number of layers, the longer the printing time. Because FDM technology involves many process parameters, it is difficult to estimate the exact printing time. The printing time estimate in this section takes into account only partial factors and does not take into account support conditions. This is because the volumetric of the support part of the model is only related to the placement position and the shape of the model itself, and different adaptive layering will not have much influence on the volumetric printing of the support part.
Typically, the overall time required to printing Tprt can be expressed as the sum of the idle time and manufacturing time for each layer in equation (13).
Twait is the interval between two adjacent layers of printing, n is the total number of layers to be printed, and Tlayer, i is the time required to print layer
i
. From the actual printing process, the waiting time is limited relative to the printing time, which can be ignored when printing time estimation. Therefore, the core index of printing time estimation is the actual printing time required by the model. So, the printing time of single layer contour is mainly affected by external contour and internal filling for FDM technology such as equation (14).
Touter,i is the printing time of the external outline, Tinner,i is the time required for internal filling, and Tother,i is the remaining time required for printing.
In the actual printing process, due to the influence of material extrusion width, the external contour needs to be offset inward for a certain distance during printing. At the same time, in order to ensure the printing model has a certain precision and strength, the internal filling and the external contour should be offset, and the offset distance should be the width of the material extrusion. The time of the external contour is calculated by equation (15).
The time of internal filling is affected by the filling ratio and the filling method. The higher the filling ratio is, the larger the area needs to be filled. Due to various filling methods, only the most widely used Zig-Zag filling is selected for calculation in this article, so the time of internal filling can be calculated by equation (16).
Rfill is the filling ratio, Slayer,i is the area of layer i , E is the offset distance, usually consistent with the extrusion material width, and Vinner is the printing speed of the internal filling contour.
Based on the above equation, the printing time under adaptive layering can be estimated to a certain extent. However, due to the complicated calculation process, some parameters in the equation are simplified in this article when searching for the OVDR. Specific parameter settings are as follows: in the contour printing process, Tother,i occupies less time, and different printers and different printing parameter settings will cause Tother,i value to fluctuate greatly, so it is difficult to calculate accurately, so it is ignored. Rfill is set as 1, which means physical printing of the model. Set the same value of Vouter and Vinner, and the value is V. So, equation (16) can be simplified as follows:
That is:
Therefore, the total printing time estimate Tprt can be given by equation (19).
Since extrusion speed V and extrusion width E are printer parameters, the estimation of the total printing time can be simplified to calculate the sum of the contour areas of the model.
When printing a model, the operator must expect the model volumetric deviation to be minimal and the printing time to be as short as possible. In general, Vdev and Tprt are negatively correlated, which means that the two indexes cannot be optimized at the same time. The Vdev and Tprt of the model at different values of ε is calculated. Take Vdev as the horizontal coordinate and Tprt as the vertical coordinate, and the representation is carried out on the coordinate axis. Since the points are discrete, the power function form is selected to carry out curve fitting for these points. The form of fitting function is as equation (20). The fitting curve of the model is obtained by determining the constant in the power function by the least square method. Thus, an appropriate parameter point is found on the fitting curve as the optimal value of ε, so that Vdev and Tprt can comprehensively evaluate the optimal value.
When the layer thickness is given, the minimum value of Vdev is taken as the minimum layer thickness and denoted as x0. The minimum value of Tprt is taken at the maximum layer thickness and denoted at y0. Therefore, the coordinates of the model’s print parameter utopia point Pu are (x0, y
0
). A point (x, y) is taken on the fitting curve, and the optimal value of ε is taken at the shortest Euclidean distance from the point to Pu. The Euclidean distance d expression is as equation (21).
Lagrange multiplier method is used to solve this problem. The expression of correlation function is as follows:
The simplified expression is as equation (23) by calculating the partial derivatives of each parameter respectively. Then the optimal value of ε is obtained at the point (x, y) of the fitting curve by inputting the corresponding value to calculate y, and calculate x from y.
Experimental Approach
Process of the ADR based on volumetric deviation ratio
The flow chart for obtaining model’s optimal volumetric deviation ratio
The flow chart for obtaining model’s OVDR εbest is shown in Figure 4. Firstly, the coordinates of the utopia points of this model are calculated by the minimum delamination thickness and the maximum delamination thickness, thus x0 and y0 are obtained. Then, the starting threshold ε0, the interval of the value Δε and the number of loops m are inputted, the overall volumetric deviation value of the adaptive delamination model under the corresponding values of ε, Vdev and the overall printing time Tprt can be calculated out. Furthermore, the parameter points are formed then obtain the fitting function through curve fitting. The OVDR εbest for this model is obtained by plugging the values of the fitting function’s constant and the coordinate value about the utopia point into equation (23).
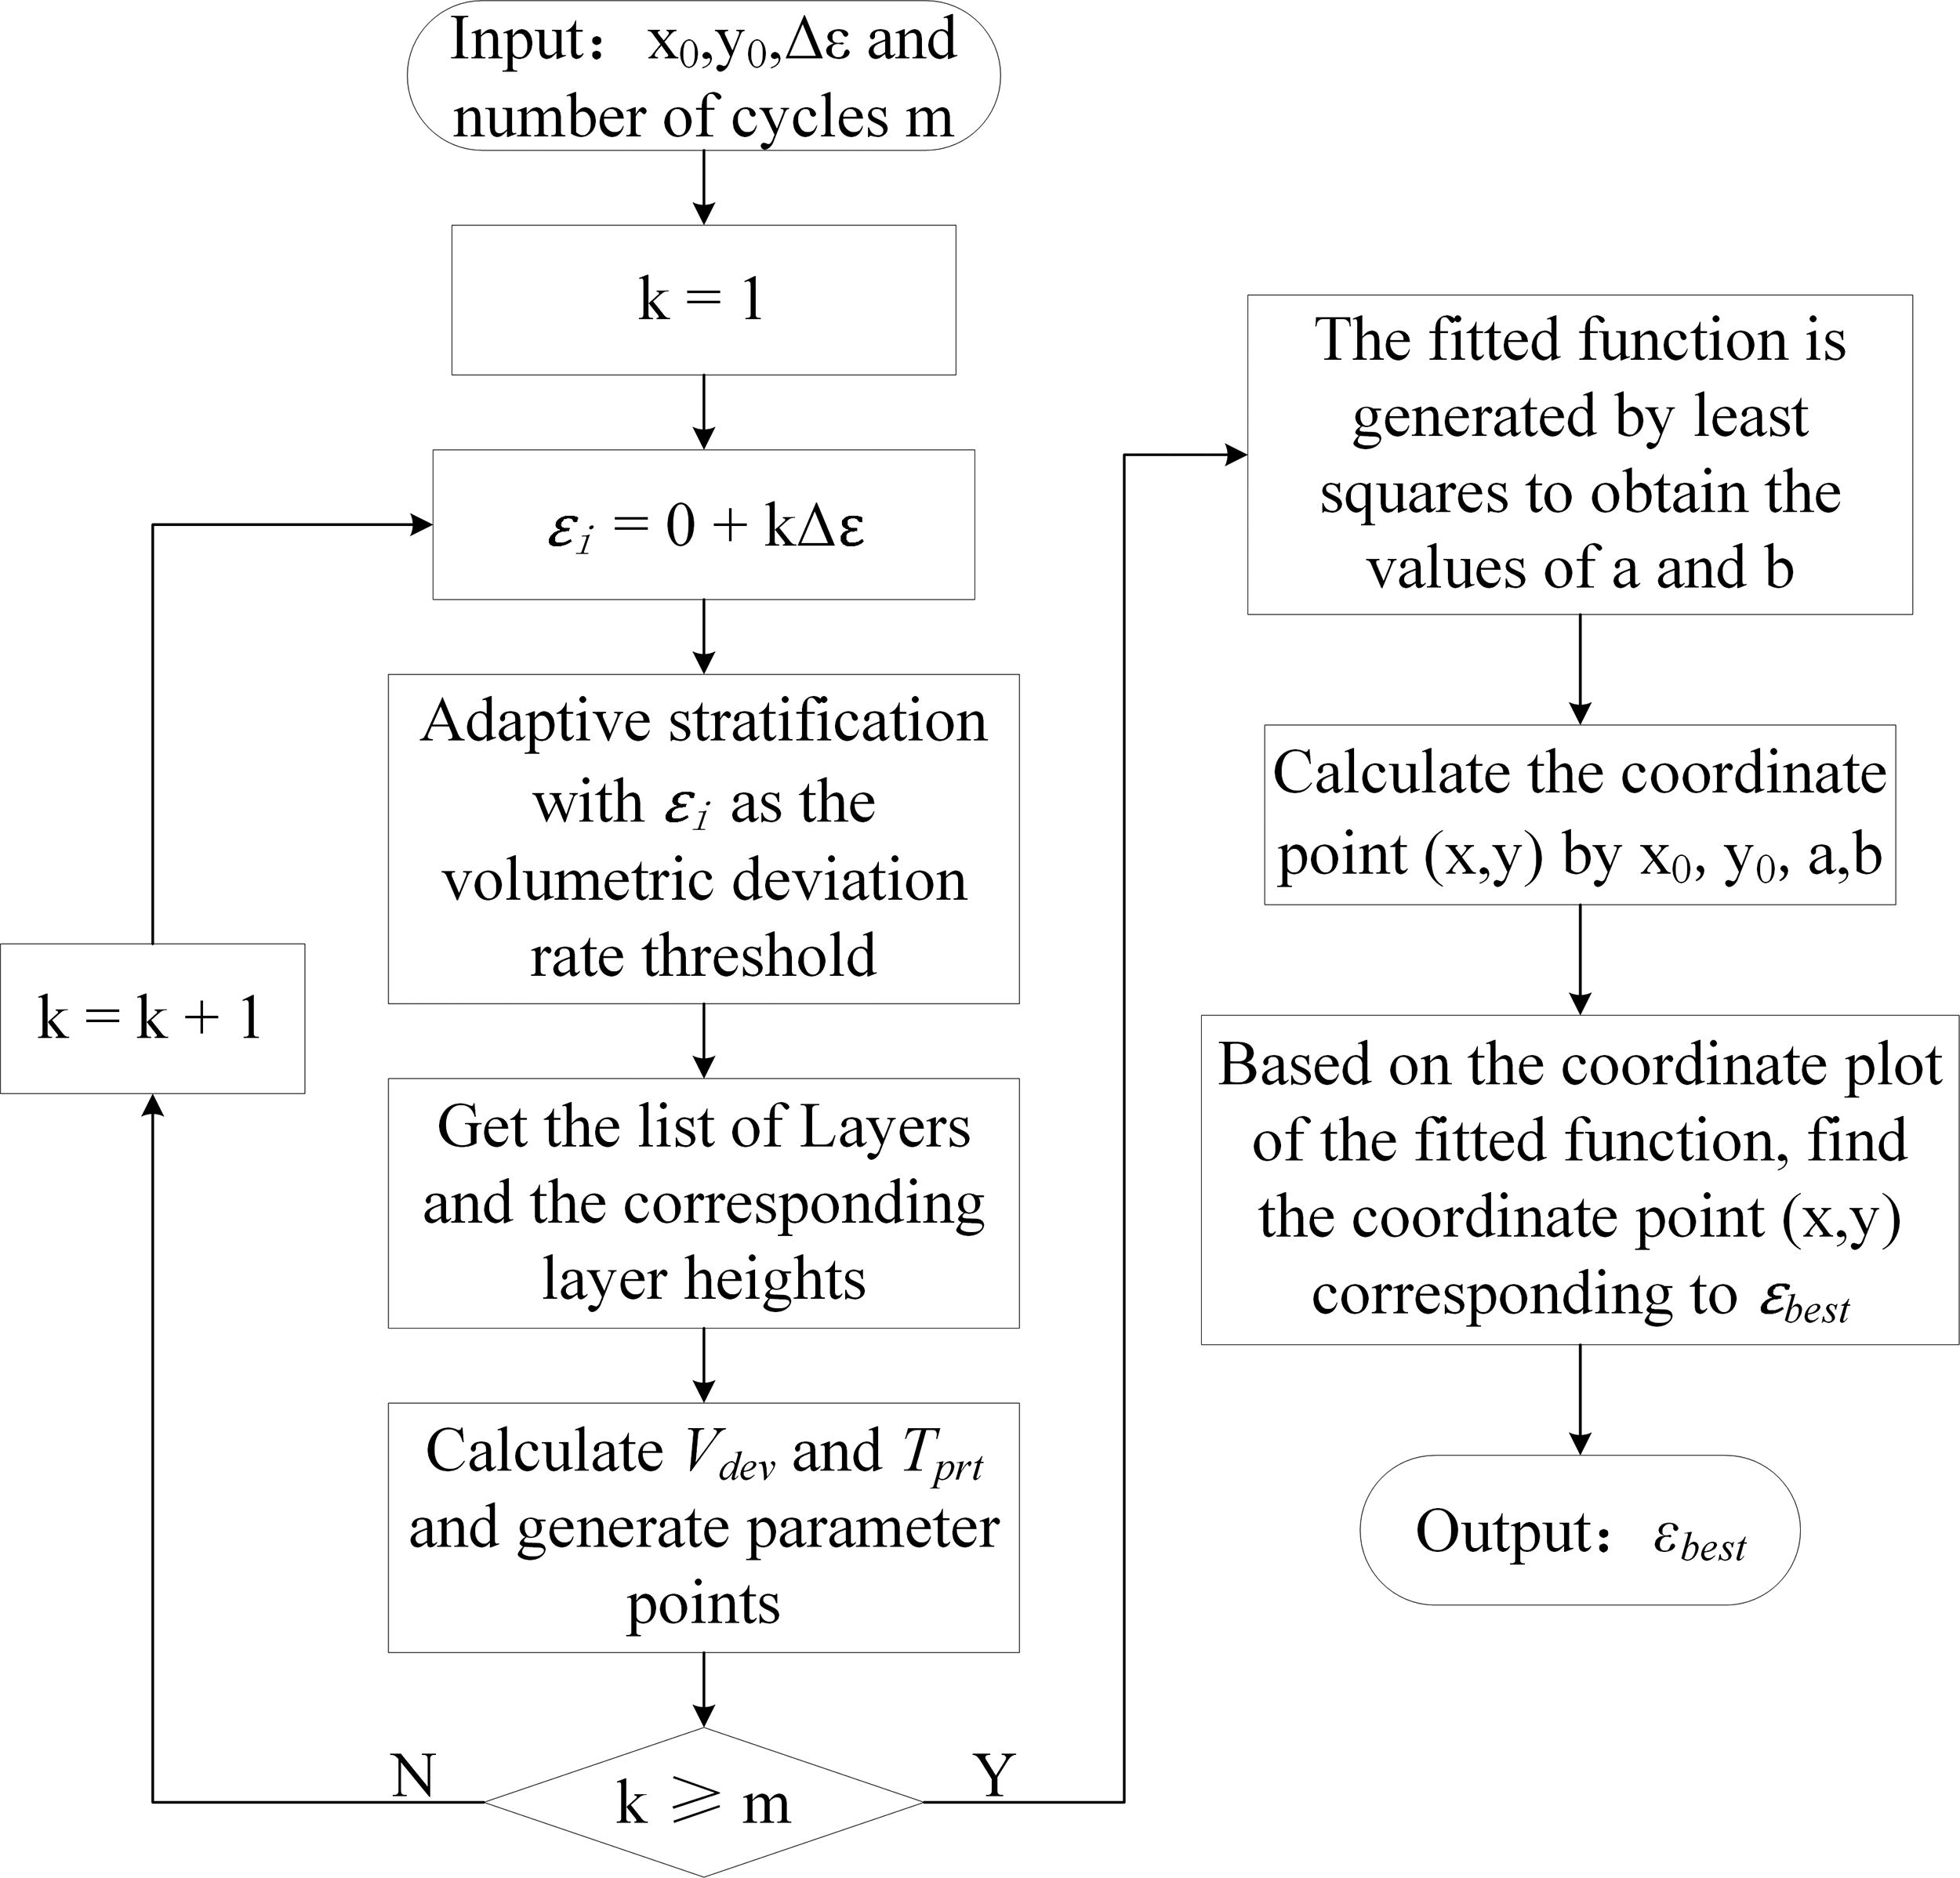
Flow chart for obtaining the model’s optimal volumetric deviation ratio.
The flow chart of ADR based on optimal volumetric deviation ratio
The volumetric deviation ratio ε is taken as the threshold value of layer thickness change in adaptive layering, and calculated based on equation (11). The algorithm flow for adaptive stratification with εi as the volumetric deviation ratio threshold is shown in Figure 5.
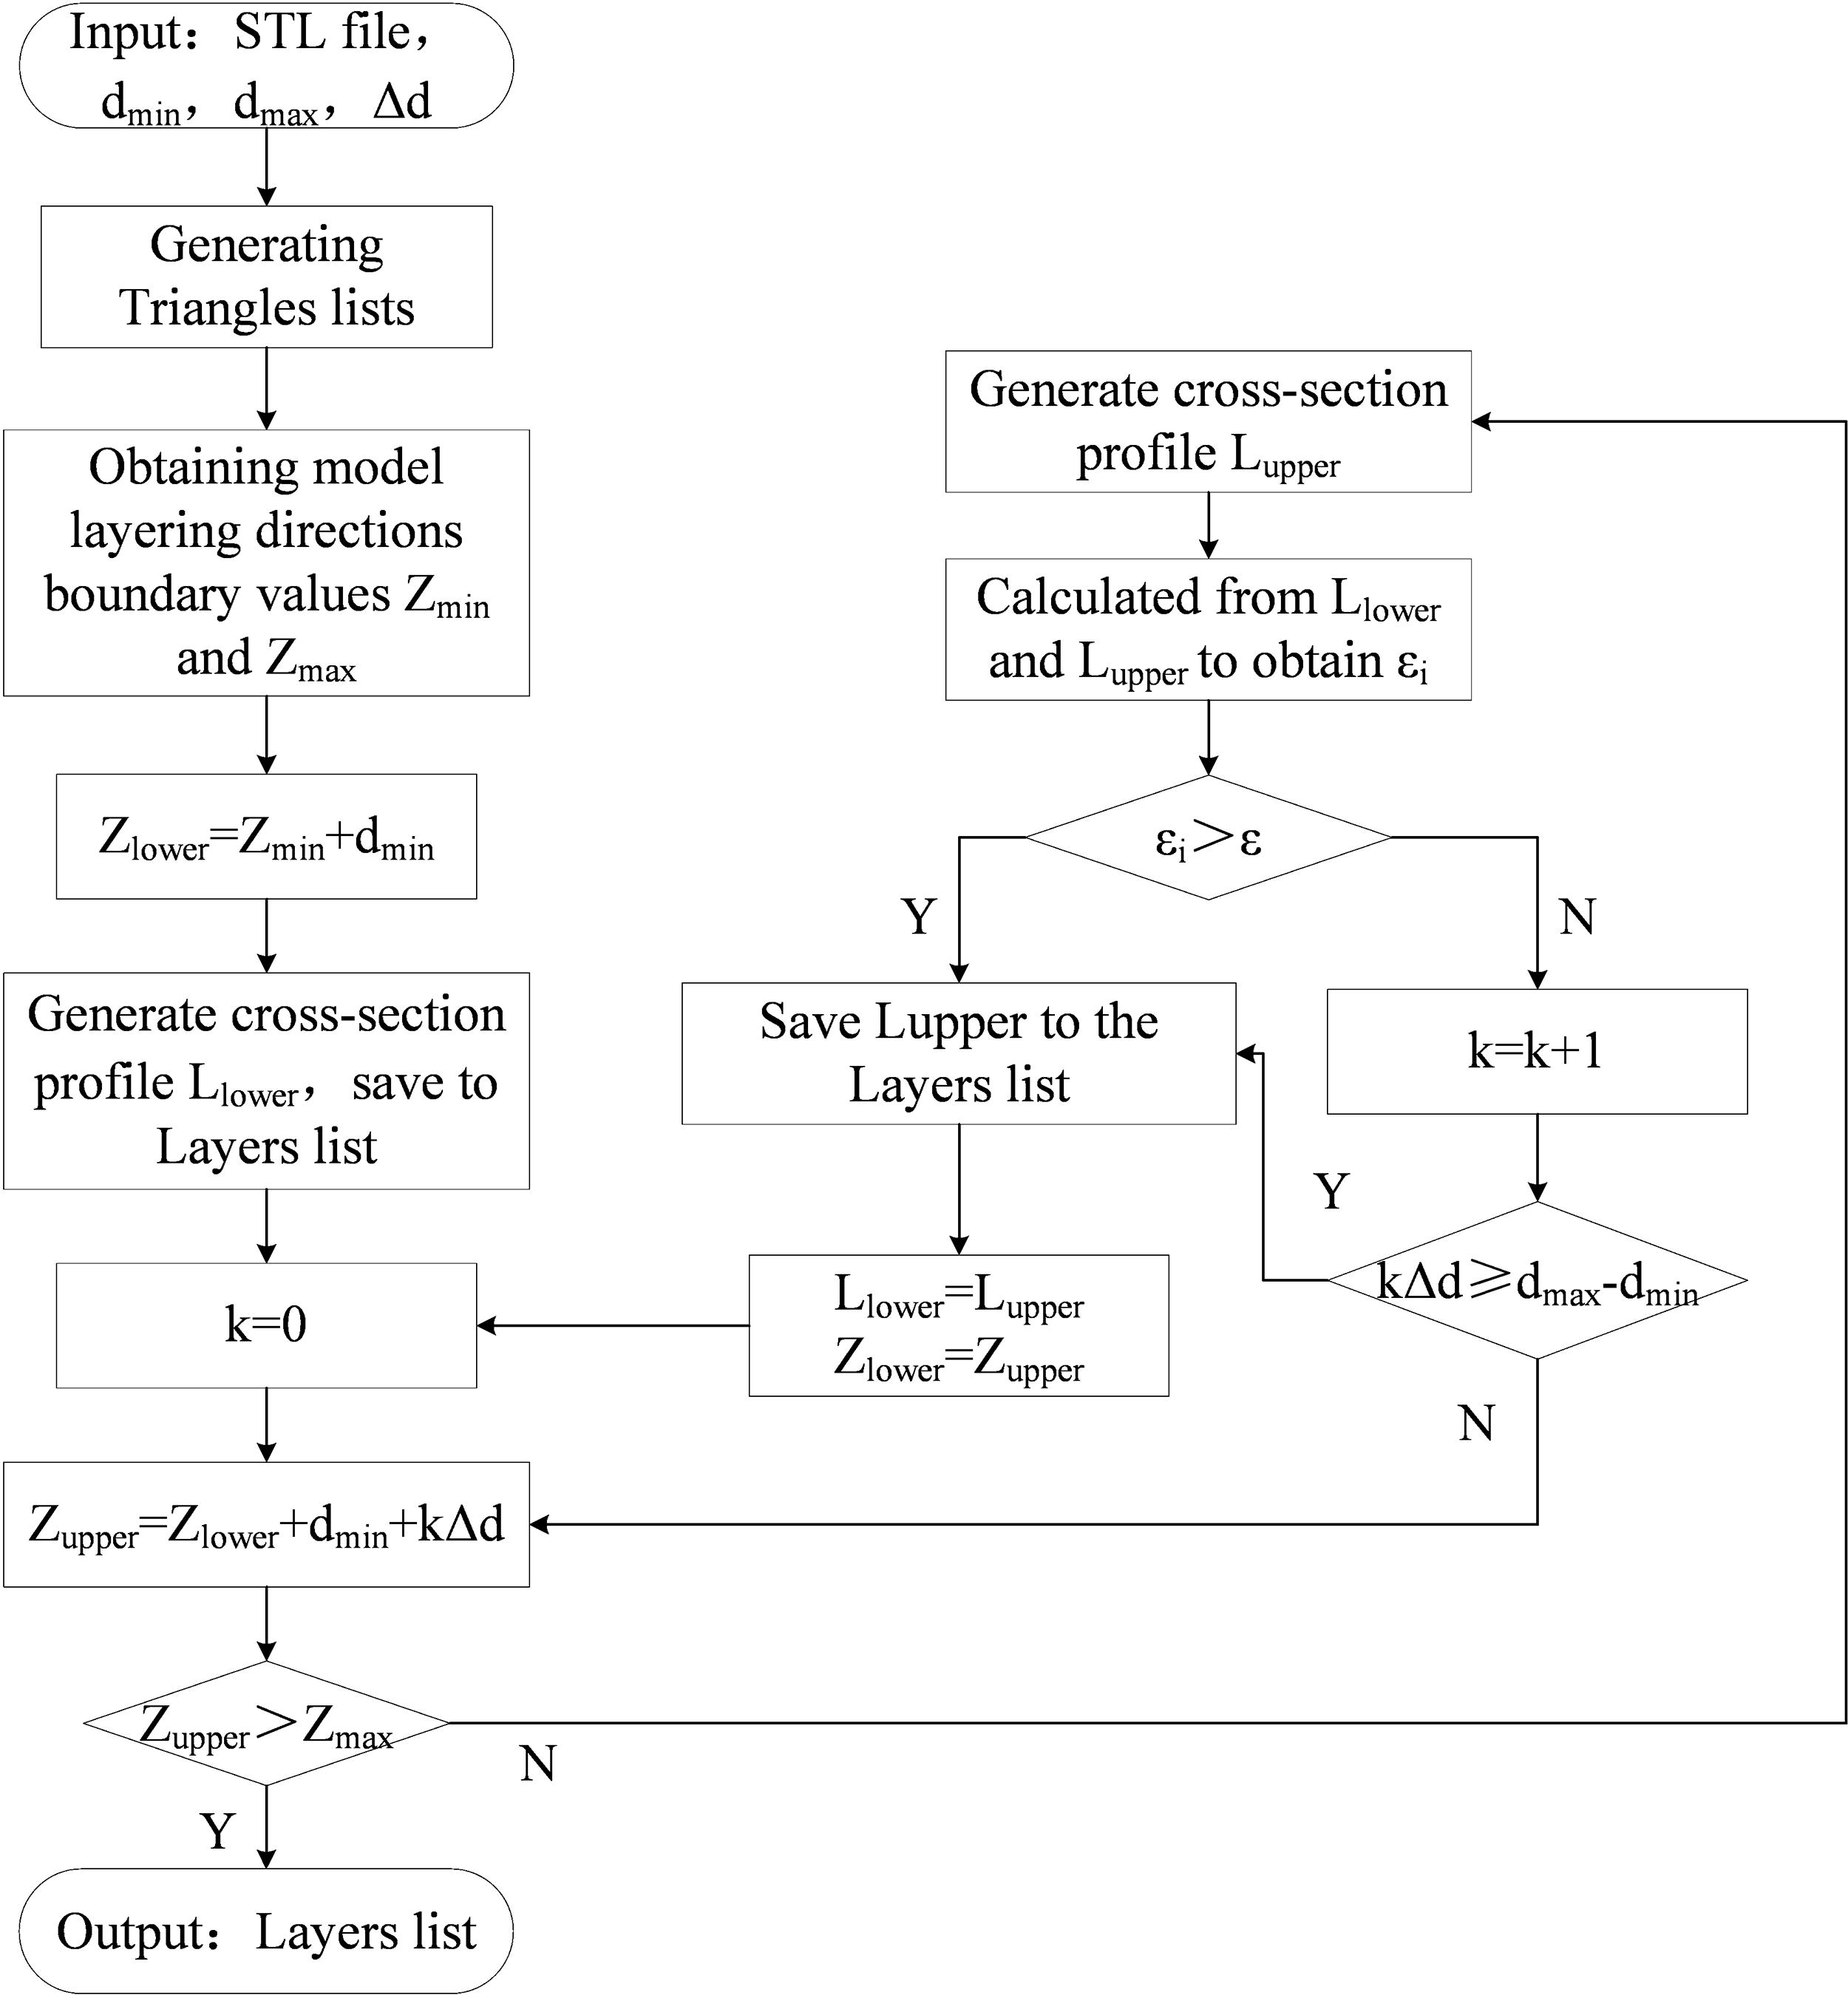
Flow chart of adaptive layering algorithm based on optimal volumetric deviation ratio.
Step 1: Enter the minimum printable layer thickness dmin, the maximum printable layer thickness dmax and layer thickness variation Δd. Then enter the STL model file in ASCII format.
Step 2: Extract the triangular facet information list from the STL file, the process is shown in Figure 4. The maximum and minimum values which the vertical coordinates of the facets are used as the basis for arranging all the facet information in the list of triangles. Therefore, the maximum value Zmax and the minimum value Zmin of the model in the layered direction can be obtained.
Step 3: Take the minimum print thickness dmin supported by the printer as the layer thickness for preliminary layer. The height of first layer is Zmin+dmin. Establish the layer plane at this height and intersect to obtain the cross-section profile, and save the profile information into the adaptive layer profile list.
Step 4: Define the i-th layer as Llower and the layered height as Zlower. Define the i + 1-th layer as Lupper and the layered height as Zupper, and the starting value of Zlower is the layered height of the first layer.
Step 5: The value of Zupper is Zlower+dmin+kΔd. Use Zupper as the delamination height to build the delamination plane and intersect to obtain the cross-section profile Lupper. Then calculate the volumetric deviation ratio εi between the two layers of cross-section profile.
Step 6: If the value of εi is less than the given volumetric deviation ratio threshold ε, update the value of k and repeat step 5 until εi is greater than the given threshold or the spacing between the two layers of the cross-sectional contour reaches dmax. Store the updated Lupper in the layers list. Then make Zupper equal to Zlower and Lupper equal to Llower.
Step 7: Repeat steps 5 and 6 until the value of Zupper is greater than Zmax. Output the list of layers, where the elements stored in the list are the cross-sectional contours of the adaptive layering.
The optimal volumetric deviation ratio for bunny model
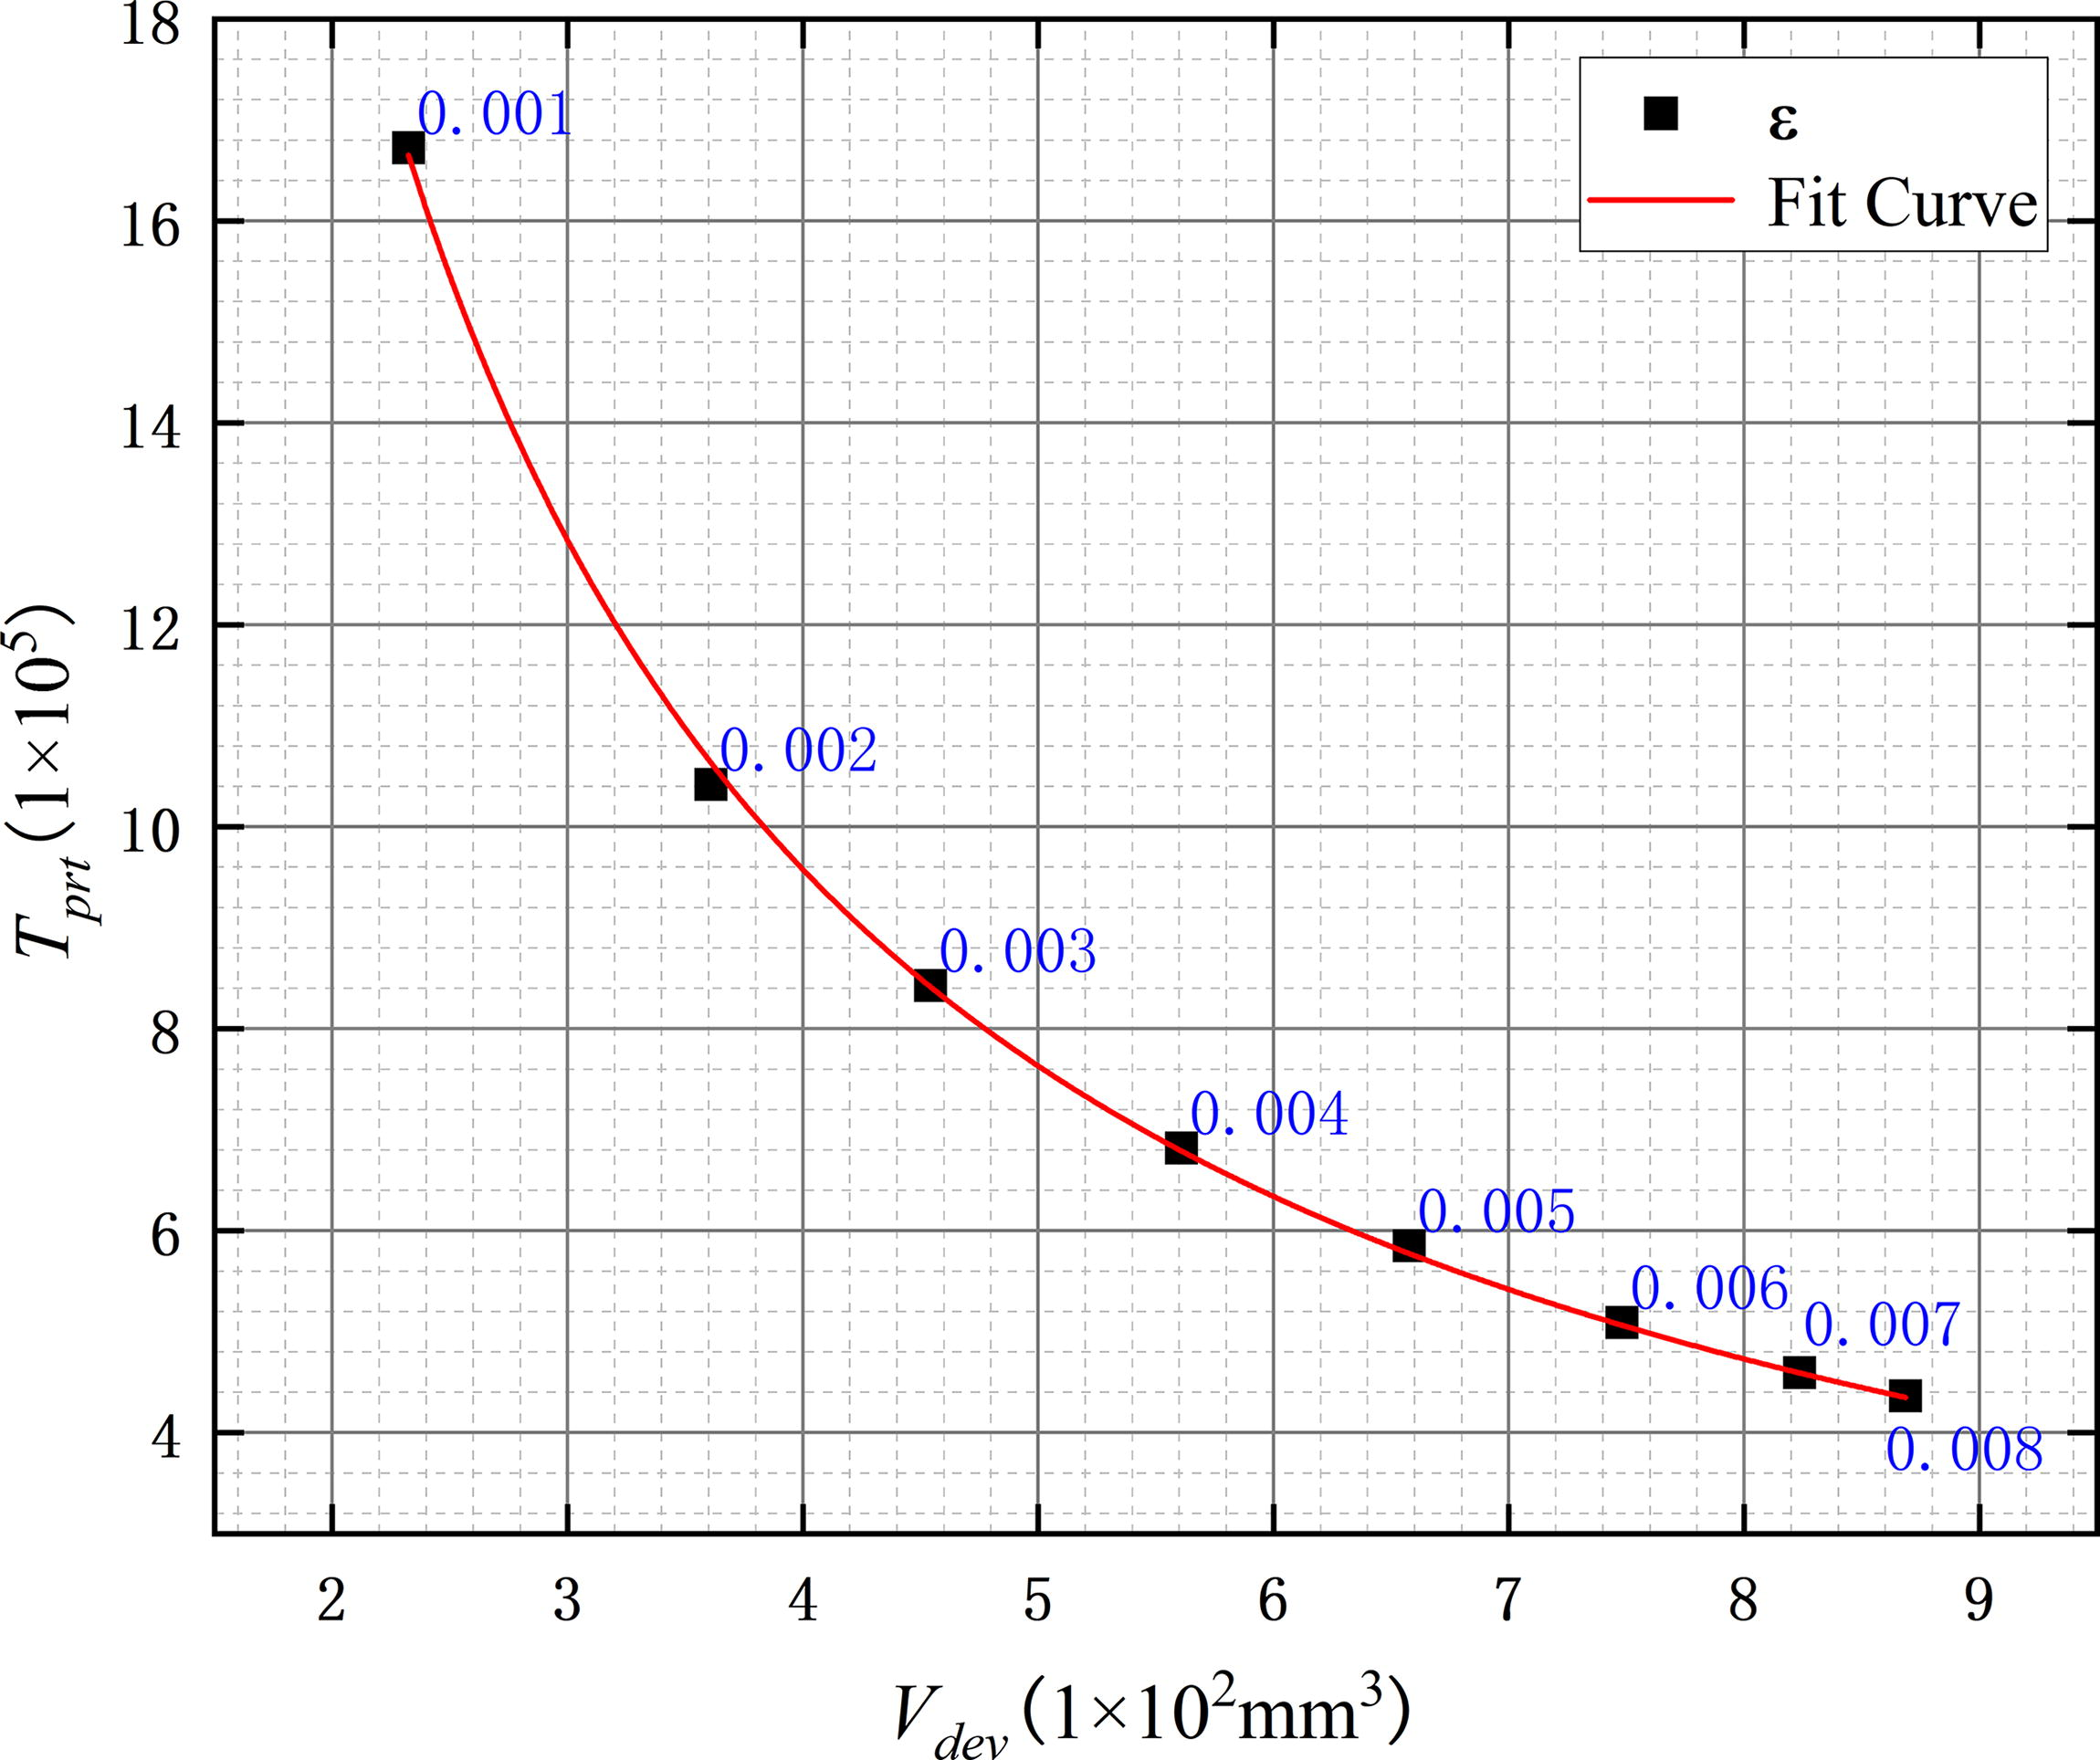
In order to prevent the contingency caused by the artificial selection of complex models, the optimal value of ε is solved based on the bunny model (86.3 mm *66.7 mm*83.4 mm) and displays the results. The thickness supported by the printer is set from 0.05 to 0.4 mm, and the printing thickness varies evenly with an interval of 0.05 mm. The ADR in this article is built based on Python language, and the adaptive results are presented accordingly. Appropriate values of ε with the same interval are selected for adaptive layering of bunny model, and the overall volumetric deviation Vdev and estimated print time Tprt are calculated in Table 2. Tprt is a dimensionless value expressed as the sum of the contour areas.
Parameter Value of Bunny Model at Each Value of ε
The distribution of these points on the axis and the fitting curve are shown in Figure 6. The fitting equation is in the form of power function, and the goodness of fit is 0.999.
The distribution of different values of ε and the fitting curve.
In order to obtain the ideal printing index under the parameters provided by the printer, namely, the printing parameter utopia point Pu, it is necessary to calculate the relevant indexes under the minimum and maximum printing thickness supported by the printer, and the specific values are shown in Table 3.
Parameters Used to Calculate the Utopia Point
Through the fitting function corresponding to the fitting curve in Figure 6 and the utopia point calculated in Table 3, the data in Table 4 can be obtained. By substituting the corresponding value into equation (23), the coordinate point with the minimum Euclidean distance is (5.801, 6.723), and the Euclidean distance is 5.417. The corresponding value of ε is estimated to be between 0.0042 and 0.0043 by the position of coordinate points on the fitting curve.
Parameters Used to Calculate the Minimum Euclidean Distance
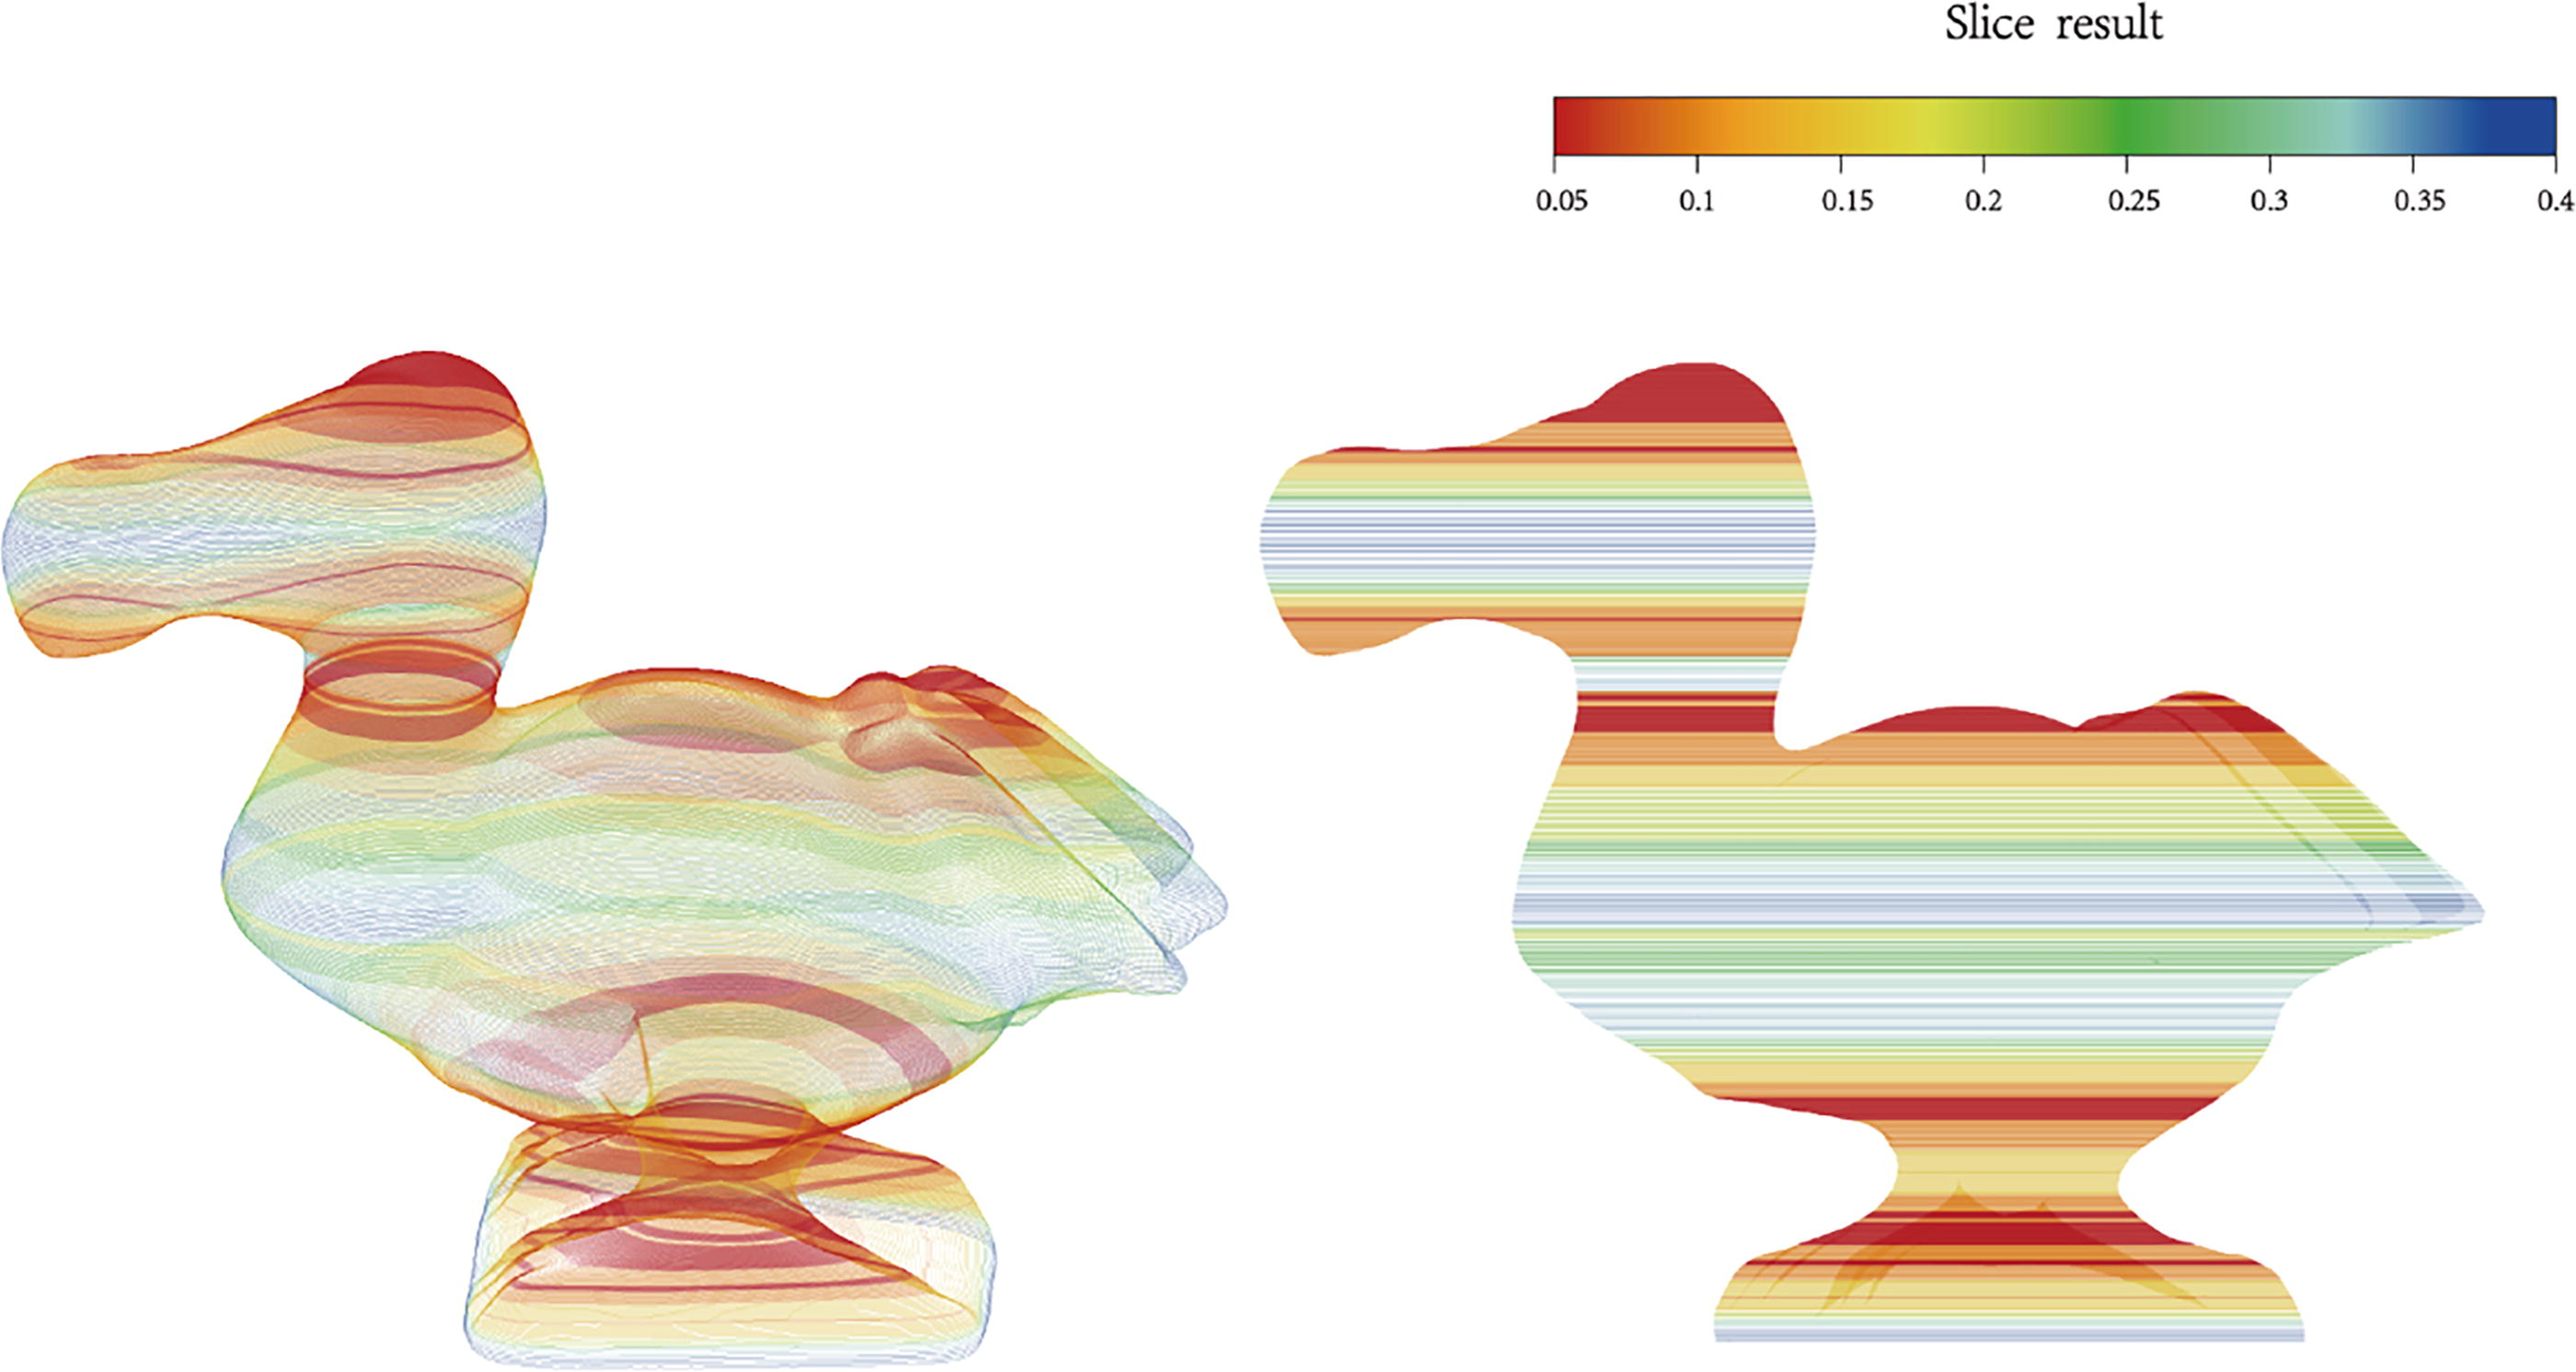
However, the minimum Euclidean distance calculated by the enumeration method is from 0.004 to 0.0041, and the minimum Euclidean distance is 5.3387. This is caused by some error in fitting curve and inaccurate parameter values. The error of Euclidean distance between the optimal value calculated by the formula and the actual optimal value is about 1.467%, which is acceptable compared with the huge and tedious calculation of the enumeration method. The value of ε is set to 0.0042 for adaptive layering, and the model slicing situation is shown in Figure 7.

Model adaptive layered display of bunny.
In the process of determining the optimal threshold ε of the overall volumetric deviation ratio, both printing time Tprt and overall volumetric deviation Vdev are important indicators. The Weighted Polynomial Regression Optimization Algorithm (WPROA) is employed to establish a predictive model for ε, as illustrated in Figure 8. First, the raw experimental data are standardized. Then, second-order polynomial regression model is constructed to describe the nonlinear relationships among ε, printing time Tprt, and volumetric deviation \\mumnasprod\cenpro\ApplicationFiles\Journals\MAL\PAAM\Vol00000\250033\ by equation (24) and equation (25). Based on this, weighting coefficients are introduced to evaluate both printing accuracy and efficiency. A comprehensive scoring model is developed to balance the two objectives and obtain the optimize volumetric deviation ratio threshold ε finally by equation (26).
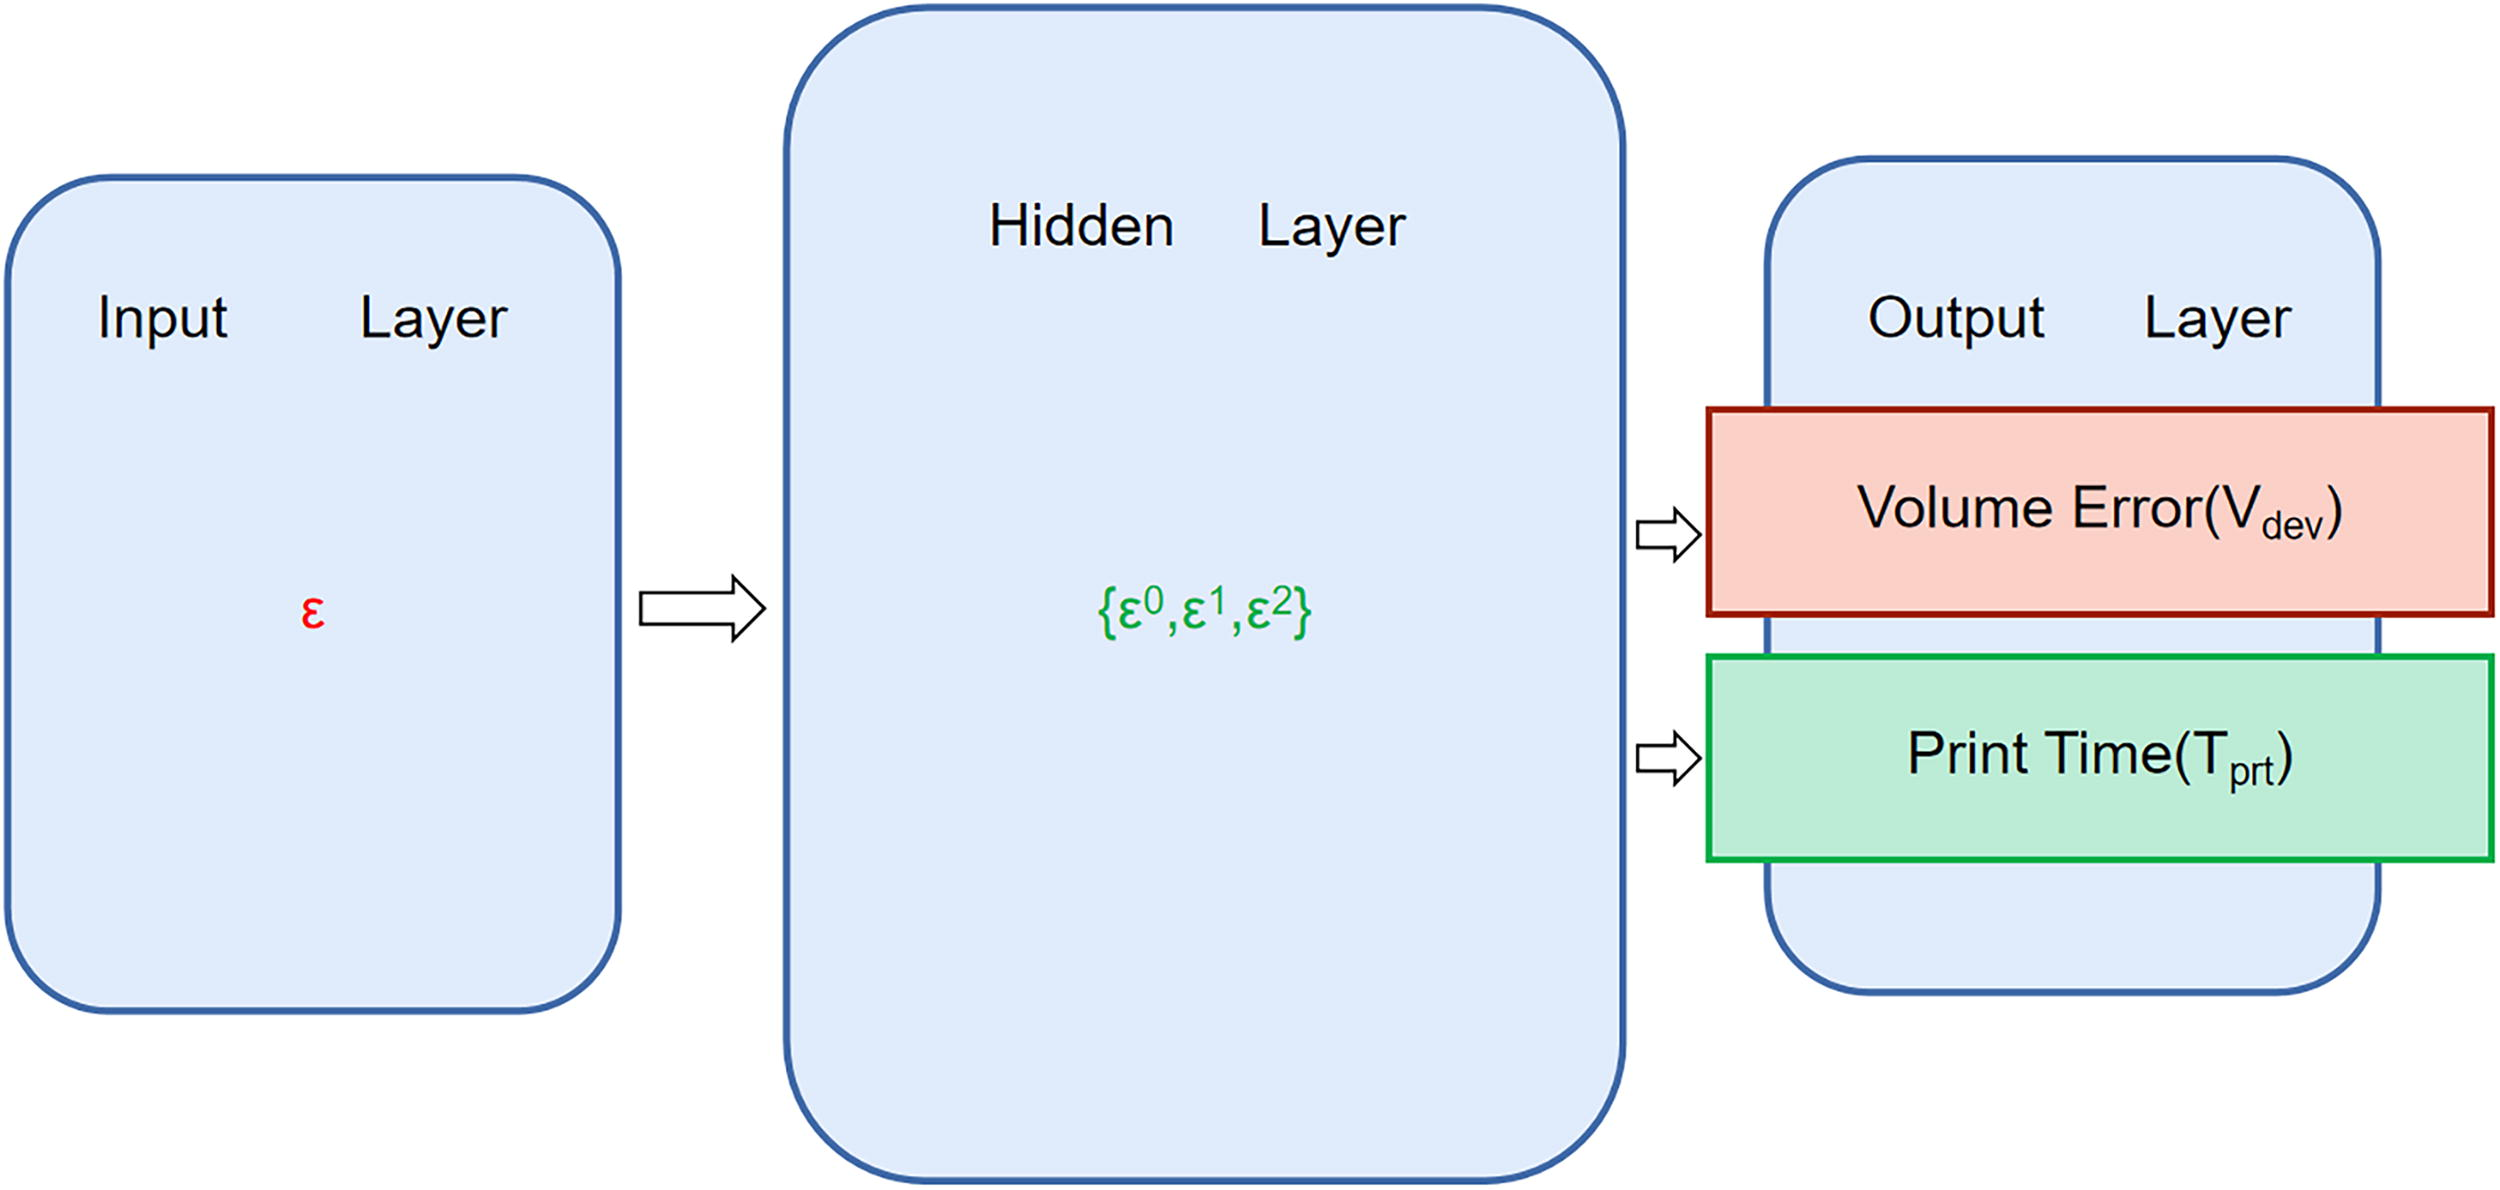
Architecture diagram of the Weighted Polynomial Regression Optimization Algorithm (WPROA) neural network.
The coefficient ωv represents the weight of the volumetric deviation Vdev. The coefficient ωT represents the weight of the printing time Tprt. Their sum equals 1 to ensure the normalization of weights. The predicted value of volumetric deviation
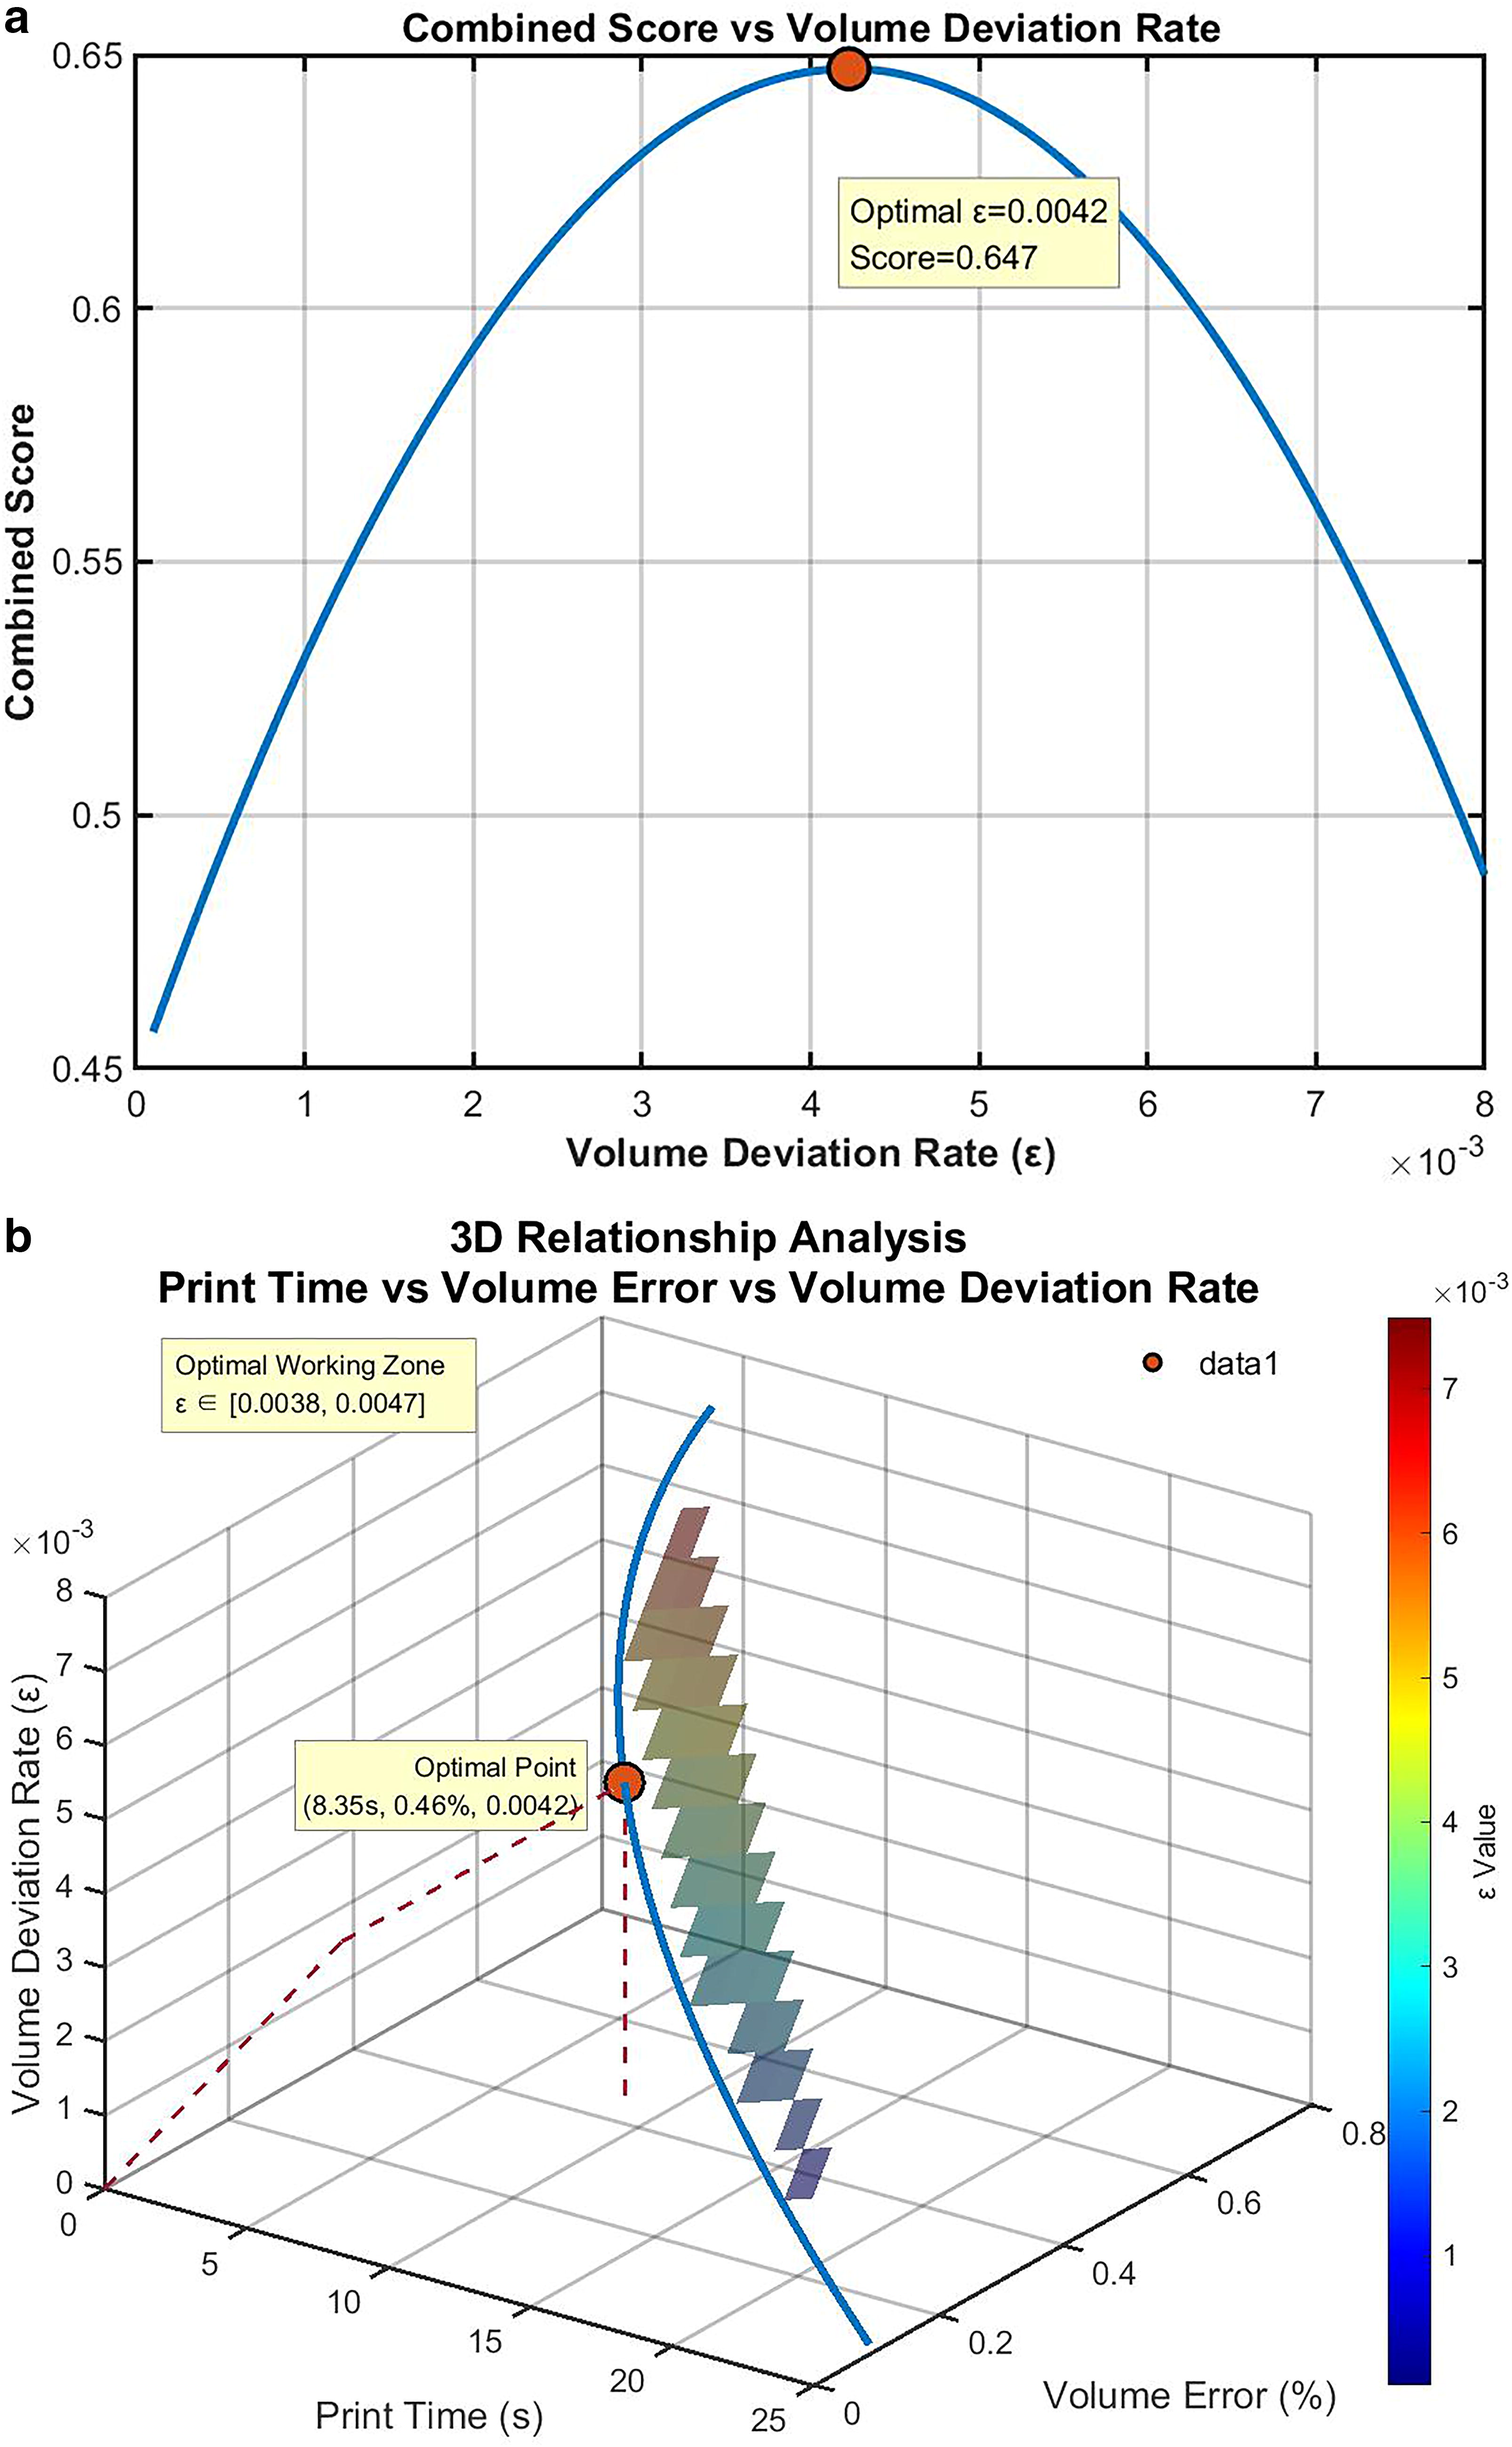
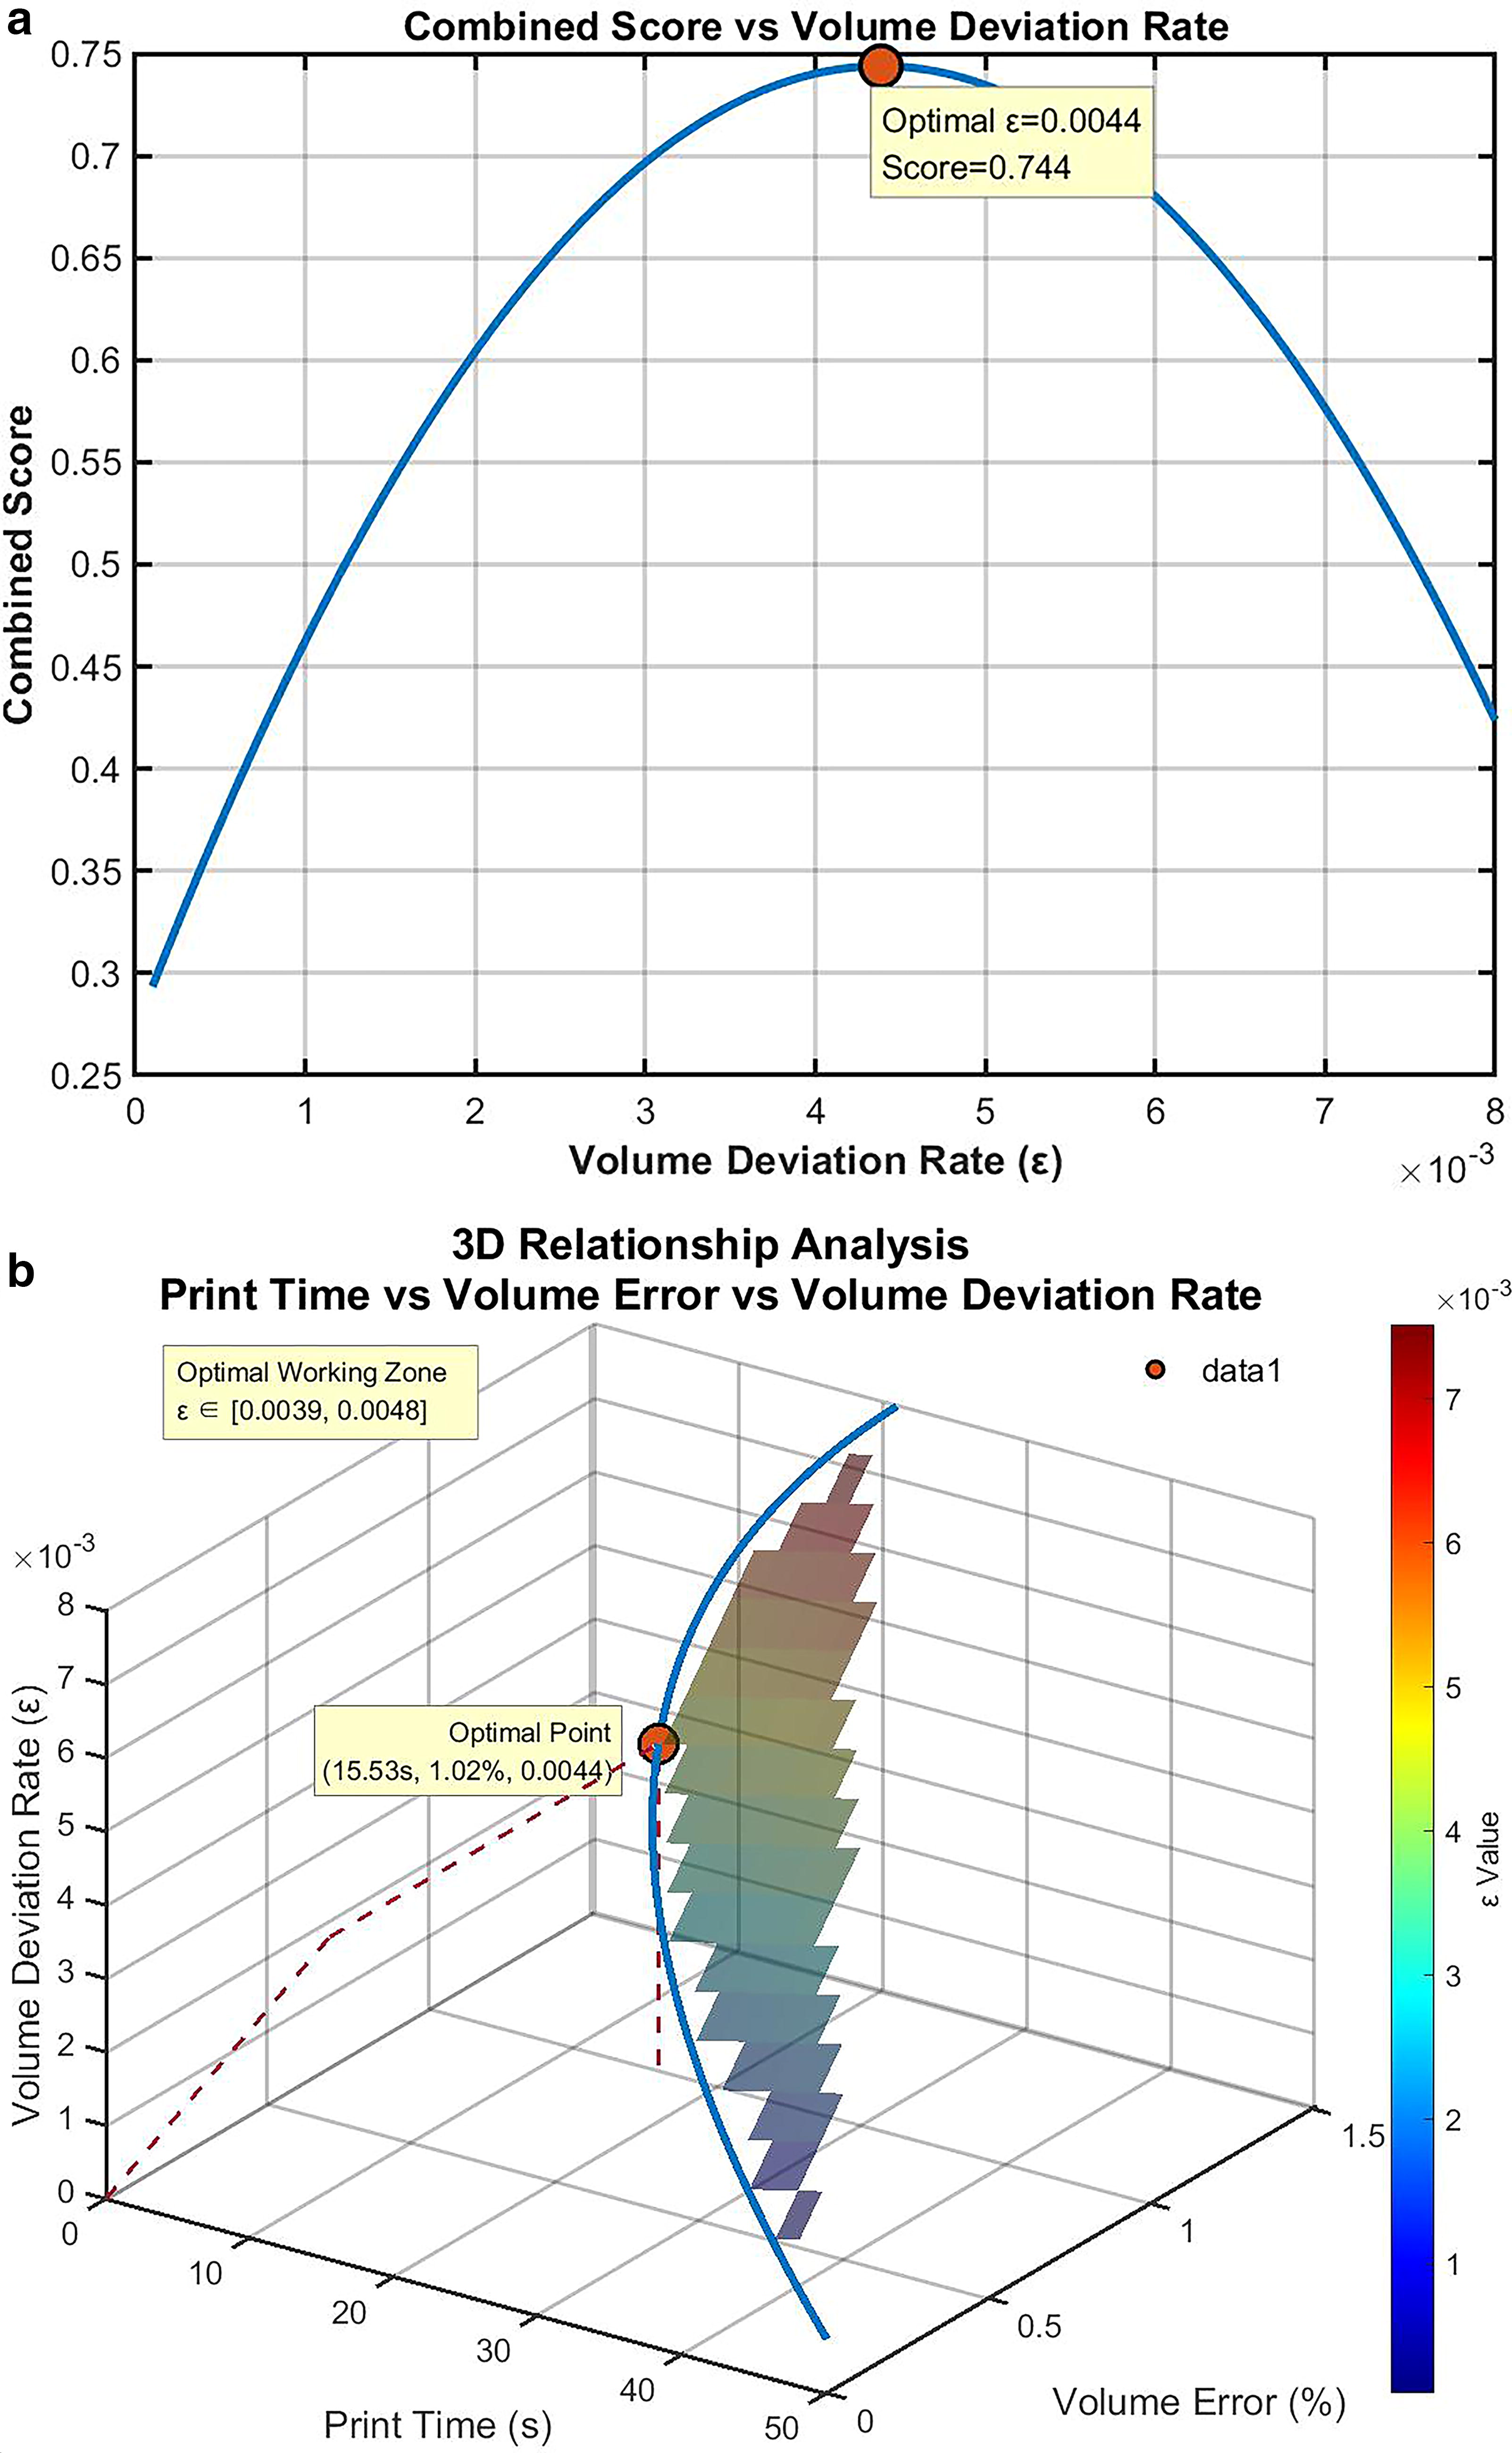
The data in Table 2 is used as a test set. The WPROA algorithm is used to evaluate the OVDR ε for the bunny model, as shown in Figure 9. The optimal value of ε is 0.0042. In the range of 0.001–0.008, the algorithm performs a dense search using 1000 sampling points. It calculates the comprehensive score corresponding to each ε value, and the 2D graph is shown in Figure 9a. The optimal operating point is determined by 3D response surface analysis, as illustrated in Figure 9b. The value ε at this point is 0.0042. It achieves the best balance between printing time Tprt and volumetric deviation Vdev, as shown in Figure 9. The experimental results demonstrate that the WPROA algorithm solves the multiobjective trade-off problem in the OVDR threshold effectively. It provides a certain basis for selecting process parameters in 3D printing. For bunny model, the WPROA and Euclidean methods converge on the same optimal ε = 0.0042.
Optimal ε prediction results for bunny model with Weighted Polynomial Regression Optimization Algorithm (WPROA).
Performance of adaptive layering algorithm based on optimal volumetric deviation ratio
The three algorithms are VE-based ADR, the area deviation ratio-based ADR and the ADR based on OVDR proposed in this article. The threshold of the VE algorithm is taken as 0.37, the threshold of the ADR algorithm is taken as 0.0047, and the OVDR threshold of this article’s algorithm is 0.0042, and the remaining two thresholds are 0.003 and 0.005. This subsection compares the layering effect of the algorithms based on each feature location, and the selected locations of the model features are feet, face, and ears, corresponding to feature heights of 0–8 mm, and 40–58 mm the comparison between this article’s algorithm and the existing adaptive algorithms is shown in Table 5.
Comparison of Layering with Existing Adaptive Layering Algorithms
ADR, adaptive layering algorithms; VE, volumetric error.
According to the results in Table 5, the proposed algorithm increases layer numbers of corner and overhang features such as feet, face, and ears. It can be found that in the ADR proposed in this article, as the volumetric deviation ratio threshold ε becomes larger, the number of layers at the model features is less. This is because the volumetric deviation ratio threshold ε determines that the error between two neighboring slices cannot be larger than this value, so if the value of ε is larger, the margin that can be deflated when the model is layered is larger, and the number of layering corresponds to a decrease. In addition, the results show that the adaptive layering under the OVDR proposed in this article has various layering performance at different model features compared with the ADR algorithm when the total number of layers in both of them is similar, and it has better layering performance compared with the VE algorithm in terms of the whole as well as at the features.
This section verifies whether the actual printing effects of the algorithm in this article conform to the layered simulation results. The diameter of the printer nozzle is 0.4 mm, the printing material is polylactic acid (PLA), and the diameter of PLA material is 1.75 mm. The printing layer thickness range is from 0.05 to 0.4 mm. The printing speed of all layers is 80 mm/s. The printing model is the bunny model as shown in Figure 1. The internal filling of the model is set to 100%. The physical printing results and characteristics of each algorithm are shown in Figure 10. It can be observed that as the volumetric deviation ratio threshold increases, the model features are gradually coarse.
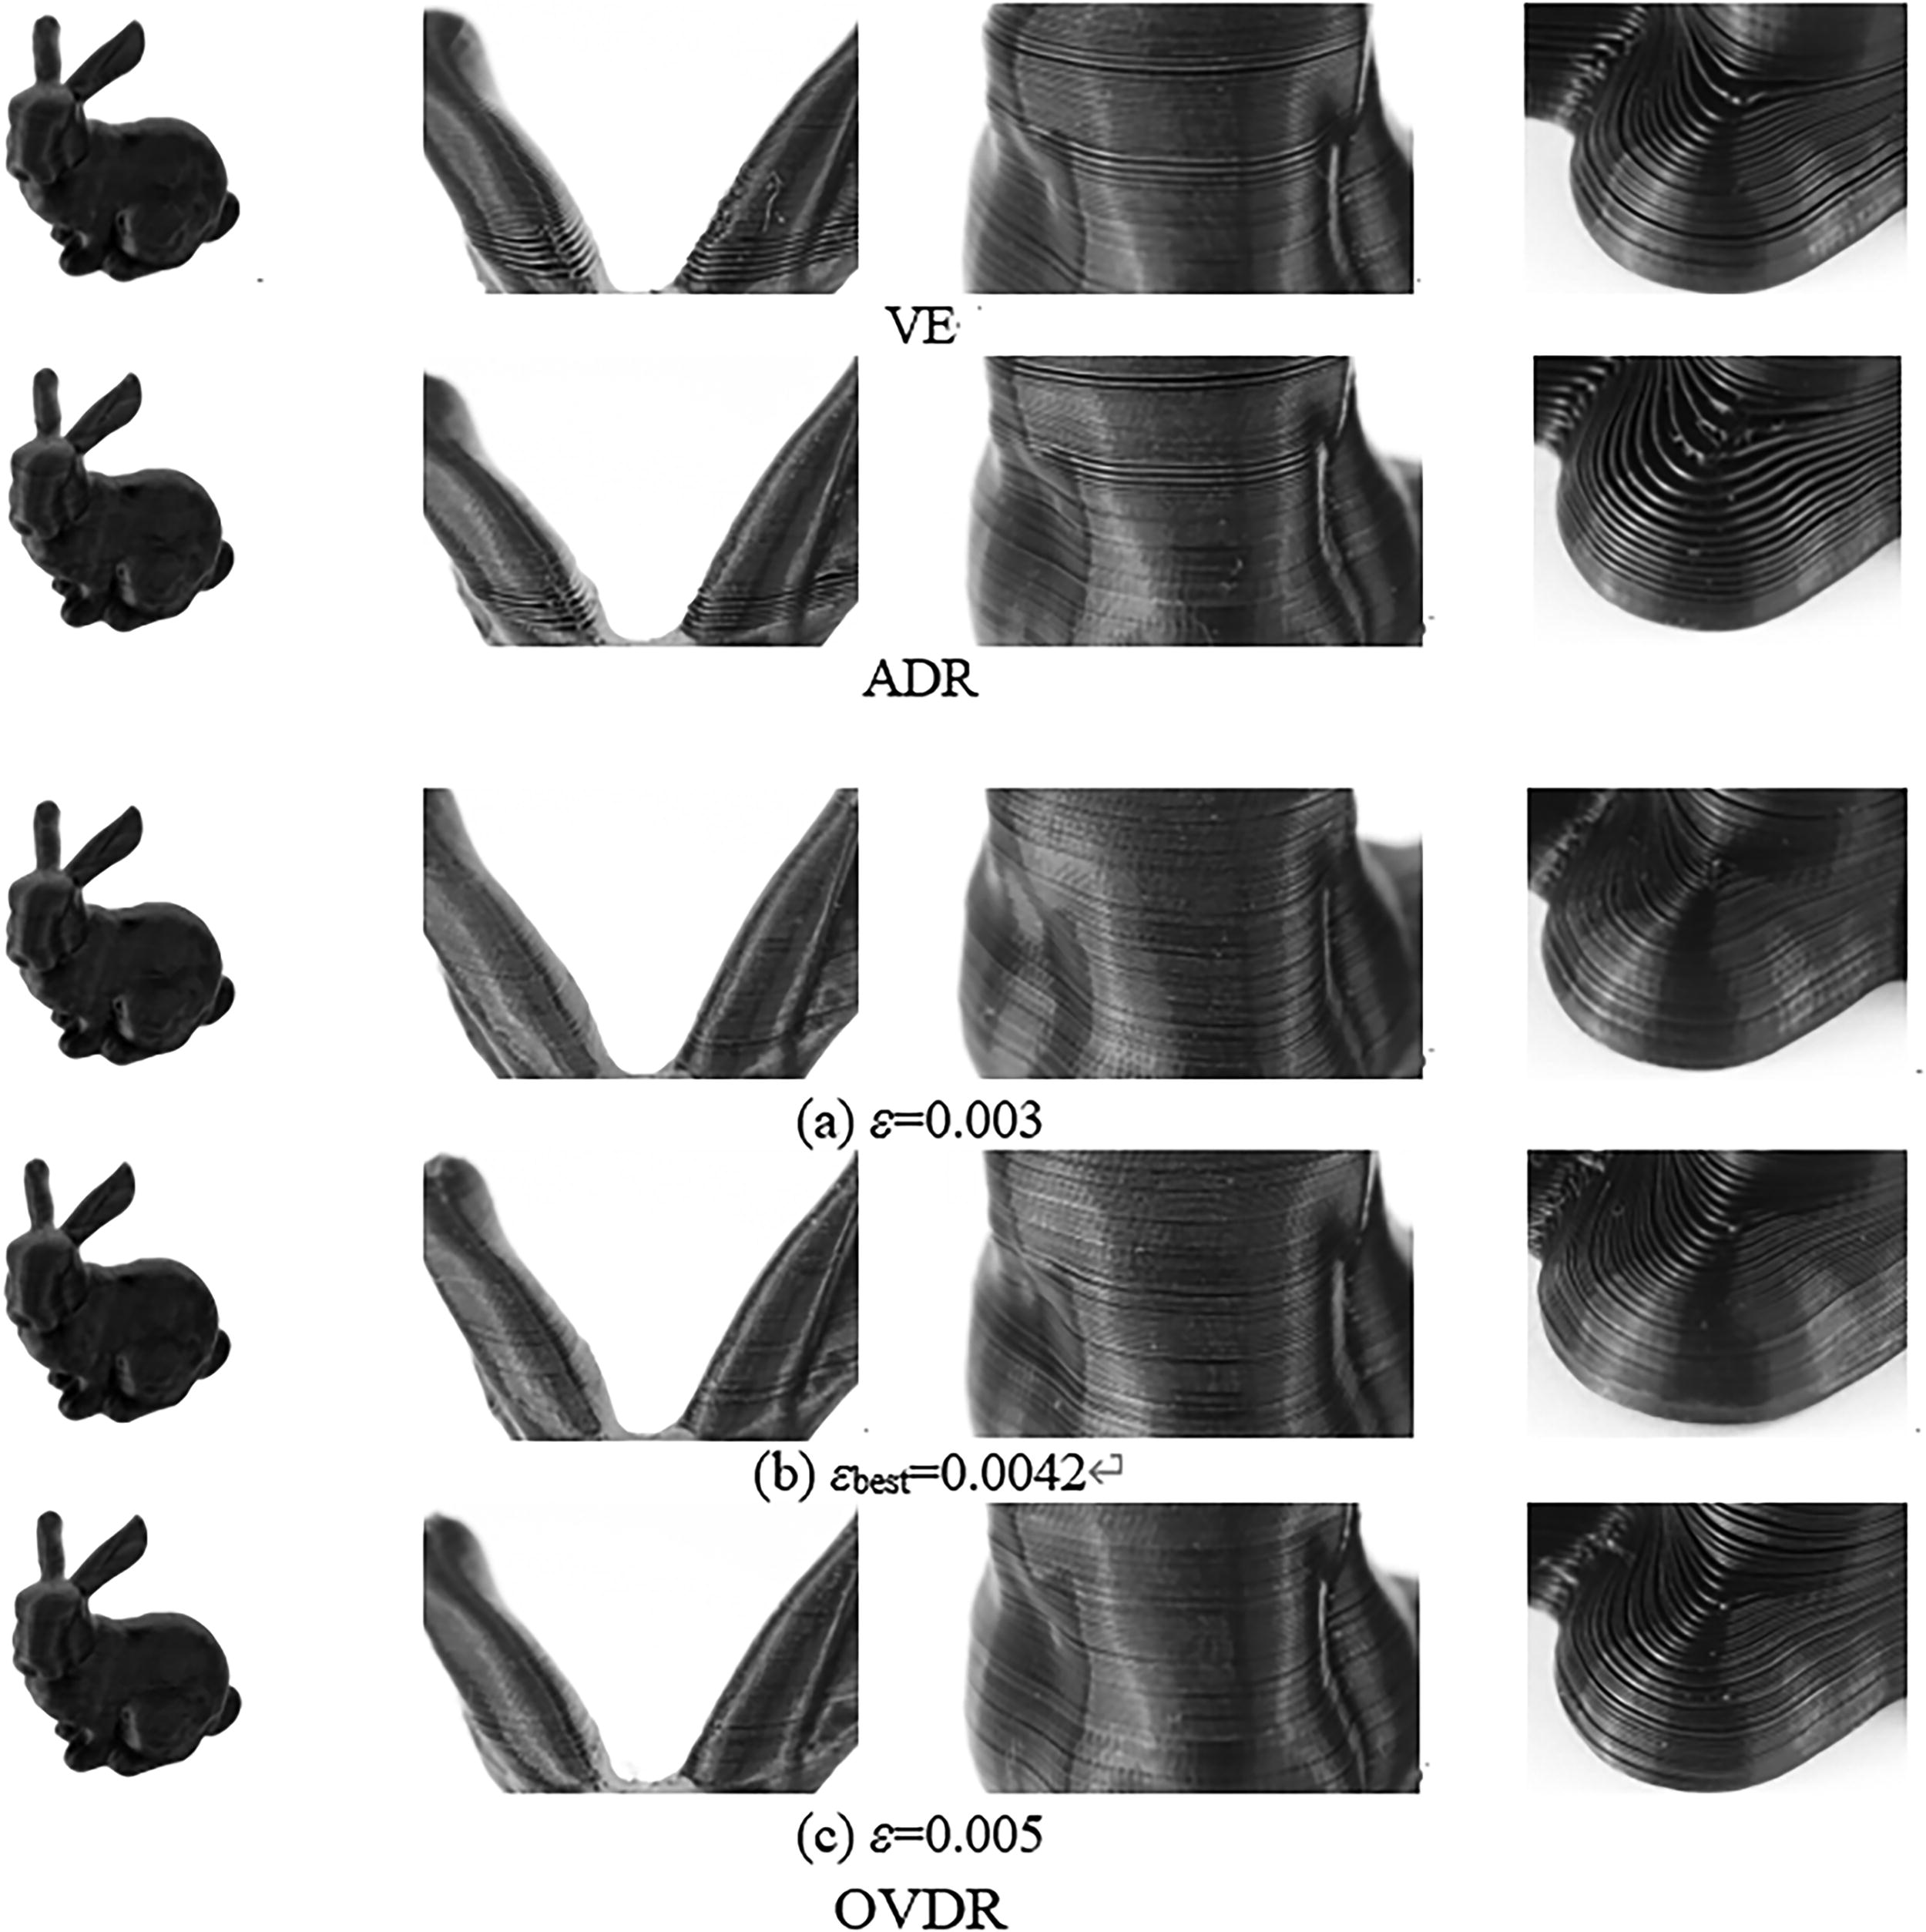
Physical comparison of prints with different layering algorithm.
From the printing effect comparison between the OVDR and the existing adaptive algorithm, it is evident that the printing accuracy of the algorithm in this article is higher and conforms to the layer distribution in Table 5. The printing time is recorded separately during the printing process, and the overall volumetric deviation value of the model under each algorithm is calculated by equation (8), as shown in Figure 11. In Figure 11, the larger the threshold value of ε in the algorithm proposed in this article, the fewer the number of printing layers and the shorter the printing time, but the printing error increases accordingly. Therefore, in practical applications, a higher value of ε can be chosen when printing efficiency is more important, and a lower value of ε when printing accuracy is more demanded. If there is no strict requirement on printing efficiency and accuracy, the value of ε obtained from the optimal value calculation method proposed in this article is used as the threshold. The performance of the proposed method is compared with two existing ADRs. When the printing time is the same as the ADR method, the volume error of this method is reduced by 15.46% and the number of layers is increased by 10.4%. When the volume error is the same as the VE method, the printing time of this method is reduced by 13.96% and the number of layers is increased by 49.3%. The number of layers directly affects the printing quality. The more layers, the more accurate the printing results of the model. The method in this article has better layering in bunny model features and less step effect from physical prints.
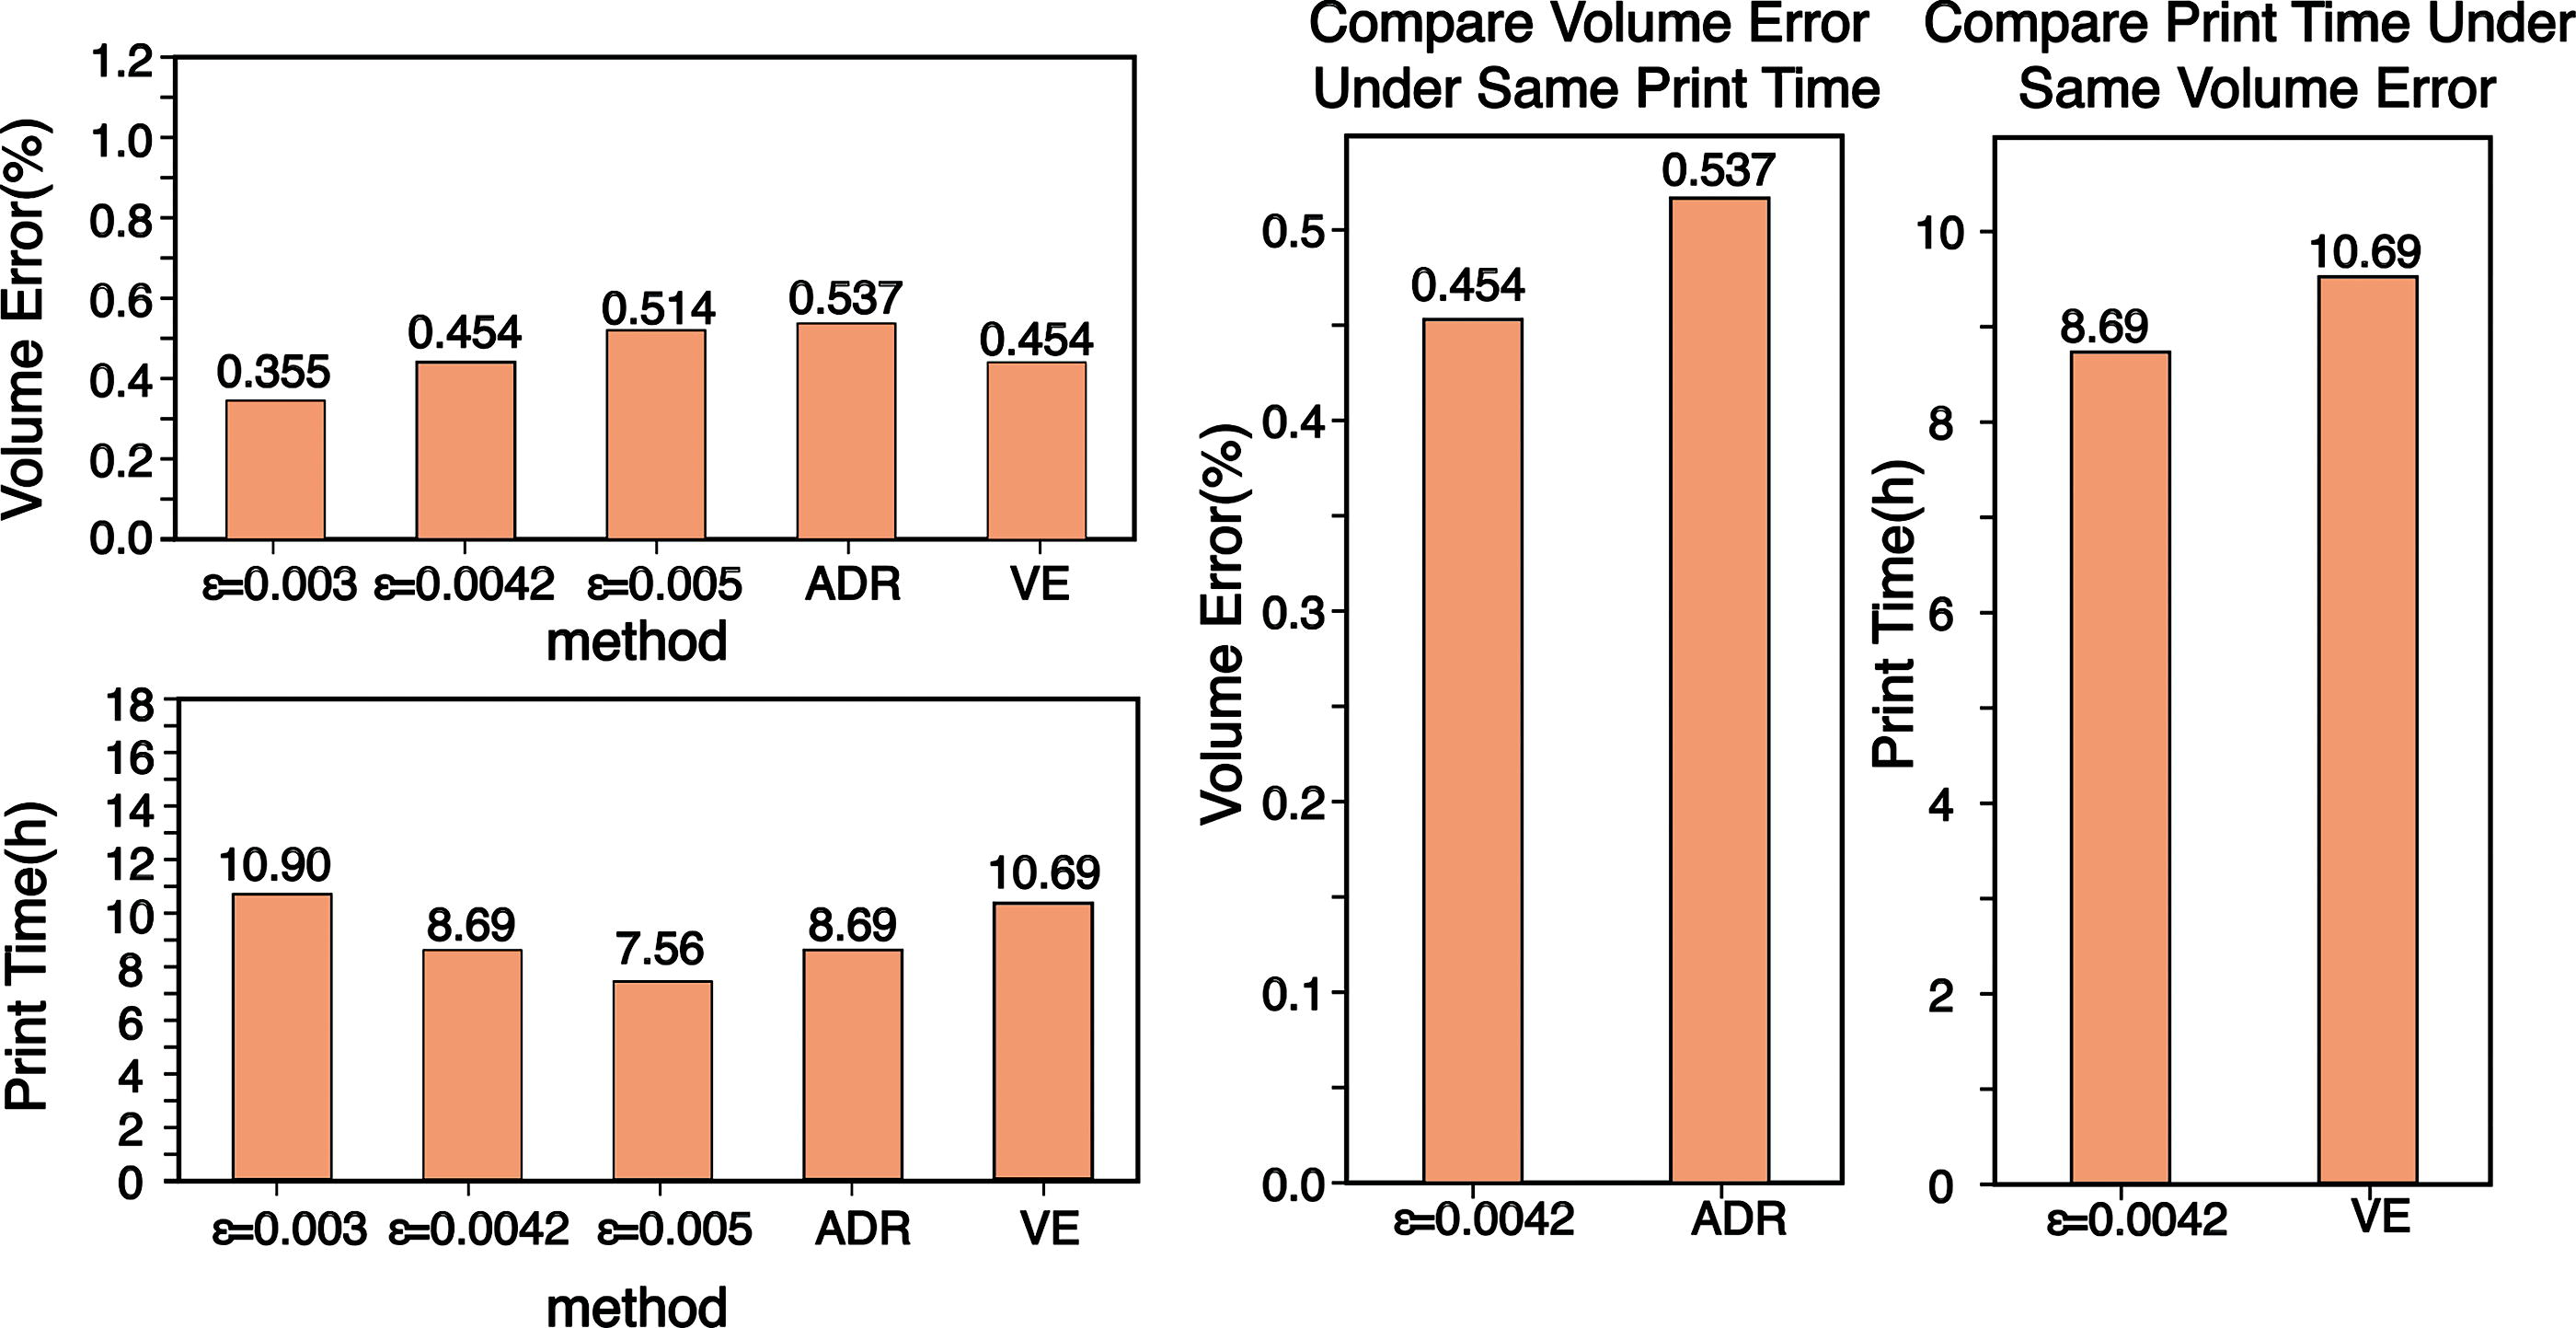
Comparison of adaptive layering methods with existing ones.
Results and Discussion
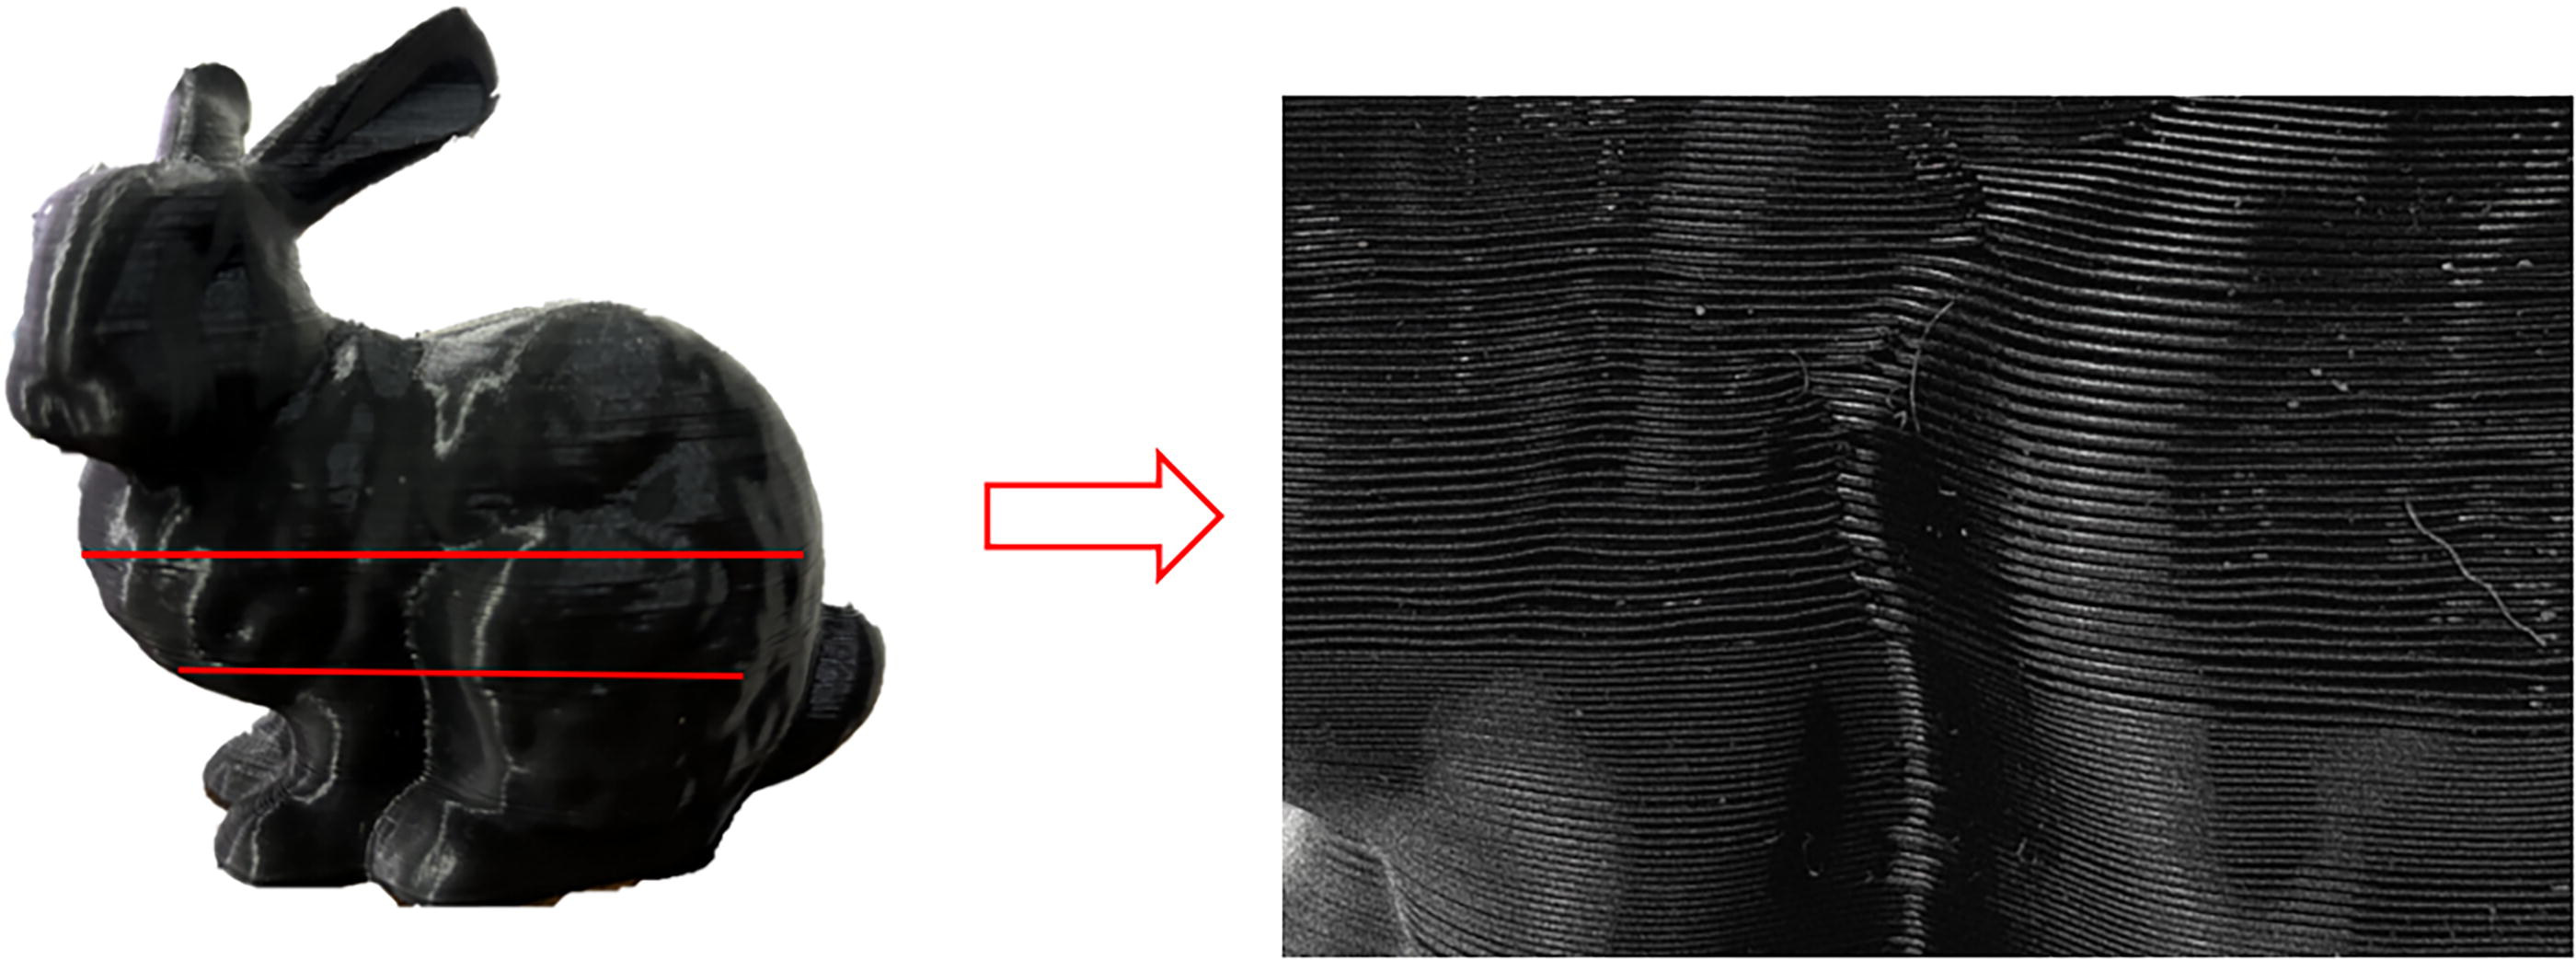
During the physical printing process, it was observed that setting high print speed could save time effectively. However, this led to extrusion deformation in areas with large thickness concentrated, as shown in Figure 12. The area roughness is 18.329 µm shown in Figure 13.
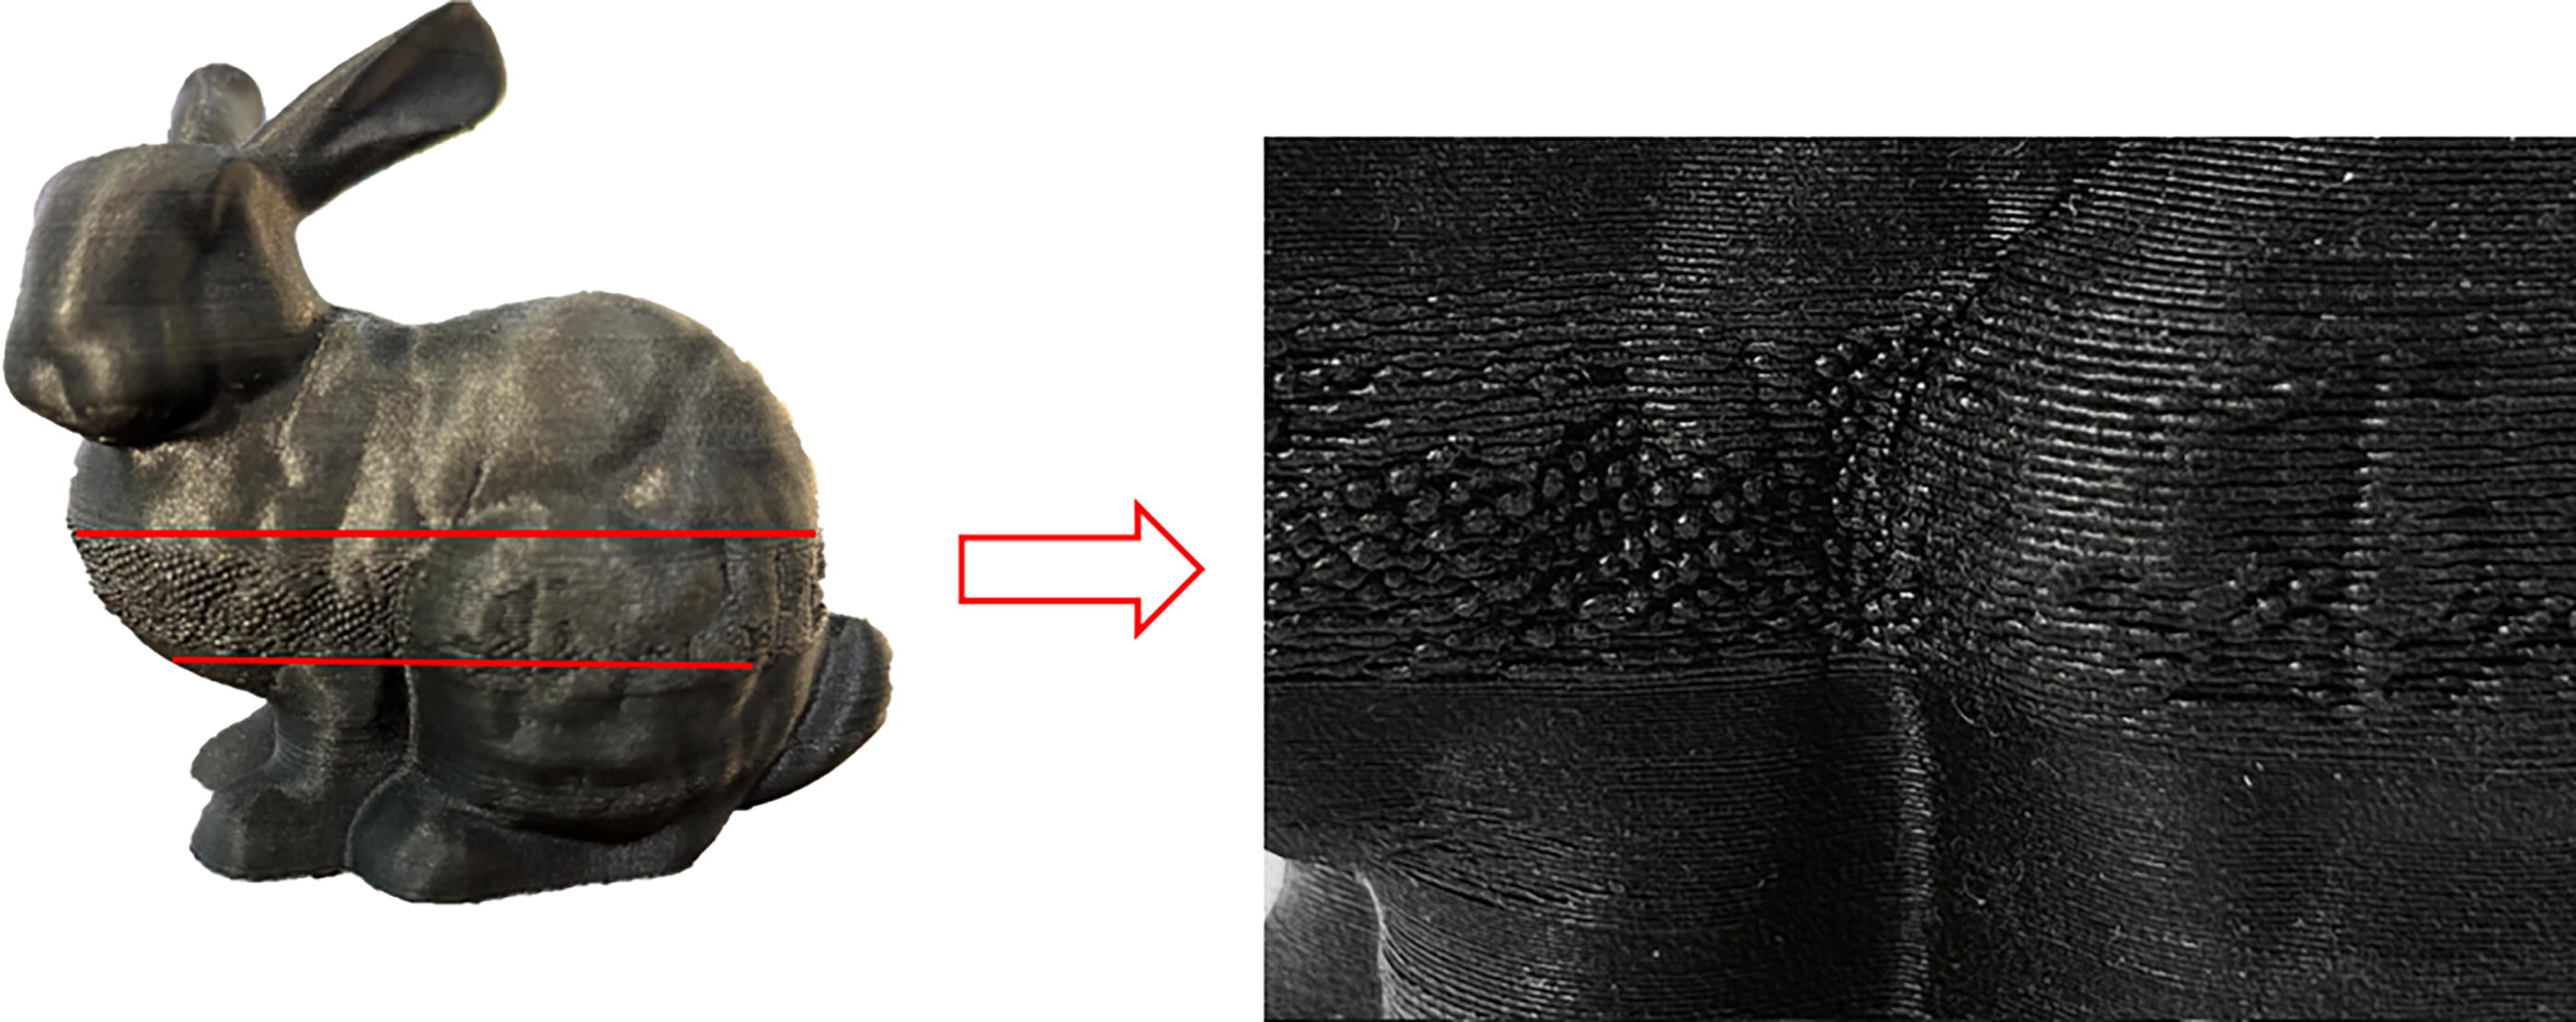
Extrusion deformation in special areas of the printed model.
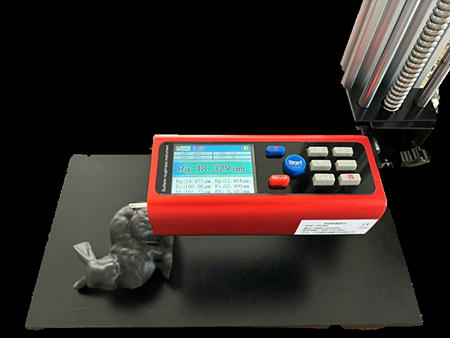
Roughness measurement results.
Fluctuation analysis between layer thickness and volumetric deviation ratio
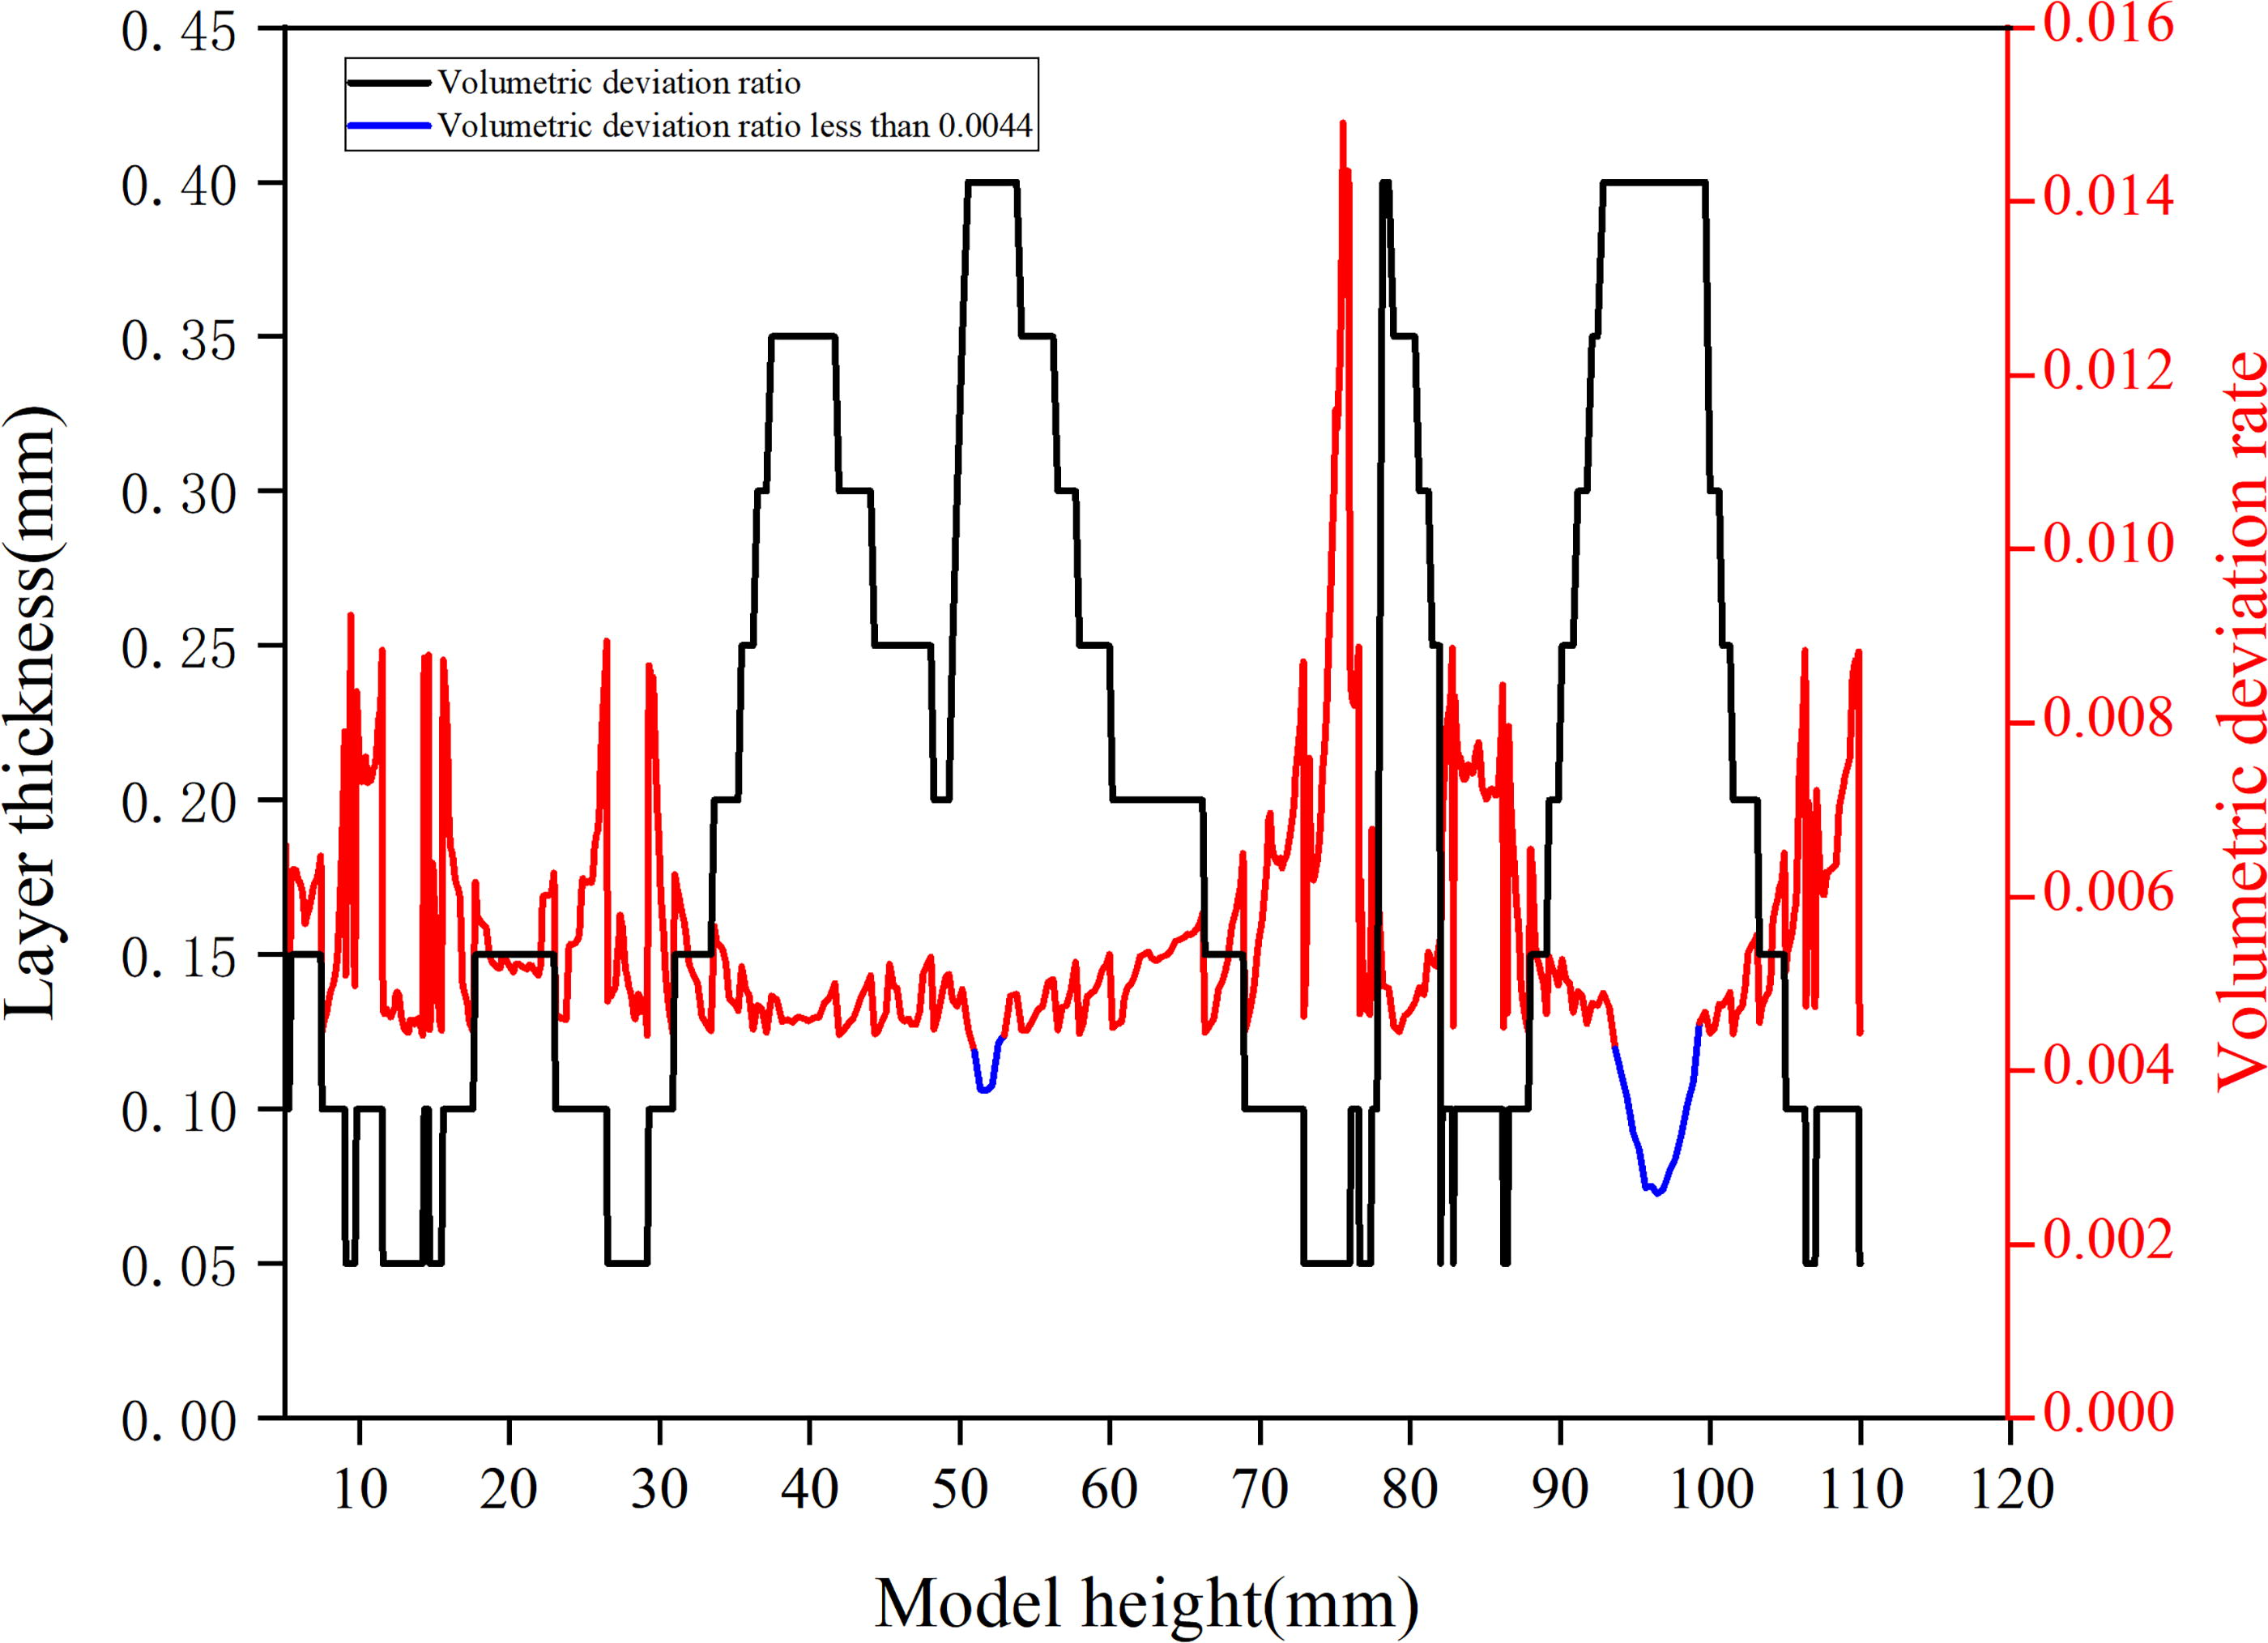
In this work, a method of controlling printing speed is introduced to avoid the above unideal printing effect. Because the layer thickness of 0.4 mm and print speed of 80 mm/s are selected continuously, it can result in incomplete cooling of the upper contour surface and remains near the melting temperature. The secondary molded contour surfaces will reheat and cause extrusion deformation when printing continuously. When the OVDR εbest = 0.042, the layering results of the printed model are shown in Table 6.
Bunny Model Adaptive Stratification Results
The OVDR stratification algorithm is analyzed by taking the height of the i-th layer as the horizontal coordinate and the volumetric deviation ratio εi as the vertical coordinate. All points are represented on the axes. The part of the model which height less than 60 mm is shown in Figure 14. The volumetric deviation ratio for each sliced layer fluctuates within a specific range. It shows that the volumetric deviation ratio for the model height of 21.55–31.15 mm is below the threshold value of 0.0042 in Figure 14. This height corresponds to the extrusion deformation of the actual print model mentioned earlier, and this height matches the maximum print layer thickness which is 0.4 mm, the number of printing layers is 27. When the ADR assigns a larger layer thickness to the target print area, it will cause the temperature to become too high. Thus, it will lead to material extrusion and deformation, and the printing accuracy impact significantly.
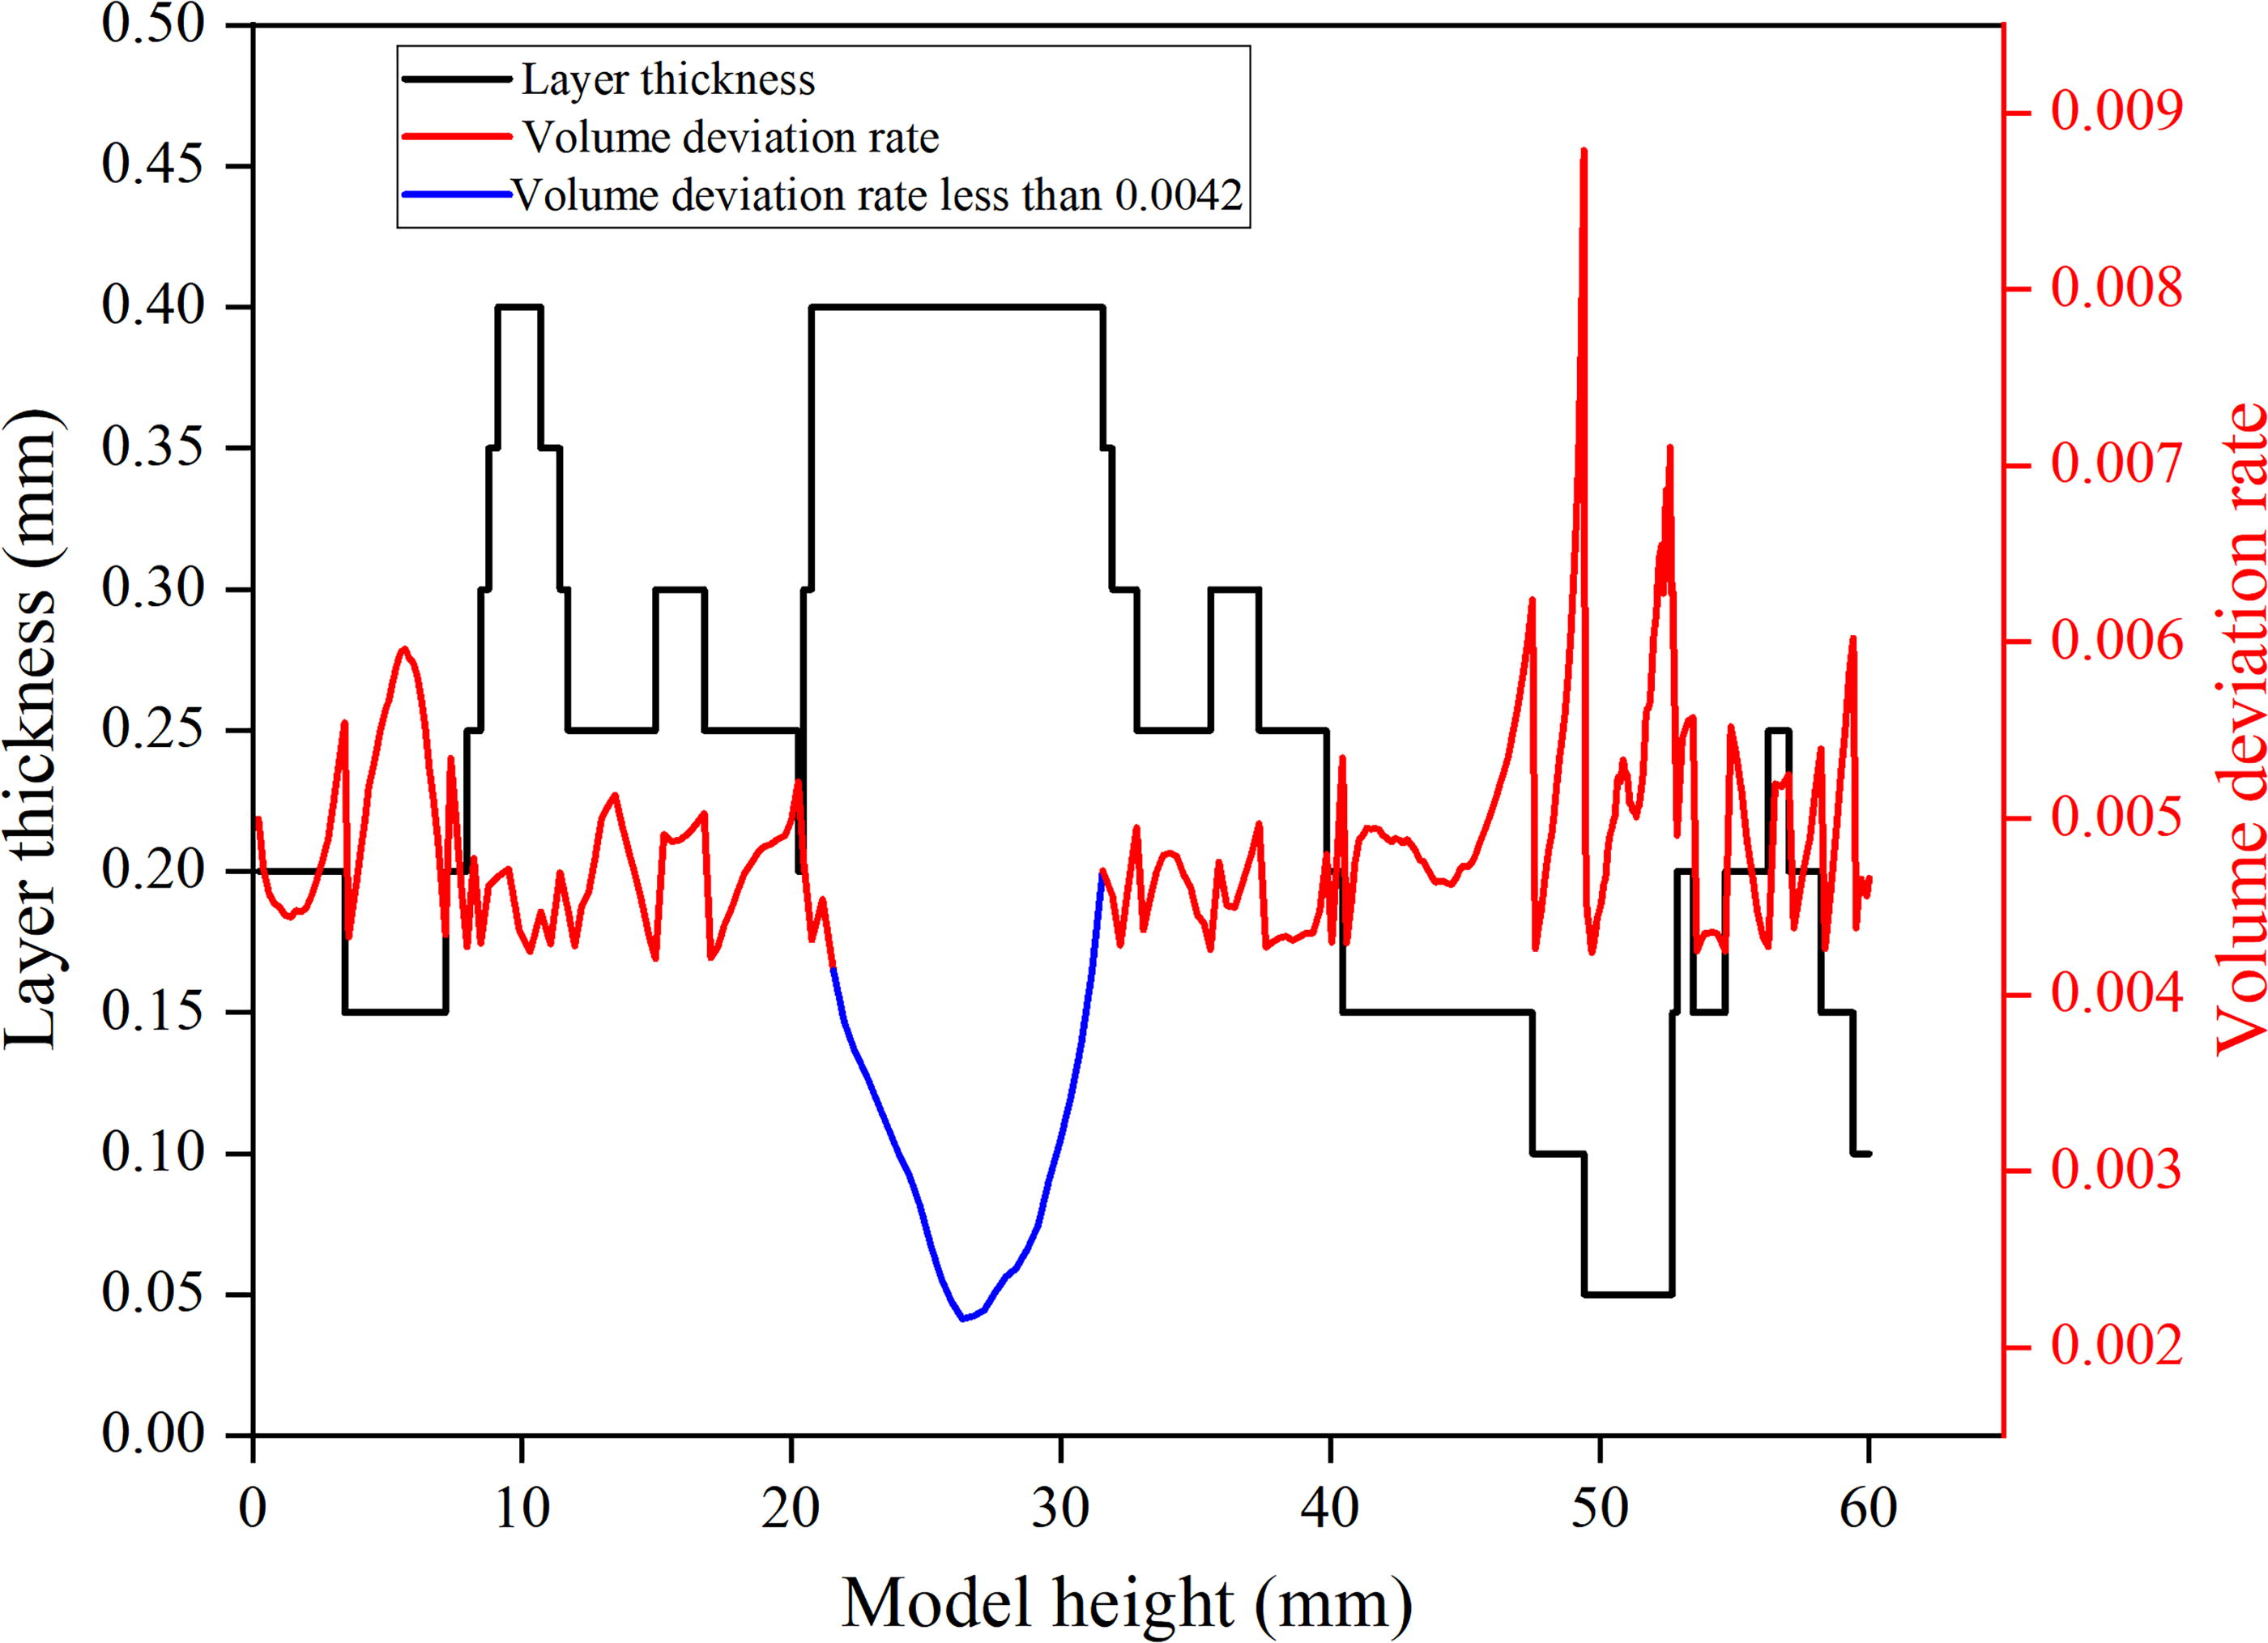
Variation of layer thickness and volumetric deviation ratio with height for model height 0–60 mm.
Thermal coupling analysis of layered models with variable number of layers
The finite element simulation of the FDM molding process is carried out to study the influence rule of printing speed and layer numbers on the temperature of the contour contact surface. It uses life-and-death unit technology to simulate the print molding process. The properties of PLA material are shown in Table 7, it can be seen that its’ value of density and thermal is constant. The thermal conductivity and coefficient of thermal expansion of PLA material are isotropic. During cooling, the material changes from a molten state (viscoelastic polymer melt) to a glassy state (solid polymer), so the enthalpy change due to this phase change is not considered.
Properties of PLA Material
PLA, polylactic acid.
The influence rule of different printing speeds on the temperature field is verified by studying the region of easy-to-extrude deformation. The deformation-prone region is divided into 32 layers for meshing and all thickness is 0.4 mm as shown in Figure 15a. These nodes corresponding to the number of layers are signed along the Z-axis direction of the model as shown in Figure 15b.
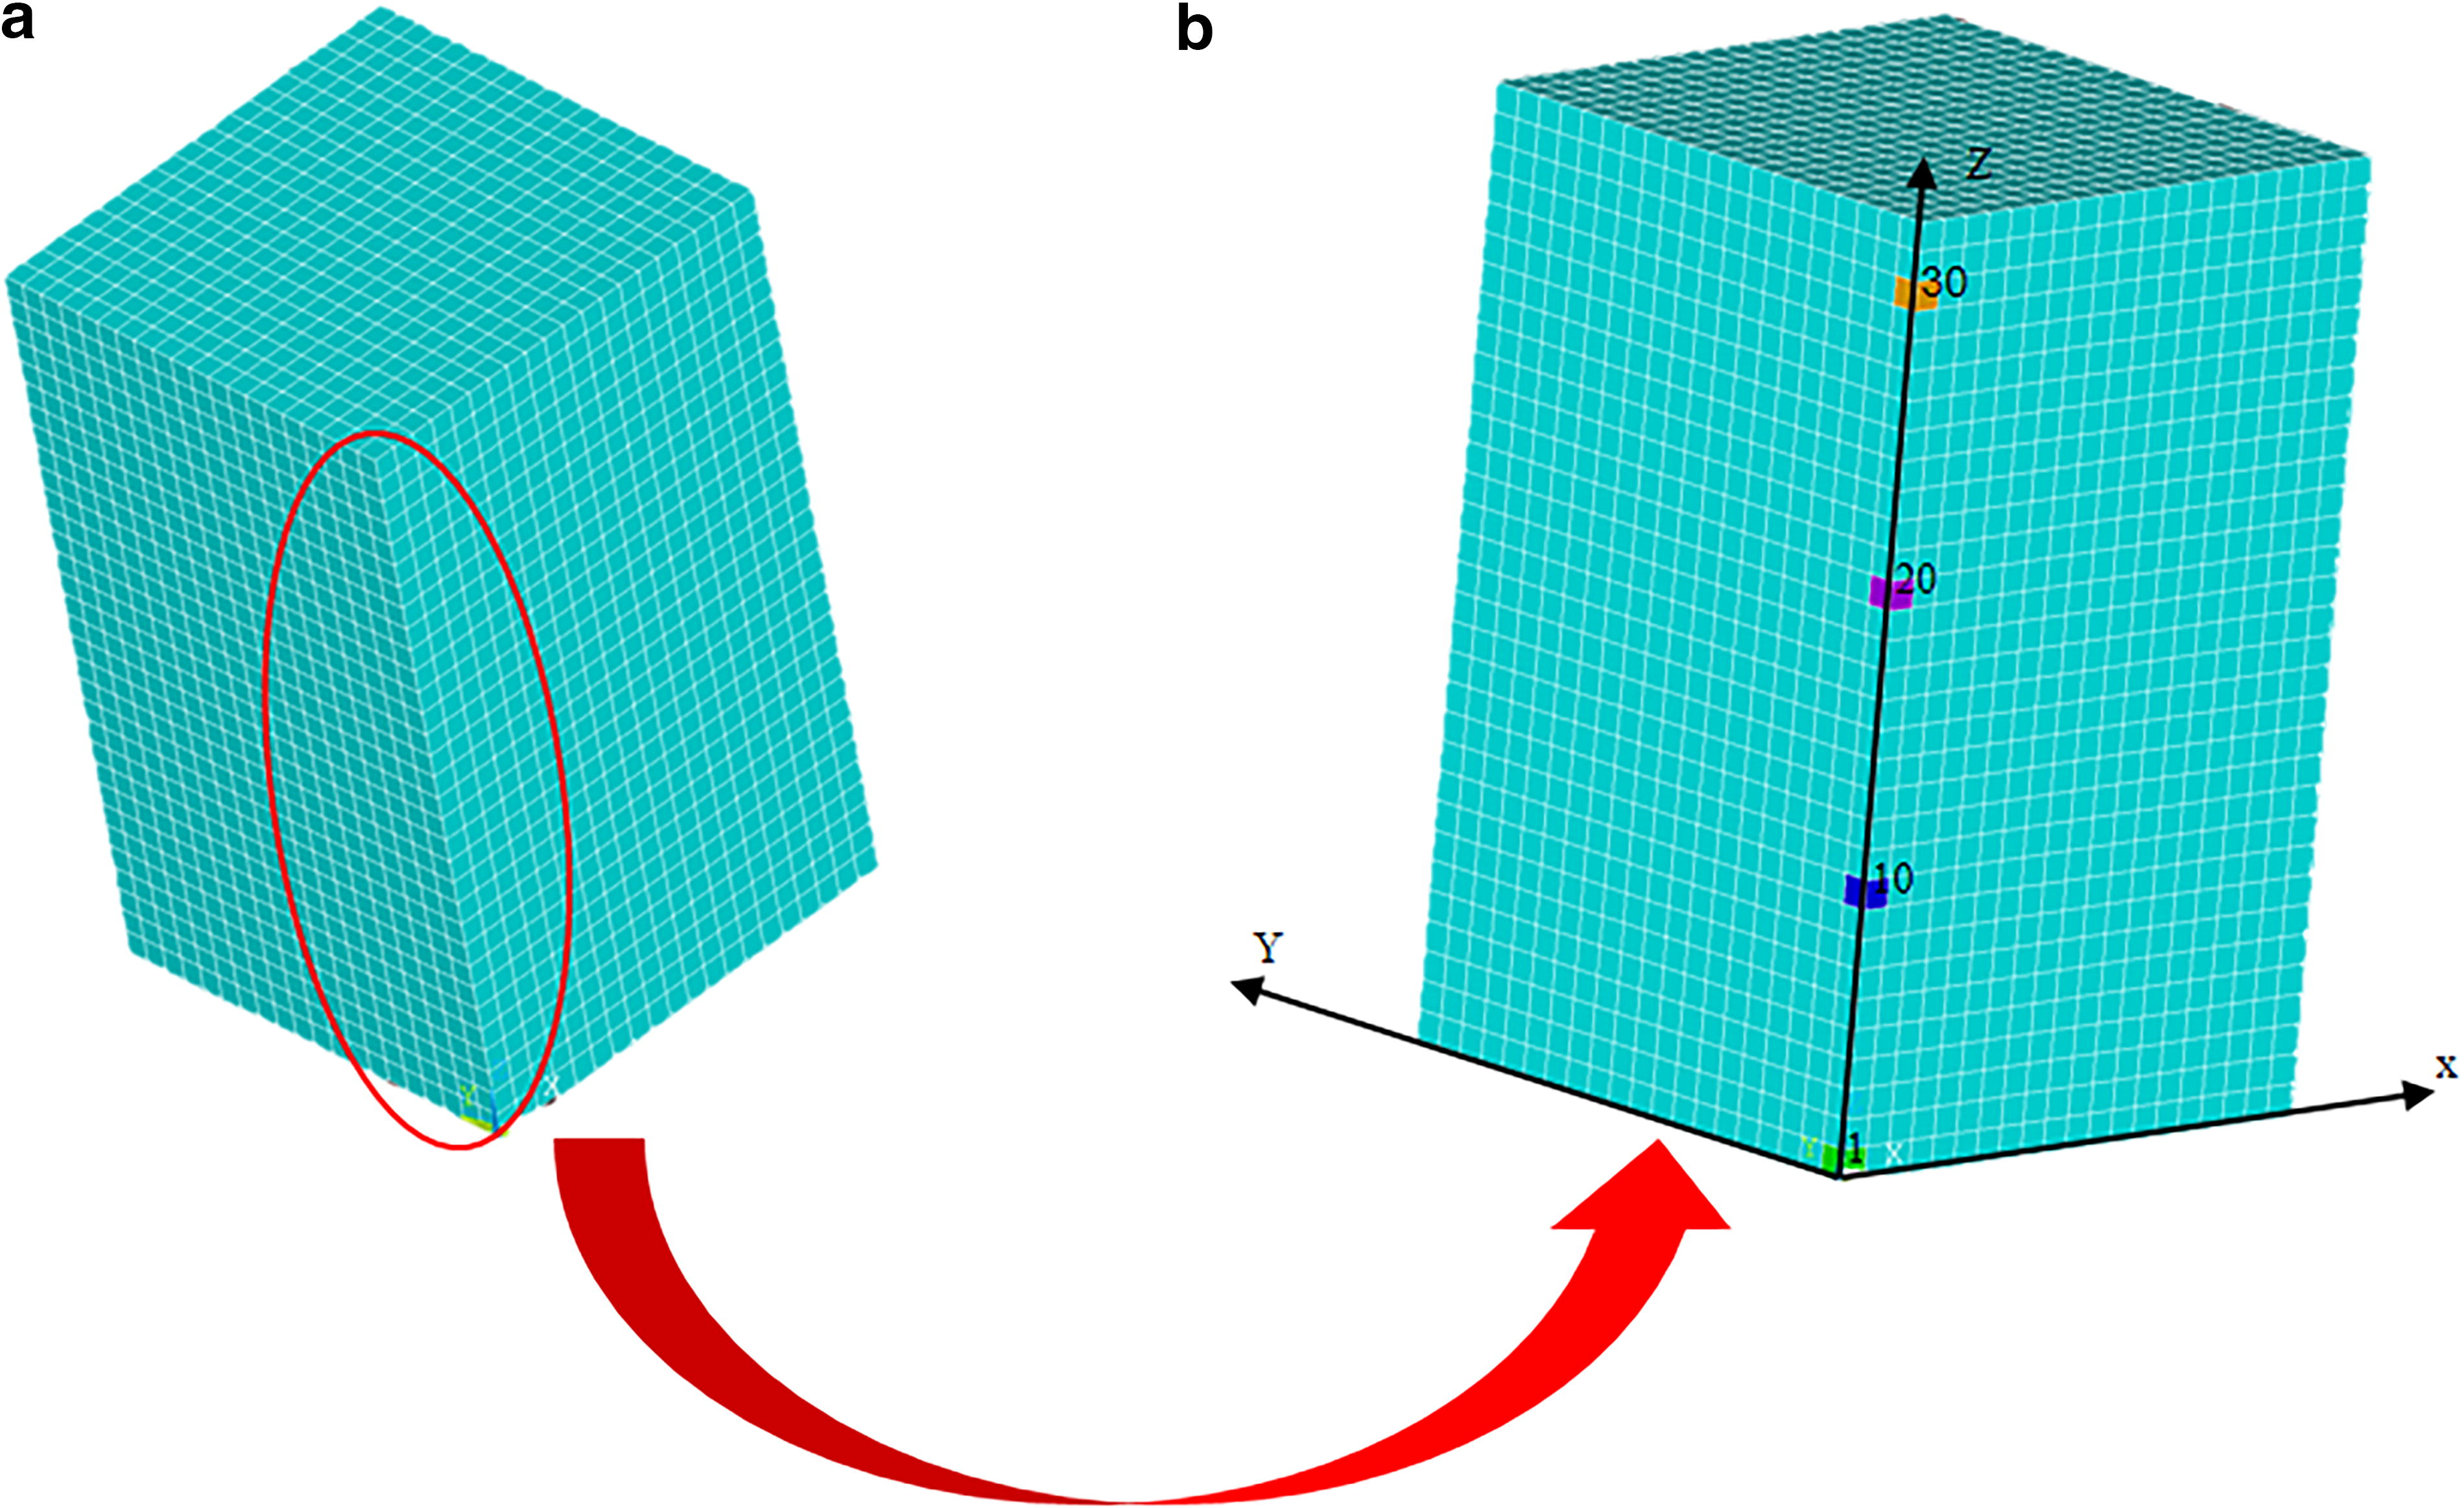
Rectangular model of layering number in deformation region.
Based on the analysis of the region below the threshold of the volumetric deviation ratio, the temperature of corresponding nodes of layers 1, 8, 10, 20, and 30 were obtained, as shown in Table 8.
Printing Speed and Layer Effect on Interlayer Temperature
The data were further analyzed by the original software to determine the influence rule of various printing speeds and the number of layers on the temperature of adjacent contour contact surfaces, as shown in Figure 16. According to the simulation, the following results can be obtained: When the printing speed is constant, the residual temperature of the contour contact surface gradually increases with the number of layers. The melting temperature of PLA material is usually between 155°C and 180°C. 29 When printing more than eight layers of 0.4 mm layer thickness in a row, the temperature at the node of the molded surface is close to 155°C. The area is still in the molten state when the upper contour is covered. When the molded area will creep under the weight of consumables on the upper surface, it will result in extrusion. So, the optimum cooling temperature should be in the range below 155°C, and it can improve print quality. When the layer thickness is 0.4 mm and the printing speed is 70 mm/s, the node temperature of the 20th layer is 146.31°C and the node temperature of the 30th layer is 148.52°C, as shown in Table 8. The maximum temperature of the nodes does not exceed the melting temperature range of PLA material. This indicates that it is necessary to control the printing speed in the model area where the volumetric deviation ratio is smaller than the OVDR. Thus, the heat dissipation efficiency and print quality can be improved.
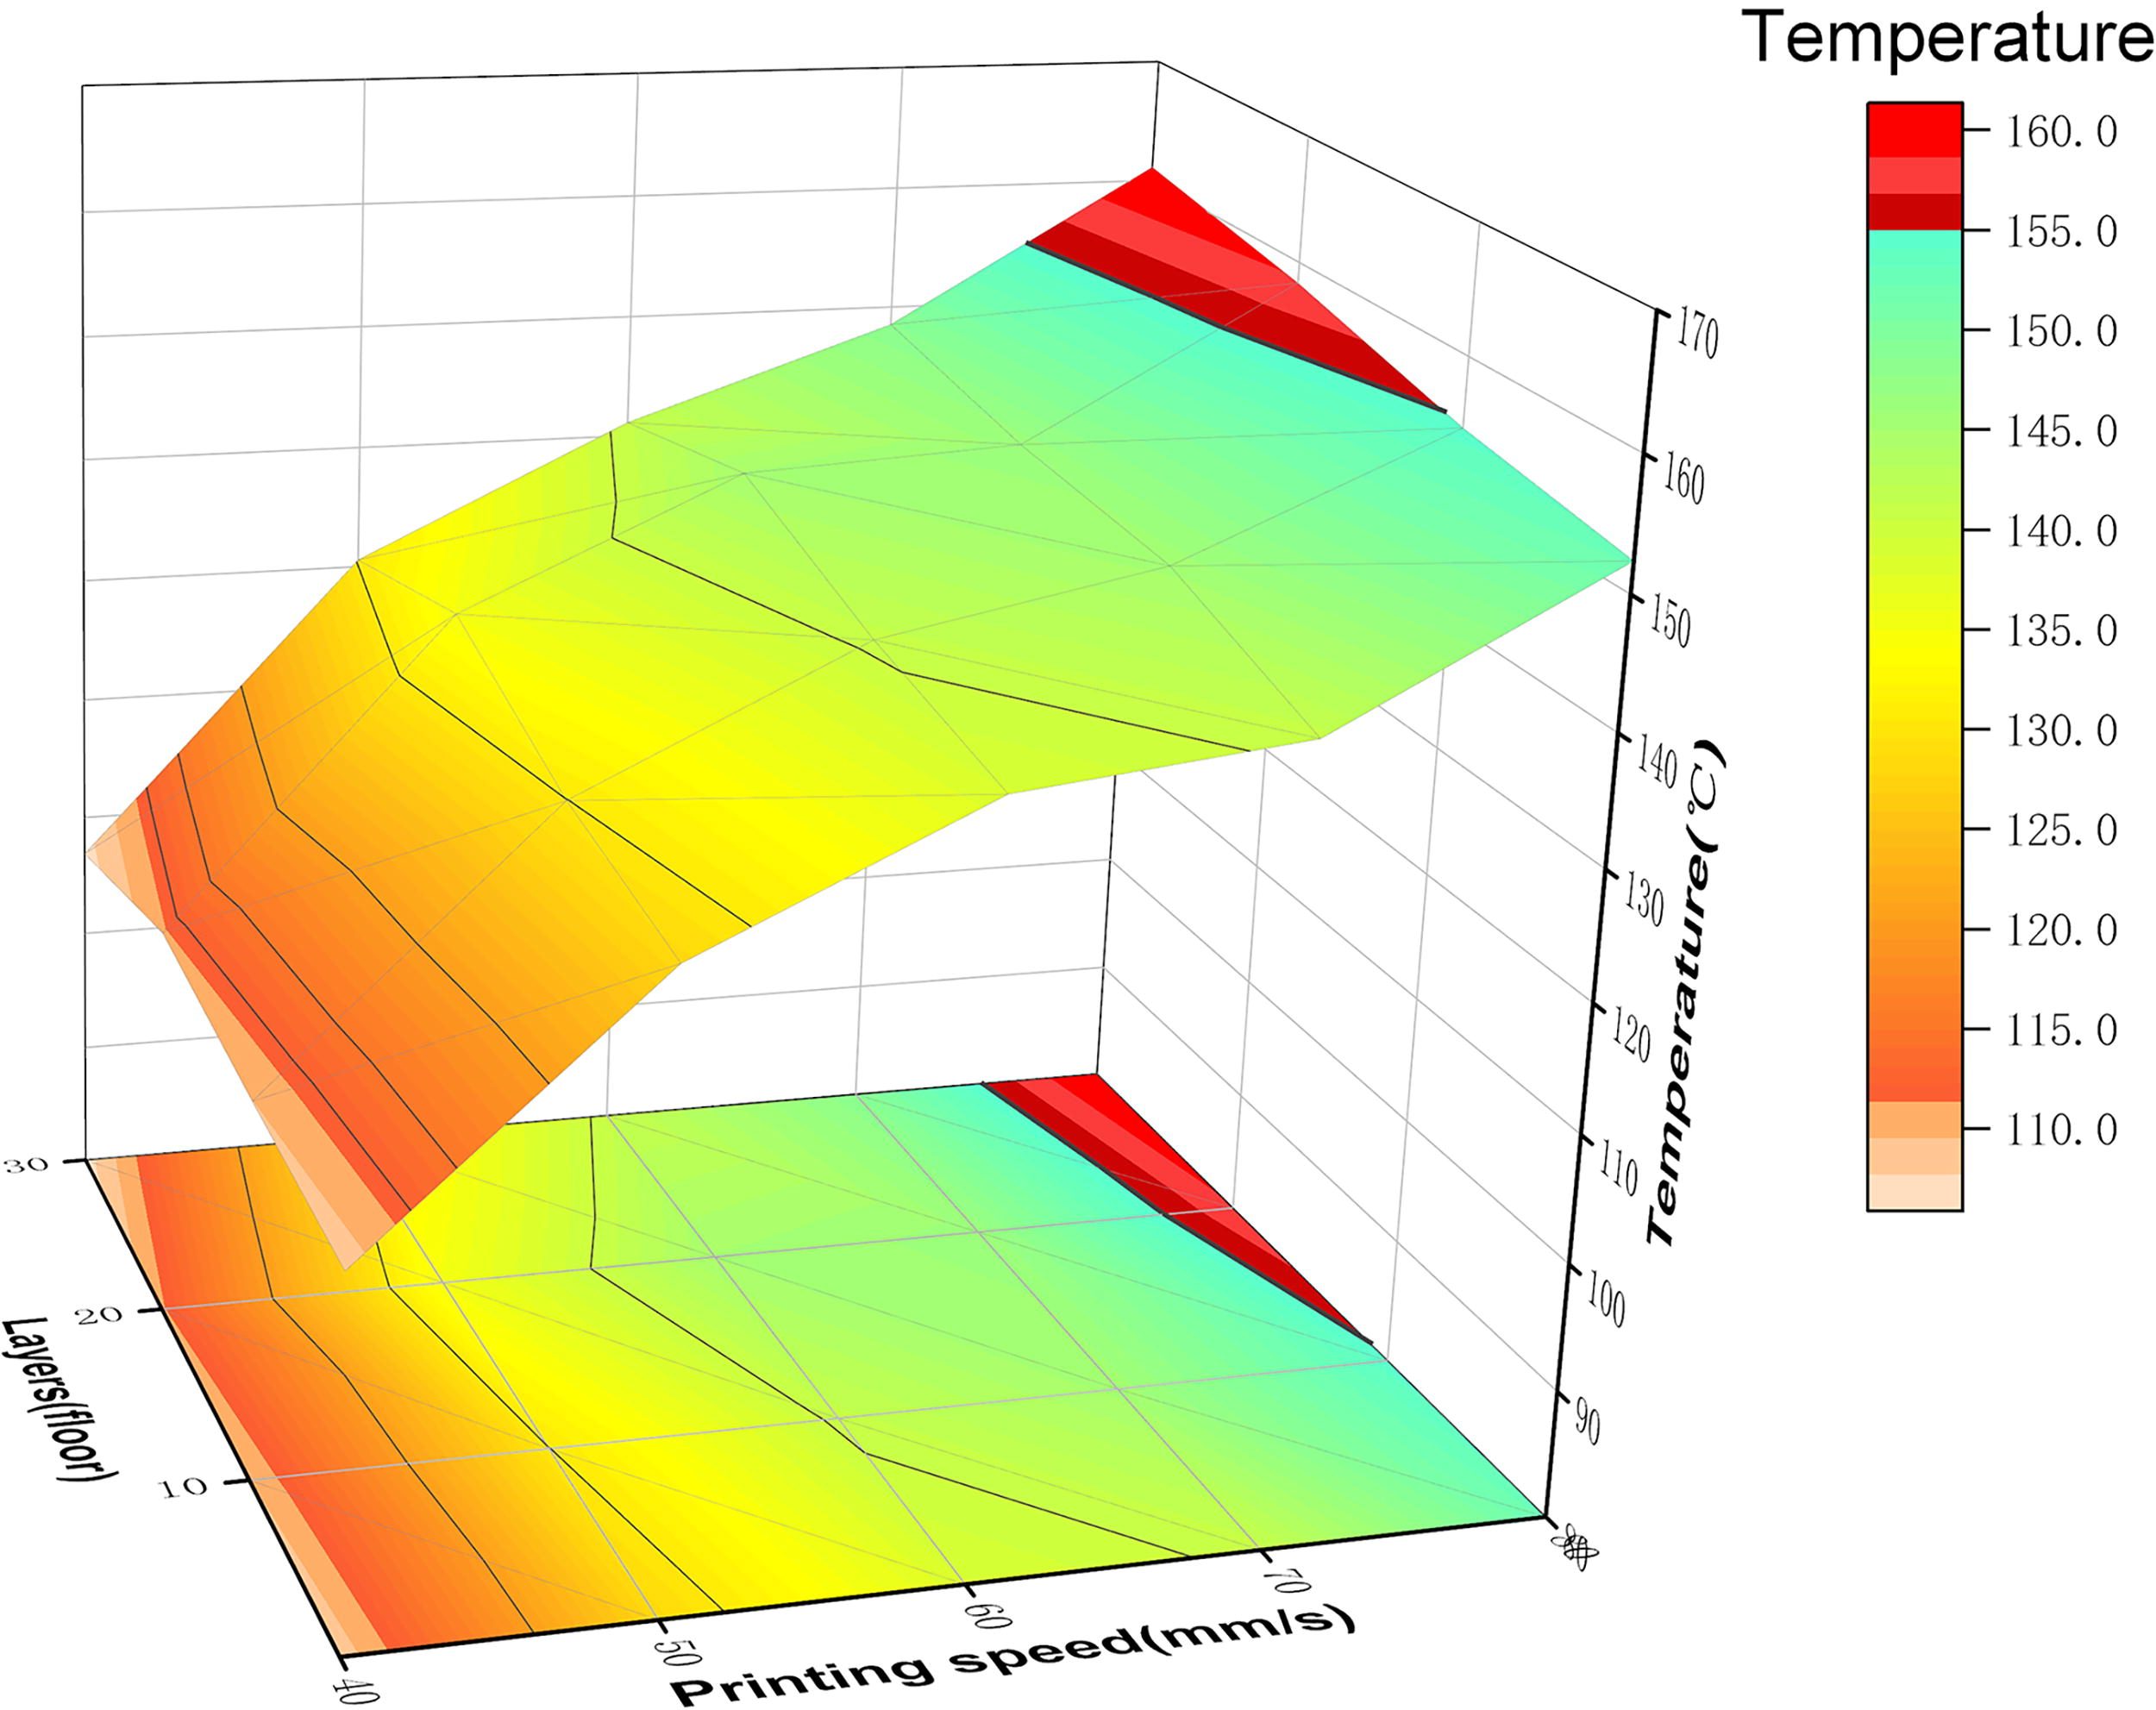
Nodal temperature surface of the deformation region.
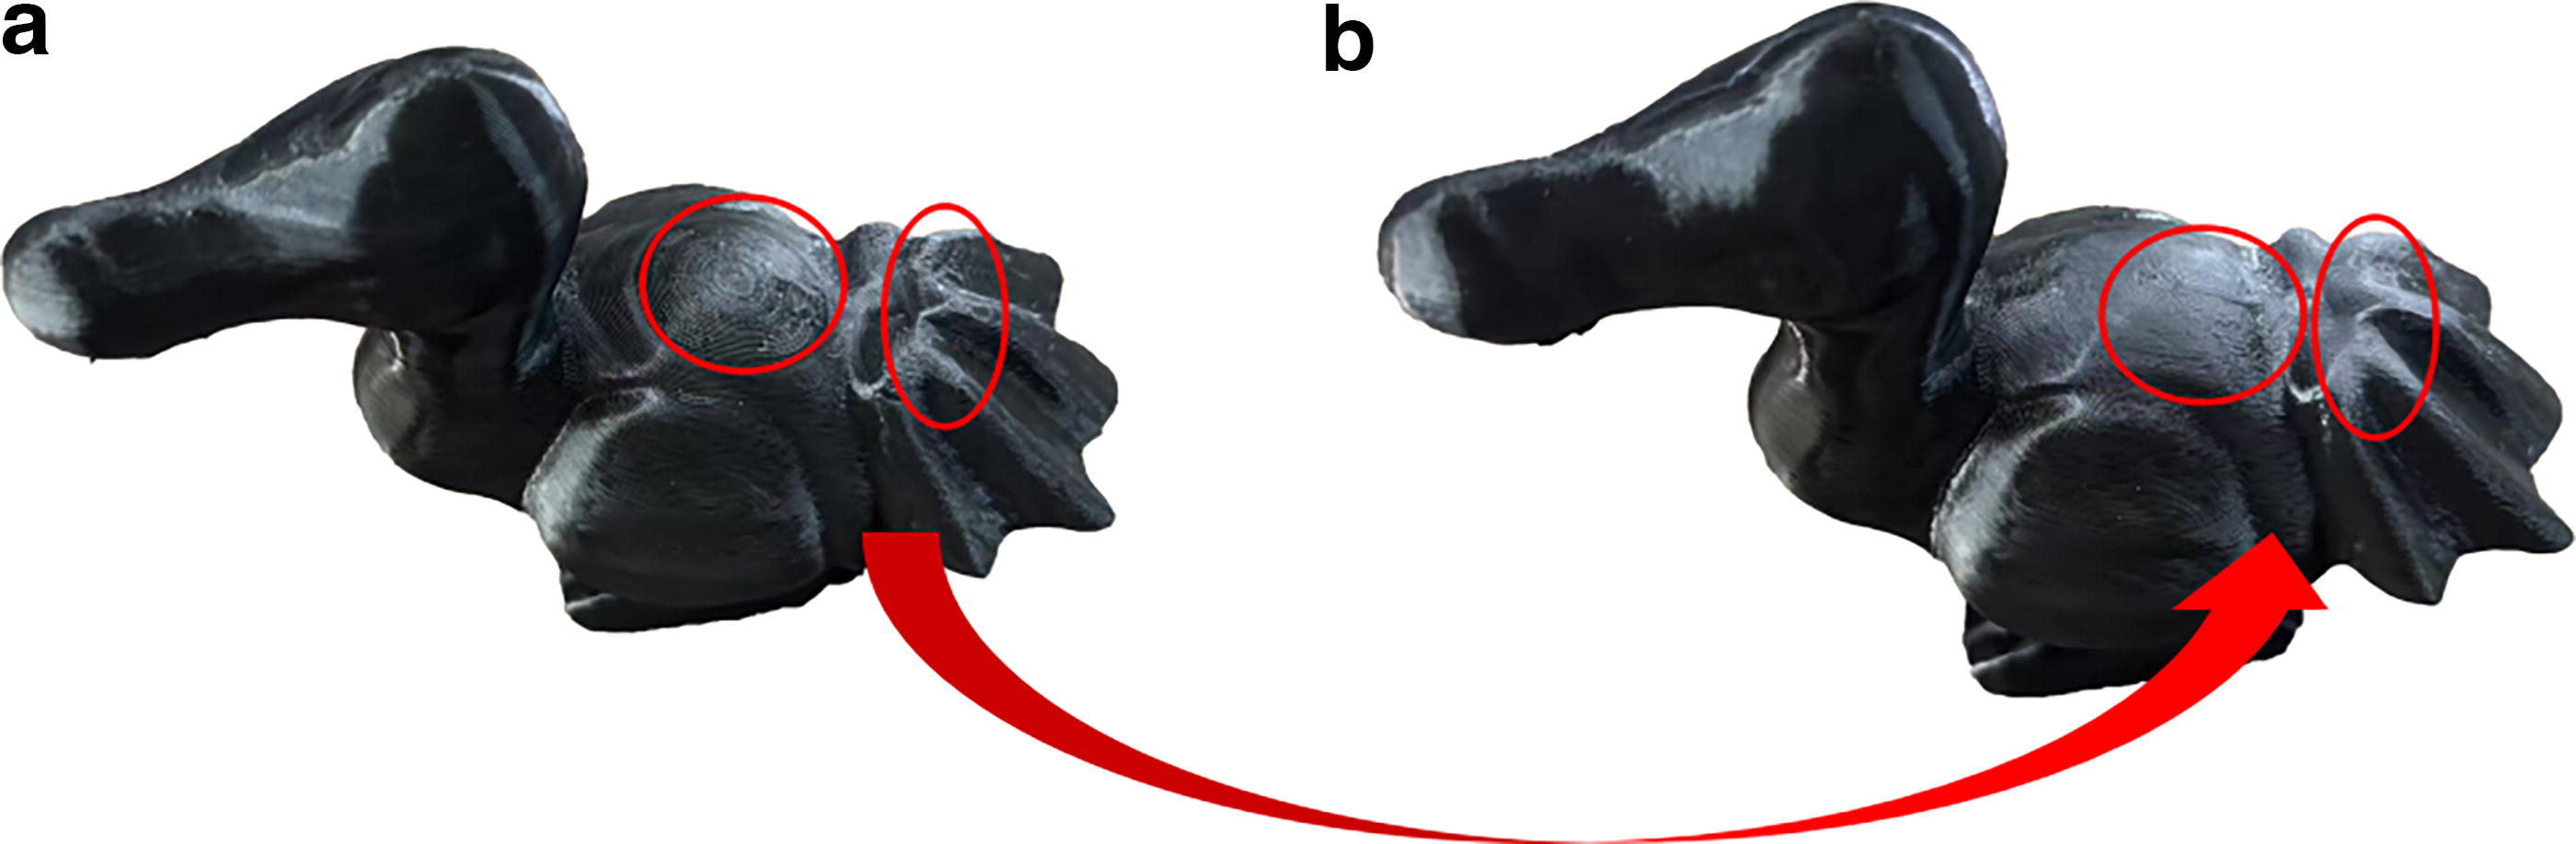
The analysis of the simulation data indicates that the optimal printing speed for layers 1 − 8 is 80 mm/s, while for layers 9 − 27, it should be 70 mm/s. The extrusion deformation region is illustrated in Figure 12, which reprint result is presented in Figure 17 and the are roughness is 9.625 µm as shown in Figure 18.
Printing results in same special areas of the printed model.
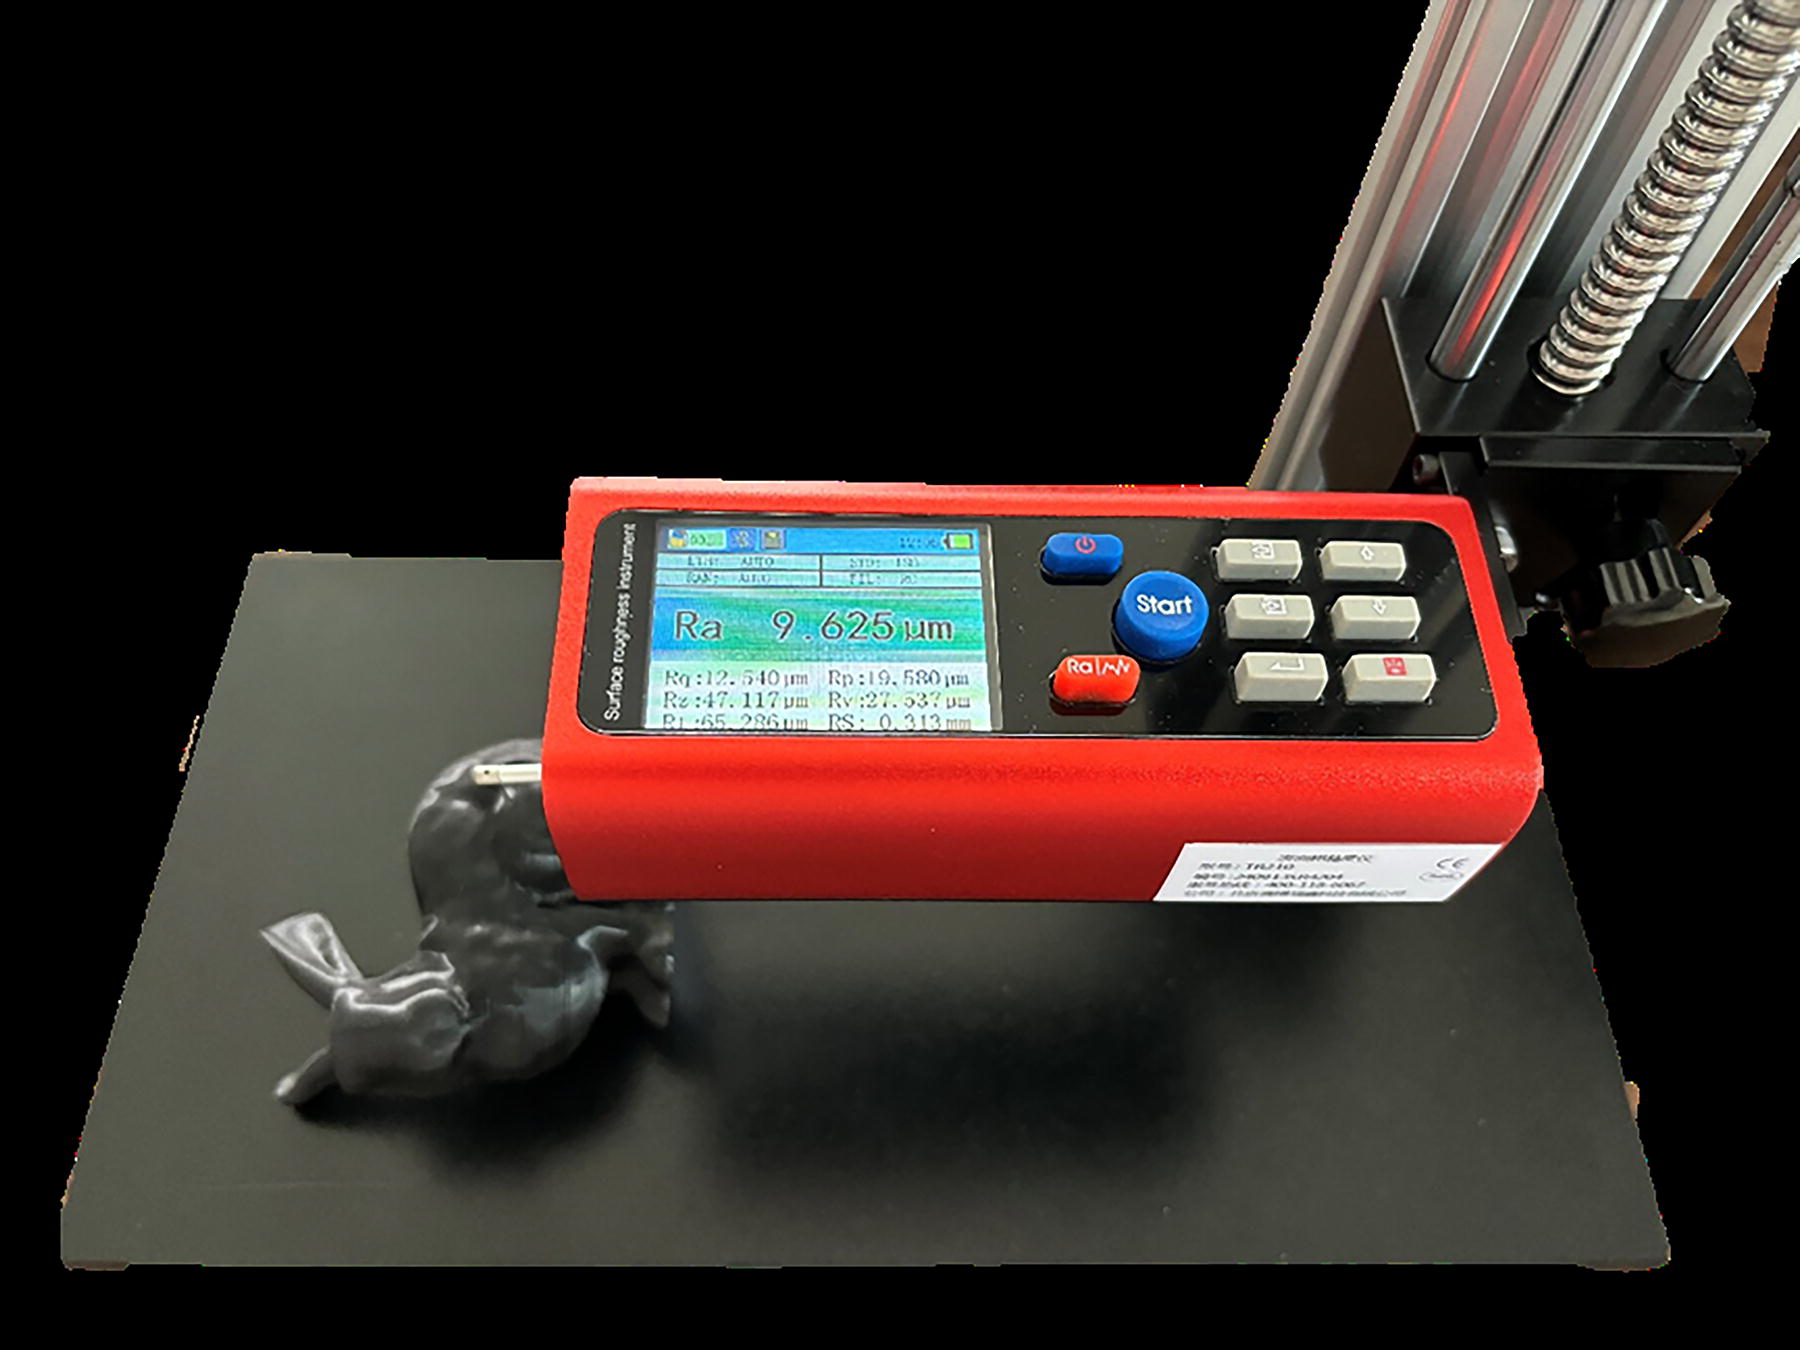
Roughness measurement results.
When the printing speed is not controlled, the molding time is 260 min, but the molding time is only 270.73 min when the printing speed is controlled. The increase in molding time does not exceed 4%. Therefore, it is verified that implementing print speed control on adaptive layered models can enhance print quality while ensuring molding efficiency.
Thermal coupling analysis of layered models with variable volumetric deviation ratio
Based on the investigation of volumetric deviation ratio and interlayer temperature, this article validates the influence of different printing speeds on the temperature field distribution of the model. The prismatic models with varying volumetric deviation ratio values can be constructed by equations (1) and (10), as illustrated in Figure 19a. The models are discretized into five uniformly thick layers of 0.4 mm each through meshing operations as Figure 19. Along the Z-axis direction, nodal layers corresponding to different volumetric deviation ratio values of ε from 0.003 to 0.008 were selectively analyzed, as shown in Figure 19b.
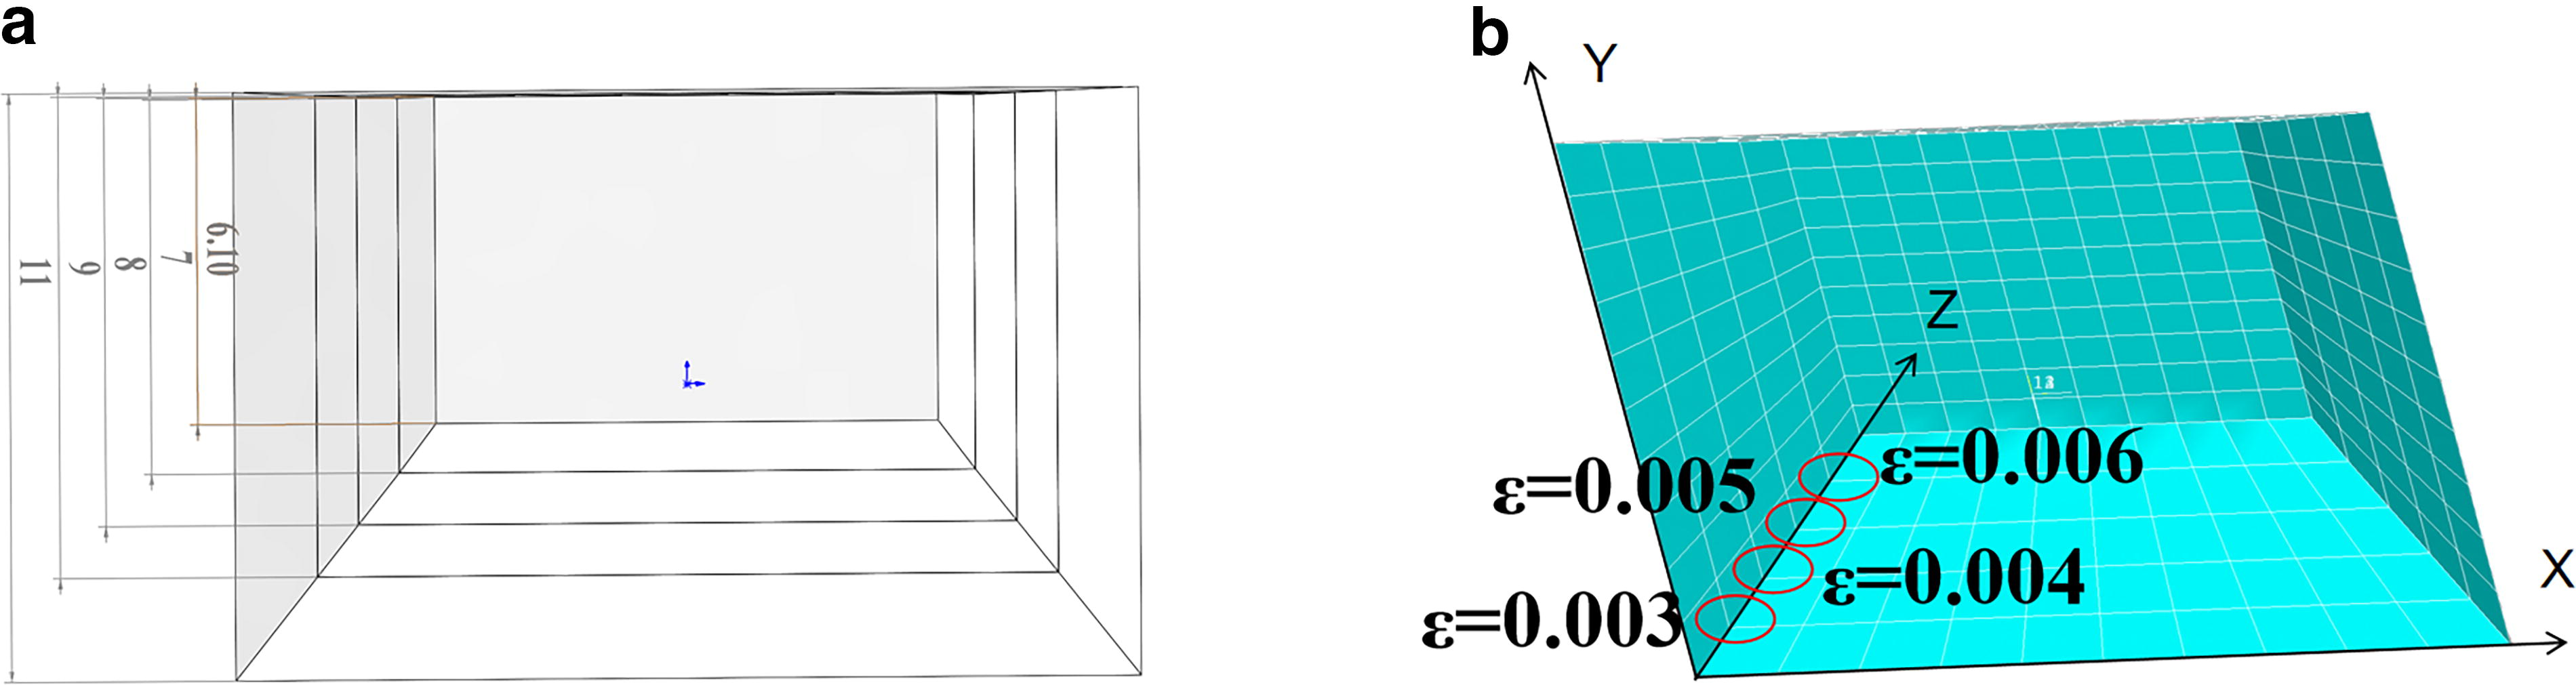
Prismatic model of the volumetric deviation ratio between layers.
By analyzing the influence of varying volumetric deviation ratios on interlayer temperature, the temperature values at different corresponding nodal points along the Z-axis can be obtained for layers from 1 to 4 detailed in Table 9.
Printing Speed and Volumetric Deviation Ratio Effect on Interlayer Temperature
The simulation results demonstrate that the temperature at the contour interface will decrease with increasing volumetric deviation ratio progressively under constant printing speed. The interlayer contour temperature will approach 155°C when the volumetric deviation ratio reaches 0.004 at the printing speed of 80 mm/s, and it indicates that the formed region remains in a molten state. If the printing speed remains at 80 mm/s, it will be deformation ultimately because of the induce material creep due to extrusion pressure from subsequent layers. To optimize dimensional accuracy, the optimal temperature range for printed layers should maintain contour interface temperatures below 155°C. In Table 9, when the OVDR approximates 0.0042, the recommended printing speed is 70 mm/s, because the interlayer contour temperature generated at this speed is 128.57°C which is below the melting temperature range of PLA material. These results show complete consistency with the thermal coupling analysis results for layered models with variable layer numbers presented in Section “Thermal coupling analysis of layered models with variable number of layers”.
Dodo model analysis and validation
In order to eliminate selection bias in model choice, this article incorporates the dodo model to demonstrate the effectiveness of the proposed method. Dodo model exhibits significant interlayer deviations as an additional test case. The original STL file of the dodo model is presented in Figure 20.
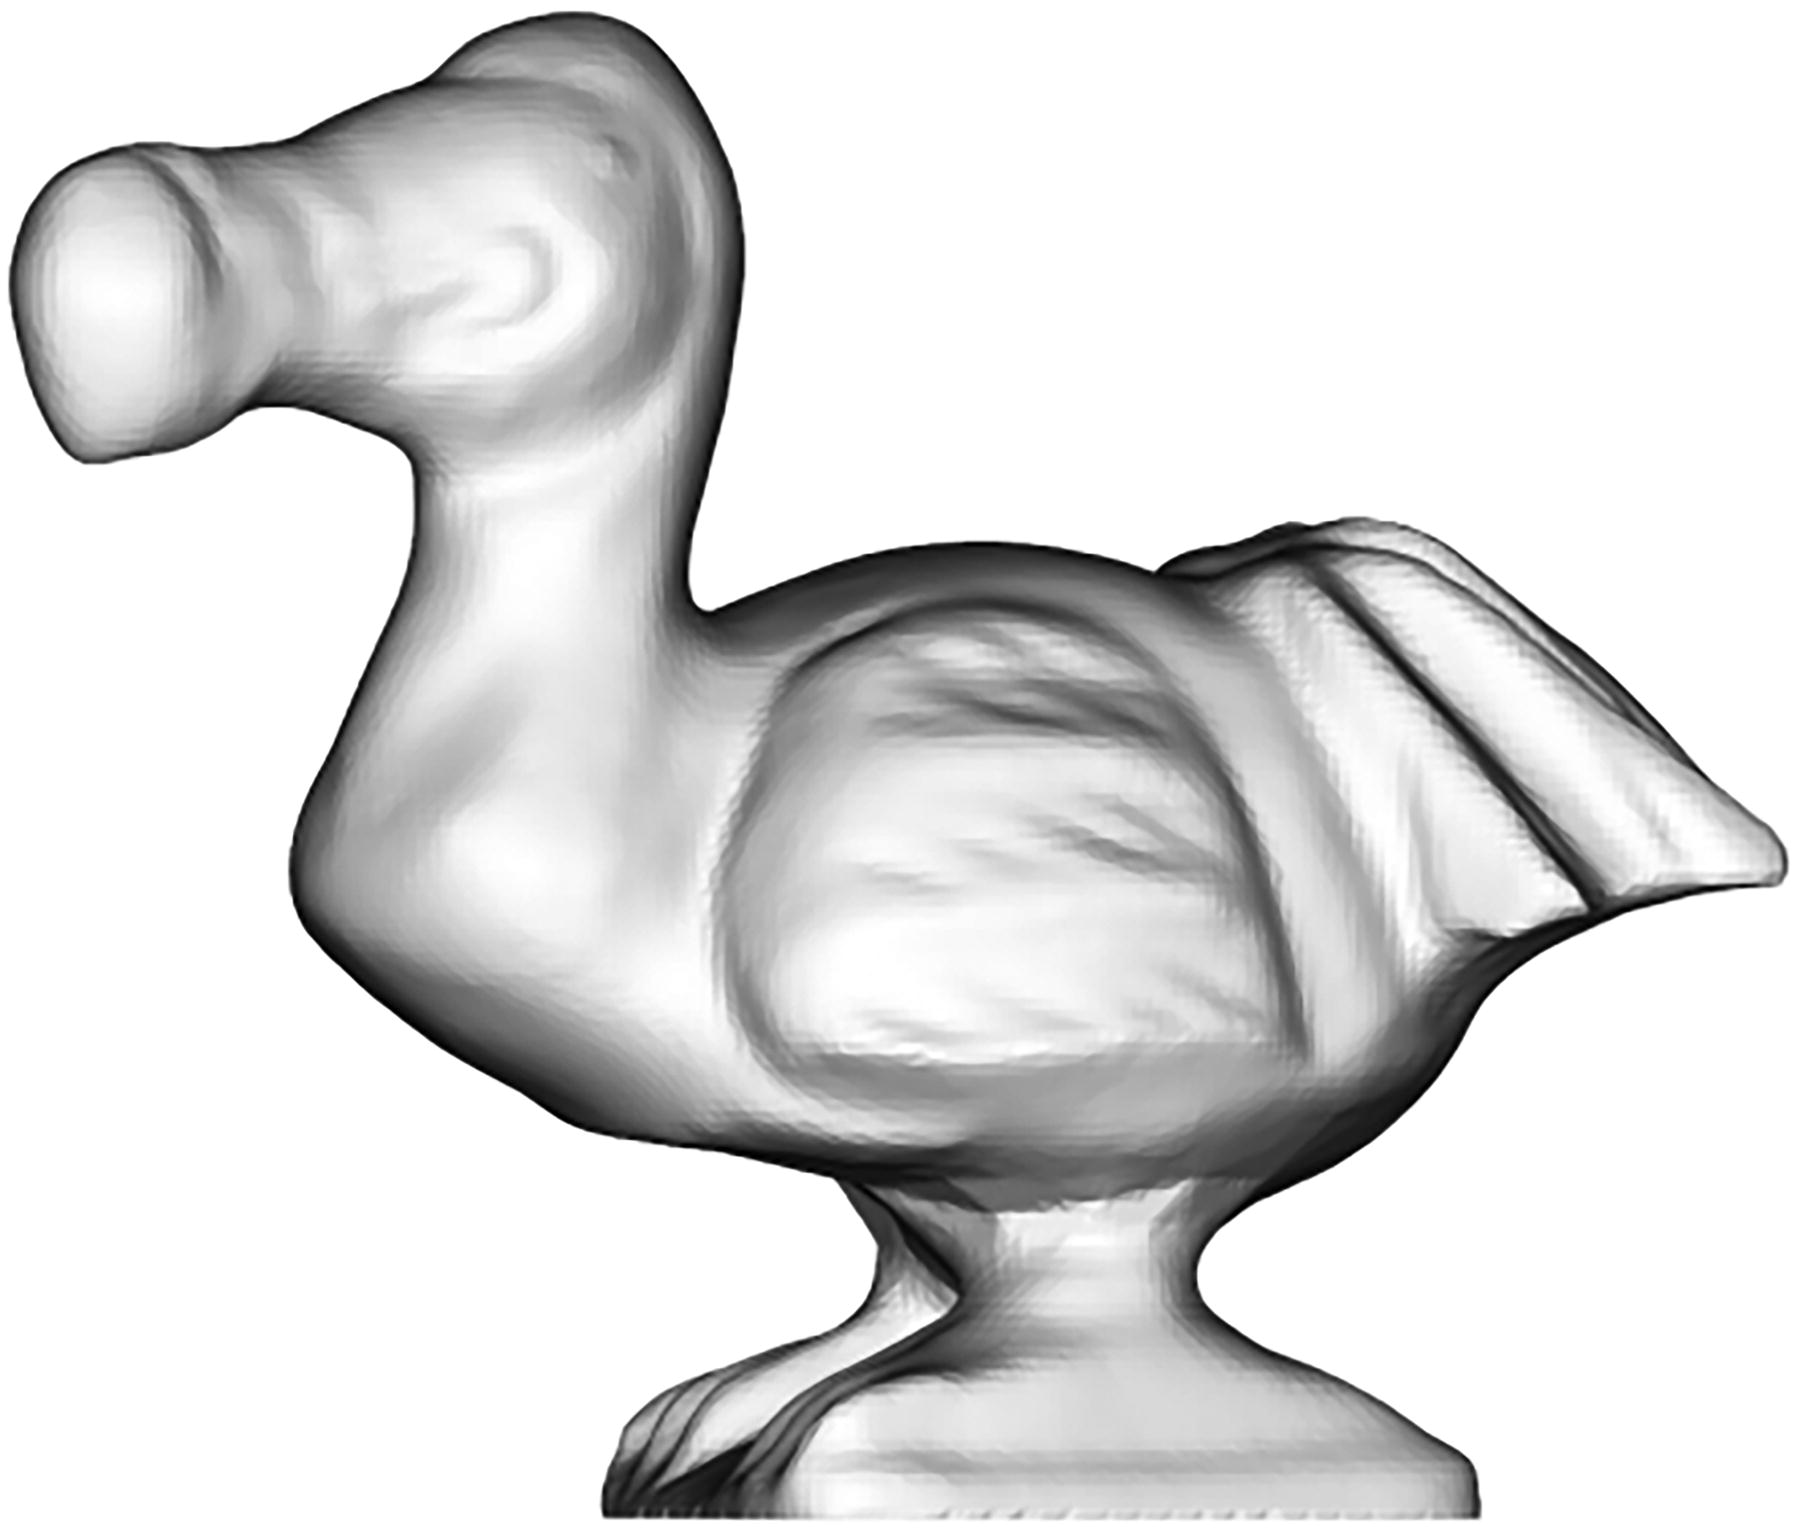
Dodo model.
According to the theoretical framework established in Section “Theoretical model construction of the optimal volumetric deviation ratio”, the dodo model can be layered adaptively with appropriate layer thickness variation Δd (0.005) and volumetric deviation ratio
Parameter Value of Dodo Model at Each Value of ε
For dodo model, the optimum volume deviation ratio
Optimal ε prediction results for dodo model with Weighted Polynomial Regression Optimization Algorithm (WPROA).
Model adaptive layered display.
The OVDR stratification algorithm is analyzed by taking the height of the i-th layer as the horizontal coordinate and the volumetric deviation ratio ε i as the vertical coordinate. All points are represented on the axes. The part of the model which height less than 110 mm is shown in Figure 23. The volumetric deviation ratio for each sliced layer fluctuates within a specific range. It shows that the volumetric deviation ratio for the model height of 90 to 100 mm is below the threshold value of 0.0044. This height corresponds to the significant trapezoidal effects of the actual print model. When the ADR assigns a larger printing speed to the target print area, it will impact the printing accuracy.
Variation of layer thickness and volumetric deviation ratio.
For dodo model, the optimal printing speed is 70 mm/s in the height of 90 − 100 mm, 80 mm/s for others by analyzing the simulation data. The printing results of the global constant 80 mm/s are shown in Figure 24a, it has significant trapezoidal effects region. Reprint result is presented in Figure 24b that the printing speed is 70 mm/s at the height of 90–100 mm.
Printing results of dodo model in the same special areas.
Conclusions
This article proposed a new ADR based on the OVDR. It addresses the issue of unreasonable layer thickness settings and long printing time for complex models with significant differences in interlayer area. The OVDR (ε) obtained through Euclidean shortest-distance and machine learning validation achieves balanced optimization between printing time (Tprt) and overall volumetric deviation (Vdev). For bunny model, the overall volumetric deviation of the model of this article’s algorithm is reduced by 15.46% when it is the same as ADR algorithm’s print time. When it is the same as VE algorithm’s overall volumetric deviation, the print time prediction of this article’s algorithm is reduced by 13.96%. The molding accuracy and printing efficiency under the same constraints have been improved.
At the same time, combined with the actual printing, by data analysis, some areas of the model which volumetric deviation ratio is less than the OVDR would generate extrusion deformation when the printing speed is large. Under constant printing velocity conditions, the interlayer temperature demonstrates an inverse correlation with volumetric deviation magnitude, exhibiting measurable decreases as interlayer volumetric deviations increase. Also, when the number of layers is constant, the residual temperature of the contour contact surface gradually increases with the printing speed. Based on these conclusions, for the bunny model mentioned above, the appropriate printing speed for layers 1–8 was 80 mm/s and layers 9–27 was 70 mm/s when printing the areas which volumetric deviation ratio is less than the OVDR of the model. The finite actual printing effect verified that controlling the printing speed in this area is essential for improving print quality, because the roughness can be reduced by 47.5%.
Footnotes
Author’s Contributions
F.Z. contributed to the article conception and design. Material preparation, data collection and analysis were performed by Z.R. and B.W. All the authors approved the final article.
Author Disclosure Statement
The authors declare that there are no competing interests.
Funding Information
This work has been partially funded by the National Science Foundation of China (Grant No. 52475578).