
Abstract
Dental biofilms are complex medical biofilms that cause caries, the most prevalent disease of humankind. They are typically collected using handcrafted intraoral devices with mounted carriers for biofilm growth. As the geometry of handcrafted devices is not standardized, the shear forces acting on the biofilms and the access to salivary nutrients differ between carriers. The resulting variability in biofilm growth renders the comparison of different treatment modalities difficult. The aim of the present work was to design and validate an additively manufactured intraoral device with a dental bar produced by direct metal laser sintering and vat photopolymerized inserts with standardized geometry for the mounting of biofilm carriers. Additive manufacturing reduced the production time and cost, guaranteed an accurate fit of the devices and facilitated the handling of carriers without disturbing the biofilm. Biofilm growth was robust, with increasing thickness over time and moderate inter- and intraindividual variation (coefficients of variance 0.48–0.87). The biofilms showed the typical architecture and composition of dental biofilms, as evidenced by confocal microscopy and 16S rRNA gene sequencing. Deeper inserts offering increased protection from shear tended to increase the biofilm thickness, whereas prolonged exposure to sucrose during growth increased the biofilm volume but not the thickness. Ratiometric pH imaging revealed considerable pH variation between participants and also inside single biofilms. Intraoral devices for biofilm collection constitute a new application for medical additive manufacturing and offer the best possible basis for studying the influence of different treatment modalities on biofilm growth, composition, and virulence. The Clinical Trial Registration number is: 1-10-72-193-20.
Introduction
Dental biofilm is a classic example of a complex medical biofilm. It not only forms on all hard surfaces in the oral cavity, primarily on teeth, but also on restorative materials used to replace lost tooth structure. 1 The human oral cavity is characterized by an immense species richness, with more than 9000 identified microbial taxa and around 300 species that contribute to the biofilms of an individual.2,3 With dental caries and periodontitis, dental biofilm is responsible for two diseases that affect the majority of the world's population4,5 and have a serious impact on the quality of life and the global economic health care burden.6,7
Bacteria in dental biofilms produce organic acids from fermentable dietary carbohydrates and thereby lower the pH at the tooth surface. Repeated episodes of low pH then lead to the slow demineralization of the dental hard tissues and, eventually, in the formation of caries that require restorative treatment. Bacterial biofilms that accumulate close to the gums trigger an inflammatory immune response that results in swelling, bleeding, and finally in the loss of supporting bone around the tooth. 4 Both conditions, dental caries and periodontitis, may eventually result in tooth loss. Beyond their involvement in disease, bacteria in oral biofilms play a part in human body physiology through an important contribution to nitrate metabolism and blood pressure control.8,9 In contrast to other medical biofilms, dental biofilm can be collected noninvasively, and it thus represents a perfect model for studying the general mechanisms of biofilm formation, metabolism, and virulence.
The collection of dental biofilm samples with sharp instruments, such as dental probes or scalers, leads to disruption of the intricate biofilm architecture, with its highly functional polymeric matrix and a multitude of chemically distinct microenvironments.10,11 To understand the fundamental principles of biofilm behavior, as well as the effect of therapeutic agents on biofilm structure and the mechanisms of virulence, dental biofilm samples need to be collected in toto, without compromising their structural integrity.
Therefore, a variety of intraoral devices has been developed that are worn by study participants and harbor removable carriers for biofilm growth, such as glass slabs or enamel chips. 12 Just like natural dental biofilms, the biofilms on the carriers can be subjected to different growth conditions and therapeutic regimens in situ and then subjected to analyses in the laboratory. The majority of intraoral devices are handcrafted by dental technicians to perfectly fit each participant (Supplementary File S1A). Thereafter, biofilm carriers are fixed to the device, in most cases on acrylic flanges in the cheek pouch.13–17 To protect the biofilms from excessive shear stress, recessions are created, that is, by modeling wax ridges around the carriers (Supplementary File S1B).
In situ-grown biofilm samples truly reflect the complexity of dental biofilm, but they are subject to considerable inter-, and also intraindividual variation. Biofilm thickness, composition, and virulence have been shown to differ dramatically between participants equipped with the same kind of device, and even between replicate biofilm samples from the same participant.13,15,18–20 The high degree of variability renders the comparison of treatment modalities difficult, and it is uncertain whether the observed differences reflect true biological variation or just irregularities in the individual placement of the employed carriers. As the carrier positions and the recessions are created manually, different biofilm samples may be exposed to different shear forces and nutrition supplies, with marked consequences for biofilm development.21,22
Additive manufacturing offers a unique possibility to standardize the geometry of intraoral devices and thus the positioning and recession depth of biofilm carriers, but to date, it has never been used for the fabrication of in situ-devices for dental biofilm collection. The aim of the present work was to design a new intraoral device with a dental bar produced by direct metal laser sintering (DMLS) and defined inserts for biofilm carriers manufactured by vat photopolymerization. The study investigated the effect of a standardized splint geometry on the growth, composition, and virulence of in situ-grown biofilms.
Materials and Methods
Study participants
Twelve healthy volunteers (age = 25.0 years ±7.6 SD) were recruited for the study after written informed consent. The participants had no clinical signs of active caries or periodontal disease and no history of anti-inflammatory or antibiotic medication for 3 months before the study. The study protocol was reviewed and approved by the Central Jutland Regional Committee on Health Research Ethics (1-10-72-193-20) and registered in the internal database of research projects at Aarhus University.
Design and production of the in situ device
Stone models (Nova Rock Super; Dansk Ædelmetal, Farum, Denmark) made from alginate impressions (Aroma Fine Plus; Nordenta, Hørning, Denmark) of the participants’ upper and lower jaws were digitized with a medical desktop scanner (D1000; 3Shape, Copenhagen, Denmark). In a digital design software (Dental System 2019 DS 19.3.0; 3Shape), a half round dental bar (1.75 × 1.38 mm) was created for each participant that followed the lingual surfaces of all teeth in the lower jaw, rounded the most posterior teeth distally, and continued on the buccal side of the molars (Fig. 1A).
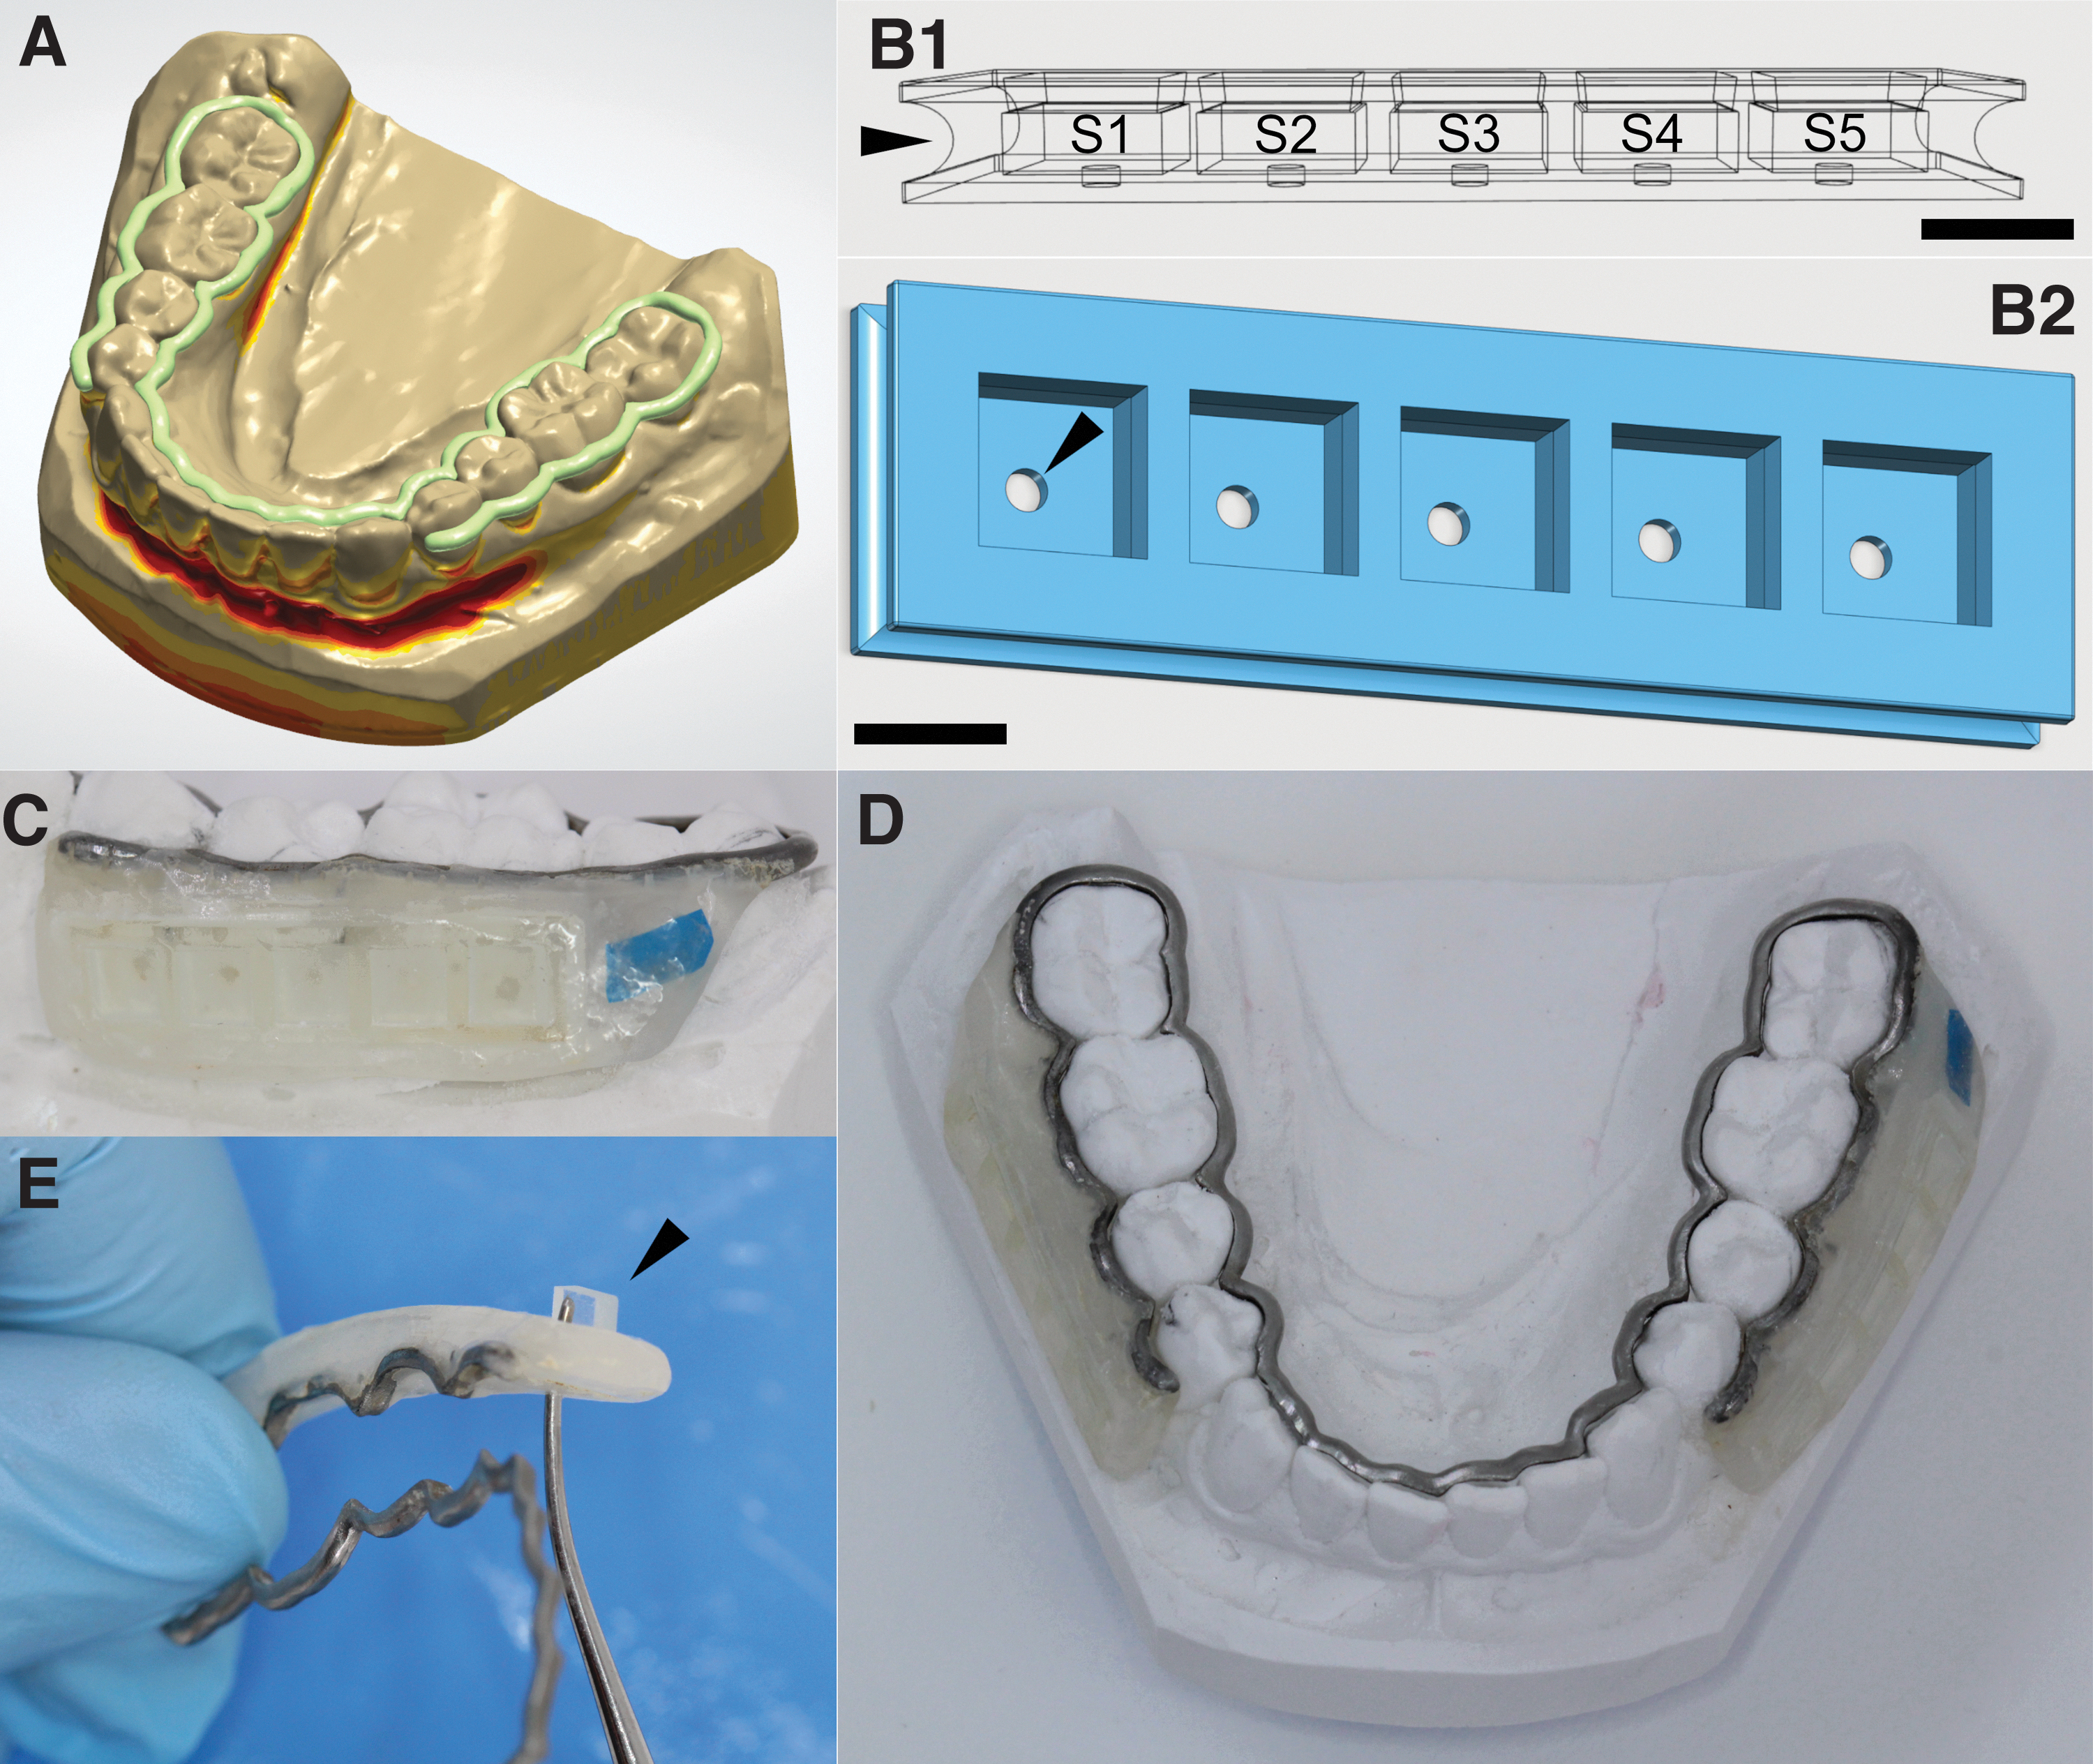
Design, production, and handling of the in situ device. Based on digitized individual stone models of each participant's lower jaw, half-round dental bars (green) were created in a digital design software
The bars were additively manufactured by DMLS of a cobalt–chrome metal–ceramic alloy (Wirobond C+) on an EOS EOSINT M 280 (Electro Optical Systems, Munich, Germany) at BEGO Medical GmbH (Bremen, Germany) and subsequently polished with polishing wheels (Profi Dent; DK Dental Depot, Farum, Denmark) and polishing paste (Buffing Bar Compound, Jelenko, CA) on the lingual side. On the buccal sides of the dental bars, 10 retention grooves (0.5 × 1 mm) were prepared with dental separating discs (9500; Komet Dental) and pieces of cobalt–chrome–molybdenum wire (0.5 × 3 mm; Wiroweld, BEGO Medical GmbH) were laser welded into the grooves (Com4laser; Dentaurum, Ispringen, Germany). The wires and the surrounding areas were sandblasted to increase retention (Al2O3; 110 μm; 3 bars; Renfert Basic Eco, Hilzingen, Germany).
Inserts with standardized geometry for the mounting of biofilm carriers were additively manufactured by vat photopolymerization (Asiga MAX UV; Alexandria, Australia) and attached to the retention areas of the dental bars using acrylic resin. The inserts were designed in the freeware 123D-Design (V2.2.14; Autodesk, San Rafael, CA) (Fig. 1B and Supplementary File S2) and transferred to the printer-associated software (Asiga Composer).
Additive manufacturing was performed using the biocompatible resin Ortho IBT (Nextdent, Soesterberg, Netherlands) with the base plate, support, and build parameters specified in Supplementary File S3. Then the inserts were removed from the build platform, cleaned twice in an isopropanol ultrasound bath for 3 min (BDH Chemicals, Radnor, PA), air dried, postpolymerized, and vacuum treated (15 min; Visio Beta Vario Light Unit; 3M, Saint Paul, MN). The support material was removed manually.
Each insert provided five sites (S1–S5) for biofilm carriers (4 × 4 × 1.5 mm) that were kept in position by undercuts (0.15 mm) at recession depths of either 0.5, 1.0, or 1.5 mm. The inserts had central holes (0.5 × 0.5 mm) at the base for punch-out removal of the carriers and a marginal notch (Fig. 1B) for attachment of the inserts to the dental bar. For insert attachment, the lower jaw stone model was lubed with separating liquid (Aislar; Kulzer, Hanau, Germany) and the dental bar was placed on the model. Then one insert was fixed on each side using a light-cured acrylic material (Triad VLC Gel; Dentsply Sirona, Charlotte, NY) that was placed manually on the retention areas of the bar and around the insert (Fig. 1C). After light curing for 20 s (Translux CL; Kulzer, Hanau, Germany), the inserts were stored in water for 24 h to remove residual monomer.
Collection of in situ-grown dental biofilms
For the collection of in situ-grown biofilms, the inserts of the lower jaw splints were equipped with custom-made nonfluorescent glass slabs with a surface roughness of 1200 grit (Menzel, Braunschweig, Germany). Participants wore the splints for periods of 24, 48, or 72 h and dipped the splints in 10% (w/v) sucrose solution for 2, 10, or 30 min, three times per day, to provide the growing biofilms with additional nutrients. The splints were removed during intake of foods or drinks other than water and during measures of oral hygiene where they were kept in a humid chamber.
Quantification of biofilm growth by optical coherence tomography
Biofilms aged 24, 48, and 72 h (3 × 10 min sucrose/day; recession depth = 1.5 mm) were subjected to optical coherence tomography (OCT). Biofilms were collected from seven participants and all five sites (S1–S5) on the splint (n = 134). The glass slabs were washed three times, immersed in phosphate-buffered saline (refractive index = 1.33), and scanned with a spectral domain OCT imaging system (GAN620C1; Thorlabs, Lübeck, Germany). A detailed description of image acquisition and determination of biofilm thickness is provided in Supplementary File S4 (SM1).
Biofilm characterization by confocal laser scanning microscopy
To test the influence of sucrose exposure and of the recession depth provided by the inserts on biofilm growth and extracellular matrix formation, 48-h biofilms (n = 81) from three participants were analyzed by confocal laser scanning microscopy (CLSM).
In one series of experiments, biofilms were grown with inserts providing recession depths of 0.5, 1.0, or 1.5 mm (3 × 10 min sucrose/day); in a second series of experiments, biofilms were grown with three daily exposures to sucrose of either 2 or 30 min (recession depth = 1.5 mm). Experiments were performed in biological triplicates. Glass slabs with fixed biofilms were stained with the fluorescently labeled lectin Concanavalin A (ConA; Sigma-Aldrich, Søborg, Denmark) to visualize glycoconjugates in the biofilm matrix. Bacterial cells were stained with Propidium Iodide (Sigma-Aldrich). For each biofilm, z-stacks of confocal images spanning the height of the biofilms were acquired in six fields of view (FOVs) in predefined positions on the glass slab. A detailed description of biofilm processing and image acquisition is provided in Supplementary File S4 (SM2).
In each image, the area covered by bacteria and the intercellular area stained by ConA-fluorescein isothiocyanate were determined using the digital image analysis software daime.
23
Fluorescent artifacts, such as epithelial cells, were removed manually from the images. Microbial and matrix biovolumes were calculated for each stack by multiplying the total area with the interslice distance according to the Cavalieri principle.
24
Biofilm thickness was determined directly in the microscope software (ZEN black edition; Carl Zeiss). For comparisons of biofilm density between different growth conditions, relative biovolumes (B%) were calculated according to Equation (1), with V being the average biovolume in a FOV for a given growth condition, x and y being the x and y dimensions of the FOVs and h being the average biofilm thickness:
Quantification of biofilm acidogenicity by pH ratiometry
Forty-eight-hour biofilms from 11 participants (3 × 10 min sucrose/day; recession depth = 1.5 mm) were transferred to stimulated saliva from the respective participants. The saliva samples were collected right before the experiments, cleared by centrifugation (5 min, 1150 g) and titrated to pH 7. Sucrose was added to a concentration of 4% (w/v); the biofilms were stained with the ratiometric pH-sensitive C-SNARF-4 (30 μM; Thermo Fisher Scientific, Waltham, MA) and examined by CLSM after 5 min (T1), 20 min (T2), and 35 min of exposure to sucrose (Supplementary File S4—SM3).
Images were exported to the digital image analysis software daime and processed as described previously.
25
In brief, the red and green channel images were segmented with individually chosen brightness thresholds, after which the bacteria were removed from the images, leaving the extracellular space for pH analysis. Images were then exported to ImageJ,
26
where the green channel images were divided by the corresponding red channel images. The resulting ratios were converted to pH values using Equation (2), which was established by calibrating C-SNARF-4 in 2-(N-morpholino)ethanesulfonic acid buffer solutions of different pH.
27
16S rRNA gene sequencing
Biofilm samples from eight participants were subjected to 16S rRNA gene sequencing to determine their bacterial composition. DNA extraction and polymerase chain reaction (PCR) were performed as described in Supplementary File S4 (SM4).
From the raw 16S rRNA gene sequences, a zero-radius Operational Taxonomic Unit (zOTU) table was generated using the UPARSE bioinformatics pipeline version 10.0.240_i86linux64. 28 The paired-end reads were merged and trimmed: 19 bp from the left and 20 bp from the right end, equivalent to the PCR primer lengths. Reads were quality filtered, reduced to unique sequences, and counted. Chimeras and reads with sequencing and PCR errors were removed. Reads were remapped to the zOTUs with a minimum sequence similarity of 97%, mapping to the plus strand only. The QIIME2 feature classifier 29 was trained using the Human Oral Microbiome Database, 30 and the zOTUs were taxonomically annotated with a confidence of 0.7 and the same read orientation. The zOTU table was normalized using rarefication to 1000 observations per sample and abundances were converted to percentage.
Statistical analysis
Variation of biofilm thickness, as determined by OCT, was estimated by calculating coefficients of variance (CV) for the thickness of all 24-, 48-, and 72-h biofilms, and for the thickness of 24-, 48-, and 72-h biofilms from individual participants.
To assess the effect of the glass slab location in the mouth on biofilm growth, the difference between the biofilm thickness on individual glass slabs and the biofilm thickness of all collected glass slabs were calculated for each participant and experimental period. Kendall rank correlations with ties (Kendall's tau-b) were used to investigate an association between glass slab position (sites S1–S5) and biofilm thickness. Pearson correlations were used to estimate the influence of recession depth and sugar exposure on bacterial biovolume, matrix biovolume, and biofilm thickness, as determined by CLSM. Moreover, the correlation between biofilm thickness and average biofilm pH, as determined by pH ratiometry, was assessed using Pearson correlations. All statistical calculations were performed in R. 31 p-Values below 0.05 were considered statistically significant.
Results
In situ model
The dental bars produced by DMLS fitted the participants’ jaws with high precision and required no further adjustment in the clinics (Fig. 1D). Additive manufacturing of the inserts for biofilm carriers by vat photopolymerization considerably reduced the working hours spent on the production of the intraoral splints. With the chosen parameters (carrier size, number of sites), 24 inserts could be produced simultaneously in one print job (duration: 79 min) with a precision of ±62 μm, resulting in a material cost of ∼0.35 Euros per insert.
The study participants completed all experimental periods without reporting adverse events or discomfort. The design of the splints and the inserts allowed removing the biofilm-covered glass slabs within seconds without touching the surface that faced the oral cavity (Fig. 1E and Supplementary Files S5 and S6). Hence, the intricate biofilm architecture remained undisturbed during collection. No material failures of the splints were observed, but after two to three experimental periods, the inserts were replaced to prevent stress fractures.
Biofilm growth
Biofilm formation over time
Robust biofilms formed on the glass slabs of all participants. Average biofilm thickness (±SD) increased from 4.8 μm (±2.4) after 24 h to 12.8 μm (±6.2) after 48 h, and to 23.6 μm (±15.8) after 72 h, as determined by OCT (Fig. 2A). A moderate degree of interindividual variation in biofilm thickness was observed, with CV of 0.51, 0.48, and 0.67 for 24-, 48-, and 72-h biofilms, respectively. The thickness of biofilms formed on glass slabs from the same participant varied slightly more, with intraindividual CVs of 0.87, 0.73, and 0.71 for 24-, 48-, and 72-h biofilms, respectively. Comprehensive data are shown in Figure 2B, representative OCT images in Figure 2C. No correlation was observed between the site of biofilm growth (S1–S5) and the biofilm thickness (Supplementary File S7; Kendall's tau-b = −0.04; p = 0.75).
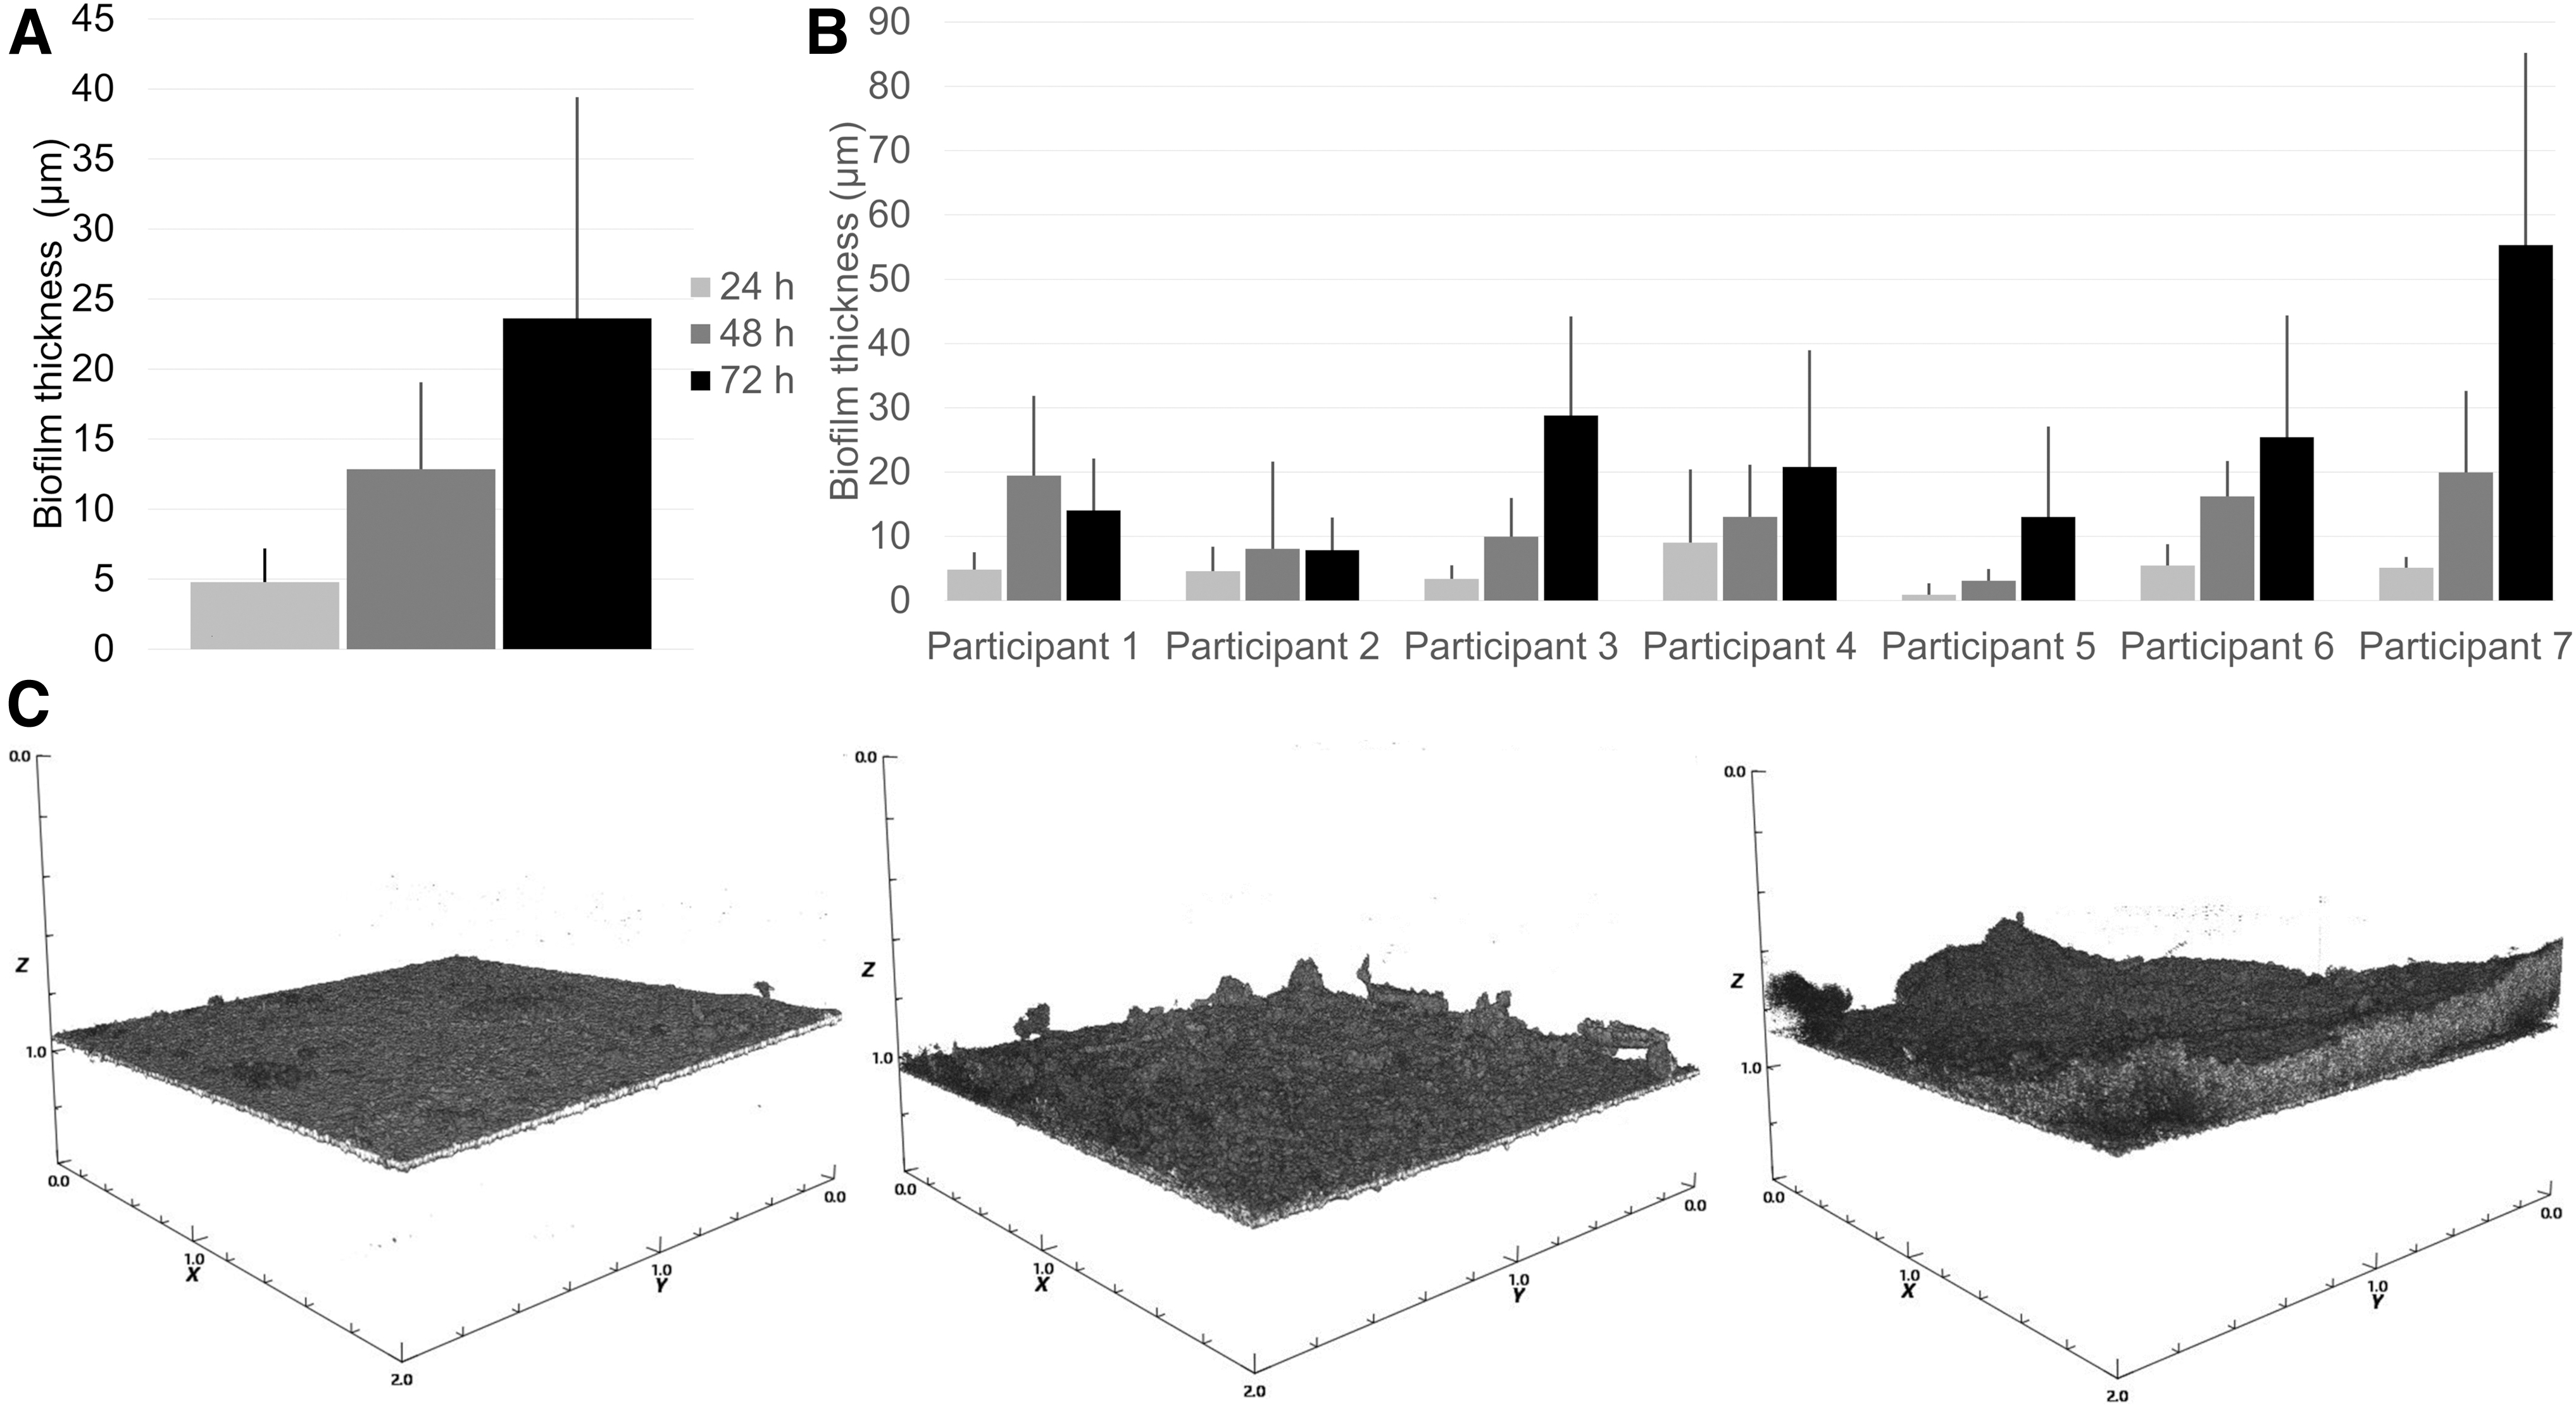
In situ biofilm growth over time, as determined by OCT. Average biofilm thickness across all participants (n = 7) increased continuously from 24 to 48 h and further to 72 h
Biofilm structure
Confocal microscopy revealed the typical architecture of supragingival dental biofilms, with dense, mushroom-shaped cell clusters (Fig. 3A), sites covered by smaller microcolonies (Fig. 3B), and cell-free areas in between. The biofilms were dominated by coccoid cells that often formed characteristic streptococcal chains (Fig. 3B, white arrowheads). In some locations, the biofilms comprised fungal buds and hyphae (Fig. 3C), as well as epithelial cells (Fig. 3D, white arrowhead). Biofilm matrix glycoconjugates visualized by ConA appeared as cloud-like structures, closely associated to bacterial cell clusters (Fig. 3B, green arrowheads), in some but not all areas of the biofilms.
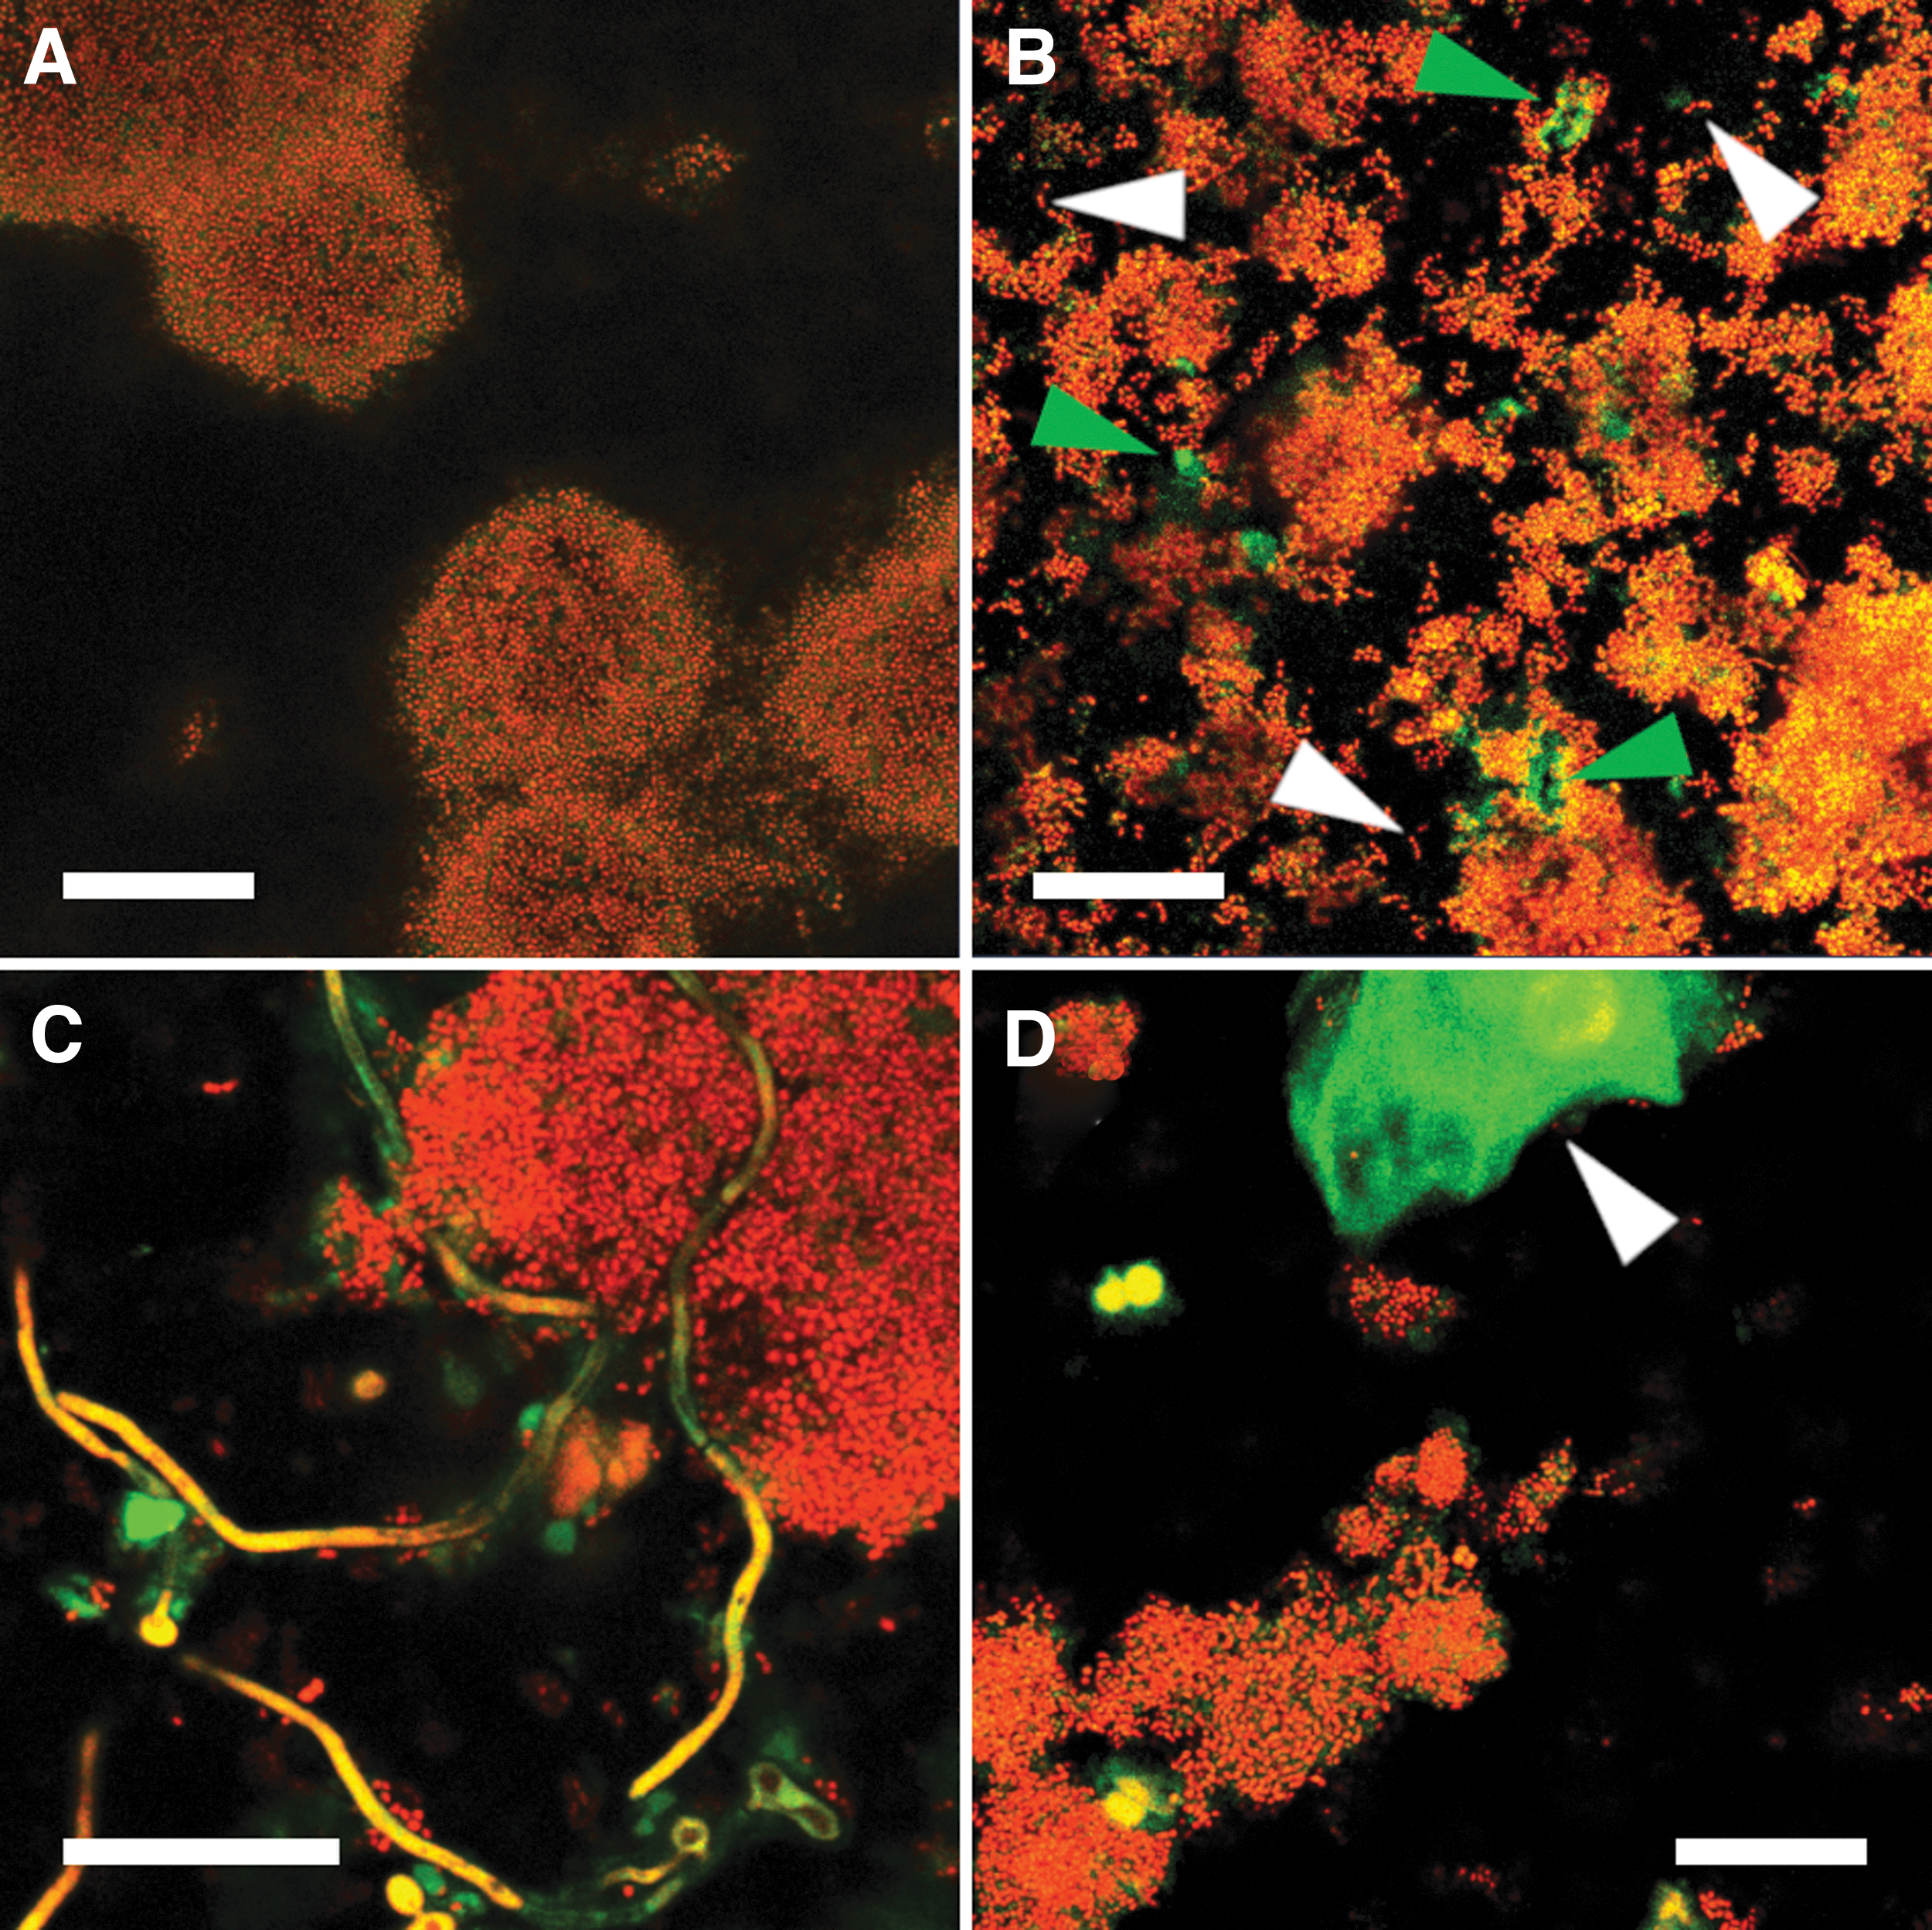
Representative confocal microscopy images of biofilm structure. Microbial cells were stained with Propidium Iodide (red), and the fluorescently labeled lectin ConA (green) was used to visualize biofilm matrix glycoconjugates. In situ-grown biofilms showed the typical architecture of supragingival dental biofilms with dense, mushroom-shaped bacterial cell clusters
Influence of recession depth and sucrose exposure on biofilm formation
Average biofilm thickness increased slightly with the recession depth, but the correlation failed to reach the level of statistical significance (p = 0.07; r = 0.98; Fig. 4A). Interestingly, the relative microbial biovolume B% was highest for the intermediate recession depth of 1.0 mm (0.5 mm: 38.8%; 1.0 mm: 46.3%; 1.5 mm 21.7%). Biofilm thickness (±SD) was neither affected by prolonged exposure to sucrose (3 × 2 min/day: 13.1 ± 6.6 μm; 3 × 30 min/day: 13.3 ± 2.9 μm; p = 0.48), nor did the amount of matrix components targeted by ConA increase (p = 0.45). In contrast, the relative microbial biovolume of the biofilms was higher when biofilms were exposed to 3 × 30 min of sucrose per day (p = 0.015; Fig. 4B).
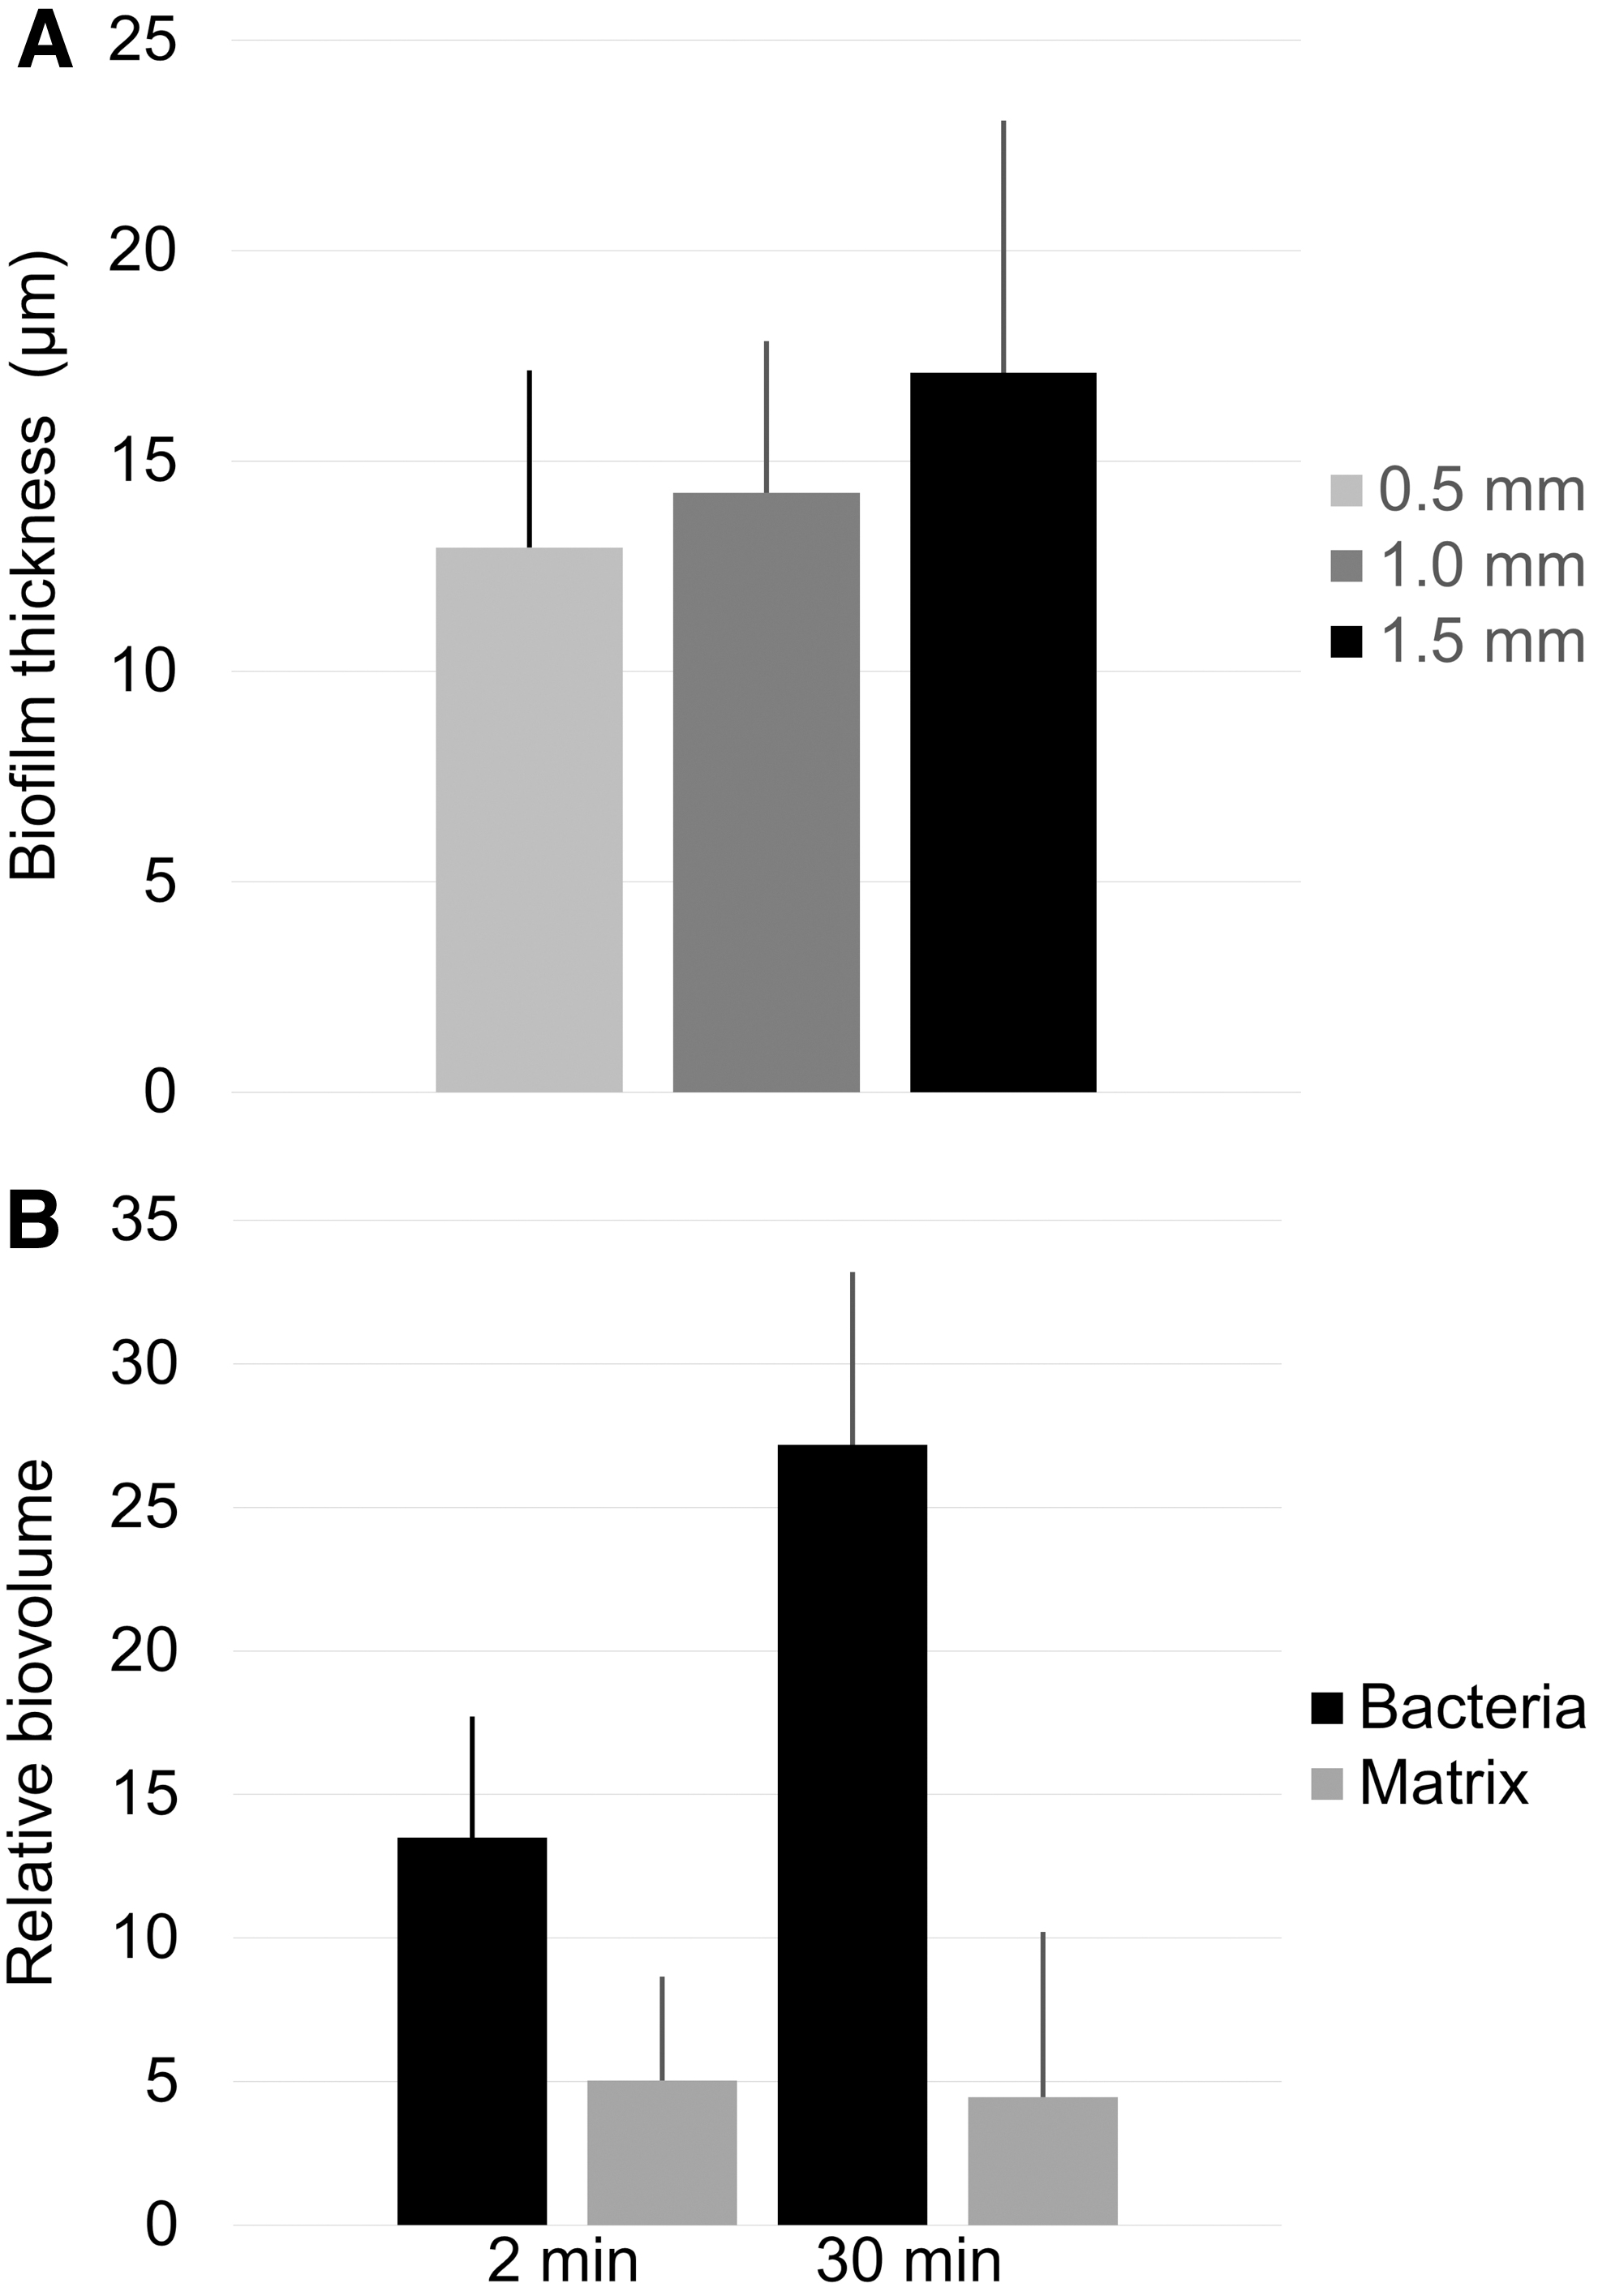
Influence of recession depth and sucrose exposure on biofilm formation.
Biofilm composition
The biofilms grown on the glass carriers harbored a diverse bacterial population, with a similar taxonomic richness for all participants. In total, 199 zOTUs were identified across all samples, with an average of 37 per participant. Most biofilms were dominated by Streptococcus spp., with individually varying contributions of Haemophilus, Veillonella, Prevotella, Granulicatella, Rothia, Neisseria, and Staphylococcus (Fig. 5).
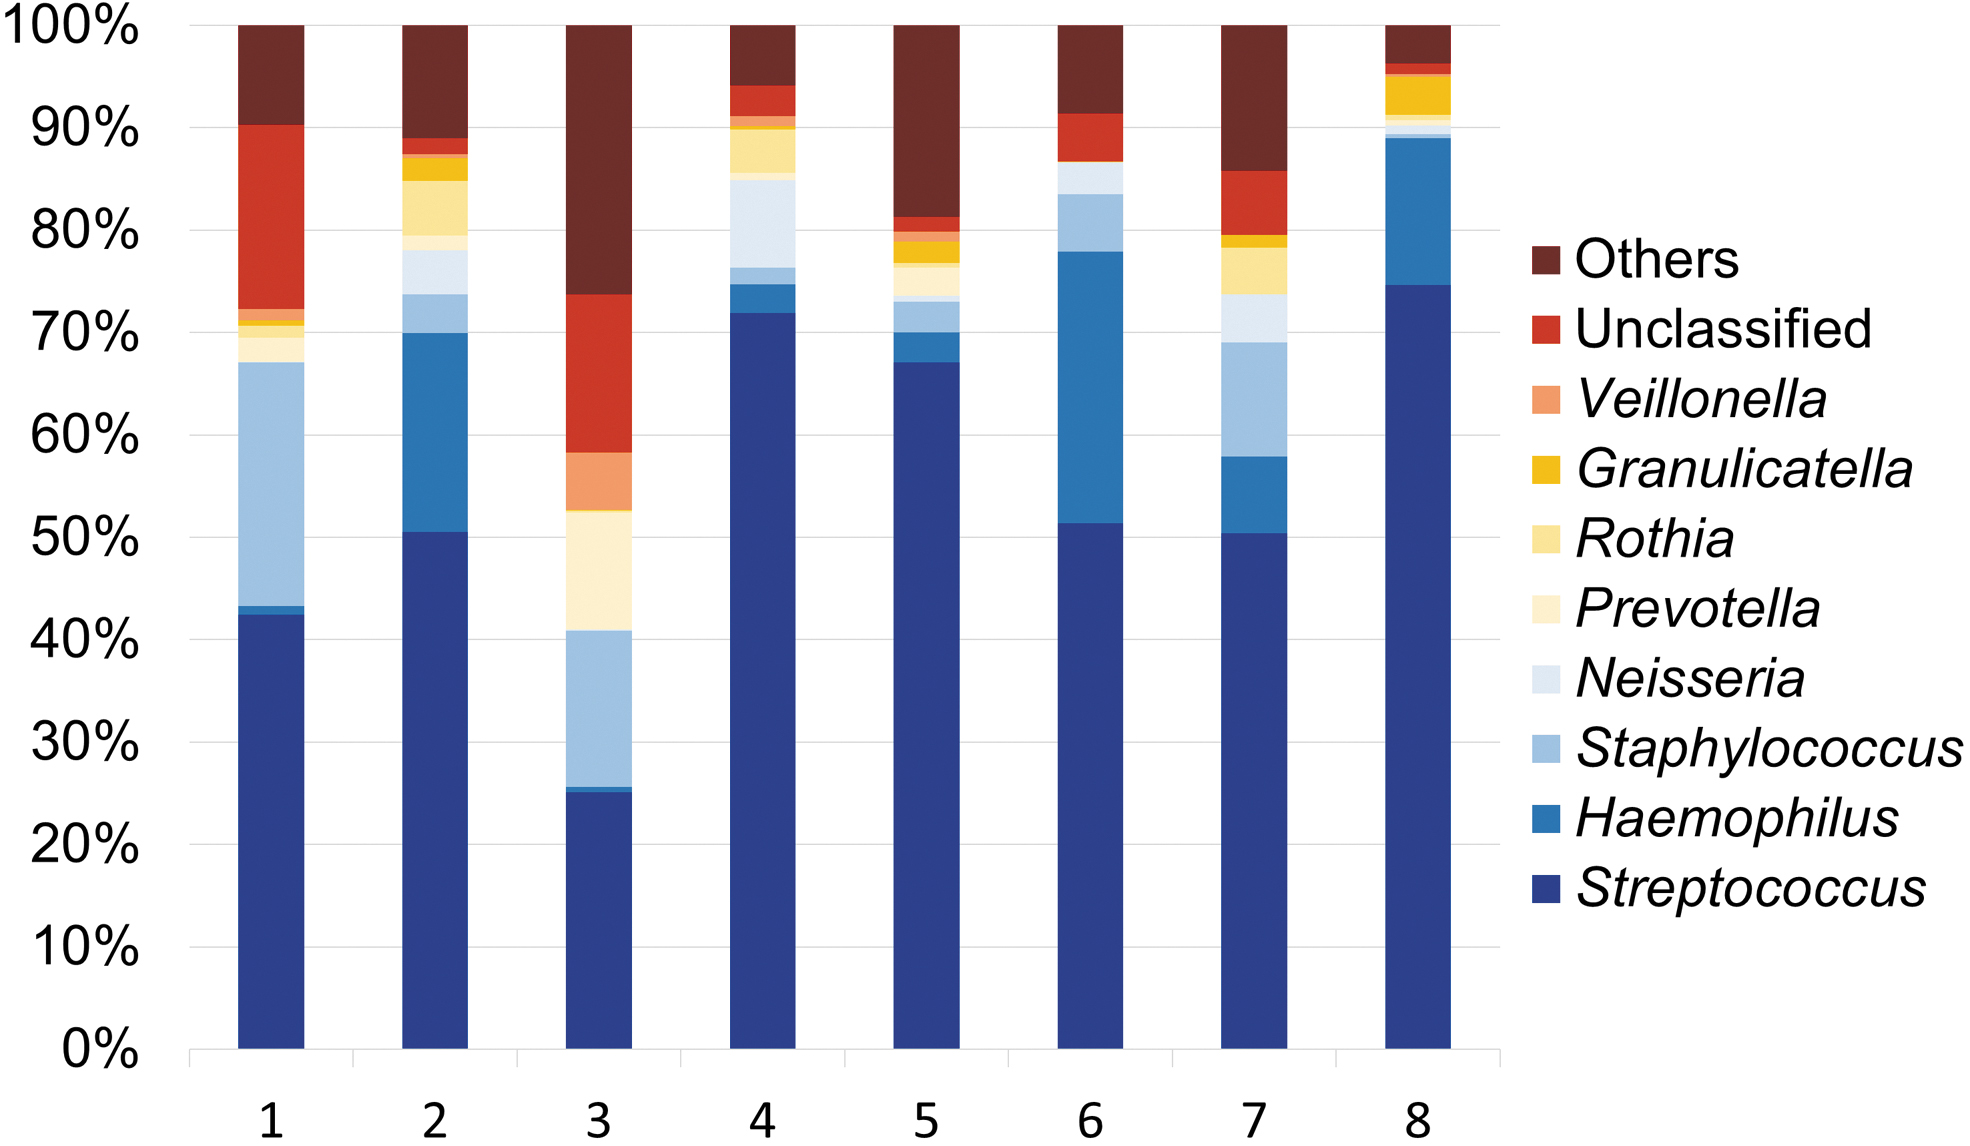
Relative abundances of different bacterial genera in in situ-grown biofilms. Each bar represents the 16S rRNA gene sequencing results from one individual. Biofilms harbored species from different oral genera, with a high abundance of Streptococcus spp. in all participants.
Biofilm acidogenicity
The pH drops varied considerably between participants, with average biofilm pH (±SD) at T3 ranging from 5.23 (±0.08) to 6.93 (±0.03) (Table 1). Although to a lesser extent, pH also varied between different FOVs inside the same biofilm (Fig. 6A). In highly acidogenic biofilms, the pH dropped below critical values for enamel dissolution (ca. 5.5) in some, but not all FOVs (Fig. 6A, B). The observed pH drops occurred quickly, reaching an average (±SD) of 6.14 (±0.51) across all biofilms at T1. At T2, average pH had dropped to 5.97 (±0.57), after which it remained nearly constant until T3 (5.91 ± 0.58). A strong correlation was observed between pH at T3 and average biofilm thickness (p = 0.004; r = −0.78; Fig. 6C).
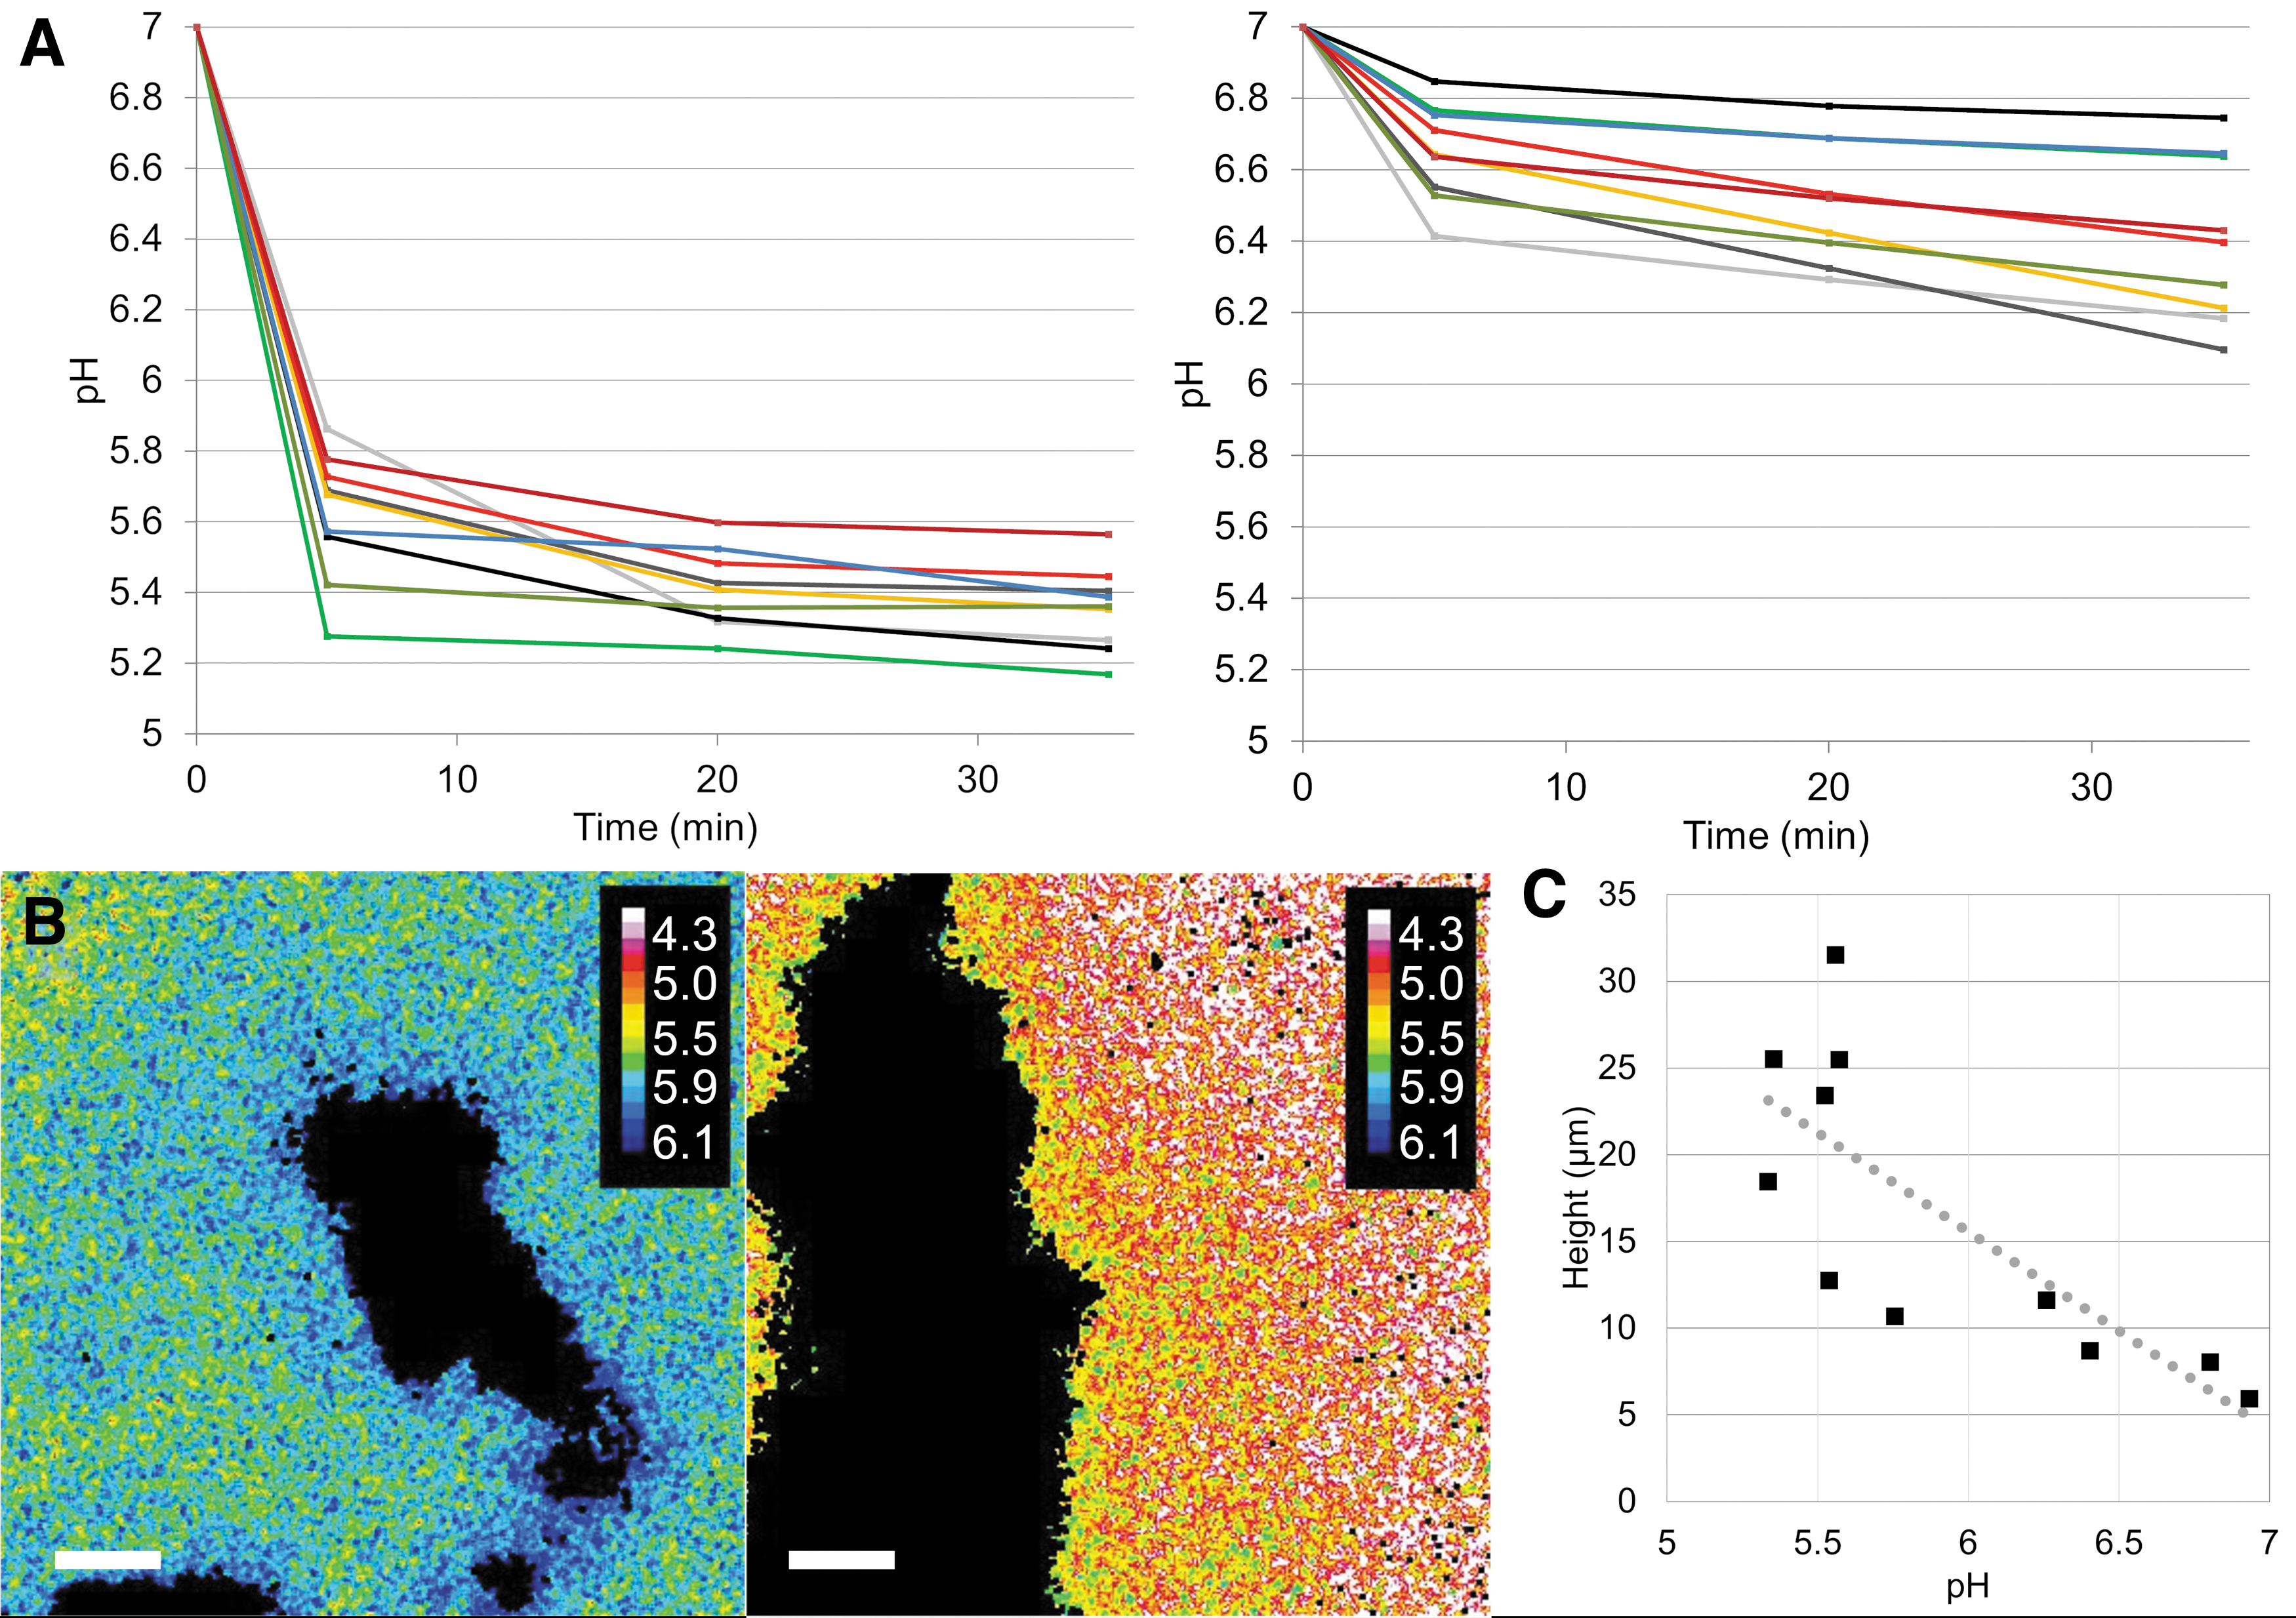
Ratiometric assessment of biofilm acidogenicity. pH in biofilms from 11 participants was measured in nine different FOVs per biofilm, 5, 20, and 35 min after exposure to sucrose. Biofilm pH differed considerably between participants.
Average pH Inside In Situ-Grown Dental Biofilms
Biofilms were exposed to cleared saliva (pH 7) containing 4% sucrose, and pH was measured ratiometrically in nine different fields of view after 5 min (T1), 20 min (T2), and 35 min (T3). Average pH (±SD) in the biofilms differed considerably between participants.
Discussion
The present work is the first to describe the design, production, and performance of a device for in situ oral biofilm growth created by additive manufacturing. Additive manufacturing offers the perfect combination of individual adaptation to the participant's mouth and a highly standardized spatial arrangement of the biofilm carriers.
With the presented design, a natural saliva flow across the carriers was permitted during biofilm growth, and hence a realistic exposure to salivary nutrients. At the same time, the biofilms were protected from excessive shear by the surrounding soft tissues, matching dental smooth surface biofilms in slightly recessed areas, such as the gum margins. The new in situ device provides a high wearing comfort, as it rests passively in the cheek pouch and does not interfere with the habitual intercuspation of the teeth. In contrast to palatal appliances, phonetics are not limited by the device and the tongue does not interfere with biofilm formation. 12
During self-performed measures of oral hygiene, the device can be removed from the mouth, which makes it suitable for studies involving participants that suffer from oral diseases, such as caries or periodontitis. Even the intake of liquid foodstuffs or therapeutic mouth rinses can be performed with the device in situ, whereas the ingestion of solid foods should be avoided to prevent mechanical damage to both the acrylic inserts and the biofilm. The handling of biofilm samples is easy, as the carriers are clicked into place and—after biofilm growth—poked out through holes at the insert base (Fig. 1E). Samples can be collected within seconds without touching the biofilms, which facilitates the simultaneous processing of several participants.
Moreover, the risk of damaging the biofilm is greatly reduced, compared with traditional designs that employed sticky wax or dental adhesives to fix the biofilm carriers to the splint or a tooth.13,32,33 Due to the high geometric precision of the prints, the biofilm carriers fit accurately in the undercuts of the inserts without any risk of accidentally losing a carrier, which has been reported in previous studies. 12
The design used in the present work allowed for the collection of 10 replicate biofilm samples per experimental period, each of them grown with the exact same distance to the oral soft tissues. Compared with traditional handcrafted devices, the time needed for the fabrication of each individual splint was greatly reduced due to the simultaneous production of up to 24 inserts by vat polymerization. Within the limits of anatomy, the splint design can be modified to accommodate more carriers or to mimic other sites of dental biofilm formation, such as occlusal or surface approximal spaces. 34
Of all previously described devices for dental biofilm collection, only the Intraoral Device of Overlaid Disk-holding Splints provides a similar level of geometric standardization, but without the option to modify parameters such as the recession depth or the spatial arrangement of the carriers. 35 With three-dimensional printers becoming more and more established in modern dentistry, additive manufacturing appears to be the most accurate and the most cost- and time-efficient technology for the production of intraoral devices for biofilm collection.
The biofilms on the carriers mounted in the in situ device grew steadily over time, with a bacterial composition comparable to the one observed in in vivo-grown dental biofilms. 36 Surprisingly, Staphylococcus spp. were identified in the biofilms of most participants, which may reflect a contamination that occurred during 16S rRNA sequencing.
A moderate amount of intra- and interindividual variation in biofilm thickness was observed, with CV's ranging from 0.48 to 0.87. Higher degrees of variation in the amount of biofilm, with up to 90-fold differences in the numbers of colony-forming units recovered from different participants, 15 have been reported in previous trials, including work that has been performed in our own laboratory.13,19,37
Importantly, the amount of biofilm formed on the carriers in the present trial was not influenced by the position of the carrier on the splint, which suggests that coincidental events, such as the attachment of a large cell cluster, may be more important for biofilm development than the location on the splint. We assume that the differences in biofilm thickness observed in the present study reflect the minimum biological variation, which allows for the best possible comparison of different treatment modalities performed on the biofilms.
As a proof of concept, we tested the effect of different recession depths and sugar exposure times on the biofilm thickness and the bacterial and biofilm matrix biovolumes. The biofilm thickness tended to increase with increasing recession depth and thus a better protection from contact with the oral soft tissues. Hence, part of the variation observed in less standardized, handcrafted models may be explained by differential shear forces acting on different biofilm carriers.
Prolonged exposure to sucrose did not lead to thicker biofilms, but the biofilm volume did increase, meaning that the biofilms covered a greater area of the surface. Contrary to what could be expected, the volume of the biofilm matrix did not increase upon prolonged exposure to sucrose, which may be explained by the fact that ConA, the lectin used for matrix visualization, has a stronger affinity to mannose than to glucose moieties, 38 and therefore only partially stains the matrix produced from sucrose exposure.
Despite the high degree of standardization, ratiometric analysis of biofilm pH showed considerable differences in acidogenicity between biofilms from different participants, as well as some variation in pH between different areas inside the same biofilm. These findings are in line with previous reports on young in situ-grown biofilms, which are characterized by heterogeneity in pH and the presence of highly acidic microenvironments.18,39 The observed differences in biofilm acidogenicity may be related to the species composition of the biofilms, to the physiological state of the bacteria in the biofilm, or else to the presence of specific biofilm matrix components that contribute to the preservation of low pH.40,41 Part of the variation can be explained by the biofilm thickness, which was clearly associated with average biofilm pH in the present study.
Conclusion
In conclusion, devices with highly standardized geometry for the collection of biofilms grown in the oral cavity constitute a new application for medical additive manufacturing. Dental bars produced by DMLS provide a high degree of precision and thus participant comfort. Vat photopolymerization of inserts for biofilm carriers reduces the time and cost of production, facilitates the handling of in situ-grown biofilms, and eliminates other sources of variation than the true biological variation. In situ devices produced by additive manufacturing provide the best possible basis for studying the influence of different treatment modalities on growth, composition, and virulence in a complex, disease-related biofilm.
Footnotes
Acknowledgments
The authors would like to thank Lene Grønkjær, Anette Aakjær Thomsen, and Javier Eduardo Garcia for excellent technical support throughout the work. Mette Rose Jørgensen is acknowledged for fruitful discussions.
Authors’ Contributions
P.T.R.: Conceptualization; formal analysis; investigation; methodology; and writing—review and editing. K.K.J.: Conceptualization; investigation; methodology; and writing—review and editing. D.L.: Conceptualization; methodology; and writing—review and editing. A.M.: Formal analysis; methodology; and writing—review and editing. S.M.N.: Investigation; and writing—review and editing. L.B.S.H.: Formal analysis; investigation; and writing—review and editing. R.L.M.: Conceptualization; funding acquisition; resources; and writing—review and editing. S.S.: Conceptualization; data curation; formal analysis; funding acquisition; investigation; methodology; project administration; resources; supervision; visualization; and writing—original draft. All authors have reviewed and approved the final article before submission.
Author Disclosure Statement
No competing financial interests exist.
Funding Information
This work was supported by Novozymes A/S and the Innovation Fund Denmark (grant no. 9065-00244B). The funders had no role in study design, in the collection, analysis, and interpretation of data; in the writing of the report; or in the decision to submit the article for publication.
References
Supplementary Material
Please find the following supplemental material available below.
For Open Access articles published under a Creative Commons License, all supplemental material carries the same license as the article it is associated with.
For non-Open Access articles published, all supplemental material carries a non-exclusive license, and permission requests for re-use of supplemental material or any part of supplemental material shall be sent directly to the copyright owner as specified in the copyright notice associated with the article.