
Abstract
This article analyzes temperature fields and their variations in fused filament fabrication (FFF) from the filament entering the hot-end to the printed parts, aiming at a deeper understanding of the thermal process of this additive manufacturing technology. A standard E3D print head assembly was mounted on a robot arm for printing. A stable filament feeding region was determined with an upper limit in the volume flow rate at different nozzle temperatures. Within the limit, the steady-state temperature fields inside the hot-end were studied by a computational fluid dynamics model. Simulations indicated that the temperature became less homogeneous at higher flow rates, leading to a lower extrudate temperature at the nozzle outlet. These outlet temperatures were analyzed, validated, and used as input to simulate temperature variations in printed parts with a self-developed open-access numerical model. An interlayer time similarity rule was found in printing single-walled geometries, which specifies temperature similarities at the same interlayer time. The findings provide new insights into FFF processes, pointing out opportunities for improved production efficiency and scalability to large-scale manufacturing.
Introduction
Extrusion-based additive manufacturing (AM) includes a variety of manufacturing technologies. 1 A big sub-branch of them is driven by thermal energy, such as fused filament fabrication (FFF), pellet-based hot-melt extrusion, 2 big area additive manufacturing, 3 molten soda-lime glass extrusion,4,5 and molten sugar AM. 6 For these technologies, an in-depth knowledge of temperature development during printing is the key to fully understand the manufacturing process and to identify the limitations and capabilities.
In FFF, the temperature development starts from a thermoplastic filament feedstock being typically driven by a pinch roller, and fed into a hot-end consisting of a liquefier and a nozzle (Fig. 1). In the liquefier, the filament is heated up by a hot barrel, mainly by thermal conduction, toward a nominal nozzle temperature
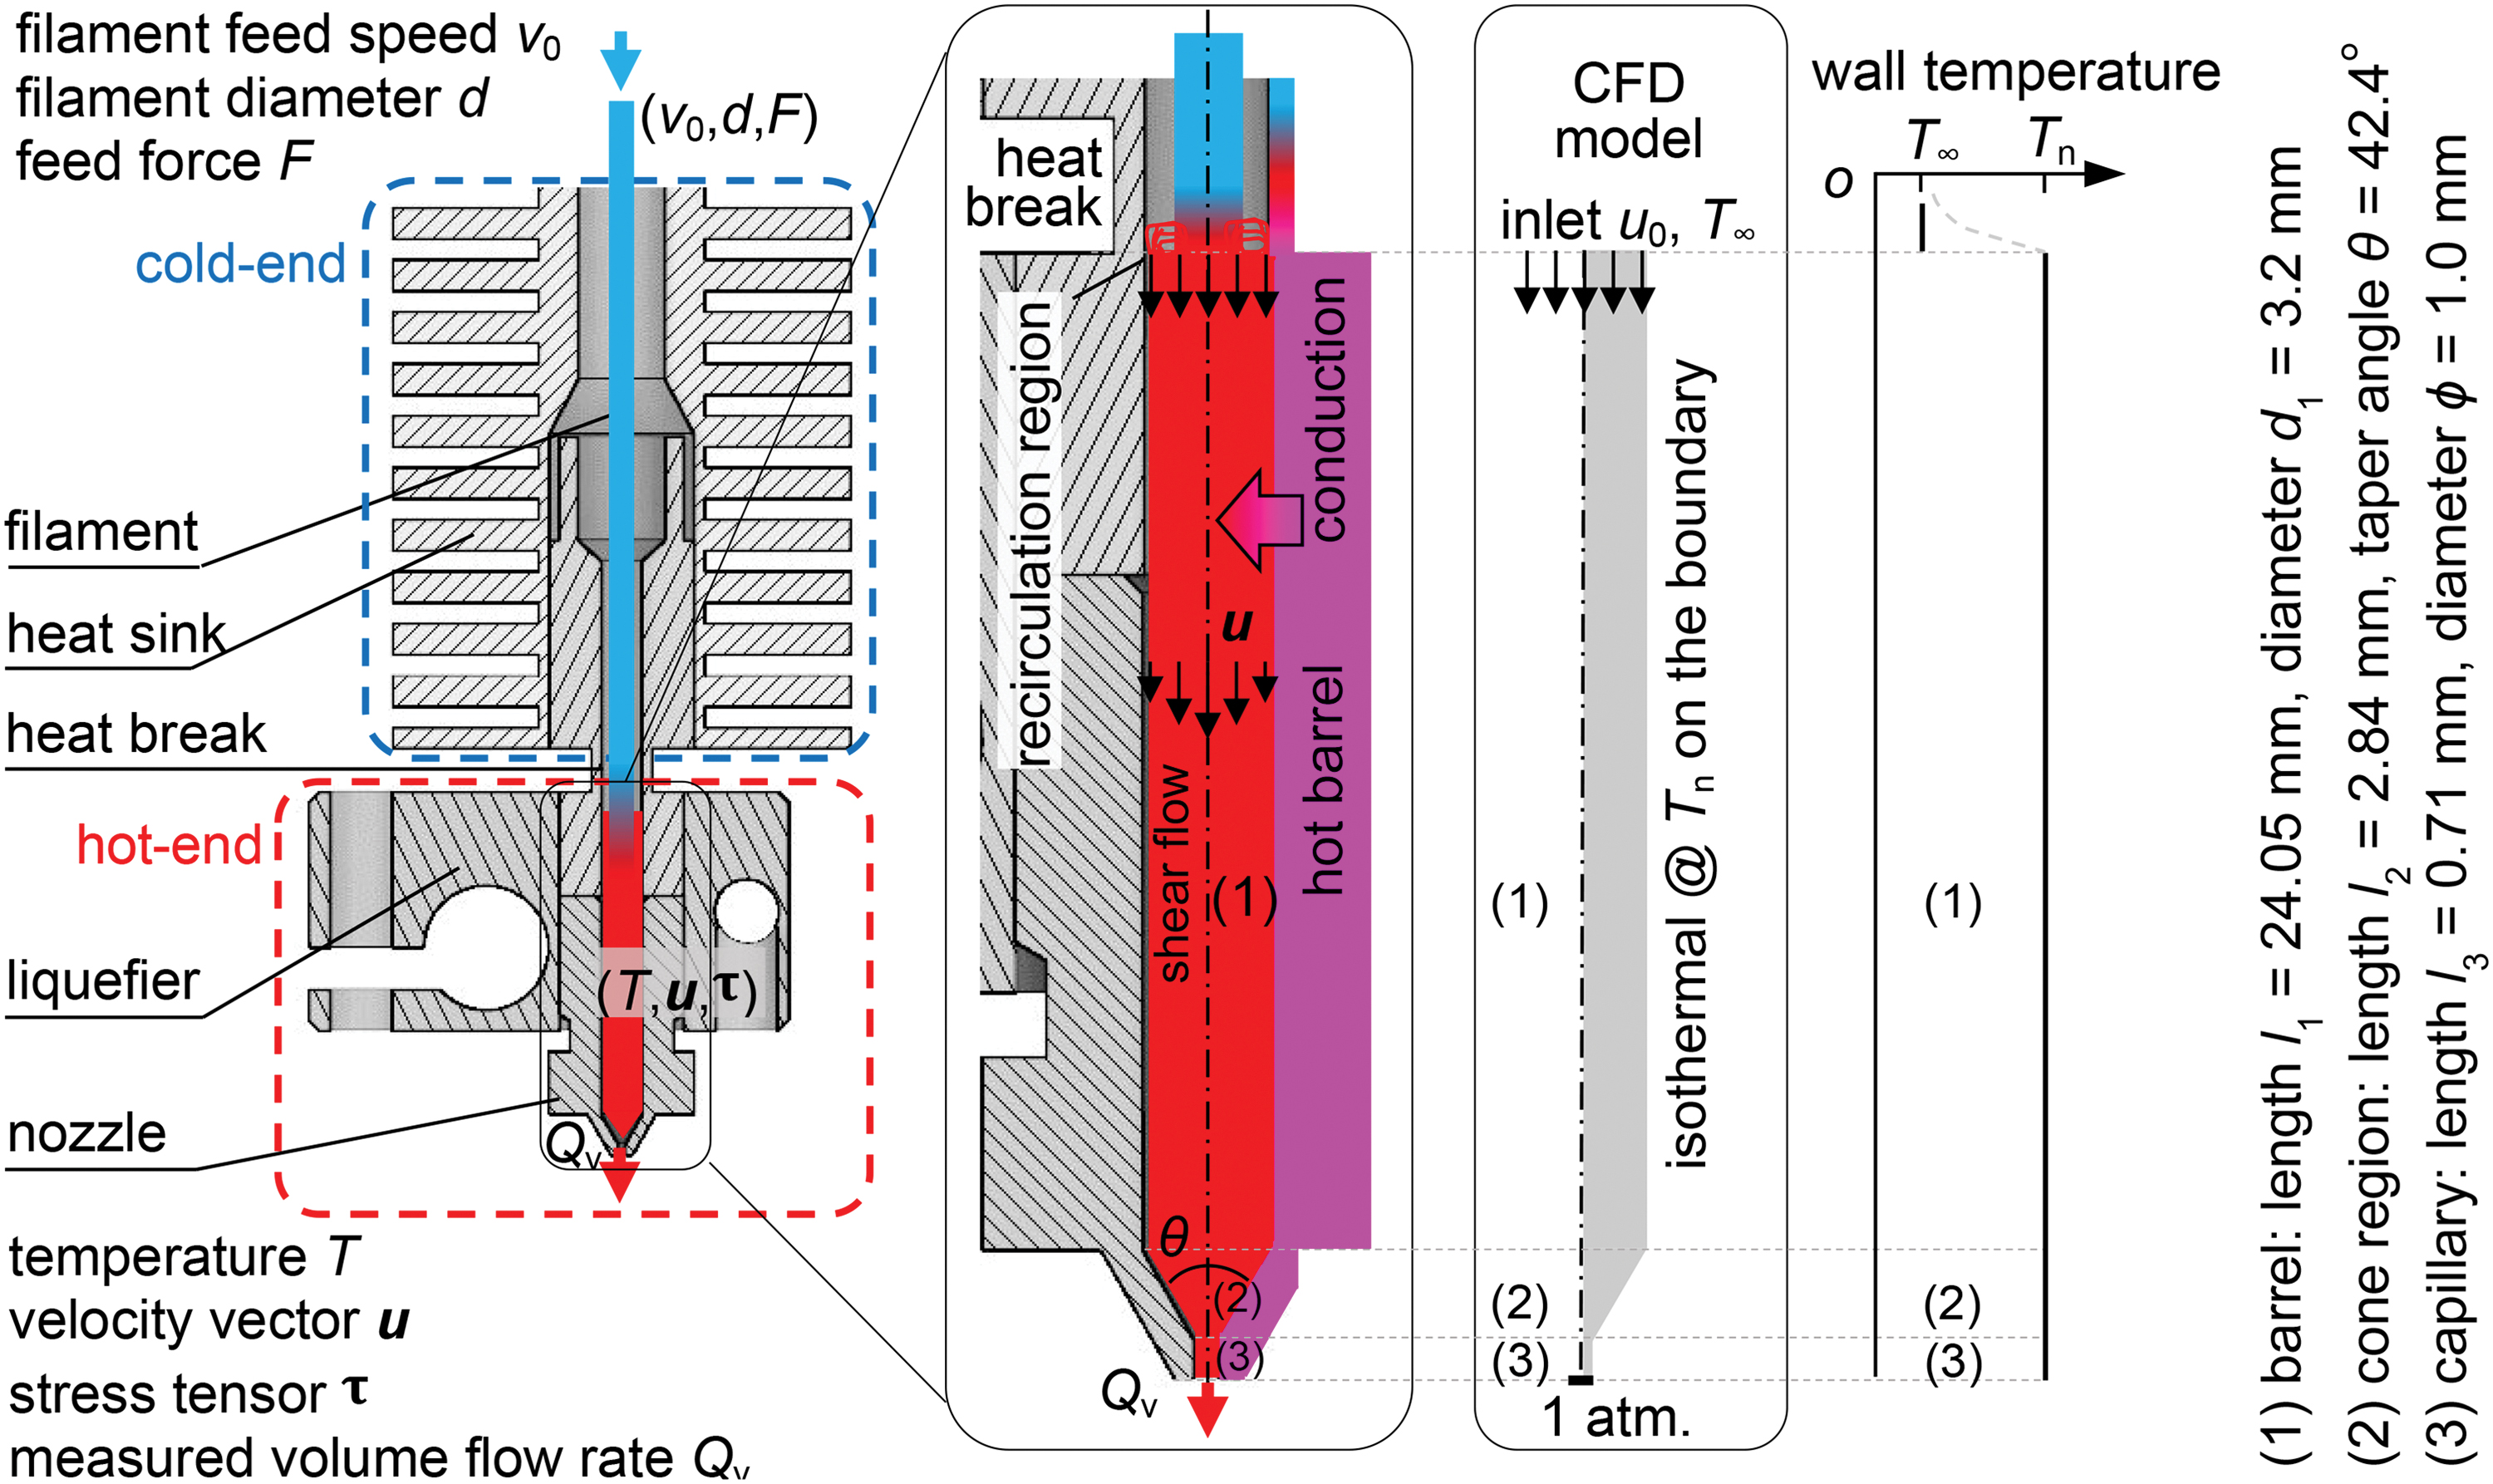
A print head assembly in FFF, and the polymer melt flow, pressure and heat transfer inside the hot-end. The hot-end was modeled in the CFD model for three geometrical parts: (1) barrel, (2) cone, and (3) capillary end. The barrel includes part of the liquefier and part of the nozzle. FFF, fused filament fabrication. CFD, computational fluid dynamics. Color images are available online.
Then, the polymer melt in the barrel is pushed through the nozzle, where it is subjected to an extensional flow because of the reduced cross-sectional area of the cone (conical/contraction) region and capillary end of the nozzle. 11 Shortly afterward, it reaches the exit and leaves the nozzle tip. The distributions and variations of the polymer melt velocity, pressure, and temperature, from the barrel entrance to the nozzle exit, are topics of intensive researches.9,10,12–20 On the one hand, these physical fields are typically affected by the liquefier temperature and feed rate for a given hot-end assembly and filament material10,13–15; on the other hand, the geometrical characteristics of the liquefier and the nozzle (e.g., length of the barrel, taper angle of the cone, diameter of the capillary end) also play a significant role.9,10,19,20
After leaving the hot-end, the deposition happens: the polymer melt makes a 90° turn, and typically deforms from a circular cross section to an ellipse confined between the nozzle tip and the build (support/heat) plate. During the deformation, the bottom side of the strand (track/road/bead) experiences profound stretches.
21
Such stretches, along with the shear flow inside the hot-end, may significantly disentangle the polymer chains and accelerate the crystallization kinetics for semicrystalline polymers.
22
Accompanying the deposition, heat transfer takes place in the strand due to a combination of thermal conduction (with previously deposited neighbor strands and/or the build plate if applicable), convection (with the local air), and radiation (with the far environment).3,23 The printed part solidifies as its temperature decreases toward the room temperature
As introduced, temperature analyses in FFF are usually studied in the above two disjointed stages inside and outside the hot-end. To the best of the authors' knowledge, no studies provide a complete description of the temperature development from the filament to the final parts yet.
This article offers such a global view. The aim is to reach a deeper understanding of the whole FFF process from the perspective of temperature development, and to investigate possible connections between liquefier kinetics and process parameters in the deposition. A print head assembly used on desktop FFF machines was mounted on a robot arm, and experiments in different processes were performed. The polymer melt flow, pressure, and heat transfer inside the hot-end were studied with a computational fluid dynamics (CFD) model. The extrudate temperatures at the nozzle outlet were analyzed, validated, and then used to simulate part cooling during printing by means of a self-developed finite difference model. The temperature variations in the printed parts were studied subsequently, along with the in-process monitoring by thermography. Accordingly, limitations across nozzle temperature, flow rate, and process parameters were identified. Suggestions for scale-up production and FFF process optimizations were also put forward.
Materials and Methods
Equipment and filament
A standard E3D v6 print head with an E3D brass nozzle (diameter ϕ = 1 mm) was used (Fig. 2a). A Nema 17 stepper motor with a holding torque of 0.49 N·m was used to feed the filament. The liquefier was powered by a ceramic heating element with a maximum power of 30 W, and its temperature was measured by a K-type thermocouple. The temperature and extrusion rate of the liquefier were controlled by an embedded PC (CX5140; Beckhoff Automation GmbH & Co. KG, Germany) with appropriate input/output cards (stepper-EL7041-0052, heating element-EL2022, thermocouple-EL3312) in a custom program written in the TwinCAT 3 software. The function block TF4110 TC3 Temperature Controller was used to periodically switch on and off the heating element with the digital pulse-width modulation signal. The modulation cycle time was 1 s. During the extrusion, the difference between the nominal nozzle temperature
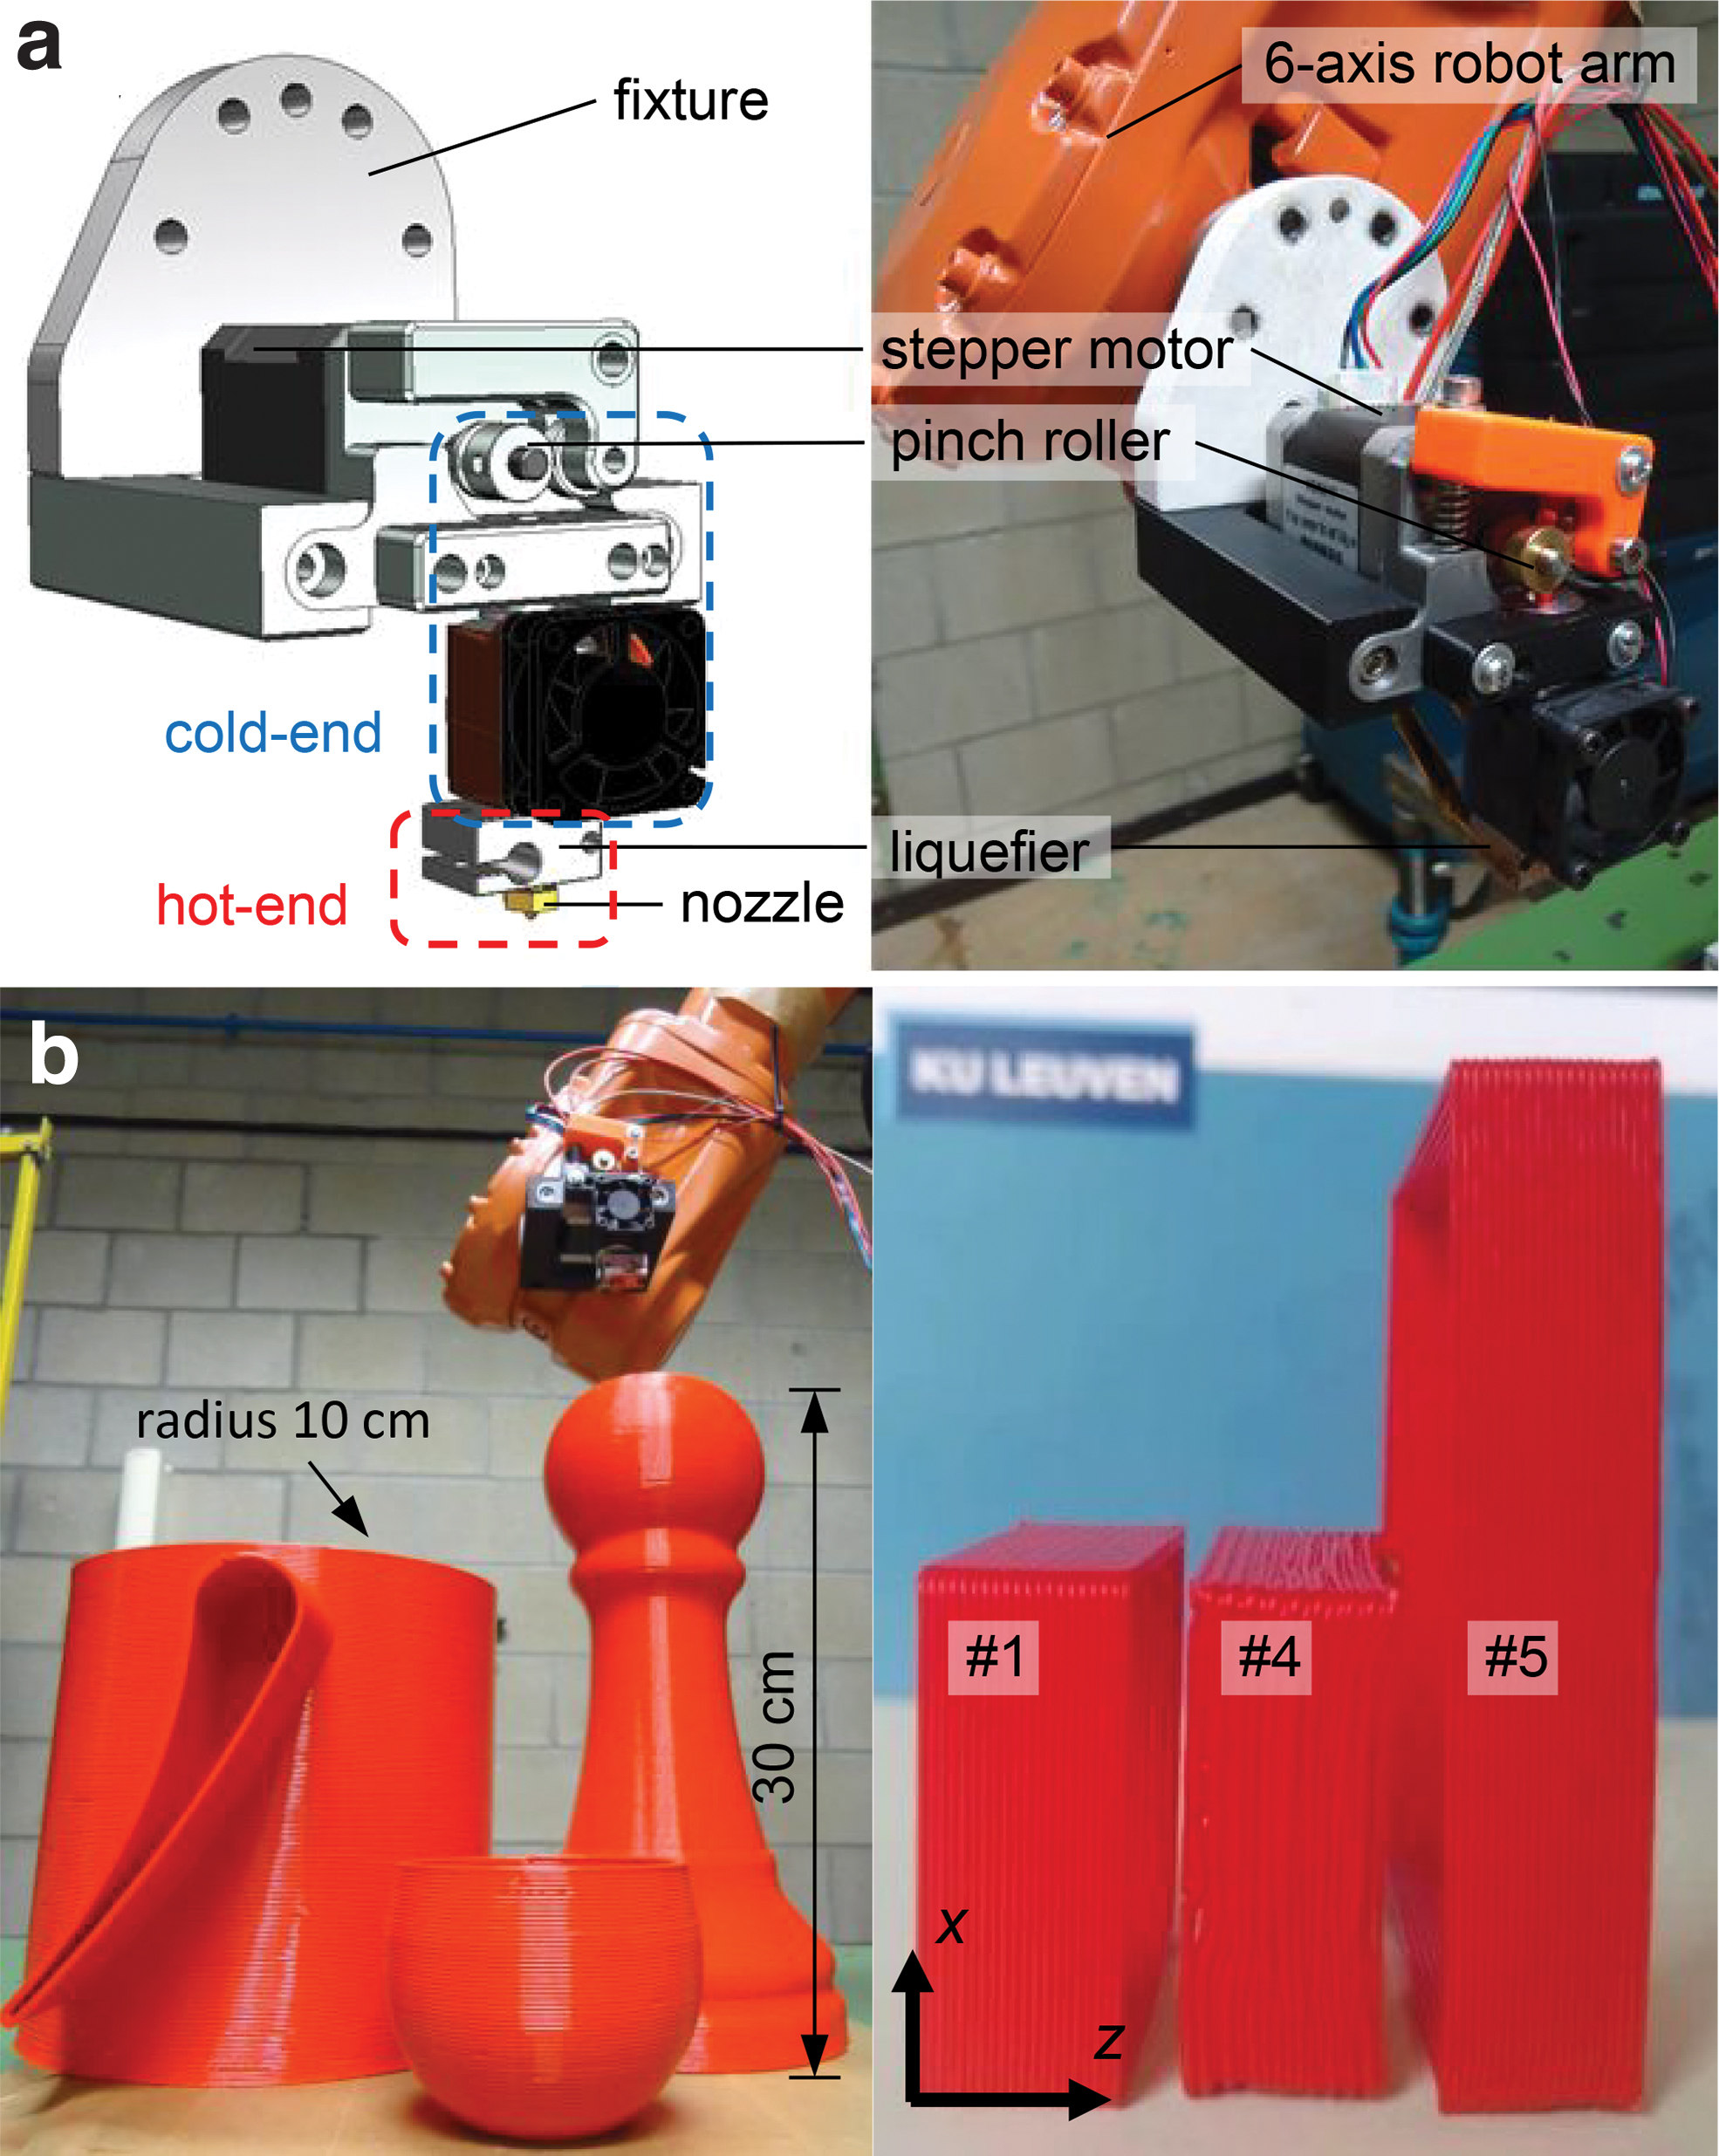
The print heat assembly was mounted on a six-axis robot arm with a maximum reach of 1.55 m (ABB IRB 2400; ABB Ltd., Switzerland, Fig. 2a) and controlled for printing. The printing toolpaths were programmed in ABB RobotStudio® 2019 (ABB Ltd.) program.
The material used was a red ColorFabb poly(lactic acid) (PLA) Economy filament with a diameter d = 2.85 mm. When tested by differential scanning calorimetry (TA Instruments Q200, heating rate 10℃/min), its degree of crystallinity was found to be below 1% (in the first heating cycle), indicating that the filament was in an amorphous state before being used in FFF.
Geometry and process settings
The geometry of interest is a single-walled square of length L = 30 mm, height H = 12 mm, and wall thickness 1 mm (Fig. 3). This geometry provides a straightforward visual means to identify a suitable process window for quality printing. It is also of practical applications in contouring of large single-walled structures. From the perspective of thermal boundaries in heat transfer, it represents a worse scenario for bond formation due to fast cooling. Thus, the temperature obtained with this geometry also sheds lights on the weak bonding in FFF.
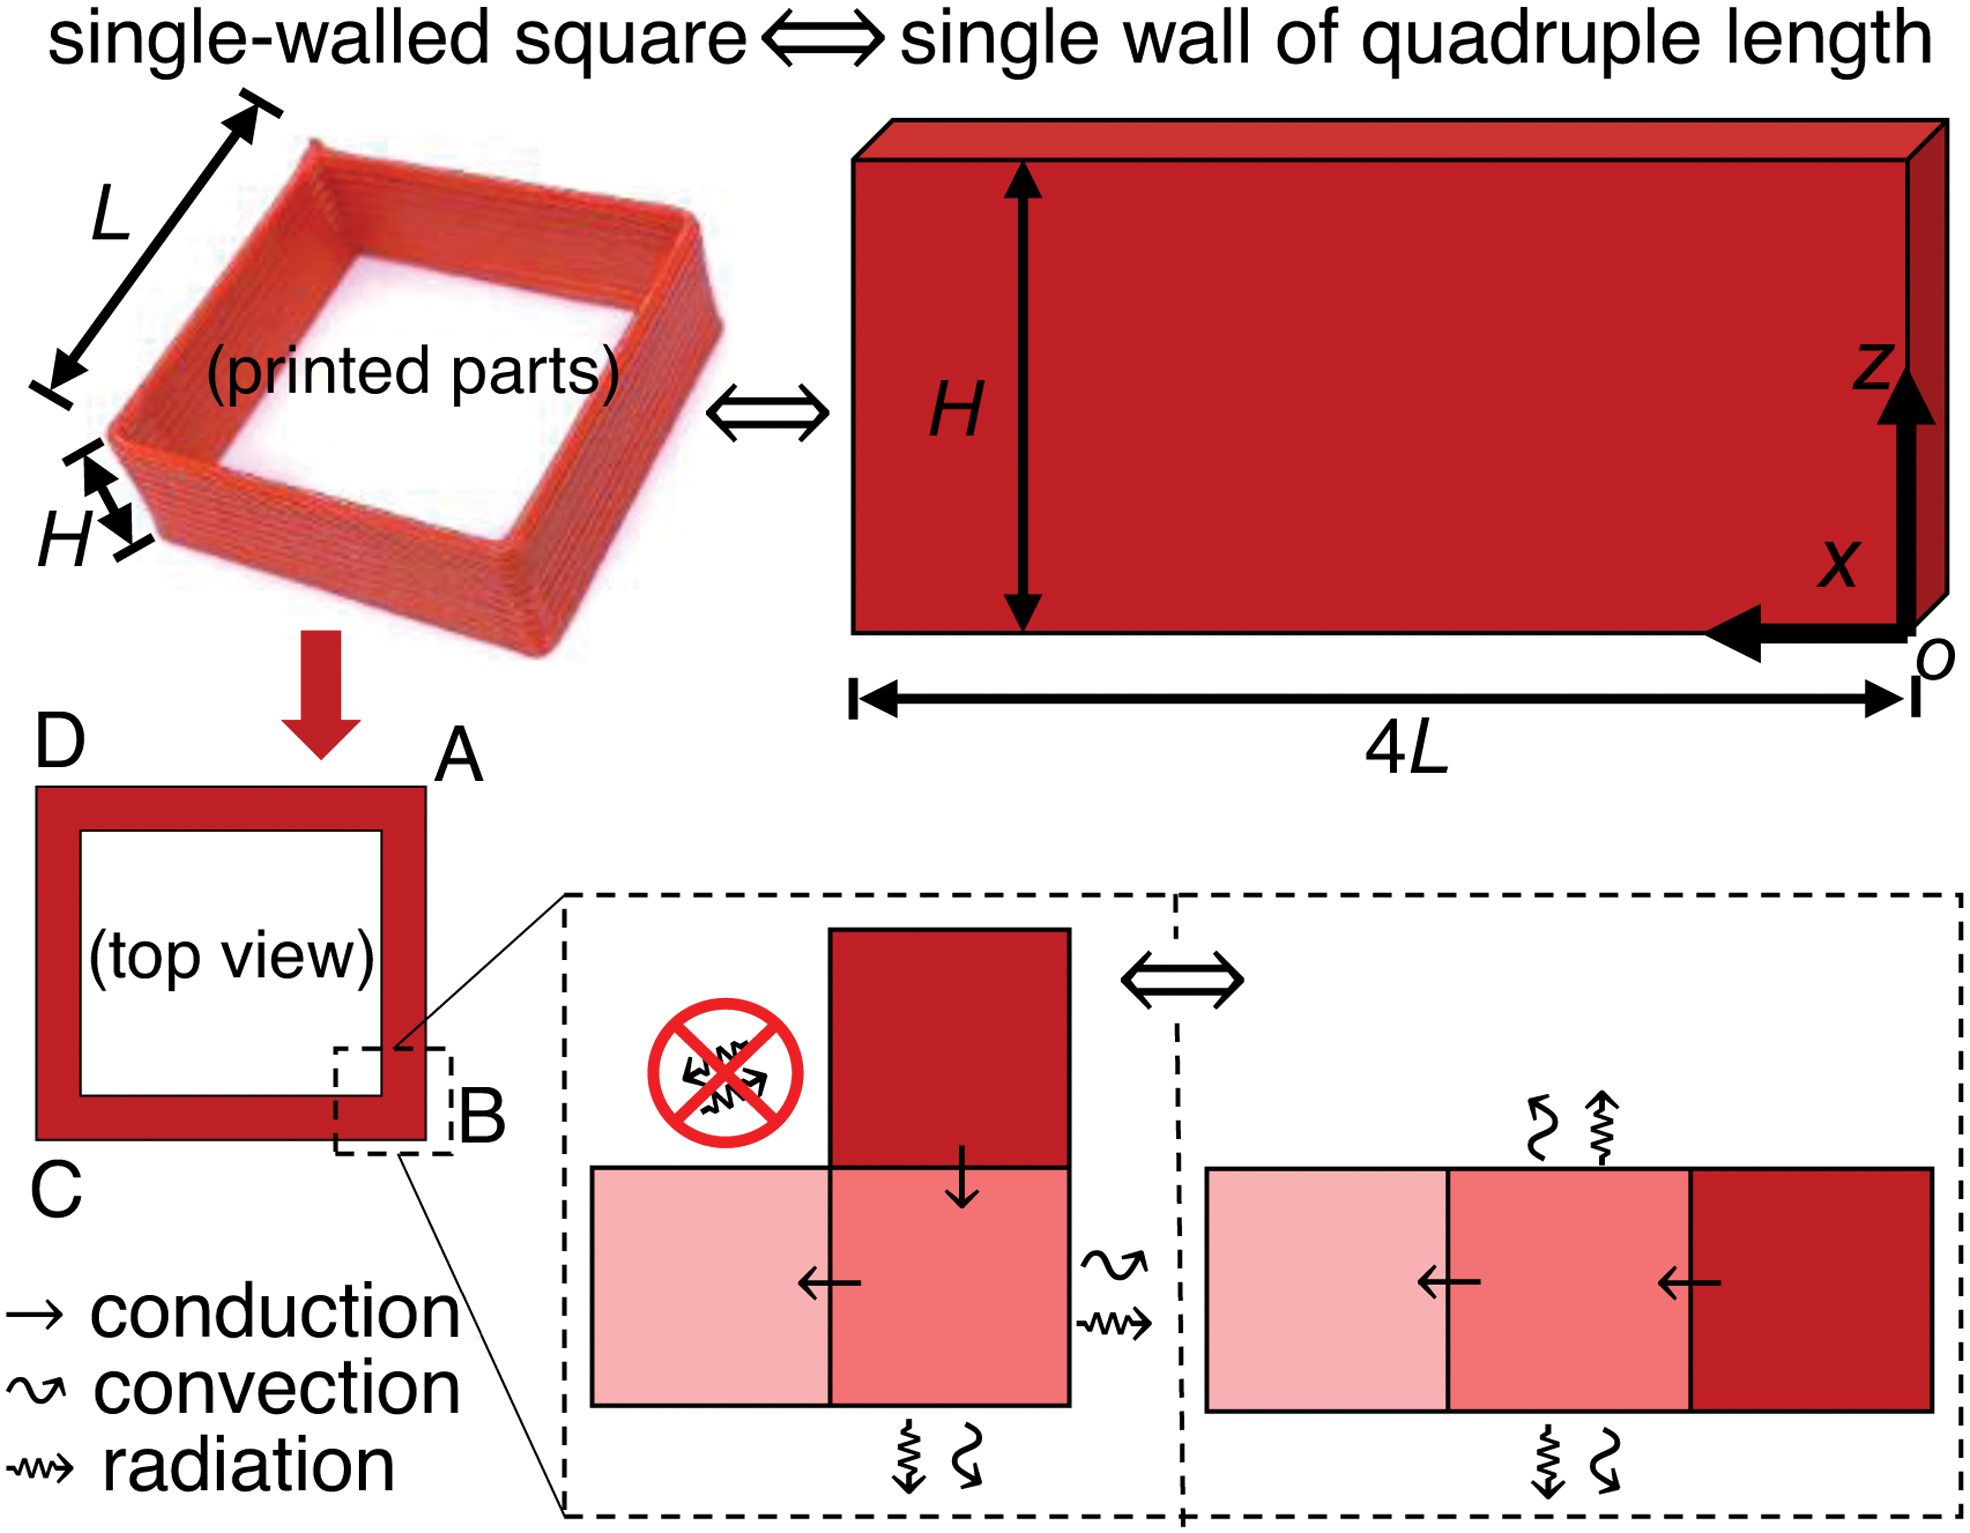
The geometry of the single-walled square in this study. From the perspective of heat transfer mechanisms, the geometry is equivalent to a single wall of a quadruple length in the simulations when the radiant heat transfer between different locations is ignored (drawing not to scale). Color images are available online.
Experiments were conducted at different nozzle traveling speeds v, this being an important parameter in high-throughput printing, which affects not only the printed part quality but also the deliverable maximum volume flow rate. Four flow conditions were investigated in printing samples 1 to 4 at different v (Table 1). Each v determined a designed volume flow rate
Samples, Dimensions, and Process Parameters in Fused Filament Fabrication
where A is the real strand cross-section area. A can be expressed by
where
For comparison, sample 5 of a doubled edge length L
Flow rate investigations
The volume flow rate is a vital efficiency index in FFF. The faster the material flows through the hot-end, the faster the deposition, and the shorter it takes to finish the printing. The limits in the flow rate for the given print head assembly were investigated at different filament feed speeds v0 and nozzle temperatures
In practice, irrespective of
where
Simulations inside the hot-end
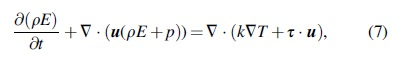
The polymer melt flow, pressure, and heat transfer inside the hot-end fundamentally determine the fused deposition rate and the upper limit in extrusion. These physical fields were solved by a 2D axisymmetric CFD model taking into account conduction, convection, shear heating, and possible slip at wall effects due to high local shear stresses. The hot-end in the model consists of three geometrical parts: (1) a barrel of length l1 and diameter d1, (2) a cone region of length l2 and taper angle
where
The Ansys Fluent (version R 19.0) software was used to solve the coupled CFD model at the steady state. Before the simulation, material properties in Equations (5)–(7) must be available. For PLA, cp and
At the steady state, the polymer melt was assumed to fill the whole barrel and driven by the filament from the cold-end. At the barrel entrance, an adjusted uniform inlet speed
where
Simulation Details and Results Inside the Hot-End
The filament was assumed to enter the barrel at room temperature 25℃. Simulations at higher filament inlet temperature were also conducted, showing negligible impact on the output. The walls in the hot-end (barrel, cone, and capillary) were set isothermal at
where
The extrudate temperature at the nozzle outlet/deposition temperature
where T is the local temperature at the nozzle outlet,
Temperature simulations in printed parts
The same set of transport Equations (5)–(7) were used to describe the physics in the printed parts. When assuming that the velocity
The material properties
The temperature simulation for the printed parts was solved as an initial-boundary value problem for thermal conduction on the changing domain
where h is the convection coefficient,
A boundary-adjusting finite difference method was developed for the simulation. The numerical model is available from the Advanced Manufacturing Lab, 32 by means of which all simulations for printed parts in this work can be reproduced.
Temperature monitoring
An infrared (IR) thermal camera (Optris PI640) was used to monitor the temperature fields and their variations in the printed parts once the polymer melt left the nozzle. In particular, the temperature upon deposition was captured and compared with the CFD simulations. The camera worked in the long-wavelength spectrum range of 7.5–13 μm, and recorded temperature fields at a spatial resolution of 31.25 μm/pixel and a frequency of 32 Hz. The measurement error was ±2℃ or ±2%, whichever was greater.
The field of view was in the center of edge BC (Fig. 3). The temperature assigned at a given location took the arithmetic mean of the temperatures measured on the surrounding 6 × 3 pixels. With this IR camera, the emissivity of the printed PLA
This study is exempt from the institutional review board for approval.
Results and Discussions
The limit in the volume flow rate
Fig. 4a shows the measured volume flow rates
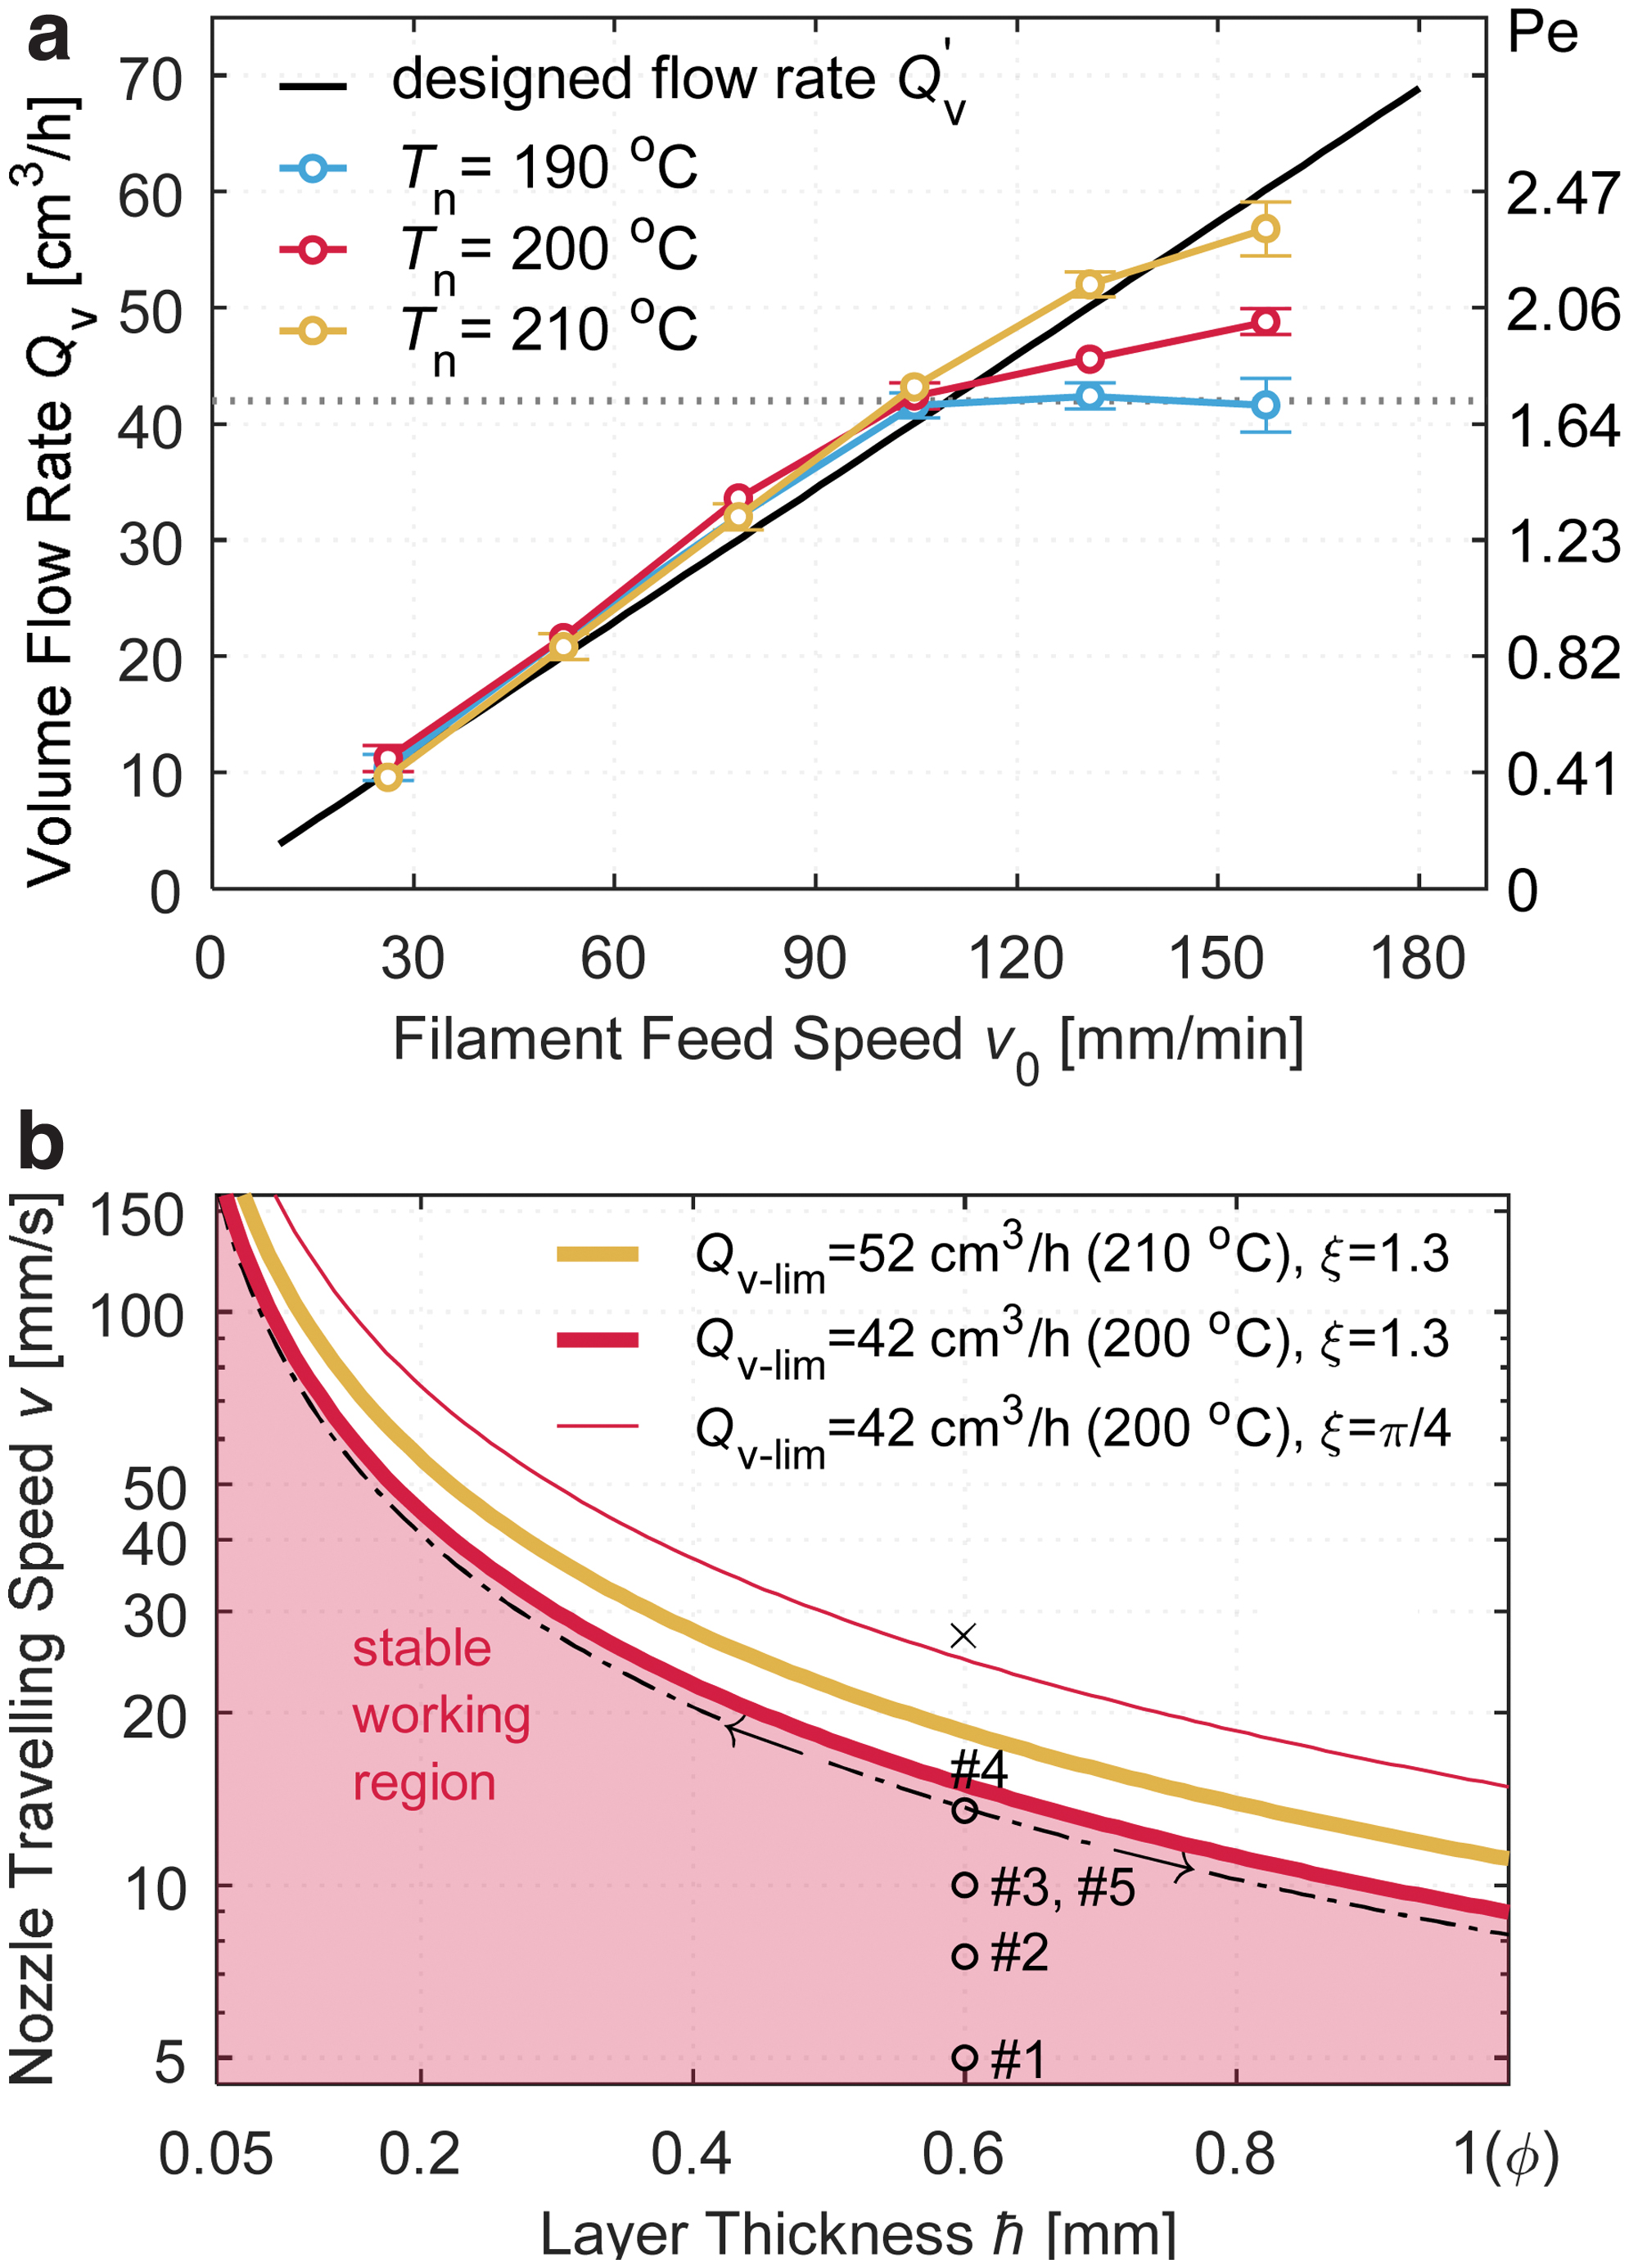
This transition from the stable to unstable polymer melt flow can also be described by the Péclet number [Eq .(8)]. At
Once a
Substituting Equation (2) for the strand cross-section area A, the inequality (13) then suggests the following:
which means that the nozzle traveling speed v and layer height
The limiting
Simulations inside the hot-end
At different volume flow rates
When the stress was integrated over the whole internal surface in the hot-end, the feed force exerted on the filament F was obtained, and is summarized in Table 2. Logically, F increased with the volume flow rate
In the four flow conditions for each sample, the steady-state temperature fields inside the hot-end are shown in Fig. 5a. In all cases, the temperature fields are highly nonisothermal. At the entrance, the temperature was
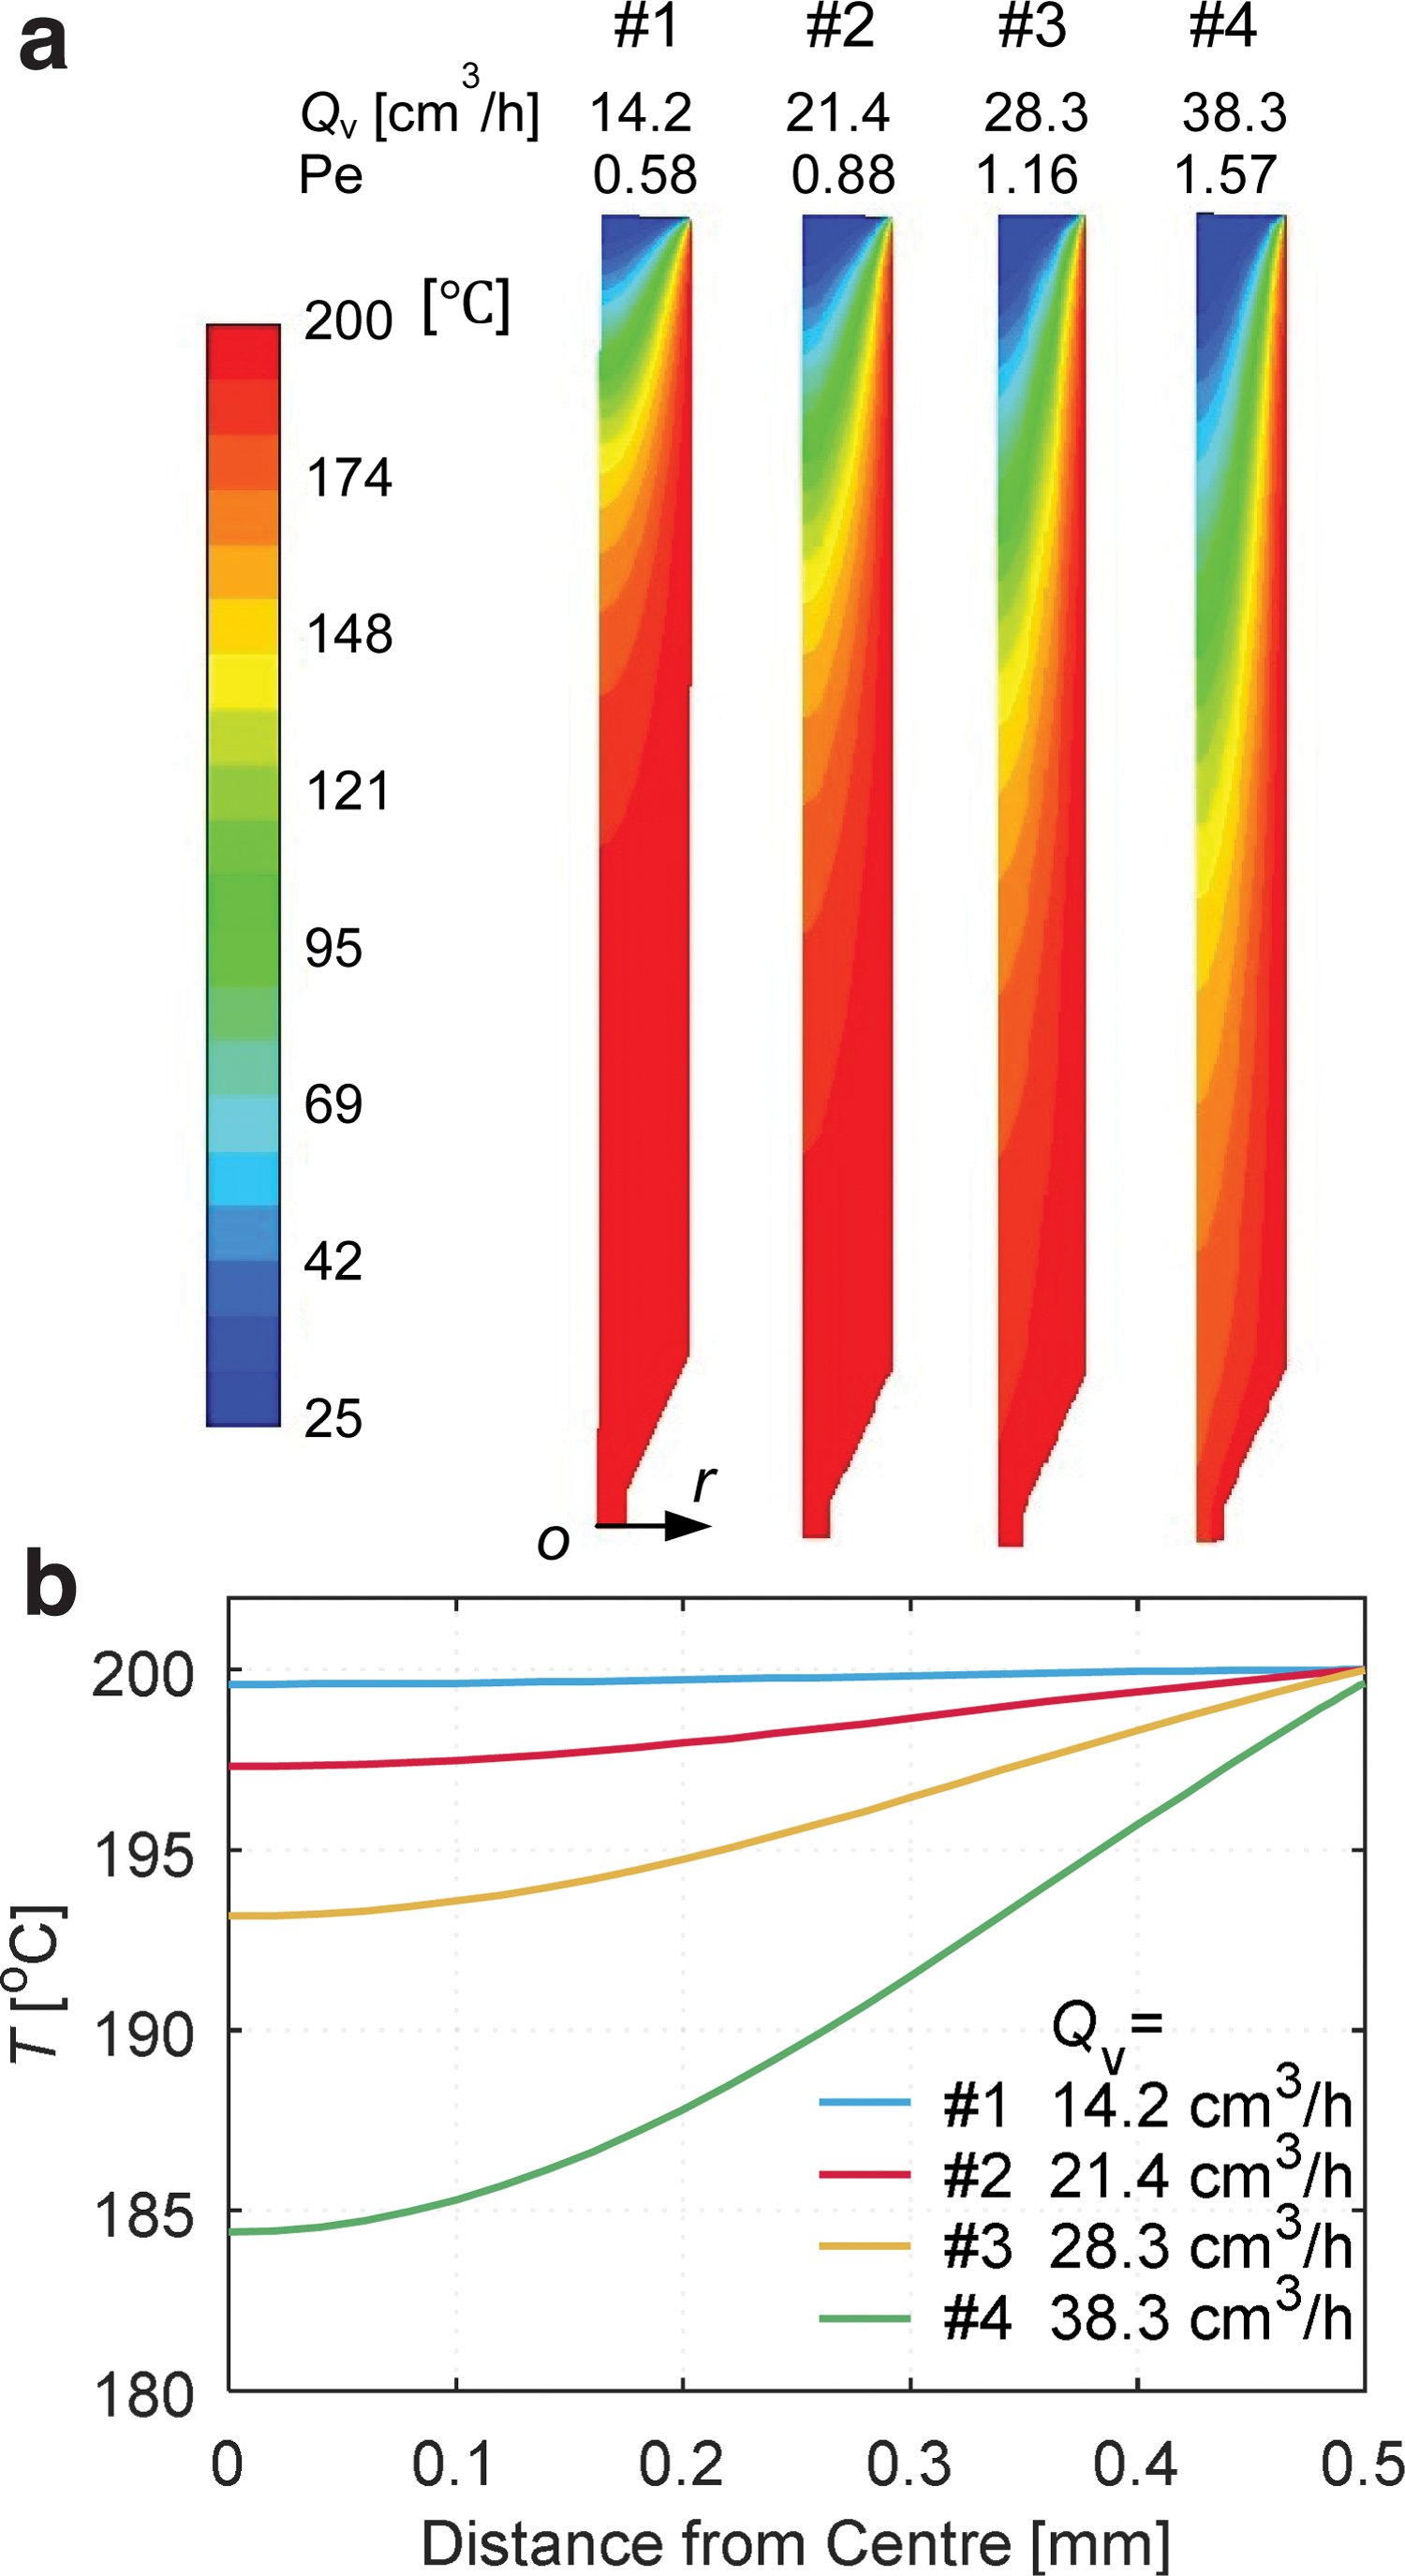
The radial temperature distributions at the nozzle outlet are shown in Fig. 5b. Let
Another characteristic of the temperature field is the maximum temperature gradient intensity,
The profiles in Fig. 5b were used in Equation (10) to calculate the extrudate temperature at the nozzle outlet
These average temperatures at different flow rates were verified by the IR camera when printing different samples: the same trend in the extrudate temperature reduction with increasing volume flow rate was observed. At 14.2 cm3/h (in printing sample 1), the temperature reduction can be ignored (Fig. 6a, b); at 38.3 cm3/h, the absolute difference was 11.0℃. (Considering the emissivity uncertainty in IR camera, the temperature reduction in printing sample 4 was 10.1℃ when compared with sample 1.) The observations partially verified the temperature results from CFD simulations. It is important to note that the extrudate temperature at the nozzle outlet
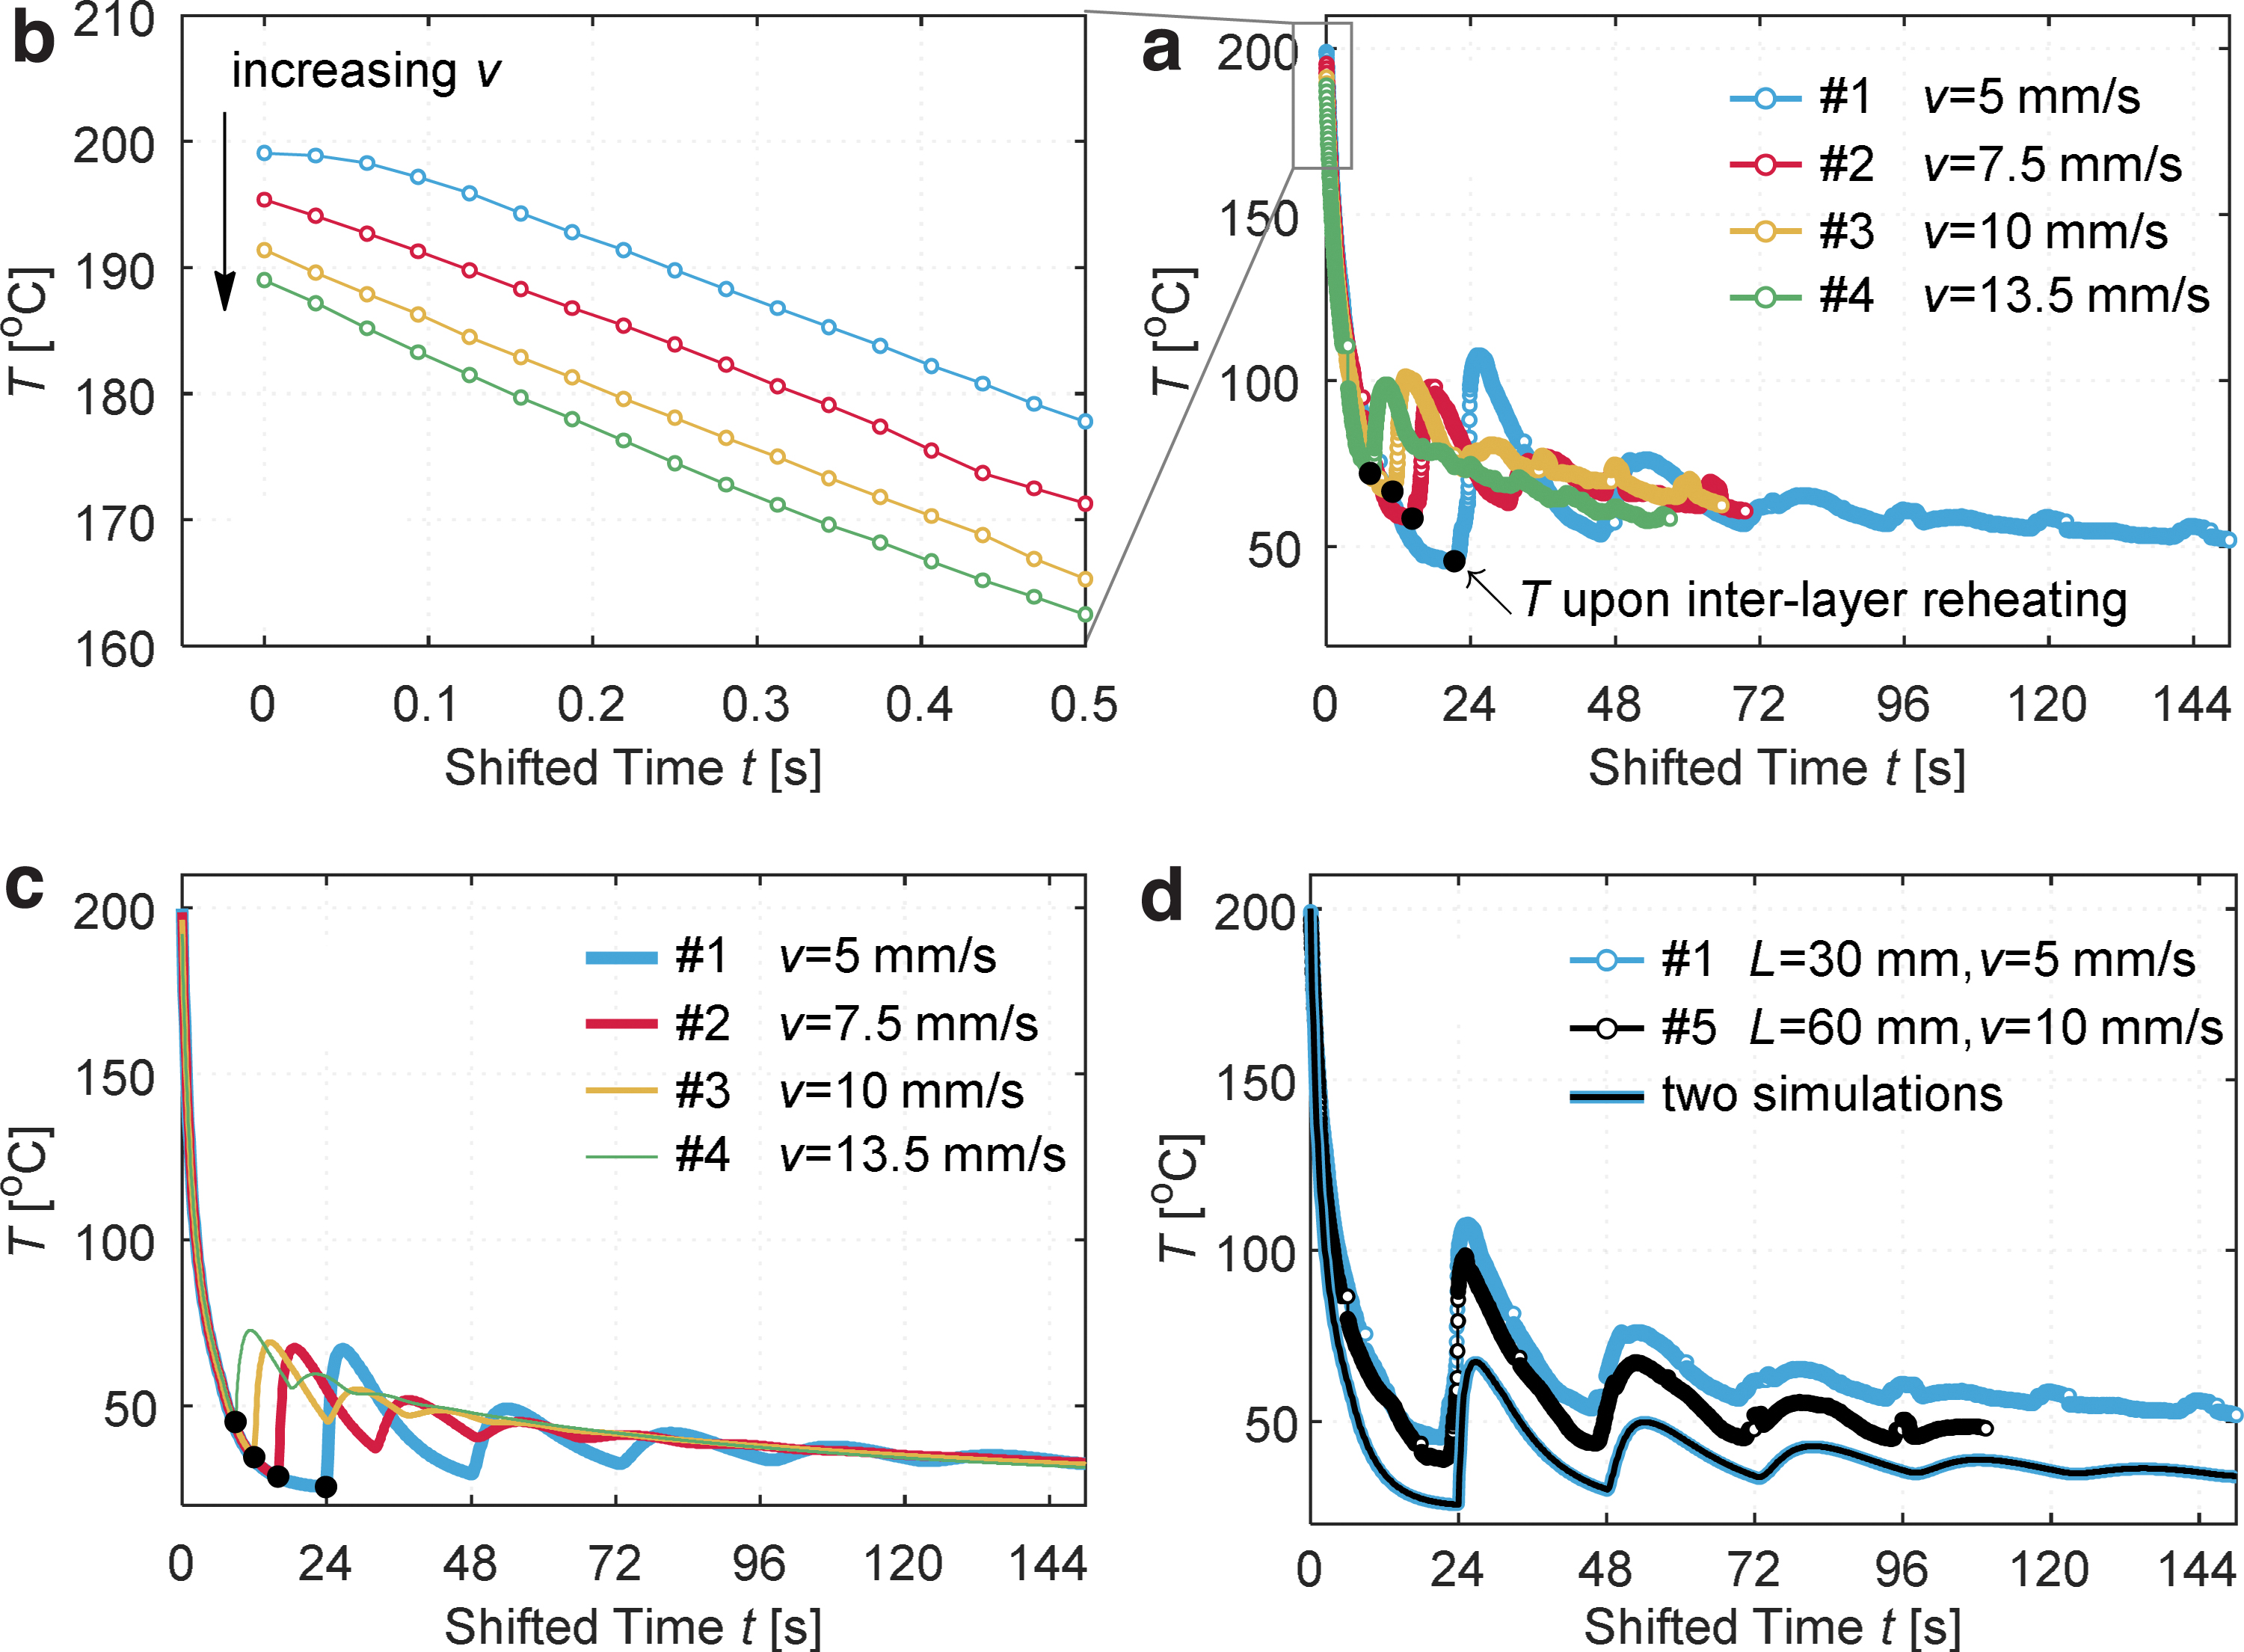
Temporal temperature profiles at different nozzle traveling speeds v.
To conclude hereby, both the feed force and extrudate temperature at the nozzle outlet suggest that nozzle clogging is far from being a problem in this study, which means the limit by nozzle clogging is less useful in guiding process parameter selections compared with the stronger limit by the stable feeding.
Temperature variations in the printed parts
When printing samples 1 to 4 at increasing traveling speeds v, the temperature in the center on edge BC on the second layer (Fig. 2b) was measured, and the corresponding temporal profiles are presented in Fig. 6a on a shifted time line . The time origin takes the deposition time at each chosen location. A magnified part of the profile upon deposition is shown in Fig. 6b, where it is clear that the initial deposition temperature (extrudate temperature at the nozzle outlet
After the deposition, the temperature profiles at different v overlap with each other to a great extent before their respective interlayer reheating. The temperature upon reheating (indicated by black dots in Fig. 6a) is higher at a higher v, because the cooling duration is shorter when the interlayer reheating time
However, certain discrepancies still exist between the monitoring and simulations: the IR readings are slightly higher than the numerical results, which are ascribed to both the monitoring errors and the simulation uncertainties with respect to geometries, process parameters, and material properties. To explain and minimize such discrepancies is off the main theme in this study, but readers can refer to the Advanced Manufacturing Lab 32 for more information.
Apart from the profile overlapping, both the monitoring and simulations strongly imply that, for instance, at the nozzle traveling speed
Fundamentally, neither the thermal conduction, convection, nor radiation depends on v (ignoring the radiant heat gain from the hot-end
36
). Nevertheless, to print a given part, v determines
To verify the postulation that the instantaneous cooling rate is independent of the traveling speed, sample 5 (
Based on these observations, an interlayer time similarity rule is proposed
This rule states that temperature fields in printing two single-walled squares can be identical when the interlayer time is the same. The similarity originates from the independence of local cooling rate on the traveling speed, and can extend to other single-walled geometries. This rule suggests that the cooling in FFF is primarily determined by the thermal boundaries of the deposited strands. Thus, parameters (such as the traveling speed) having no/weak influence over the thermal boundaries should have no/weak influence over the transient cooling before the interlayer reheating. The authors also confirmed this interlayer time similarity rule with different setups in different processes (layer height range from 0.6 to 1.4 mm, volume flow rate range from 14.2 to 302 cm3/h) with different materials (PLA, homemade PLA/Flax fiber filament, homemade PLA/glass fiber filament). 32
In practice, this interlayer time similarity rule shows that temperature information obtained in printing small geometries can be transferred to print big objects, and the traveling speed is not a primary limitation in large-scale printing. Hence, it provides an efficient tool to guide trial-and-error explorations, especially when FFF is controlled by the robot arm to print big objects at high volume flow rates.
Critical insights
An example of scale-up production
According to the interlayer time similarity rule, the nozzle traveling speed could have be raised to
Predict the temperature before printing
Sample 4 of edge length
Conclusions
This article provides a systematic and complete analysis of the temperature development in FFF, from the filament entering the hot-end to the printed parts. A standard E3D print head assembly from a desktop FFF printer was mounted on a robot arm for printing. The setup realized the immediate need for part geometry scalability, but it is not necessarily ideal for scale-up production due to the limit in material throughput. Accordingly, a stable working region of the hot-end was identified with a limit in the volume flow rate for reliable material feeding. This limit sets an upper bound for the nozzle traveling speed at a given layer height. Working at the highest stable volume flow rate guarantees the highest production efficiency, but not necessarily a successful printing, this later being affected by the temporal and spatial temperature variations in the printed parts. With simulations and thermal monitoring, it was also found that at a higher nozzle traveling speed, the temperature became less homogeneous inside the hot-end, and the extrudate temperature deviated further from the nominal nozzle temperature. However, the cooling in the deposited part is intrinsically independent of the traveling speed, as long as comparable thermal boundaries are guaranteed in different processes. Ultimately, an interlayer time similarity rule was formulated for printing single-walled structures, which states that the temperature fields are comparable for processes sharing the same interlayer time. This rule suggests that knowledge obtained in printing small objects can be transferred to print big objects, and thus, it provides direct guidance over scale-up productions.
Footnotes
Authors' Contributions
J.Z.: conceptualization, methodology, formal analysis, investigation, and writing—original draft; E.V.: methodology, formal analysis, investigation, and writing—original draft; A.D.K.: methodology, formal analysis, investigation, and writing—original draft; C.D.S.: methodology, formal analysis, investigation, and writing—original draft; F.V.: funding acquisition, writing—review and editing, and project administration; F.D.: funding acquisition, writing—review and editing, and project administration; E.F.: conceptualization, funding acquisition, writing—review and editing, and project administration.
Data Availability Statement
The numerical model for temperature simulations in the printed parts is available from the Advanced Manufacturing Lab. 32 Other data that support the findings of this study are available from the corresponding authors upon reasonable request.
Author Disclosure Statement
No competing financial interests exist.
Funding Information
Part of the work has been funded by Flanders Innovation & Entrepreneurship in the “RoMuPAM” project (HBC.2018.0013) and by SIM (Strategic Initiative Materials in Flanders) and VLAIO (Flemish government agency Flanders Innovation & Entrepreneurship) in the “Flaminco” project (HBC.2017.0325).
List of Selected Symbols
References
Supplementary Material
Please find the following supplemental material available below.
For Open Access articles published under a Creative Commons License, all supplemental material carries the same license as the article it is associated with.
For non-Open Access articles published, all supplemental material carries a non-exclusive license, and permission requests for re-use of supplemental material or any part of supplemental material shall be sent directly to the copyright owner as specified in the copyright notice associated with the article.