
Abstract
Abstract
Three-dimensional (3D) printing of biomaterials has the potential to become an ecologically advantageous alternative compared with conventional manufacturing based on oil-derived polymer materials. In this study, a novel 3D printing technology is applied that combines ultraviolet (UV) curing with paste extrusion. This hybrid manufacturing technique enables the fabrication of complex geometries from high filler-ratio pastes. The developed biocomposite aims for suitable mechanical properties in terms of tensile and compressive strength. It is composed of acrylic acid, cellulose acetate, α-cellulose, and fumed silica with a cellulose ratio of more than 25 vol-%. The material is extruded with an in-house-developed 3D printer equipped with a 12 W UV light curing source, which enables concurrent curing and extrusion. Two different UV-curing strategies were tested: postcuring without concurrent curing and postcuring with concurrent curing. The total UV-curing duration was kept constant with all samples. Tensile testing in accordance with ASTM standard D638-14 Type 4, compression testing according to ASTM D695-15, and overhang tests were conducted. As a result, samples without notable shrinkage, suitable tensile strength (up to 17.72 MPa), competitive compression testing parameters (up to 19.73 MPa), and an enhanced overhang angle (increase of more than 25°) were produced, leading to new applications and more freedom in design due to higher possible unsupported overhangs when using UV-curing during the print. Overall, constant UV light radiation during the print leads to improved mechanical properties due to the possibility of bypassing the UV-penetration depth constraint. It should be considered when extruding photopolymer-based composites, especially for large and complex components with a low degree of translucency.
Introduction
The application of photopolymers in additive manufacturing (AM) was investigated in the 1980s by analyzing the interaction between ultraviolet (UV) curable materials and lasers to achieve cross-linking of scanned areas. 1 Today, photopolymers are in widespread use in the AM process groups: vat photopolymerization (e.g., stereolithography [SLA], digital light processing [DLP]) and material jetting. 2 In general, SLA machines are equipped with a laser, which scans each layer in a predefined pattern, whereas DLP uses light from a projector to cure the entire layers directly. In both processes, a light source selectively solidifies a photopolymeric material contained in a vat. Such an approach typically requires support structures to sustain generated overhangs of more than 45° for outer and inner structures. This limits geometries as well as reduces the material efficiency of the process, which can lead to a greater environmental impact from manufacturing as well as increased costs. The operating principle of material jetting is different, part and support material is ejected through numerous tiny print nozzles, and UV-curing occurs instantly after ejection. All mentioned processes are already widely used in industry for prototyping and the production of end-use parts, displaying evolving production processes with high-feature resolutions and promising manufacturing lead times. 3 In addition, they can be used for polymer matrix composites.4,5
Cellulose can be selected to produce a variety of feedstocks that are suitable for AM. Typically, three categories of cellulose materials are distinguished: derivatives, regenerated cellulose, and native cellulose. Materials from each category have been utilized in AM either by printing the cellulose material exclusively or by processing it as an additive.
Derivatives such as cellulose acetate (CA) and carboxymethyl cellulose (CMC) are ubiquitous and present in various applications ranging from packaging to pharmaceuticals. Although CA is melt processable, it can also be dissolved in acetone for paste extrusion (PE)-based three-dimensional (3D) printing. 6 In the context of AM, CMC facilitates the production of 3D-printable inks with tunable rheology. This approach has been used to produce conductive biocomposite structures. 7 Alternatively, pure cellulosic structures can be 3D printed by dissolution and subsequent regeneration. As an example, Markstedt et al. dissolved cellulose with ionic liquids to produce inks that are suitable for biofabrication. 8
Native cellulose fibers are predominantly processed as diluted aqueous slurries or suspensions, as they are not melt processable on their own. For such materials, the direct ink writing (DIW) approach is utilized, in which pneumatic-, piston-, or screw-based forces need to be applied to extrude biomaterials in a controlled manner. 9 Various micro- and nanocelluloses that are suitable for biofabrication have been intensively researched in the context of DIW cellulose constructs. Despite the shape accuracy as wet structures, native cellulose fiber constructs typically lose structural integrity unless they are freeze-dried. 10 Although freeze-drying preserves the shape, it results in high porosity and poor mechanical properties. 11
Because of the remarkable tensile properties of cellulose fibers, their use as a reinforcing additive in AM has also been investigated. Cellulose fibers represent an abundant and low-cost resource, which encourages research of large-scale 3D printing applications. Recently, Sanandiya et al. combined cellulose with another abundant biopolymer, chitosan, to produce lightweight biopolymer composite structures at a low cost (∼2 $/kg). 12 From a commercial side, polylactic acid filaments for fused filament fabrication (FFF) are the most commonly used biopolymer in 3D printing, to which wood particles can be added. 9 Although cellulosic fibers exhibit notable tensile properties on their own, they suffer from poor interfacial adhesion when combined with other polymers. This effect results in improvable mechanical properties of the composite structures, on which significant research efforts have been conducted to improve interfacial adhesion issues by various surface modifications.13,14
One effective solution to overcome structural integrity issues when drying can be seen in the utilization of UV-light during the print, an approach that is even used in 4D printing applications to cure hydrogel composite inks.9,15
However, the implementation of UV cross-linking has not been fully investigated for other AM processes such as the most popular 3D printing techniques of FFF16–18 or PE (also known as DIW or robocasting), in particular not for bio-composites. Successful attempts have been made to 3D print with hyaluronic acid hydrogels with secondary cross-linking as well as to print, crystallize, and cross-link graphene/poly(trimethylene carbonate) composites.19,20 In the field of pharmaceutics, polydimenthylsiloxane devices were printed by PE and UV cross-linked. 21 Further research was conducted by mixing an industrial resin with fumed silica and UV-curing the samples during the print with 1 W, obtaining tensile strengths of more than 20 MPa. 22 In another study, zirconia nanoparticles were added to commercially available UV-curable resins, extruding and UV-curing components before sintering them. 23 There is a vast array of material extrusion or paste-based extrusion systems demonstrated in the literature,24–28 including a number of open-source systems.29–31 In addition, there are ready-made commercial UV PE systems for large-scale composites. 32 Unlike FFF, PE is based on the layer-by-layer extrusion of moldable pastes. Adding a photoinitiator to extrusion materials provides the opportunity to produce geometries out of any powder material by trapping the powder with cured photopolymers or by supporting the cross-linking of the powder itself. Applying the photo-curing PE approach, freedom in fillers is considered an advantage, especially when focusing on filler materials that cannot be added to resins in SLA or as powders in selective laser sintering. In addition, UV-assisted PE potentially prevents collapse during the print, may allow larger overhang angles, and, hence, lead to more freedom in design, making complex internal structures possible. To probe these potential advantages, this study develops a new biocomposite and tests it using a comparison of different UV-curing strategies, aiming for a high wood content and robust tensile and compressive testing values.
Materials and Methods
Materials used for fabrication
α-Cellulose powder (particle size ∼50 μm in diameter and ∼200 μm in length; Sigma Aldrich), CA (average Mn 30,000 g/mol; Sigma Aldrich), fumed silica (Aerosil 200; Degussa, Germany), and acrylic acid (AA, 200 ppm MEHQ as the inhibitor; Sigma Aldrich, 99%) represent the main constituents of the generated pastes, shown in Table 1. Ethyl(2,4,6-trimethylbenzoyl)-phenyl phosphinate (Omnirad TPO-L; IGM) is used as the photoinitiator. The α-cellulose powder was dried at 120°C for 48 h before utilization, and all other chemicals were used as received. CA was dissolved in AA by applying a mechanical mixer system (100-mL glass reactor equipped with a Teflon plate mixer). The adequate dissolution was generated after 24 h at room temperature (RT). The final resin was prepared by mixing all reagents (CA/AA solution, α-cellulose powder, fumed silica, photo initiator) in a counter-rotating Brabender Plasti-Corder PLE 651 batch mixer (volume of 50 cm3) for 45 min with 25 rpm at RT. After mixing, the resin was directly filled into the printing syringes and protected from light by covering it with aluminum foil.
Resin Composites in Vol-% (Weight-% in Parentheses). In Addition, 0.5 WT-% of TPO-L is Used as the Photoinitiator
AA, acrylic acid; CA, cellulose acetate.
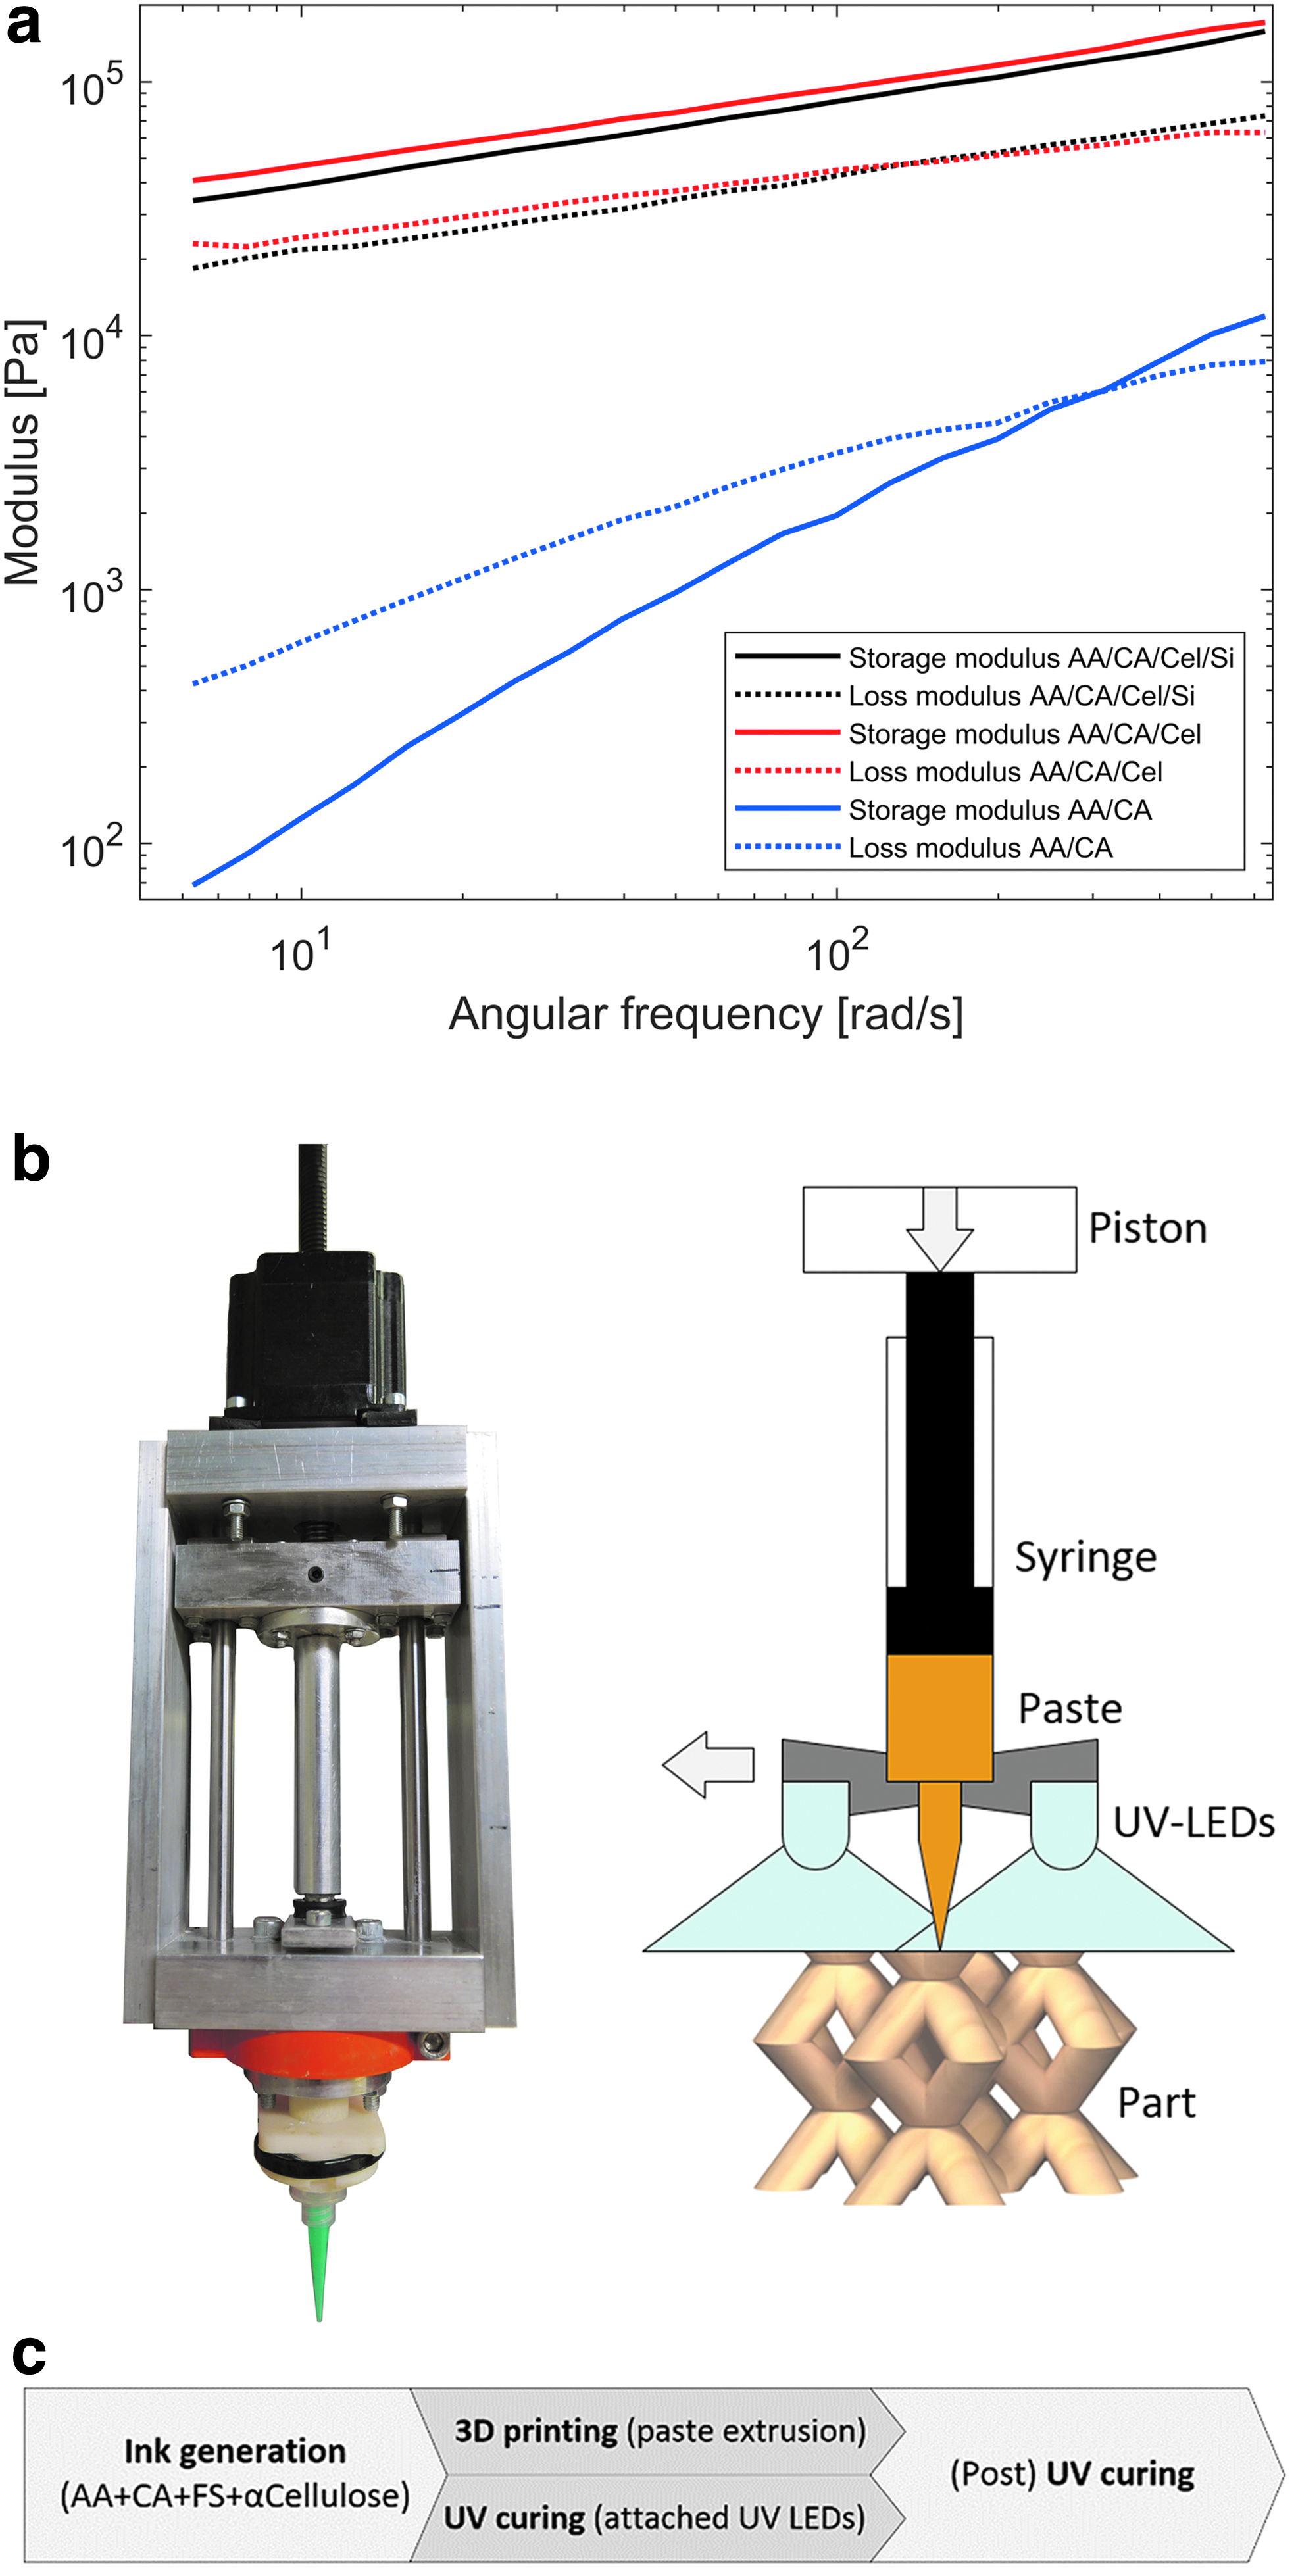
To support the decision-making process to select the most suitable resin for PE, rheological measurements were carried out with a stress-controlled rheometer (AR-G2; TA Instruments) at 22°C by using a parallel plate-plate geometry with a 1000 μm gap. The oscillatory measurements were conducted at 0.01% strain with a frequency range of 1–100 Hz. As shown in Figure 1a, the rheological behavior of the AA/CA resin (Resin A) shows clearly that the loss modulus is higher than the storage modulus (G″>>G′), especially at low shear rates. This indicates that this resin type is not able to maintain its shape after being extruded from the nozzle, and therefore is not suitable for PE. By adding solid α-cellulose powder, the rheological behavior of the resin is modified to favor PE (Resin B, G′>G″ over the measured shear rate area). However, in this case, problems occur in printing as the α-cellulose powder starts to agglomerate at the nozzle, which leads to clogging. By replacing a share of α-cellulose powder with fumed silica, the agglomeration phenomenon is reduced. At the same time, the rheological behavior of the resin (Resin C vs. B) is not influenced negatively. This behavior could be expected as the overall volume fraction of the solid particles (α-cellulose powder and fumed silica) in the resin remains the same, staying on a constant level of 19.3%. The absence of the agglomeration formation in the printing of Resin C cannot be explained solely by referring to smaller particle sizes of fumed silica (α-cellulose powder 50 μm in diameter and 200 μm in length versus fumed silica primary particles of ∼12 nm 33 ). The primary particle size of fumed silica is in the range of nanometers, but the majority among them usually appear in larger aggregates in the range of 4–200 μm 34 (Aerosil 200 dry size 20 μm, distribution 2–100 μm). 35 All mentioned pastes were applied for printing and the combination of AA/CA/α-cellulose/fumed silica (Resin C) was selected for experiments, because of high-dimensional printing accuracy, the ability to extrude with suitable pressure levels between 2 and 5 bars, and the reduction of clogging. This material contains a cellulose ratio of 27.9 vol-%, composed of the cellulose share in the CA and the α-cellulose fibers.
Printing
Samples were printed with a purpose-built modular PE test platform. The platform comprises two mechatronic subsystems; the printer frame performing the Cartesian motion and a custom extruder. The frame is a table-top CNC system (Stepcraft, Germany), which facilitates precise Cartesian motion of the extruder via stepper motor-driven screw mechanisms. In addition, the frame is equipped with a standard Ø 43-mm tool holder that enables robust and facile fastening of the extruder. The stock open-source control electronics of the printer frame were replaced with a RAMPS1.4 36 connected to an Arduino Mega 37 development board running the Marlin firmware. 38 As shown in Figure 1b, in which a photograph and the operating scheme of the extruder head is presented, the extrusion is accomplished with a syringe-type extruder, that is, the flow is produced with the linear motion of a syringe piston. The extruder accepts standard 10 mL luer lock syringes (Henke Sass Wolf, Germany). To avoid errors resulting from buckling and elastic deformation of the plastic syringe piston, it was replaced by an aluminum version with an equivalent gasket geometry at the tip. The custom extruder utilizes a linear stepper motor (OMC Stepperonline, China) to actuate the syringe piston. A miniature load cell (S2TECH) was installed between the linear stepper motor screw and the syringe piston. This enables measurement of the extrusion pressure without contacting the extrudate. Naturally, the load cell readings are influenced by the friction between the syringe gasket and the wall. Nonetheless, this measurement enabled closed-loop control based on the actuation force as well as monitoring of the extrusion pressure during printing. The linear stepper motor was operated in a micro stepping mode (1/16). It is well known that, although microstepping increases the stepping resolution, it also severely reduces torque. This reduction typically results in inaccurate actuation of the stepper motor at higher loads. To combat this, the linear movement of the stepper motor was measured separately with a magnetic linear encoder (Renishaw, United Kingdom). The linear movement was controlled with a closed-loop proportional-integral-derivative control scheme. To couple the extruder's control with the gcode, the extruder motor control signal from the RAMPS1.4 board was captured with the data acquisition device (DAQ) and used in the extrusion control algorithm. The extruder was controlled and measured with a National Instruments DAQ and Labview. It can be operated at either a constant speed or a constant force mode. The gcode for the printing trials was generated based on STL models with the Slic3r software. 39 The communication between the printer and the host computer is based on Pronterface. 40 The maximum print platform area amounts to 25 cm for each dimension in a rectangular shape, and the defined print area is restricted to a Ø 150-mm circular bed shape. The UV intensity of the four UV LEDs amounts to a power consumption of 12 W, having a wavelength of 395 nm. The power source supplies 12 V, and the UV intensity can be modified through a potentiometer. In Table 2, applied software of the PE test platform and specific print settings are described. The UV-curing duration is kept constant to allow an exposure time-related comparison of samples using UV-curing during the print and applying UV-curing only after the print, 30 min in total for the tensile bars and the compression testing cylinders. For postcuring, a curing station (Form Cure, Formlabs) with an LED power consumption of 39 W (9.1 W radiant power) and a wavelength of 405 nm is used, disabling the chamber curing temperature mode. To allow a simple removal of the component from a build plate, all samples were printed on a fine metal mesh, which is preventing full UV-curing from the bottom. The general printing principle is described in Figure 1c, starting with the preparation of the ink, followed by the printing with or without UV-curing during the print and finally the (post)-curing of all samples.
Print Settings and Applied Software
UV, ultraviolet.
Testing
Tensile testing was conducted according to the ASTM standard D638-14 Type 4 using an Instron 4204 Universal Tensile Tester device with a load cell of 1 kN. Five tensile bars processed with UV-curing during the print and five tensile testing bars with UV-curing after the print were manufactured. Compression testing was performed in accordance with ASTM D695-15; five cylinders each (curing during the print and curing only after printing) were prepared for compression testing, using an Instron 4204 Universal Tensile Tester machine with a 5 kN load cell. To 3D scan tensile testing bars, an Atos core 3D scanner is used (GOM, Germany). Thermogravimetric analysis (TGA Q500; TA Instruments) was conducted to estimate the AA residue in the printed cylindrical samples (from the surface and in the center of the sample) as well as to outline the degradation temperatures of the different phases. Analyzed samples had an initial weight of ∼10–20 mg and were heated up to 600°C (10°C/min) under nitrogen atmosphere with a purge rate of 60 mL/min. The drop of the sample weight during measurements was recorded and expressed in deriv. weight (%/min) as well as in relative weight loss versus temperature.
Fourier-transform infrared spectroscopy (FTIR Unicam Mattson 3000; PIKE GladiATR) was applied to analyze the curing rate. An uncured resin sample was flattened over the attenuated total reflectance diamond after it was exposed to blue light (at an intensity of 30 mW/cm2). After light exposure, 16 FTIR scans were recorded. The exposure time was varied, and the curing degree was estimated based on the intensity of the double-bond vibrations at 1618 and 1635 cm−1. For scanning electron microscopy (SEM) sample preparation, the high-vacuum coater EM ACE600 (Leica, Germany) is used to sputter the tensile bars. Consequently, these samples are analyzed in a Σigma VP (Zeiss, Germany) SEM device to capture high-resolution images of the cross-sections of printed tensile bars to compare the material when applying different UV-curing strategies.
Results
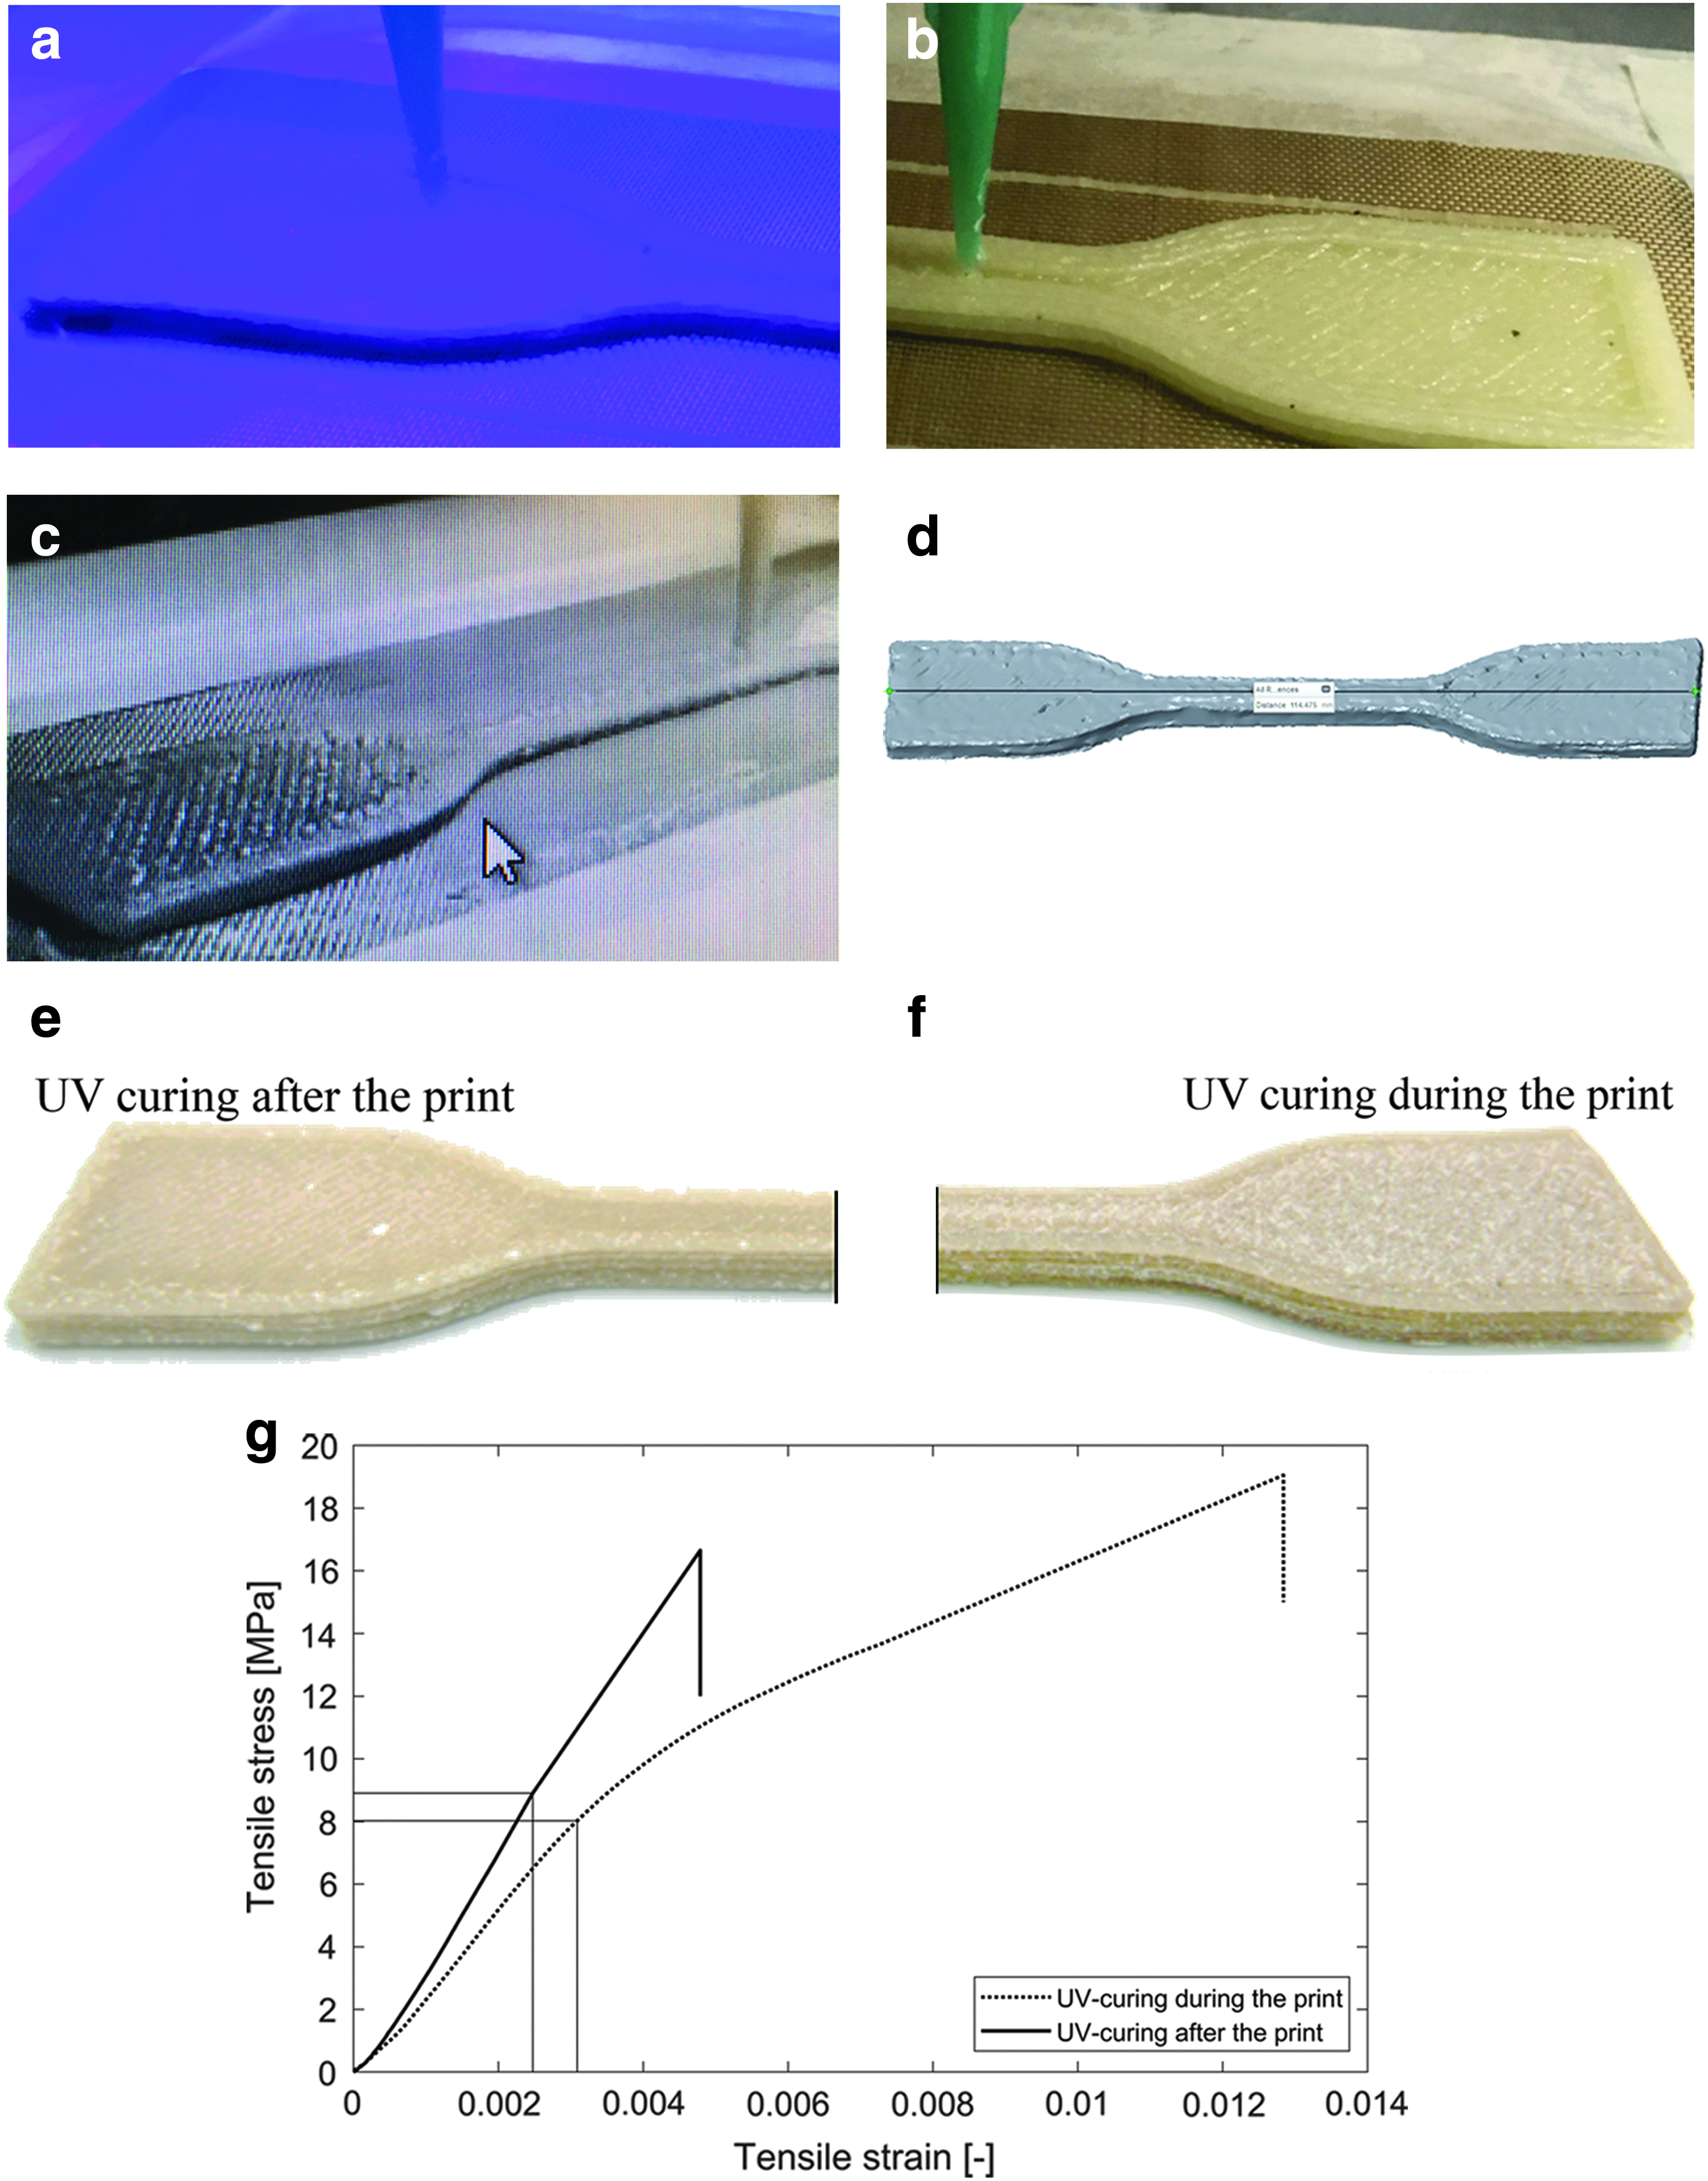
Several general characteristics were observed when printing the 10 tensile testing bars with UV light (Fig. 2a) and without UV light (Fig. 2b) during the print (Fig. 2c shows a print through a video recording system without UV light for improved monitoring reasons). First, less extrusion material is needed when applying UV light during the print, because the material/layers collapse less and the generated layers stay in their shape. If the extrusion rate is too high, clogging of the nozzle occurs. For this reason, the piston speed is set at 0.022 mm/s for continuous UV-curing and at 0.024 mm/s for UV-curing after the print. Moreover, the travel path of the nozzle has to be modified for each component; hence, the generated g-code of the Slic3r software cannot be applied directly. If already cured material is positioned on the present layer (e.g., due to travel paths for the following layer), the nozzle gets blocked. Another observation is linked to the UV light intensity; excessively intense UV-curing exposes the print unevenly. Consequently, the print deforms on only one side, which leads to significant deformations and potentially adverse effects on tensile and compressive properties. A main advantage of UV-curing is related to the dimensional accuracy of obtained samples. Only negligible shrinkage occurs as demonstrated in Figure 2d, which shows a tensile bar with a length of 114.475 mm, in accordance with the desired 115 mm. Width and height of this tensile bar amount to 18.90 and 3.93 mm (compared with 19 and 4 mm according to the ASTM standard); the width of the narrow section is 5.96 mm (compared with 6 mm). This observation accounts for all printed samples; however, the main focus in this study is not the evaluation of their dimensional accuracy. Visually (Fig. 2e–f), printed components with different curing strategies do not differ much from each other; however, the fumed silica particles are more visible in the case of UV-curing during the print.
Tensile testing
Summarized averages of tensile stress-strain curves are shown in Figure 2g. Numerically, Table 3 shows the stress, load, and elongation (all at break) averages and their standard deviation. The tensile stress average of samples with UV-curing during the print are slightly higher than the average of UV-curing after the print, 17.72 ± 4.83 MPa compared with 16.66 ± 3.50 MPa. The elongation of tested samples is significantly higher when applying UV light during the print, 1.28% ± 0.34% versus 0.48% ± 0.035%.
Tensile Testing Stress, Load, and Elongation at Break
The deviations in load are linked to the varying cross-sectional areas of tested samples. Calculating the E-modulus of the tensile bars results in E = 2667 MPa (UV-curing during the print) and E = 3520 MPa (UV-curing after the print), pointing out major differences. According to the gathered results, samples with UV-curing during the print show a significantly higher plastic deformation than samples with UV-curing only after the print, explaining presented E-modulus values.
Compression testing
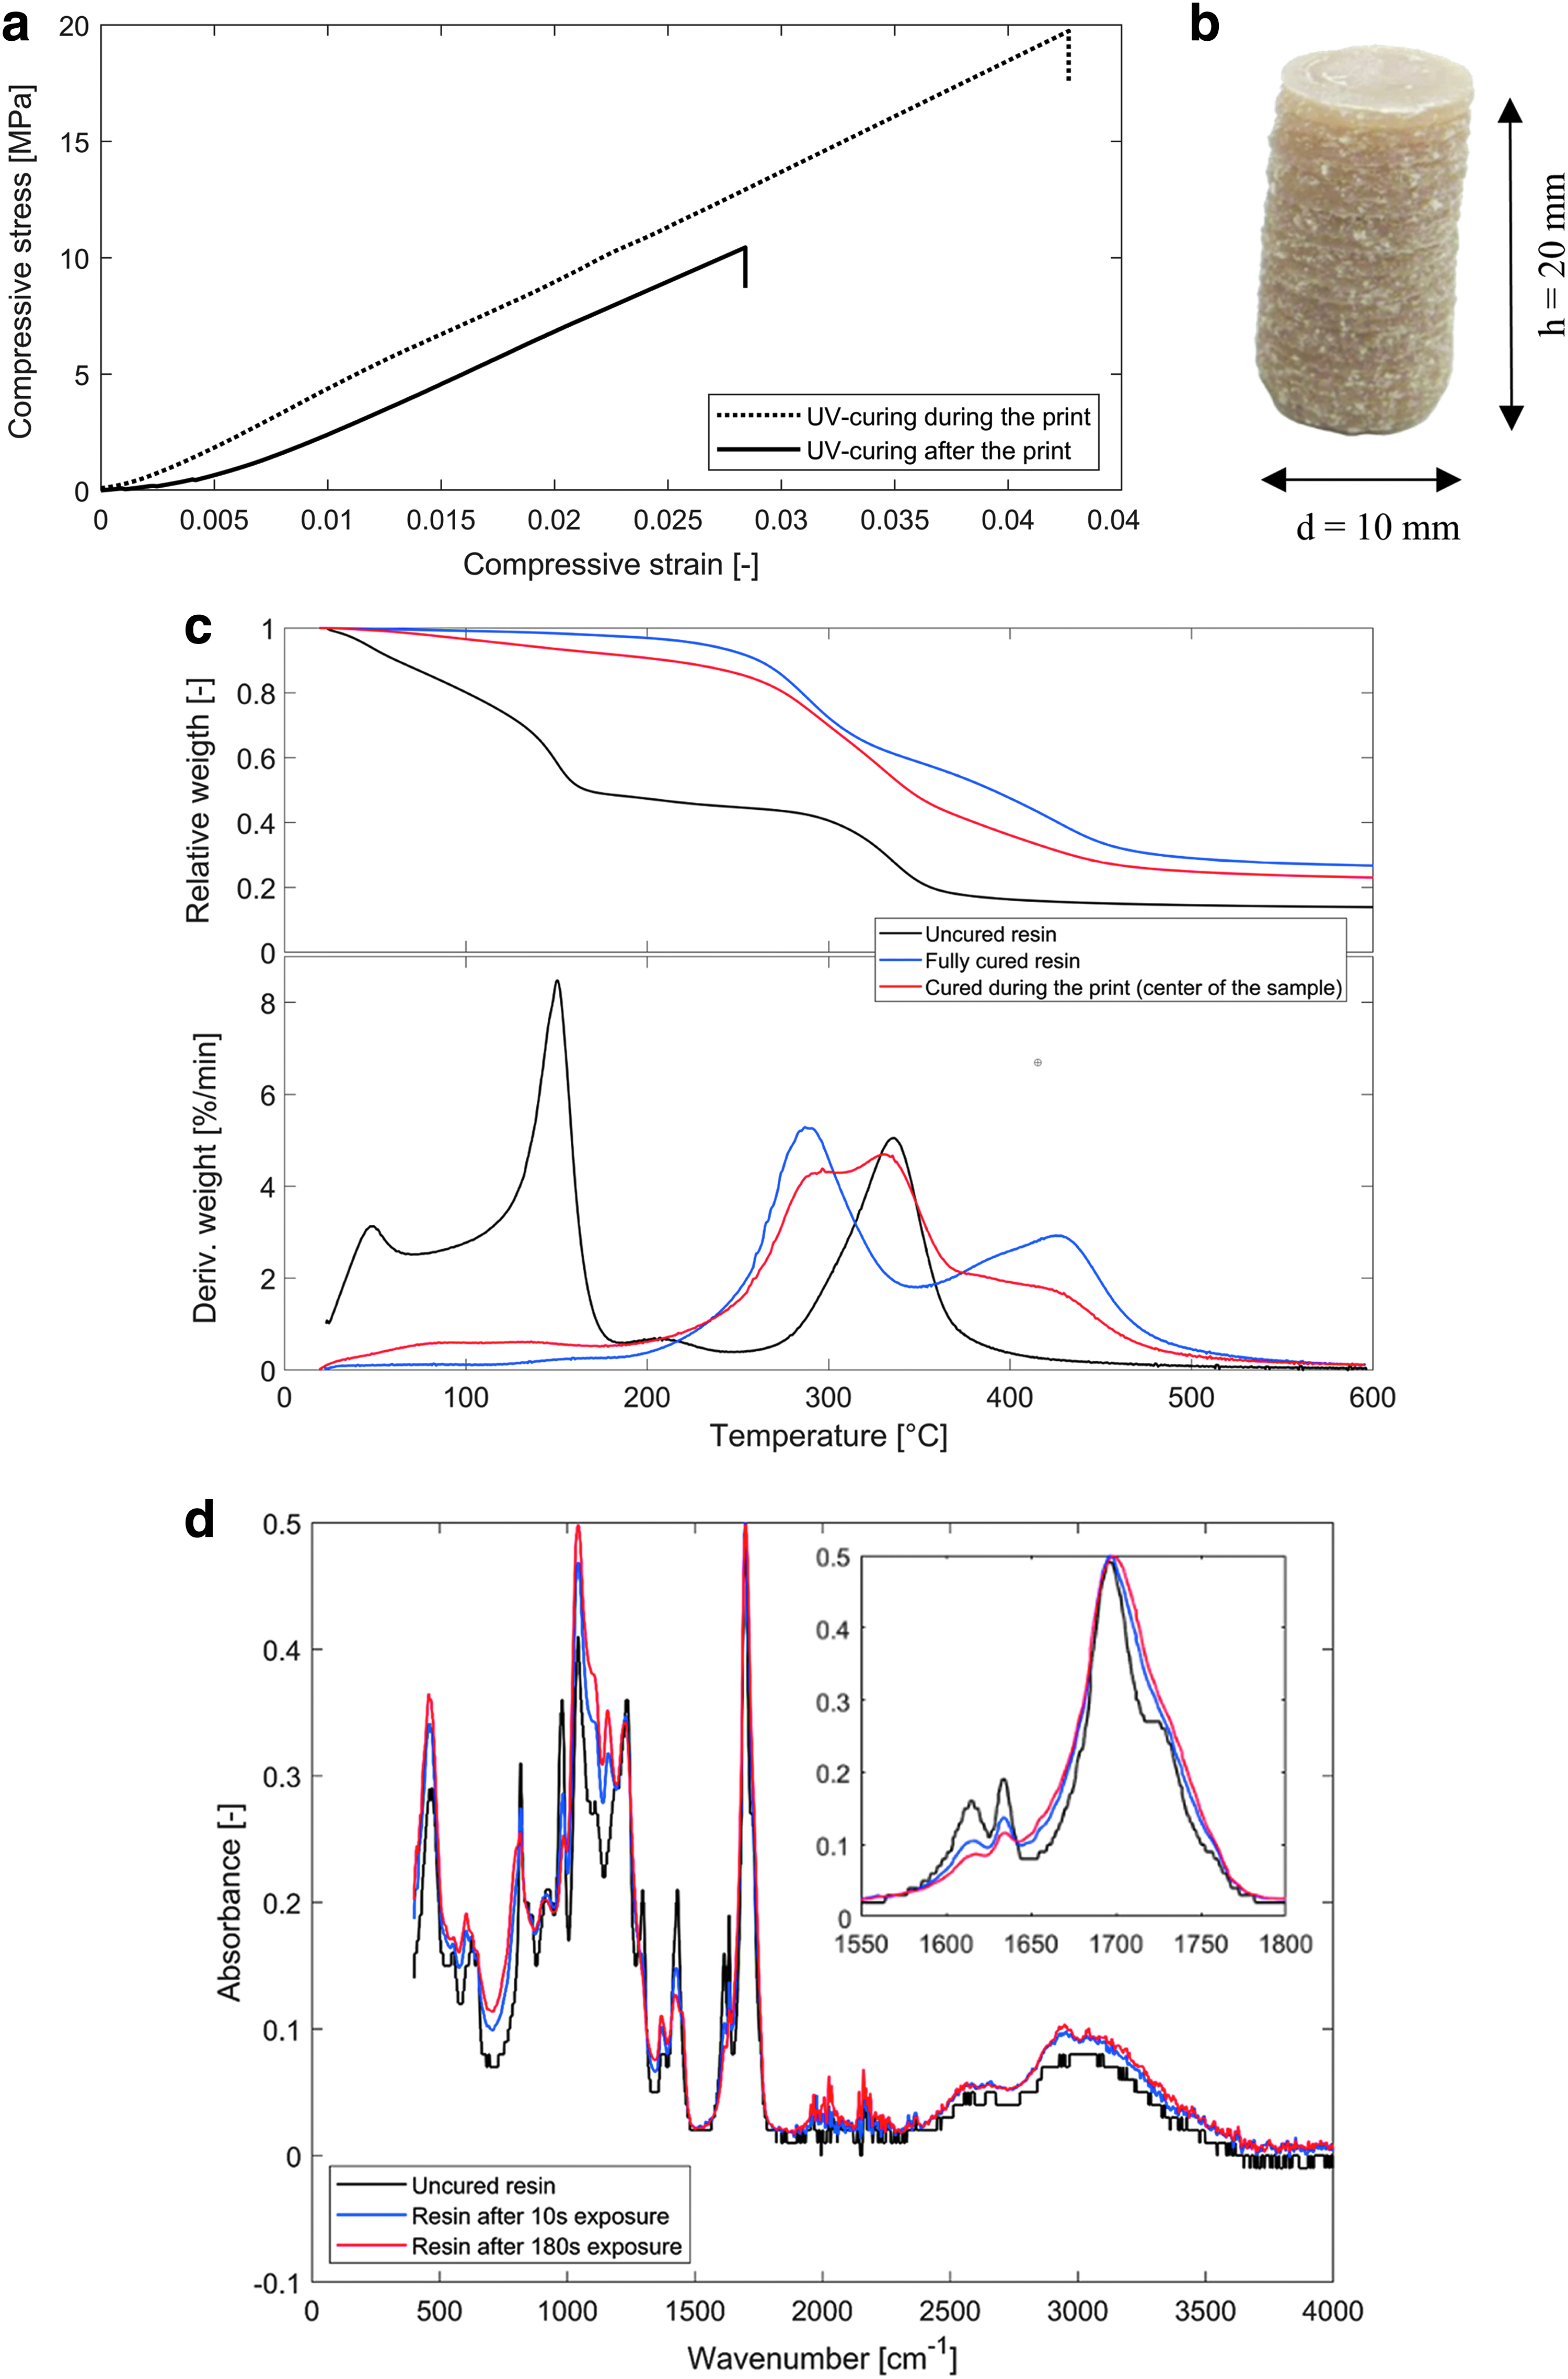
The size of the samples corresponds to 10 mm in diameter and 20 mm in height. To guarantee parallel and flat surfaces of the clamped planes, the top and bottom of each cylinder are smoothened with sand paper. Figure 3a outlines the stress-strain curves for the deviating curing strategies, demonstrating increased compressive stresses and strains for in situ UV-curing. In Figure 3b, an example compression testing pin is presented. According to Table 4, UV-curing during the print leads to a higher stress average, amounting to 19.73 ± 10.85 MPa, in comparison to 10.51 ± 2.36 MPa when not applying UV light during the print. Load at break and elongation at break are significantly higher when curing the samples during the print.
Compression Testing Stress, Load, and Elongation at Break
TGA and FTIR analysis
The TGA results of the cylindrical samples (similar to the compression testing pins) are shown in Figure 3c by presenting the relative (upper section) and derivative weight loss (lower section). For unreacted resin (black line), an evaporation of the free AA is observed in the temperature region of 25–200°C (max rate at 150°C); the decomposition of the cellulosic material starts at 270°C (max rate at 330°C). Based on the TGA measurements, the surfaces of the printed specimens (cured “during” or “after”) are free from unreacted AA as their TGA results resemble the one obtained for fully cured resin, showing a decomposition starting point of polyacrylic acid at 200°C (blue line, max rate at 290°C). The decomposition of the cellulosic materials is present at significantly higher temperatures than in the uncured resin (maximum rate of 430°C compared to 330°C). Inside the samples (red line), the specimen UV-cured during the print indicates some minor amount of unreacted AA (∼5%), whereas the inner part of the sample UV-cured after the print fully consisted of unreacted resin (TGA curve resembles the one for uncured resin). This sample is composed of two clear phases, an ∼3-mm-thick outer layer (cured ∼100%) and an unreacted resin infill.
Results from the FTIR analysis show that the curing (∼90–95%) mostly took place during the first 5–10 s (Fig. 3d, black versus blue line), after which the curing rate decreased rapidly. To reach a ∼100% curing degree, a longer exposure time is required (red line).
Overhang testing
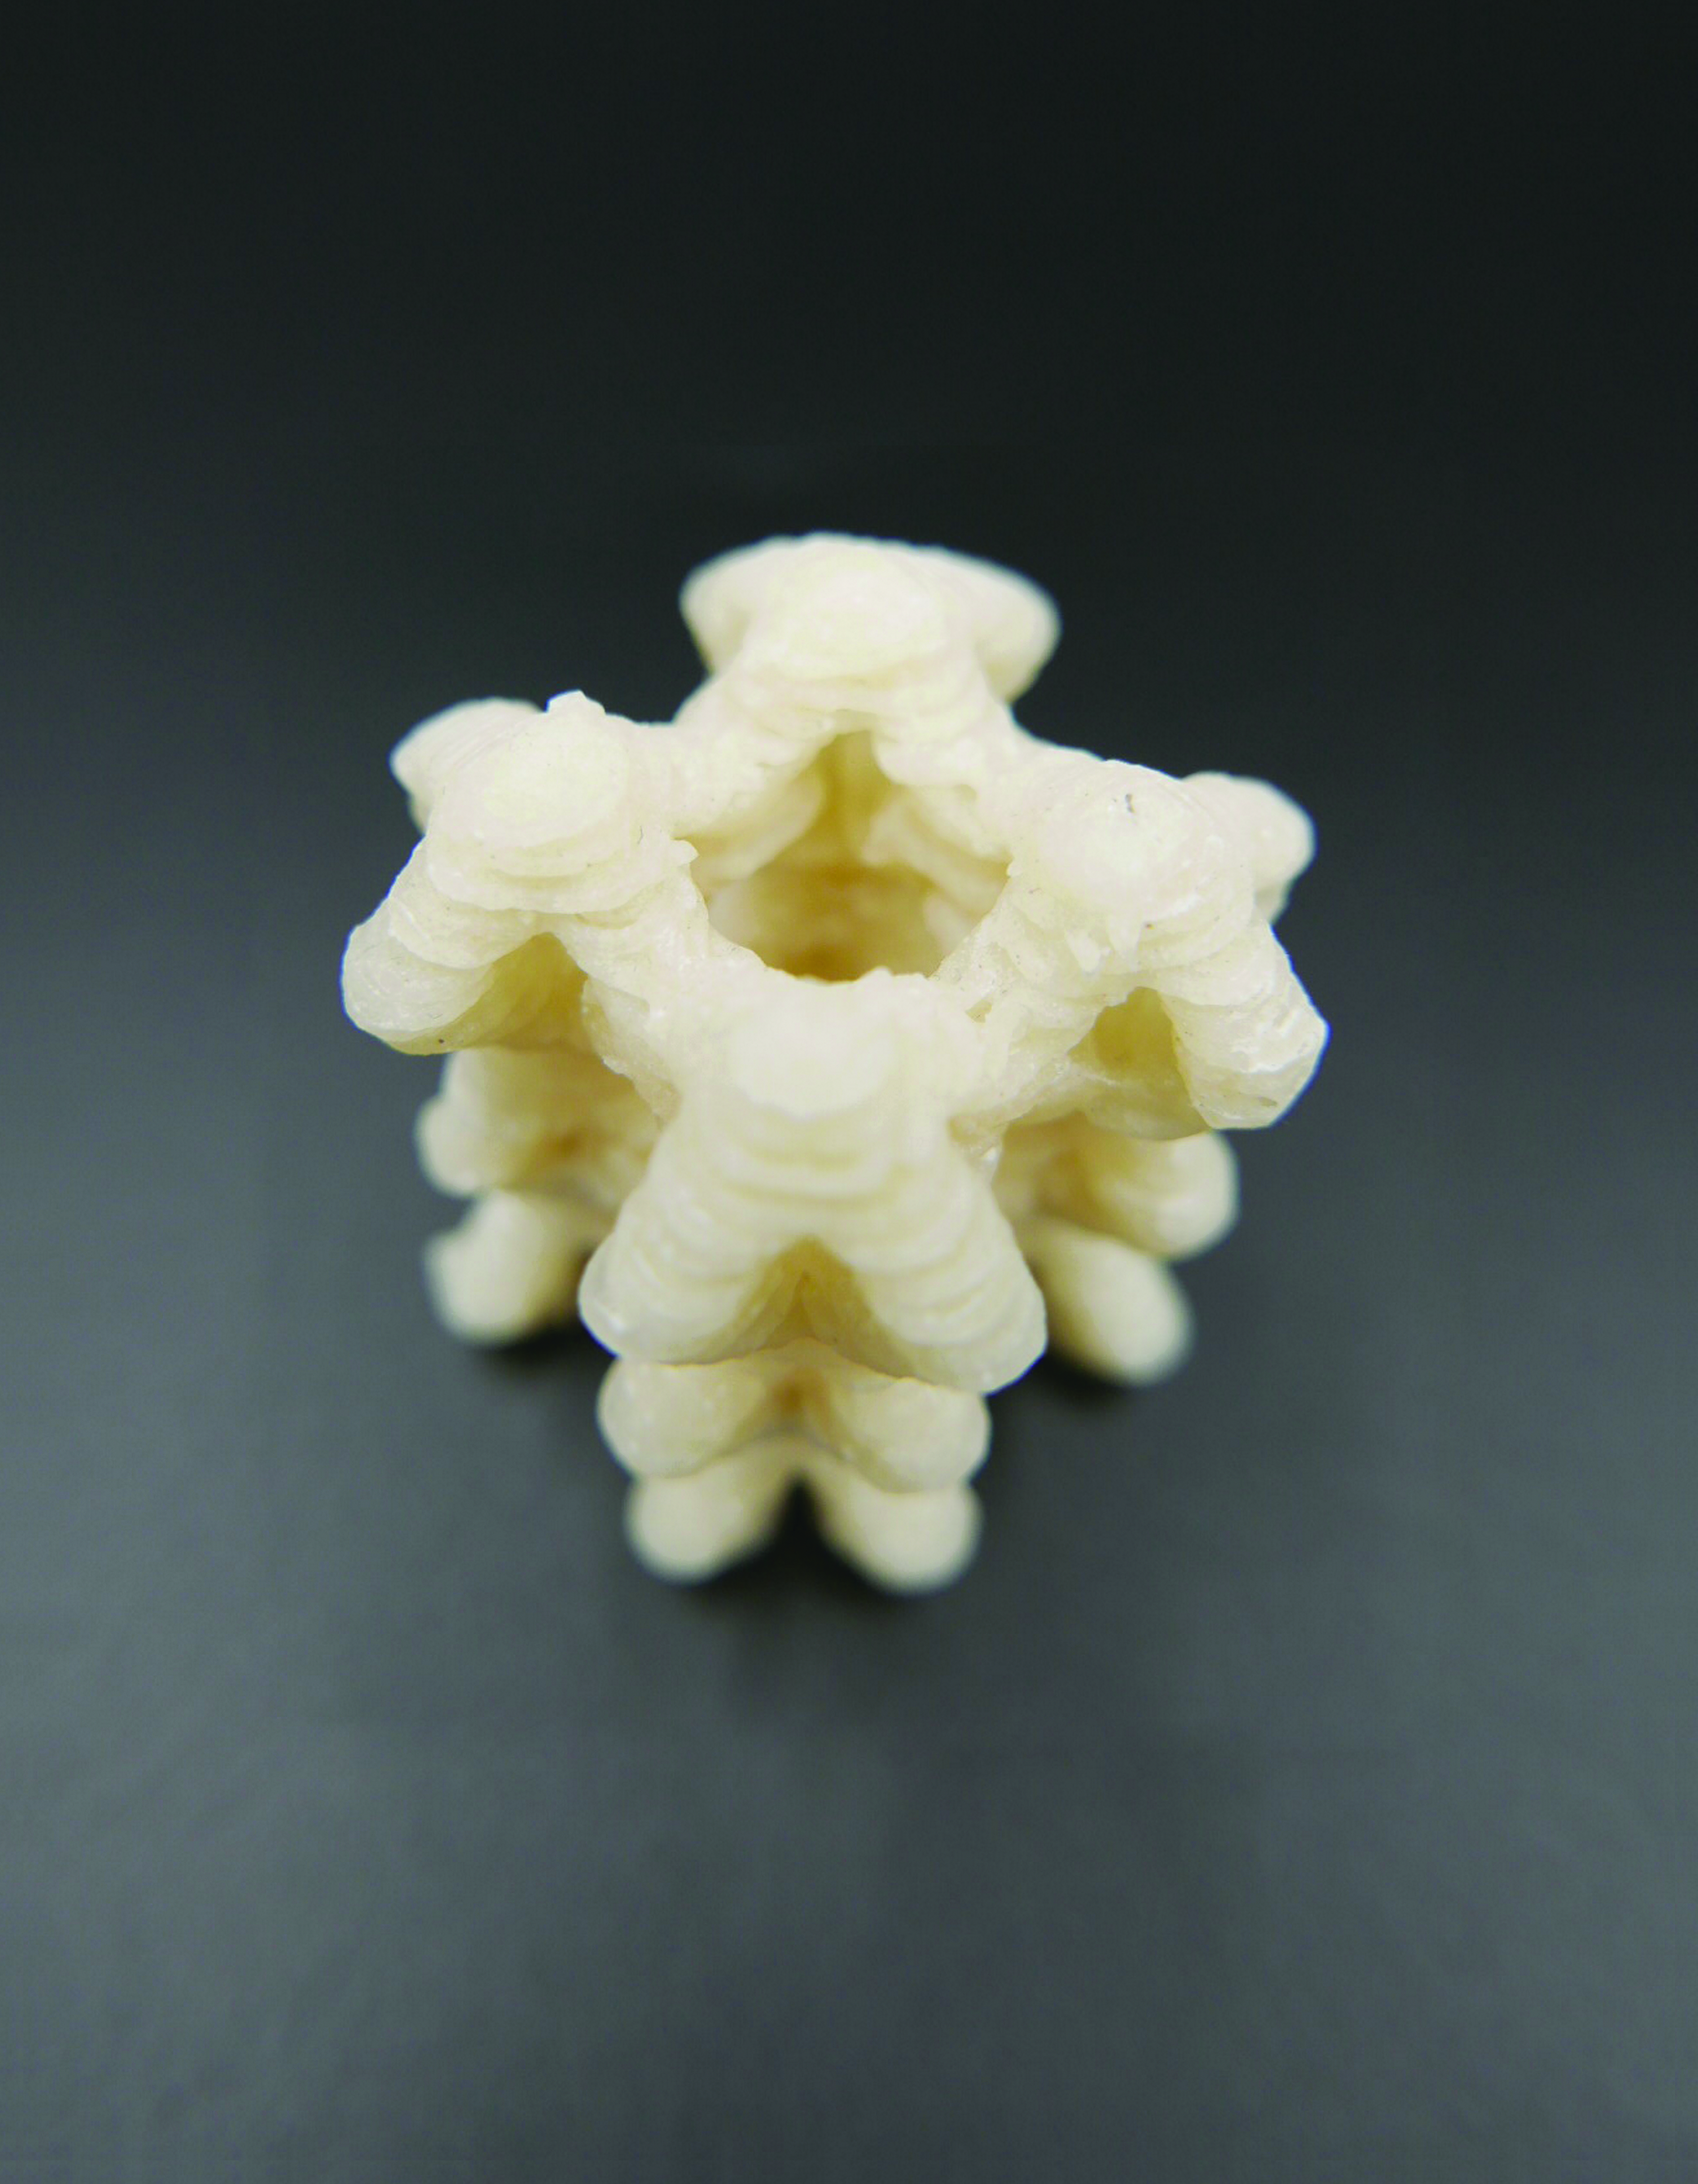
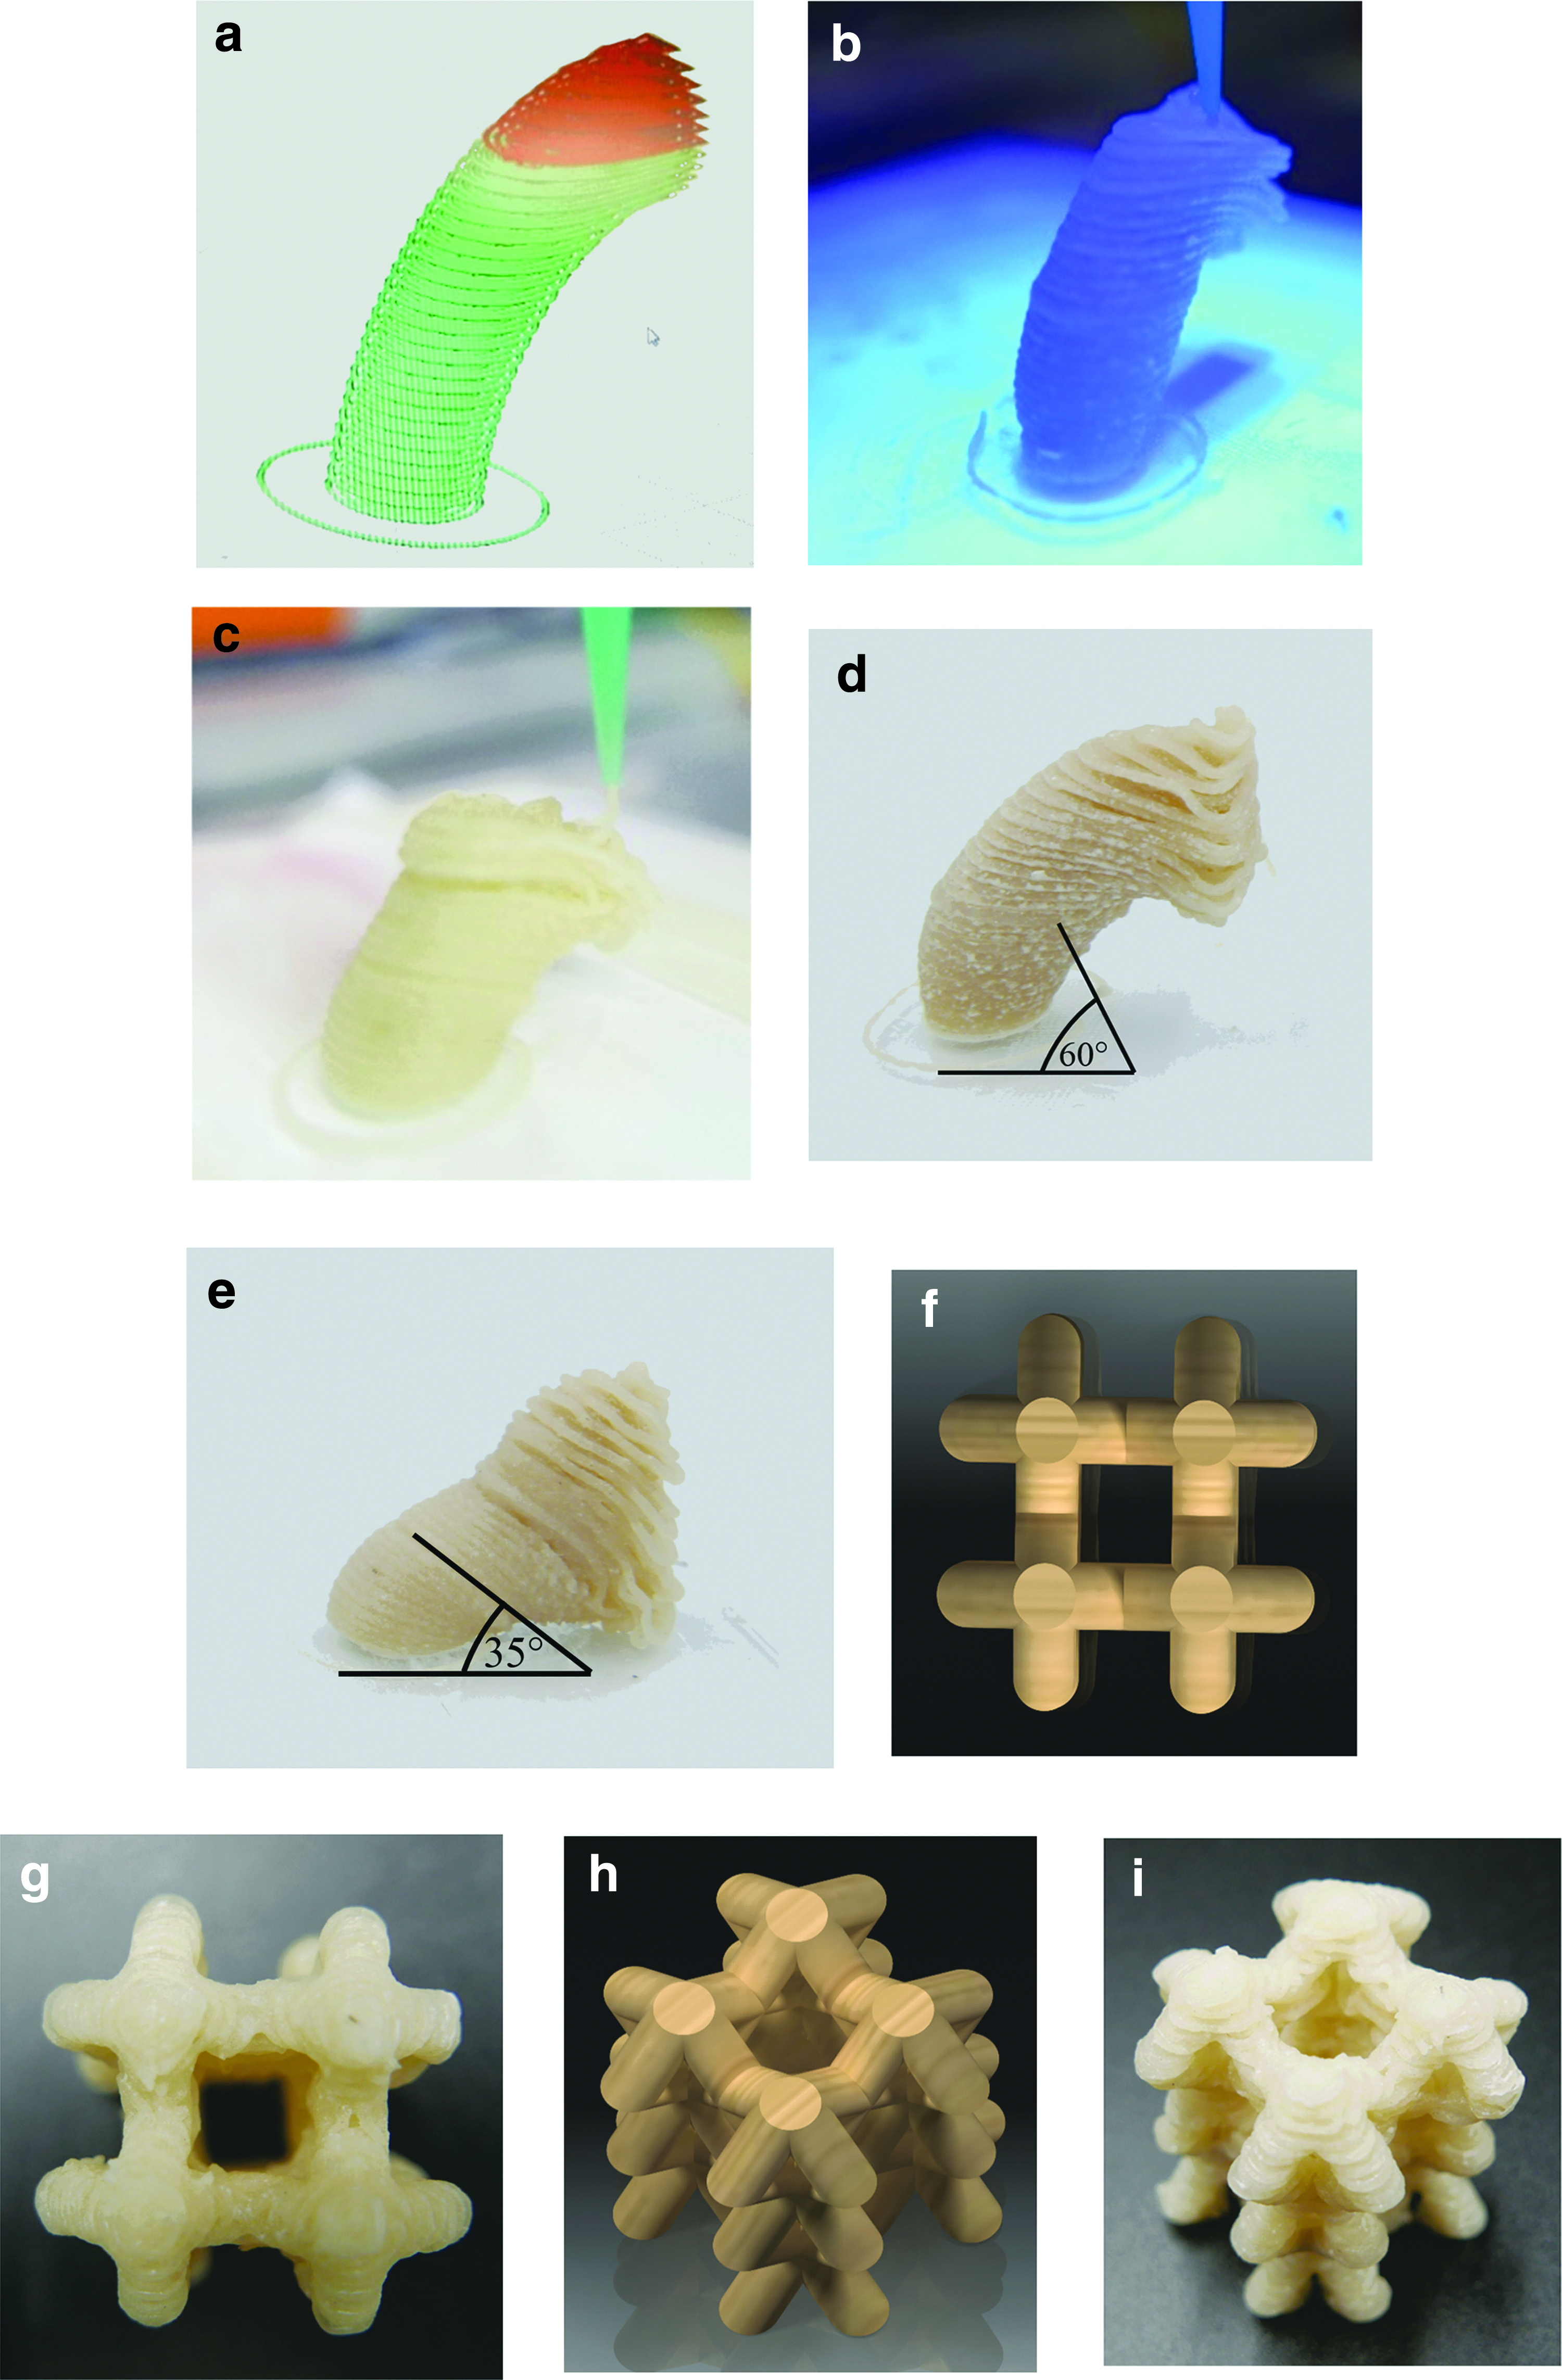
To analyze the overhang threshold angle, a 90°-curved tube with a diameter of 15 mm and a height of 37.5 mm is printed. Images during the print and results of different curing strategies are shown in Figure 4a–e. Figure 4a outlines the overhang testing model and the printing progress (marked green) in Pronterface to illustrate how the printed sample should appear if this test is fully passed (90° overhang angle); Figure 4b shows the overhang testing sample during the print when applying UV light simultaneously; Figure 4c depicts the overhang testing sample without applying UV light during the print. In Figure 4d and 4e, the resulting overhang testing samples including the maximum overhang angles are presented with and without UV light during the print. This test indicates that larger overhang angles can be printed when applying UV light during the print. Overhang angles relative to the horizontal build platform were calculated by visual inspection to compare the 3D model in Pronterface (Fig. 4a) with the ongoing print of the tube (Fig. 4b, c). When the print starts to fail its execution, the maximum overhang angle is defined. The threshold angle amounts to more than 60° when supported by UV light (Fig. 4d) and 35° without its support (Fig. 4e). In general, the example testing component fully collapses when UV light is not used, whereas in the other case, a partial collapse can be observed when exceeding the threshold angle. Higher overhang threshold angles allow more design freedom. In this context, a face-centered lattice structure demonstrator part (Fig. 4f–i) with overhangs of 45° is printed by applying UV light during the print to show the necessity and potential of continuous UV-curing. A top view (Fig. 4f) of the render and of the demonstrator (Fig. 4g) as well as a diagonal view (Fig. 4h) of the render and of the demonstrator (Fig. 4i) are presented to demonstrate the greater design freedom. Without UV light, this complex structure collapses and cannot fulfill necessary overhang requirements. Total part dimensions are 30 mm × 30 mm × 25 mm after the assembly of two printed lattice structure parts (due to limited material capacity).
Visualizing the overhang angle of varying UV-curing strategies,
SEM analysis
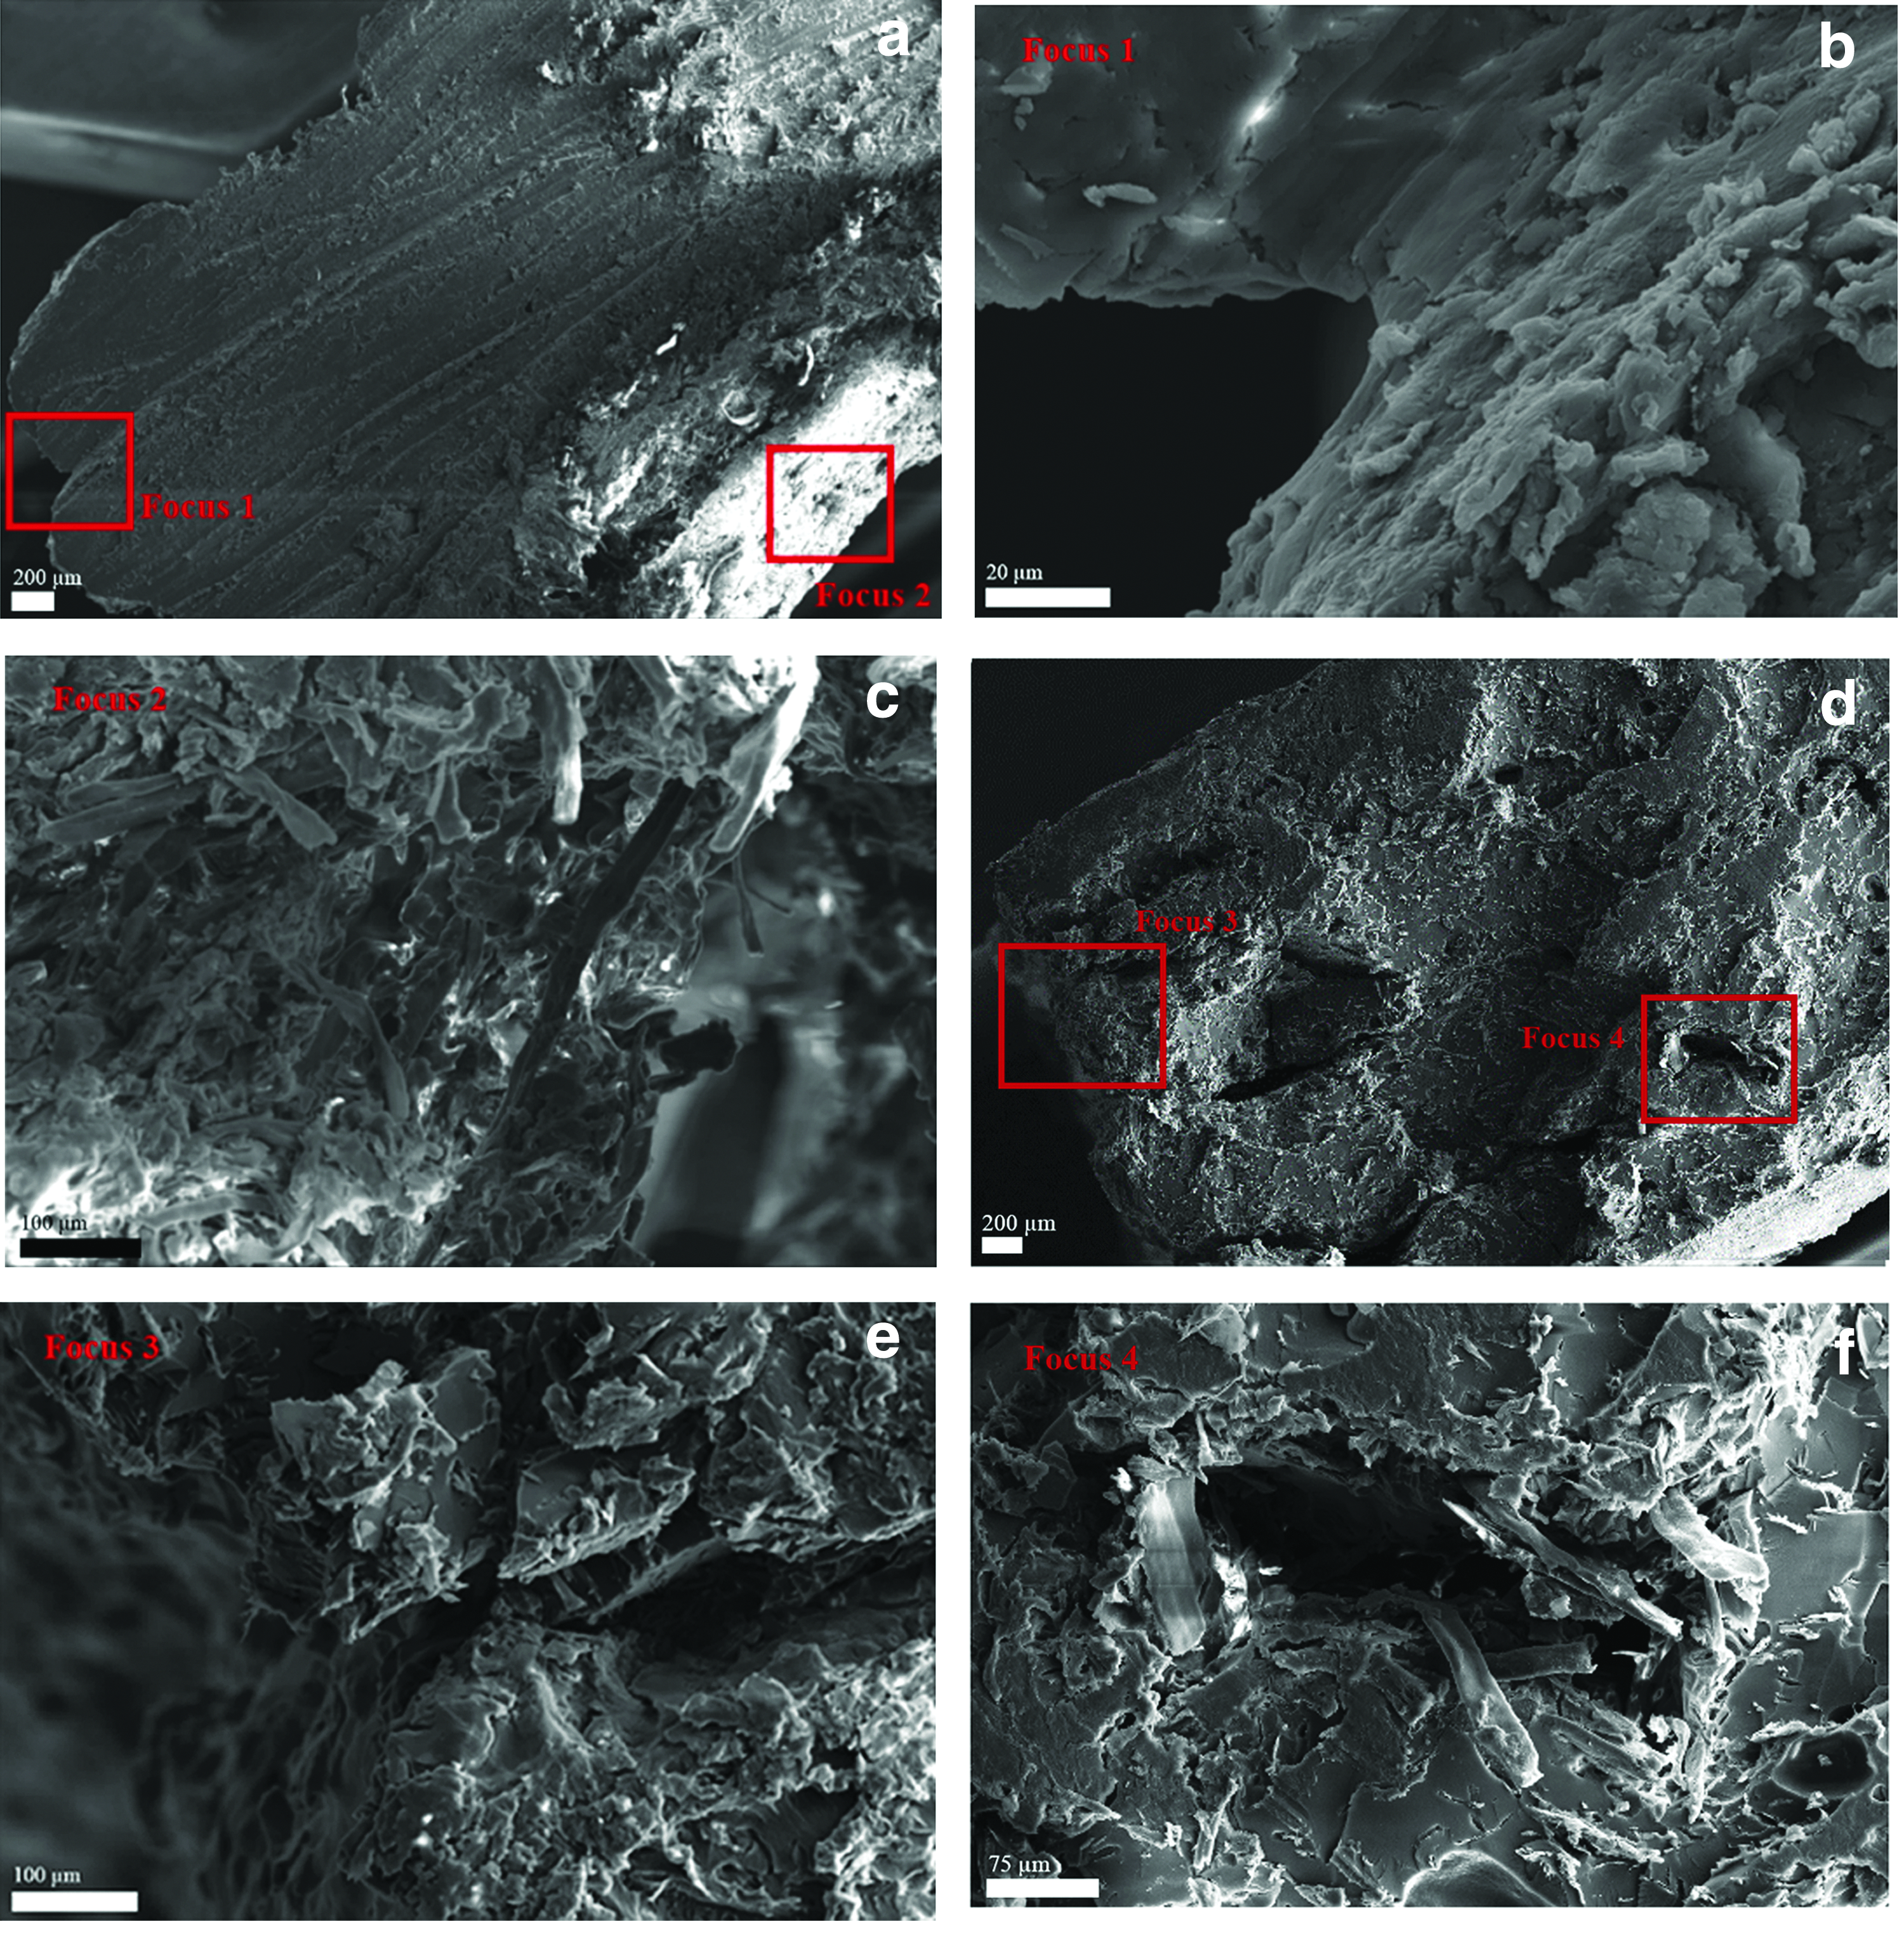
In Figure 5, gathered SEM images are presented, showing initially (from left) an overview of the sample when UV-curing only after the print (Fig. 5a) and followed by a focus on the threshold area of two subsequent layers (Fig. 5b) and the bottom area of the sample (Fig. 5c), in which a special characteristic can be identified. Figure 5d shows an overview of the sample when UV-curing during the print, consequently focusing on the threshold area of two layers (Fig. 5e) and a special characteristic of the sample (Fig. 5f).
SEM images of the cross-section of printed tensile testing bars,
The sample in Figure 5a exhibits deviations in shape compared with the rectangular shape objective of the cross-sectional area of the tensile testing 3D model. At the sides of the sample, typical extrusion-related layer bulges can be identified. Analyzing the threshold area of two layers (Fig. 5b), the SEM image indicates that the adhesion between the layers is fluent, and cracks or holes cannot be observed. At the bottom of the sample (Fig. 5c), an agglomeration of α-cellulose fibers is present, a necking area that exists for all related samples without UV light during the print.
The sample in Figure 5d generally complies with the rectangular shape of the cross-sectional area of the 3D model, however, containing larger micro-sized cracks (in the threshold area of two layers) (Fig. 5e) as well as holes and a low density of cellulose fibers in the core of the sample (Fig. 5f).
Discussion
Biocomposite materials imply the possibility to combine advantages in sustainability and functionality compared with oil-derived polymer materials. Advanced production techniques such as 3D printing open up opportunities to apply these materials for future applications (e.g., catalysts, insulations, and absorbers) and shapes (e.g., honeycomb lightweight structures). 41 New commercially available cellulose-filled composites for FFF containing a cellulose content of 20% report a tensile stress of 28 MPa and an E-modulus of 2600 MPa. 42 When comparing results of this study with the industrial filament, the tensile strength values could not be reached (17.72 ± 4.83 MPa), but the E-modulus exceeds this value (2667 MPa when curing during the print, 3520 MPa when curing only after the print), including a higher cellulose content. The deviations in tensile and compression testing are significant, arising from the unique nature of each 3D printed component. Since the extrusion of this material is challenging, this restriction had to be taken into account. Pores and print failures might have led to statistical outliers, and an improved control over the printing process could result in significantly higher mechanical properties. In addition, increased curing durations would probably lead to higher tensile and compression testing values; the ideal curing duration for this material has not yet been investigated; and an analysis similar to Xiao and Hao 43 should be considered. According to the TGA results, it is mandatory to apply UV light while printing for components thicker than 6 mm (3-mm UV penetration depth from the bottom and 3 mm from the top when postcuring) for the applied material. Otherwise, the material cannot solidify and/or fully cure inside the part, an effect that is already present in the compressive testing of the cylinders, resulting in inferior mechanical properties. Besides the UV-curing duration, several additional key process parameters are expected to have an effect on obtained tensile and compression testing results. The UV dose during the print needs to be sufficient enough to cure each layer before the next layer is printed, as demonstrated in the FTIR analysis. Otherwise, it may happen that parts are not fully UV cured even after post–UV-curing, due to the underlying maximum postcuring depth of ∼3 mm. If the extrusion speed is too low, not enough printing material is ejected to guarantee fully dense parts, resulting in increased porosity levels. The printing route of the nozzle and their defined fill pattern describe another key process parameter. Lines printed in parallel with the tensile direction (0° orientation) show slightly advantageous tensile testing results 44 (compared with the 45° orientation in this study). To define optimized key process parameters for this biocomposite material, further tests with varying process parameters are required, which exceeds the scope of this article.
As curing during the print allows for a greater degree of curing at the surface between each layer, the morphology is less consistent than with the UV-curing after the print, where in contrast the state of material is soluble when the layers are being merged. This can be observed in the relative homogeneous nature of Figure 5a as compared with the clear separation between layers seen in Figure 5d. On the other hand, shape accordance of the cross-sectional area with the 3D model appears higher when UV-curing during the print, which can potentially be traced back to the enhanced UV-curing layer-wise control. However, for the same reason of a greater UV-curing degree when UV-curing during the print, cracks between the layers can be explained, as demonstrated in Figure 5e. By comparing the surfaces in Figure 5a (UV cured after the print) with Figure 5d (UV cured during the print), it appears that there are numerous cracks (mostly horizontal ones) and holes in the cured during samples. This is not directly consistent with the mechanical testing data, as it would be assumed that in general a higher density of cracks and porosity (Fig. 5f) would reduce the overall strength of the material. An explanation for this observation may lie in the parallelism of the tensile testing direction and the connecting areas of layers (in which most of the cracks and holes can be found), thus not having a significant negative effect on tensile testing results (adhesion between layers negligible). In addition, the result that elongation exceeds the yield point causing plastic deformations could be explained by the identified micro-holes. An explanation for it may also lie in detachments of fibers from the main matrix, supported by lower adhesion between the layers. Such holes are not present when UV-curing only after the print, leading to smoother cross-sectional surfaces, resulting in mainly elastic behavior.
Trapped fumed silica seems not to have aggregated, showing an even distribution within the resin, including both UV-curing strategies. However, agglomerations of cellulose fibers (Fig. 5c) occur in the sample when UV-curing after the print. This observation may be caused by insufficiently balanced UV light radiation at the bottom of the sample, since less UV lights are installed at the bottom of the Formlabs curing station and the presence of the fine metal mesh (needed for print removal) during this process, preventing sufficient UV light transmission.
As demonstrated in the overhang test, cured material has the ability to hold the subsequent layer in an improved manner, leading to an increase of ∼25° for this specific component and material. In addition, this advantage is manifested in the case of the lattice structure component (45° overhangs), which is not 3D printable without applying UV light during the print.
A one-to-one comparison between samples being printed with and without UV light during the print is challenging due to varying UV-curing principles and absorbed UV doses. The power consumptions of UV lights vary (12 W versus 39 W), and the radiant power of the UV light attachment is unknown. Moreover, the distance from the UV lights to the component is significantly smaller (∼2 cm) in the case of UV-curing during the print compared with the commercial curing device (between ∼2 and 20 cm). The UV light is emitted unidirectional on the component when applying UV light during the print, whereas the commercial curing station emits UV light globally, additionally using embedded mirrors. Nevertheless, a case comparison of described UV-curing strategies is considered important, since it provides direct mechanical performance results and conclusions on applied technical parameters.
In the future, tensile testing bars should be printed vertically and tested, which was impossible with this system, because it would have exceeded the build volume height of the printer. Other fillers such as lignin could be added to the existing paste, making the prints appear more wood-like. This approach also offers the opportunity to utilize waste materials as fillers following work in pure FFF, 45 for instance saw dust could replace cellulose fibers, demonstrating an inexpensive and ecologically useful way to reuse biowaste materials. Moreover, the applied AA can be derived from bio-based materials 46 to produce fully bio-based printing materials, further improving the ecological footprint of the applied printing material. Finally, future work is needed to explore the potential for higher cellulose contents as well as the addition of special materials such as carbon nanotubes to enhance the properties of the composites. In addition, further tests with varying key process parameters should be conducted to optimize the mechanical properties of the paste material. Eventually, this UV light assisted printing concept can be scaled up to be used in larger build envelopes with increased nozzle diameters to enable a faster production of large-scale biocomposite components.
Conclusions
A novel biocomposite resin with a cellulose content of more than 25% was successfully fabricated and 3D printed by using an in-house developed extruder system with attached UV lights. UV-assisted PE implies positive effects on repeatable tensile and compressive strength properties by overcoming UV penetration depth issues. In addition, it leads to improved maximum overhang angles and prevents collapse, enabling the fabrication of complex large-scale components. These results can potentially be transferred to other extrusion materials, leading to new applications and more complex shapes. In particular for large components produced by extrusion of a resin with a low-degree translucency, UV-curing during the print is necessary following the system provided here.
Footnotes
Acknowledgments
This project was supported by Fulbright Finland and the 3D BioMat Project by Academia of Finland. The authors would also like to thank Spoljaric Steven and Siddarth Jayaprakash for technical assistance.
Author Disclosure Statement
No competing financial interests exist.