
Abstract
Whether attention deficit/hyperactivity disorder (ADHD) is best understood as a discrete condition or as an extreme variant on a behavioural continuum is one of many controversies that surround the disorder. The categorical view, embodied in diagnostic systems such as the DSM-IV [1], holds that affected and unaffected individuals differ qualitatively, separated by a non-arbitrary category boundary. Accordingly, aetiological models should invoke causal factors that are specific to affected individuals and capable of generating a discontinuity. On the continuum view, ADHD falls at the end of a seamless trait distribution, differing from normality only by degree. The disorder should therefore be explained with reference to normal behavioural variation. This contrast between categorical and continuous views is perhaps the most important conceptual issue in the classification of child and adolescent psychopathology [2].
The categorical view of ADHD and other disorders has been criticized on several grounds. First, it has been accused of promoting a ‘reified’ understanding of ADHD [3], of imposing an arbitrary diagnostic threshold, and of pathologizing normal childhood behaviour. Second, it has been argued that this view constrains research and embodies the mistaken assumption that childhood disorders invariably reflect endogenously caused dysfunctions [4]. Third, the categorical view has been claimed to promote inflexible and contextually insensitive treatment regimens [5]. Finally, the categorical view has been criticized for yielding dichotomous assessments of psychopathology, resulting in a loss of statistical power in clinical research [6]. The continuum view implies quite different practices: dimensional assessment, a focus on extent of impairment rather than diagnostic thresholds, and treatments that vary according to quantifiable differences between individuals.
Deciding between categorical and continuum accounts of ADHD is not simply a matter of theoretical argument. Several lines of empirical research favour the continuum position. Behavioural genetic research by Gjone et al. [7] found that the heritability of ADHD did not vary in subsamples of differing severity, suggesting that genetic contributions to the ADHD phenotype operate along a broad continuum of variation. Levy et al. [5] obtained heritability estimates that did not differ whether ADHD was assessed as a categorical diagnosis or as a quantitative trait, suggesting that the disorder has no specific genetic contribution beyond the heritable component of the trait. The unimodal distribution of ADHD symptoms in the population [8] has been taken to imply that no categorical break between affected and unaffected individuals exists. Similarly, strong associations between ADHD and dimensions of normal personality [9] imply that the disorder is continuous with normality, consistent with recent demonstrations of continuous liability distributions for depression and delinquency [10].
Although this evidence is consistent with the continuum view of ADHD, the categorical view can accommodate much of it. First, unimodal symptom distributions can harbour two admixed latent distributions, containing low and high levels of symptomatology respectively [11]. Second, discrete categories can be associated with normal personality dimensions [12]. Third, latent class analyses of ADHD symptoms consistently yield multiple classes [13, 14], leading some researchers to argue that categorical and continuum approaches are both needed to make sense of ADHD [15]. Fourth, the advent of ADHD subtypes in DSM-IV has revived interest in possible categorical distinctions [16, 17]. Behavioural genetic evidence for the continuity of ADHD can also be challenged. In Gjone et al.'s study [7], the confidence intervals surrounding heritability estimates in the severity- based subsamples were too large (± 0.28 to ± 0.39) for significant differences between subsamples to be detected. Similarly, Levy et al.'s [5] study was not powerful enough to detect an effect that would support a continuum model: the large standard error of the difference between trait- and diagnosis-based heritability estimates (0.16) prevents even a perfect diagnosis-based heritability (1.0) being significantly stronger than the trait-based estimate (0.75). This lack of power is problematic as the statistical methodology [18] took the continuum model as the default assumption.
Behavioural genetic research demonstrates that ADHD-related phenomena have a strong genetic component along the entire range of severity, but does not rule out the possibility that towards the extreme end of this range some sort of discontinuity arises. Above a threshold level of severity a discrete clinical variant might emerge. Alternatively, certain environmental effects or gene–environment interactions that yield such a variant might occur at high levels of severity but not at lower levels. In sum, the available research relies on relatively indirect and statistically inconclusive ways of determining the latent structure of ADHD, focusing on genetic causation and its implications for ADHD's structure, rather than on latent structure itself. Research methods that directly tackle the categorical versus continuous structure of ADHD, and do not take one view as the default, might allow a more definite resolution of this issue.
The taxometric methods developed by Meehl et al. [19, 20] offer a direct way of adjudicating between categorical (‘taxonic’) and continuum (‘dimensional’) models of latent variables. These multivariate procedures examine patterns of covariation among fallible indicators of the construct of interest, seeking those that are diagnostic of taxonic or dimensional structure. Extensive simulation research supports the capacity of taxometric procedures to discriminate between these structures with very high accuracy and without a bias in either direction, unlike cluster/latent class analyses and factor analysis, which are predicated on categorical and continuous models respectively. Unlike mixture model analyses, moreover, taxometric methods do not make strong (and potentially inappropriate) assumptions about the distributional form (e.g. normal) of any latent classes.
Taxometric procedures have been used in more than 70 studies to date [21]. A majority has addressed adult psychopathology, investigating mood [22, 23], anxiety [24], dissociative [25], and personality disorders [26], among others. These studies have not disproportionately supported taxonic or dimensional models, suggesting that each model is appropriate for some disorders. Evidence for categorical models of schizotypy [27, 28], melancholia [29], antisociality [30] and behavioural inhibition [31] has been obtained in child and adolescent samples, as has evidence of the continuity of attachment behaviour [32], but childhood and adolescent problems have generally been neglected in past taxometric research [33]. We therefore conducted a taxometric analysis of the latent structure of ADHD, using well-established indicators of the disorder in large epidemiological samples of children and adolescents.
Method
Participants
Participants were drawn from a sample of 4509 children aged 4–17 years, who were identified using a multistage probability methodology that covered every census district in Australia. The sample, which was closely comparable in demographic characteristics to national census figures, was collected for the Child and Adolescent Component of the National Survey of Mental Health and Well-being [34], the first nationwide epidemiological study of child and adolescent mental health problems in the country. Participation rate in the survey was 86%. After excluding those who had missing data on study instruments and who were aged less than 6 years, to ensure that participants were of school age, 2996 participants remained. These participants were divided into child (age 6–12 years, mean = 9.04 [SD = 2.01]; n = 1774 904 [boys], 870 [girls]) and adolescent (age 13–17 years, mean = 14.86 [SD = 1.32]; n = 1222 605 [boys], 617 [girls]) samples.
Materials
All participants were assessed for mental health problems by means of the Child Behaviour Checklist (CBCL) [35], a well-validated instrument for parental ratings of children's emotional and behavioural problems whose 113 items are rated on 3-point scales. The 11-item Attention Problems scale of the CBCL (possible score range 0–22, actual range 0–21) was used in the analyses, and was highly reliable in both samples (〈 = 0.84 [children] and 0.85 [adolescents]). In both samples, 85% of the parental raters were female and 15% male. Nonparametric (Mann–Whitney) tests with Bonferroni correction revealed no significant scale differences as a function of informant gender.
The Diagnostic Interview Schedule for Children Version IV (DISC IV) [36] was used to assess psychopathology. This structured interview, administered to parents by interviewers who had received extensive training and proficiency assessment, is based on the DSM-IV and has strong psychometric credentials. Only the depressive disorder, conduct disorder, and ADHD modules of the interview were administered in the survey. High reliabilities were obtained for both the inattention (〈 = 0.90 [children and adolescents]) and the hyperactivity/impulsivity symptoms (〈 = 0.85 [children] and 0.83 [adolescents]). Re-test reliability of the ADHD diagnosis was κ = 0.79 in the sample as a whole. Possible and actual scores ranged from 0 to 9 on both scales. Several additional questionnaire and interview assessments were administered to parents and to the adolescent participants, but were not used in the analyses reported below.
Results
Prior to conducting the taxometric analyses we constructed three indicator variables. Taxometric analyses require two or more such indicators, which should be non-redundant, strongly associated with and specific to the latent variable of interest, and preferably based on more than one method of measurement. Consequently, we selected total score on the CBCL Attention Problems scale, number of ADHD inattention symptoms present on the DISC-IV, and number of ADHD hyperactivity/impulsivity symptoms present on the DISC-IV as our indicators. These indicators therefore represent assessments using multiple methods (rating- and interview-based) that are specific to ADHD but cover distinct phenotypic aspects of the disorder. Because of large positive skew, which may interfere with taxometric inference [37], these indicators were subjected to a square root transformation (pretransform skew = 1.74, 2.67 and 2.14 [child], 1.40, 1.66 and 1.88 [adolescent]; post-transform skew = 0.99, 1.49 and 0.65 [child], 0.72, 0.75 & 0.45 [adolescent]), although all findings reported below were consistent with those conducted without transformation. Table 1 shows that the three transformed indicators are robustly intercorrelated in both samples, and factor analysis indicated that they all loaded strongly on a single underlying construct, consistent with previous work [38]. Analyses demonstrated that all indicators easily met the validity requirements for taxometric analysis (i.e. in SD units for child and adolescent samples: DISC-inattention = 2.97 and 3.19; DISC-hyperactivity/ impulsivity = 2.47 and 2.31; CBCL attention problems = 2.74 and 3.29). Nuisance covariance values were well within acceptable limits in both samples: child mean = 0.14 (range − 0.03–0.23); adolescent mean = 0.15 (range 0.04–0.22).
Correlations among ADHD Indicators (children below diagonal, adolescents above)
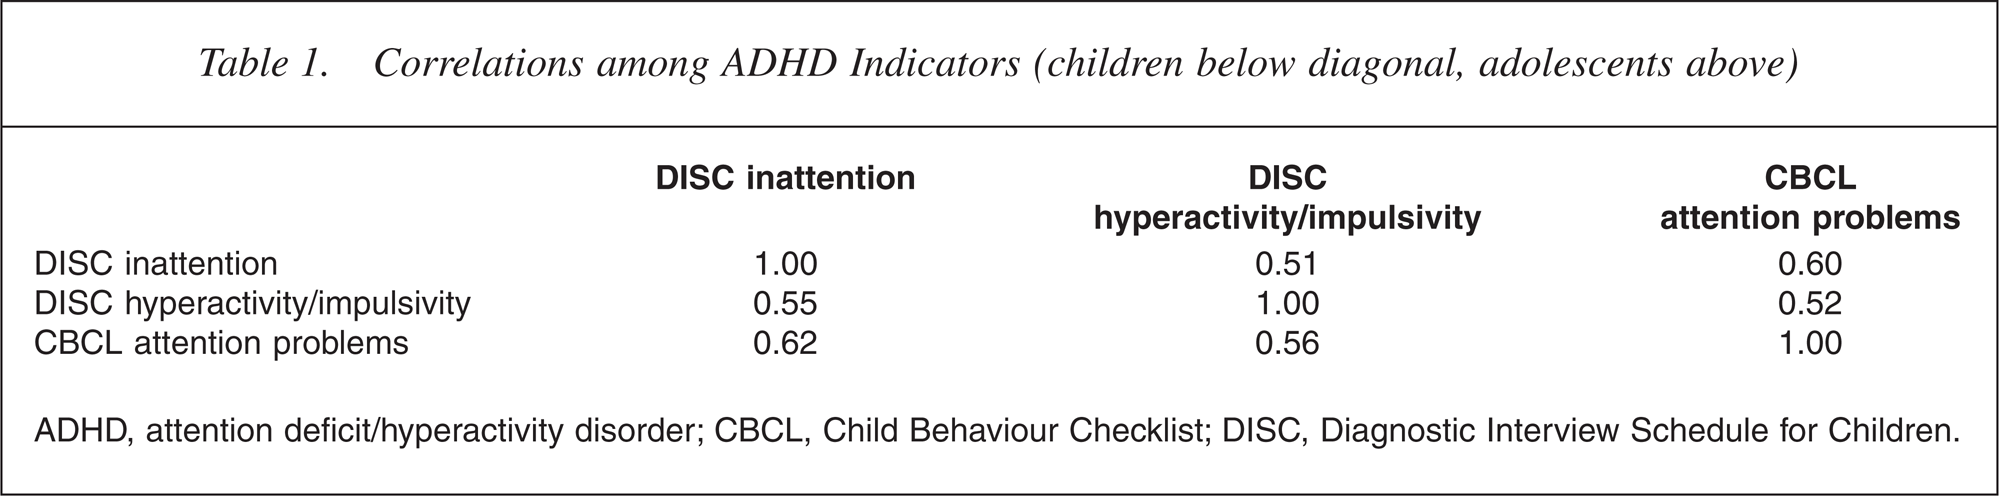
ADHD, attention deficit/hyperactivity disorder; CBCL, Child Behaviour Checklist; DISC, Diagnostic Interview Schedule for Children.
MAXEIG
One hallmark of taxometric methodology, unlike alternative methods, is the use of multiple independent procedures. Convergent findings regarding latent structure are sought across these procedures. Typically, taxometric studies report two or more distinct procedures along with several parameter-based ‘consistency tests’. We therefore tested the latent structure and parameters of ADHD with two procedures: MAXEIG and MAMBAC. MAXEIG (‘maximum eigenvalue’) [20] plots the eigenvalue of the first factor derived from two or more ‘output’ indicators in subsamples defined along overlapping intervals (‘windows’) of an ‘input’ indicator. Dimensional variables tend to yield relatively flat plots when this eigenvalue is plotted as a function of the input indicator, because the covariation among indicators of the latent variable is relatively constant along its entire range. When a taxon is present, MAXEIG plots tend to show a clear peak. In this case, the indicators covary because they discriminate taxon from complement groups, and therefore they covary most when taxon and complement members are mixed together. If a taxon has a low prevalence (e.g. ADHD in a community sample) this peak will occur near the right end of MAXEIG plots.
MAXEIG analysis was conducted using programs developed by Ruscio [39], which has been used in several previous studies of psychopathology [23, 37, 40, 41]. One innovation of the software is the generation and analysis of simulated comparison datasets that reproduce the correlational and distributional properties of the empirical data (i.e. sample N, indicator intercorrelations, skewness, kurtosis). One set of simulations is produced based on a dimensional model (one latent class with purely dimensional variation), another set on a taxonic model (two admixed latent classes), based on cases being classified into putative taxon and complement members using Bayes' theorem, following standard practice in Ruscio's software. The MAXEIG plots generated from the research data can then be visually compared with the respective simulations to determine which it more closely resembles. A relative fit statistic (Fit d) can also be computed [39], which takes positive or negative values when the research data better approximate the dimensional or taxonic simulations respectively. This data simulation procedure therefore functions as a powerful consistency test. MAXEIG plots were generated for the child and adolescent samples using 100 windows on the input indicator, with successive windows having 0.9 overlap (i.e. 163 children or 112 adolescents in each window). With three indicators, there are three possible triads, each of which yields its own plot. Panels of plots based on the research data and matched simulation data (averaged over 10 replications each of taxonic and dimensional comparison datasets) for the child and adolescent samples are presented in Figs 1, 2.
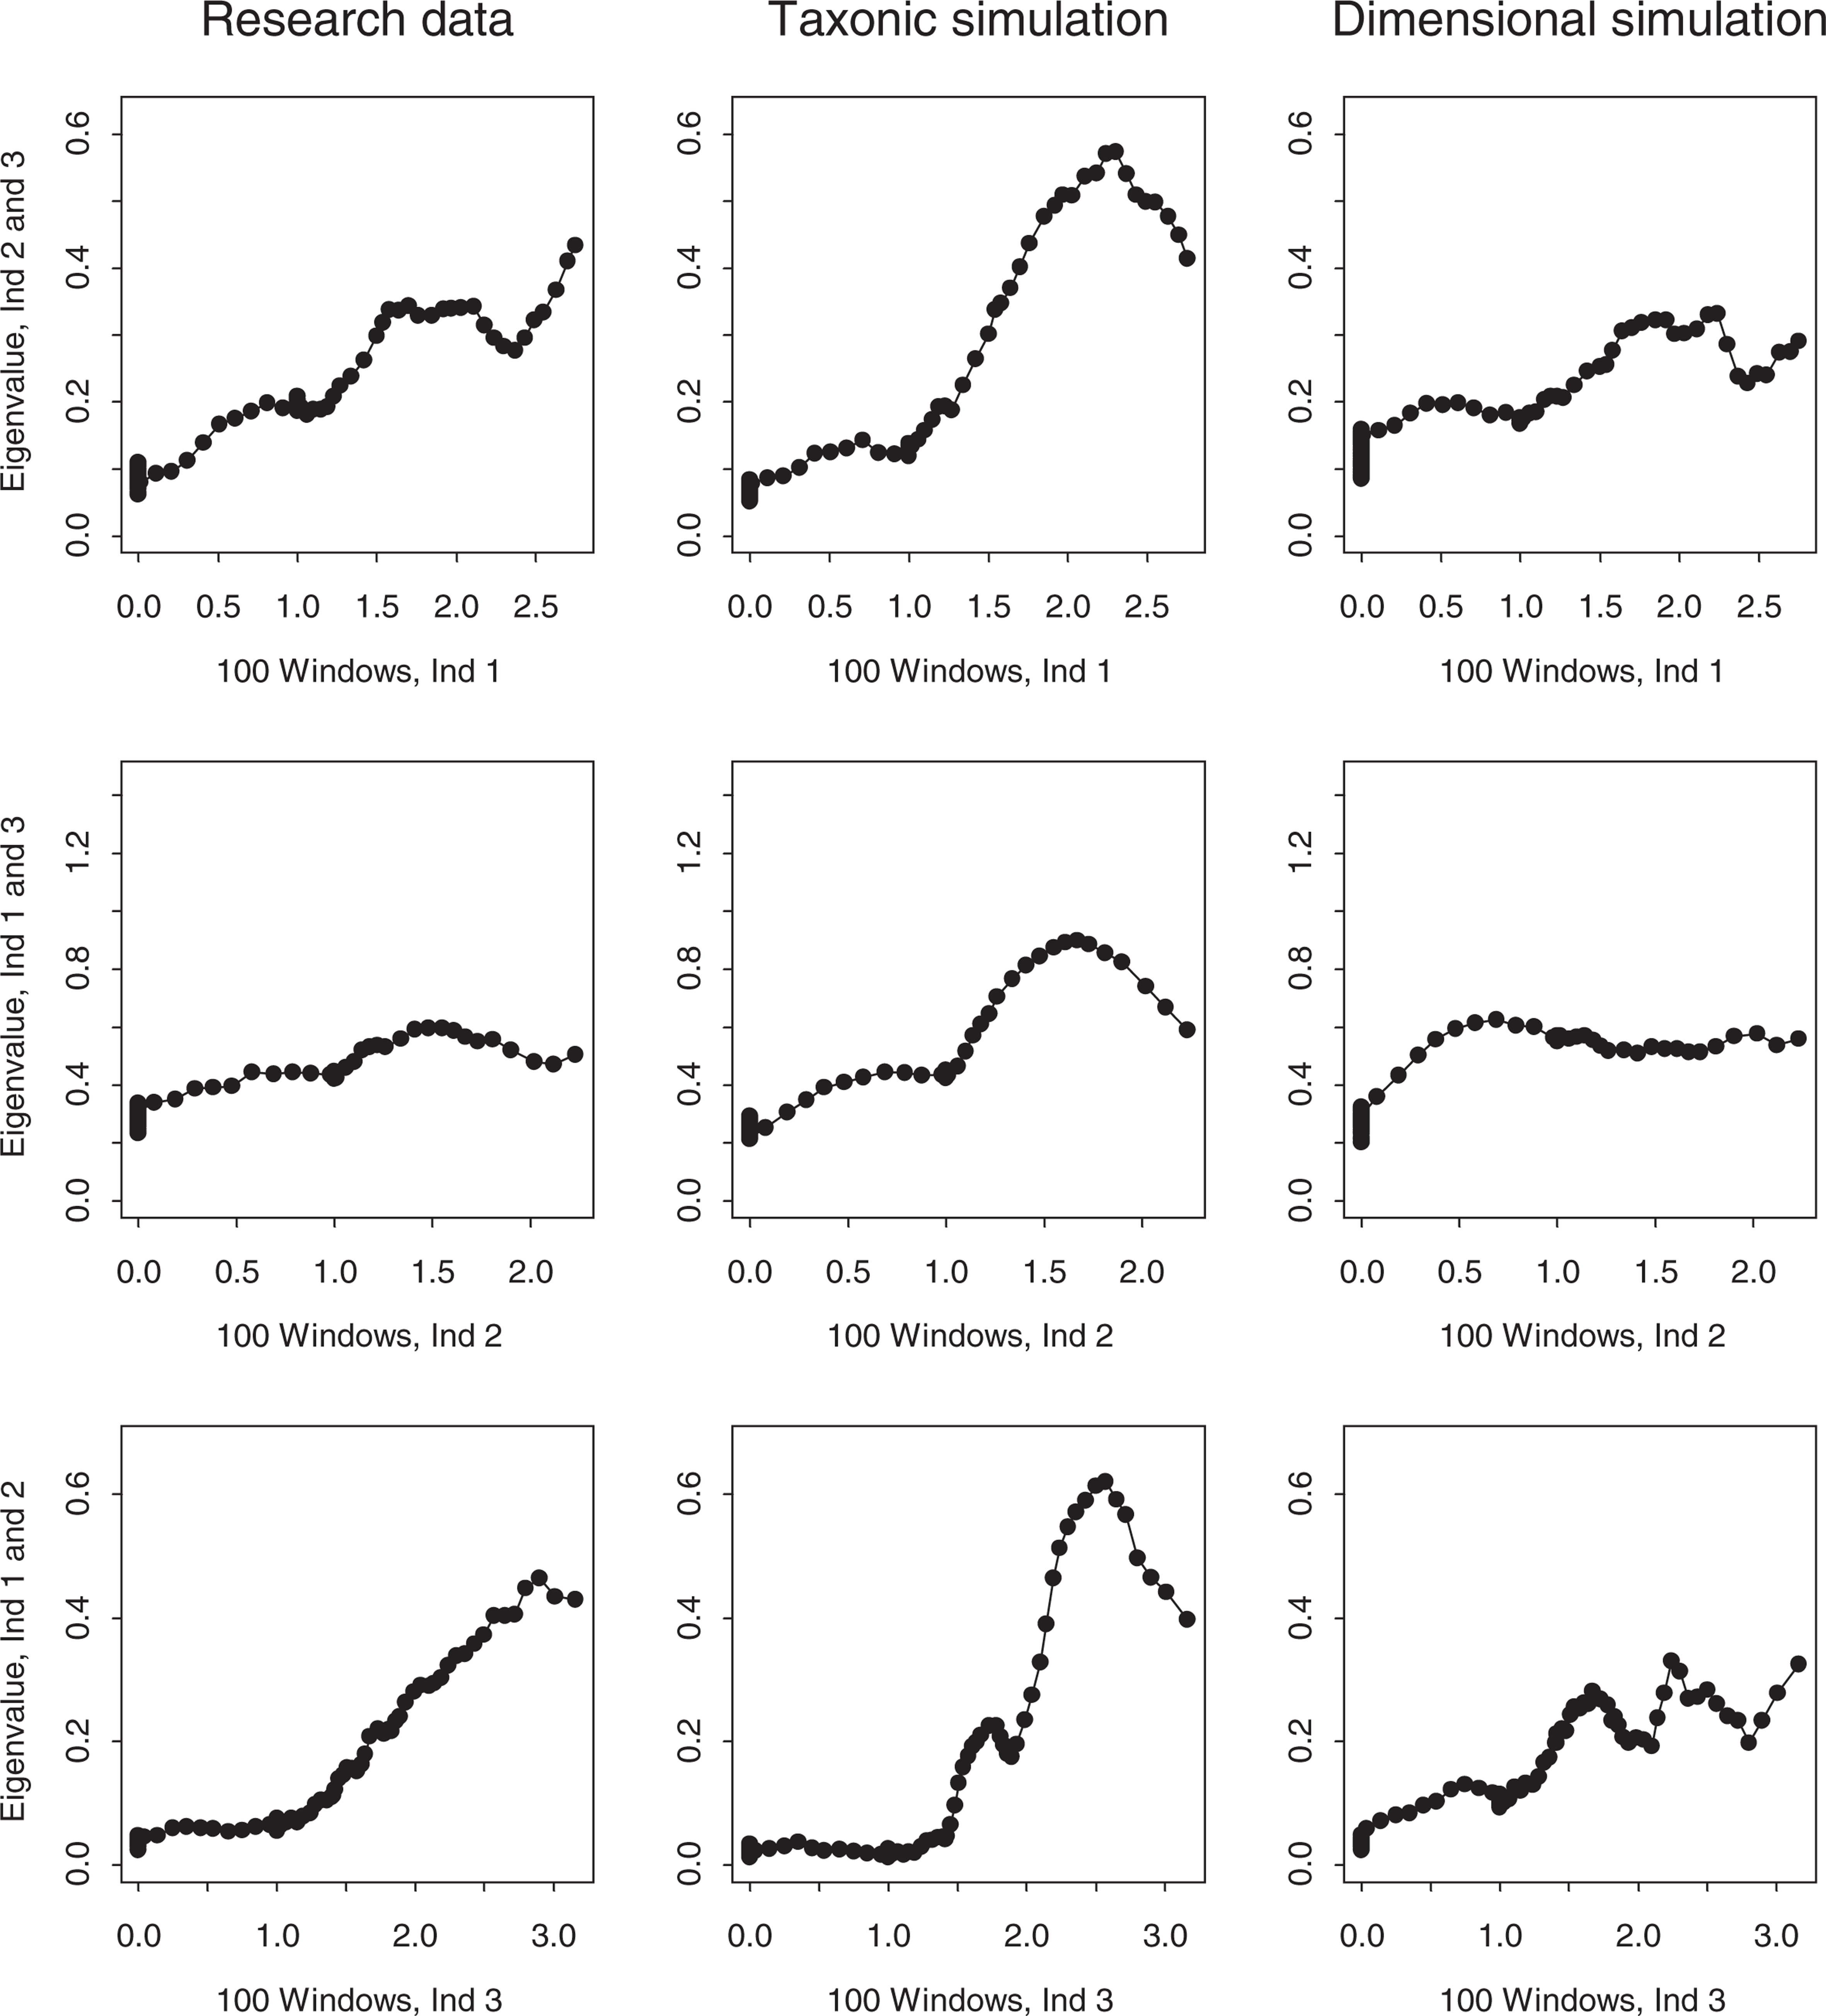
MAXEIG plots for the research data and matched taxonic and dimensional simulation data (child sample). MAXEIG plots for the research data and matched taxonic and dimensional simulation data (adolescent sample).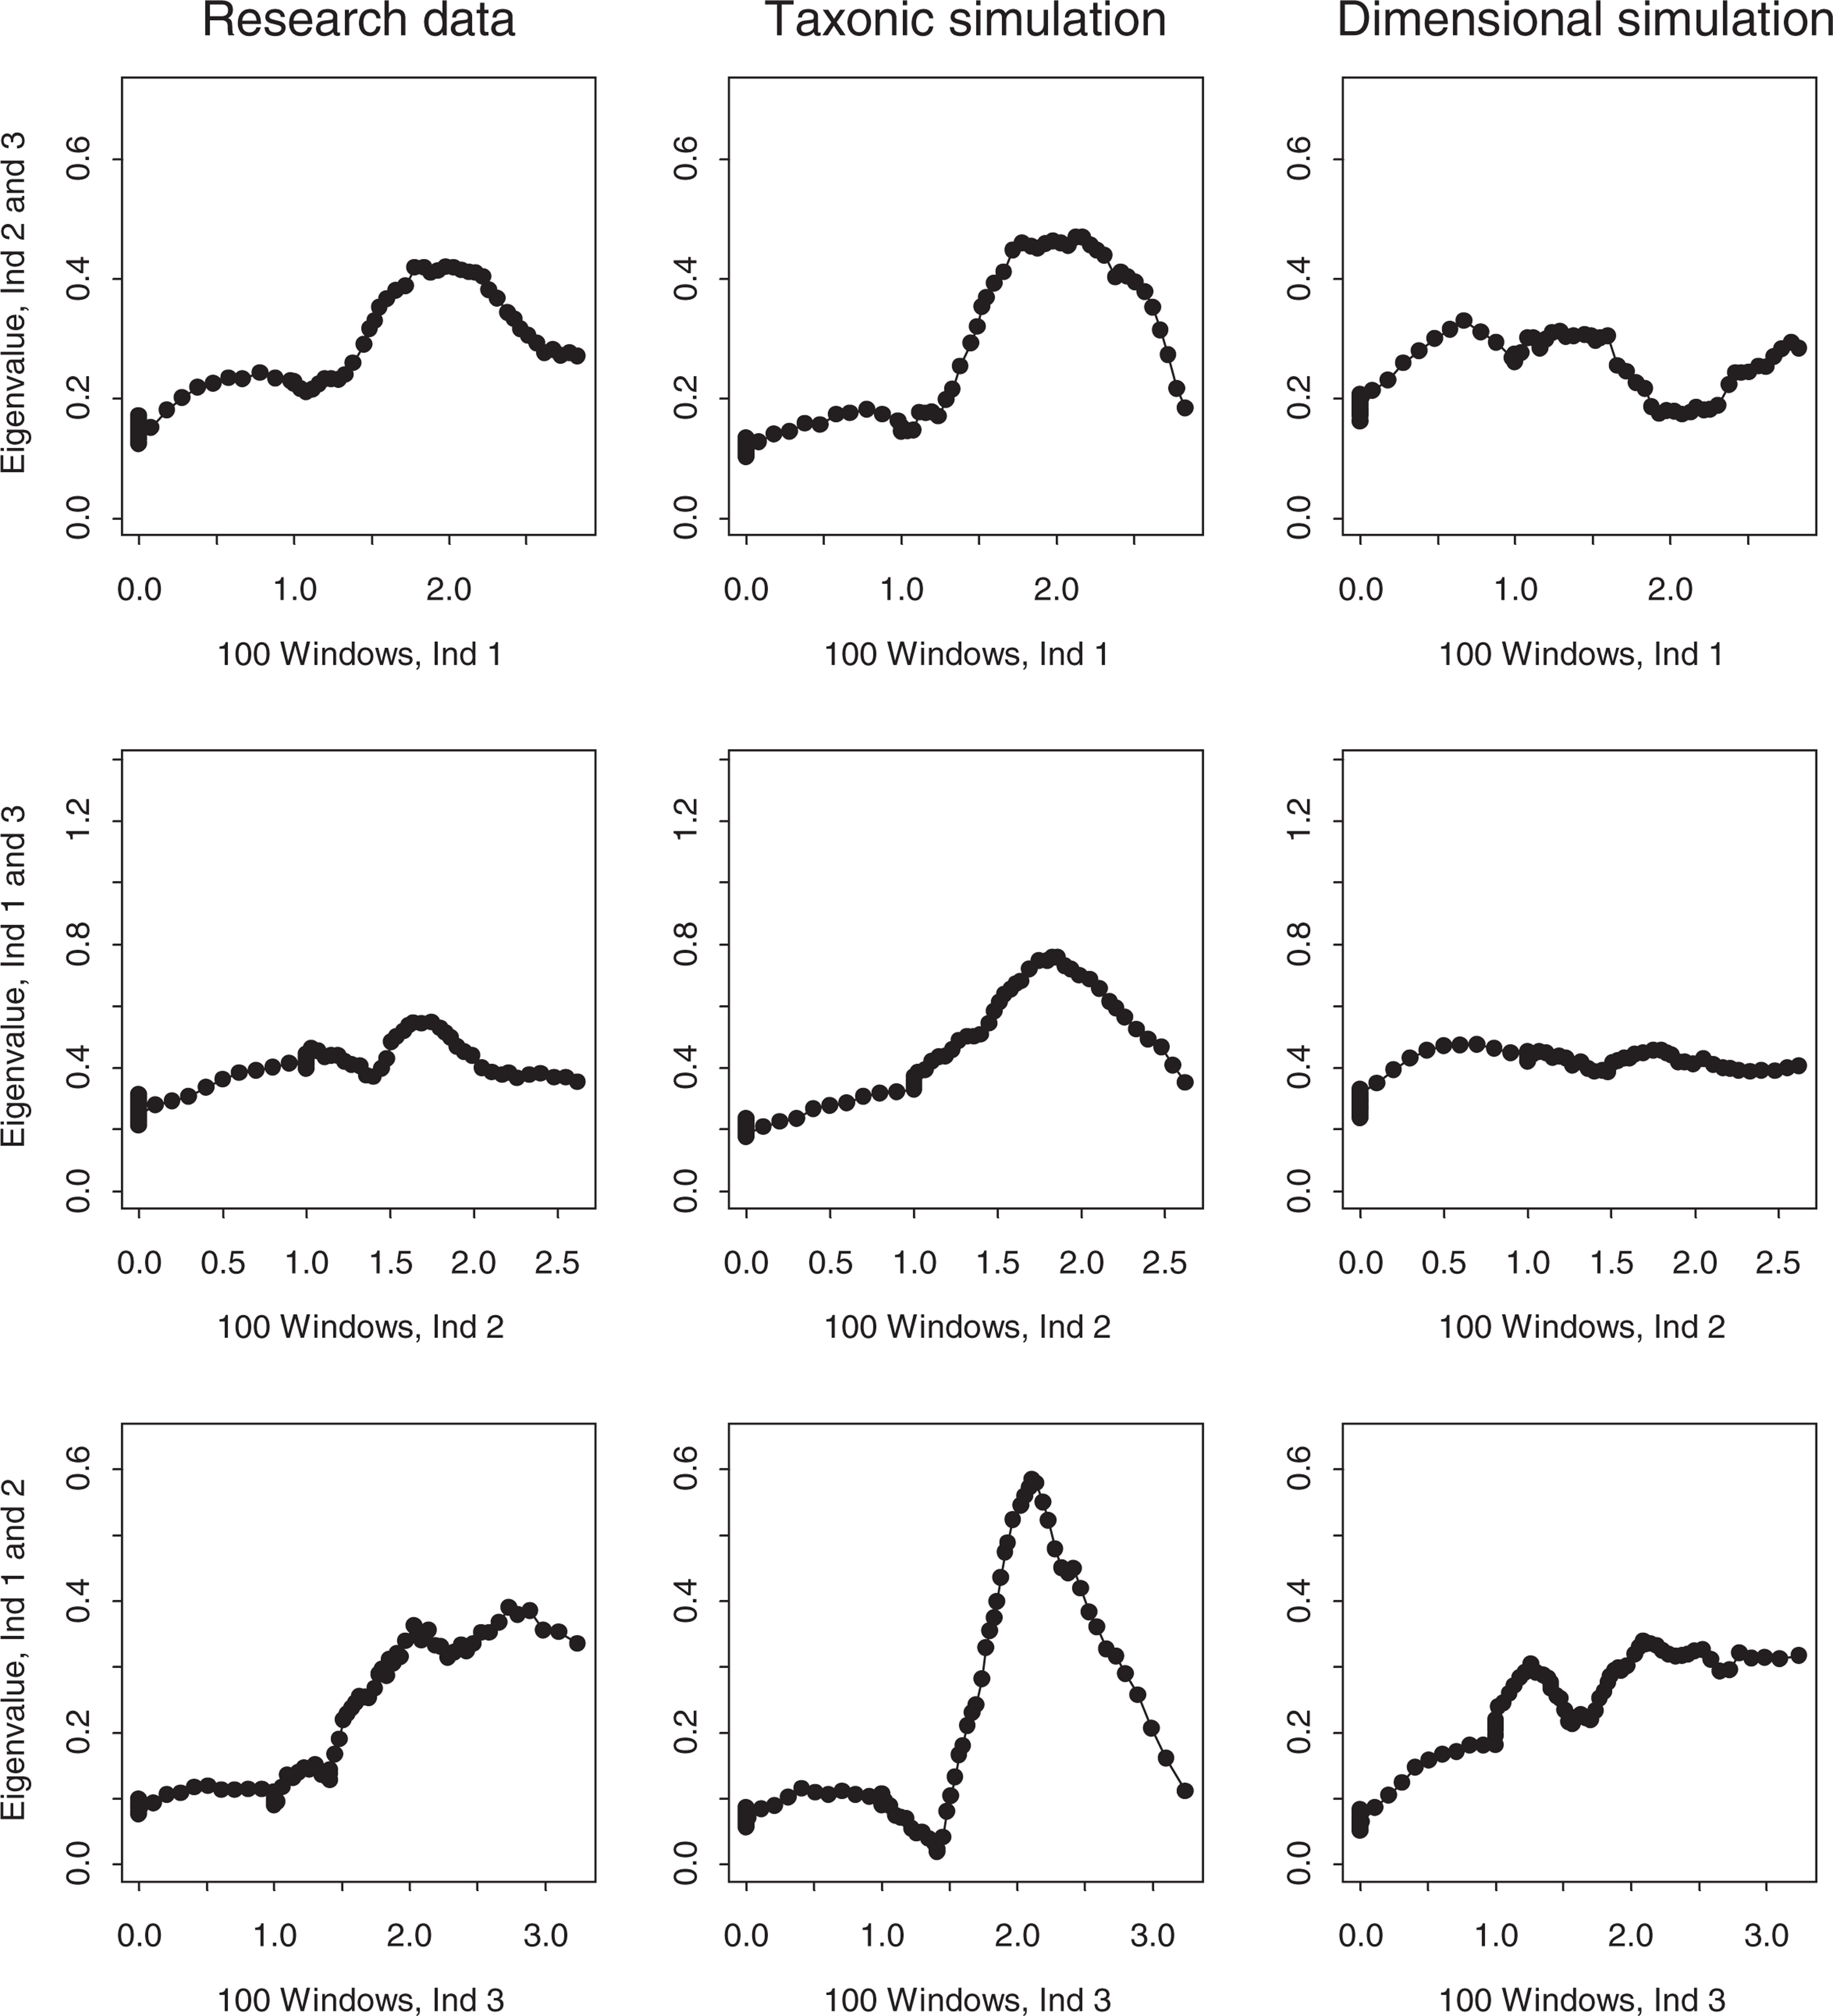
The MAXEIG plots for the child sample research data, presented in the first column of Fig. 1, fail to show any taxonic peaks. The top one has a slight hump, the middle one is flat, and the bottom one rises from left to right with no obvious peak. The corresponding dimensional simulations in the third column are quite similar, although the top one lacks any similar hump. In contrast, the three taxonic simulations all show clear elevated peaks that are markedly discrepant from the research and dimensional simulation plots. The Fitd value of + 1.85 supports the greater resemblance of the research data to the dimensional simulations. MAXEIG therefore supports a dimensional view of ADHD in the child sample.
The MAXEIG plots for the adolescent sample data, presented in Fig. 2, also vary in shape. The top and bottom plots rise linearly with no clear peak, and the middle one is quite flat. The dimensional simulation plots lack peaks and resemble the research data plots, although they are somewhat flatter. The taxonic simulation plots, in contrast, all show elevated peaks that plainly differ from the research and dimensional simulation plots. The Fit d value of + 1.78 again indicates that the dimensional simulations resemble the research data better than the taxonic simulations. The inchworm consistency test [10] revealed no tendency for a taxonic peak to emerge in either sample when the number of windows was increased from 25 to 150. MAXEIG therefore supports a dimensional view of ADHD among adolescents.
MAMBAC
MAMBAC (‘means above minus below a cut’) [42], the second most frequently used form of taxometric analysis, was used as a second taxometric procedure. MAMBAC plots the difference on one ‘output’ indicator between cases falling above versus below a sliding cut-point on the ‘input’ indicator, as a function of the cut-point's position. Dishshaped or monotonically rising plots point to a latent continuum and peaked plots to a taxon, with maximum MAMBAC values indicating the point of maximum admixture of taxon and complement members. Simulation research [42] supports the procedure's reliability. Ruscio's [39] MAMBAC program was implemented so as to compute the difference on each output indicator using 50 evenly spaced cuts beginning 25 cases from each extreme on an input variable constructed by summing the remaining two indicators. This method of constructing the input variable enhances MAMBAC's sensitivity, and yields three plots for each of the research, simulated taxonic, and simulated dimensional datasets. The plot panels for the child and adolescent sample research and simulated data (again averaged over 10 replications each of taxonic and dimensional comparison datasets) are presented in Figs 3, 4.
MAMBAC plots for the research data and matched taxonic and dimensional simulation data (child sample). MAMBAC plots for the research data and matched taxonic and dimensional simulation data (adolescent sample).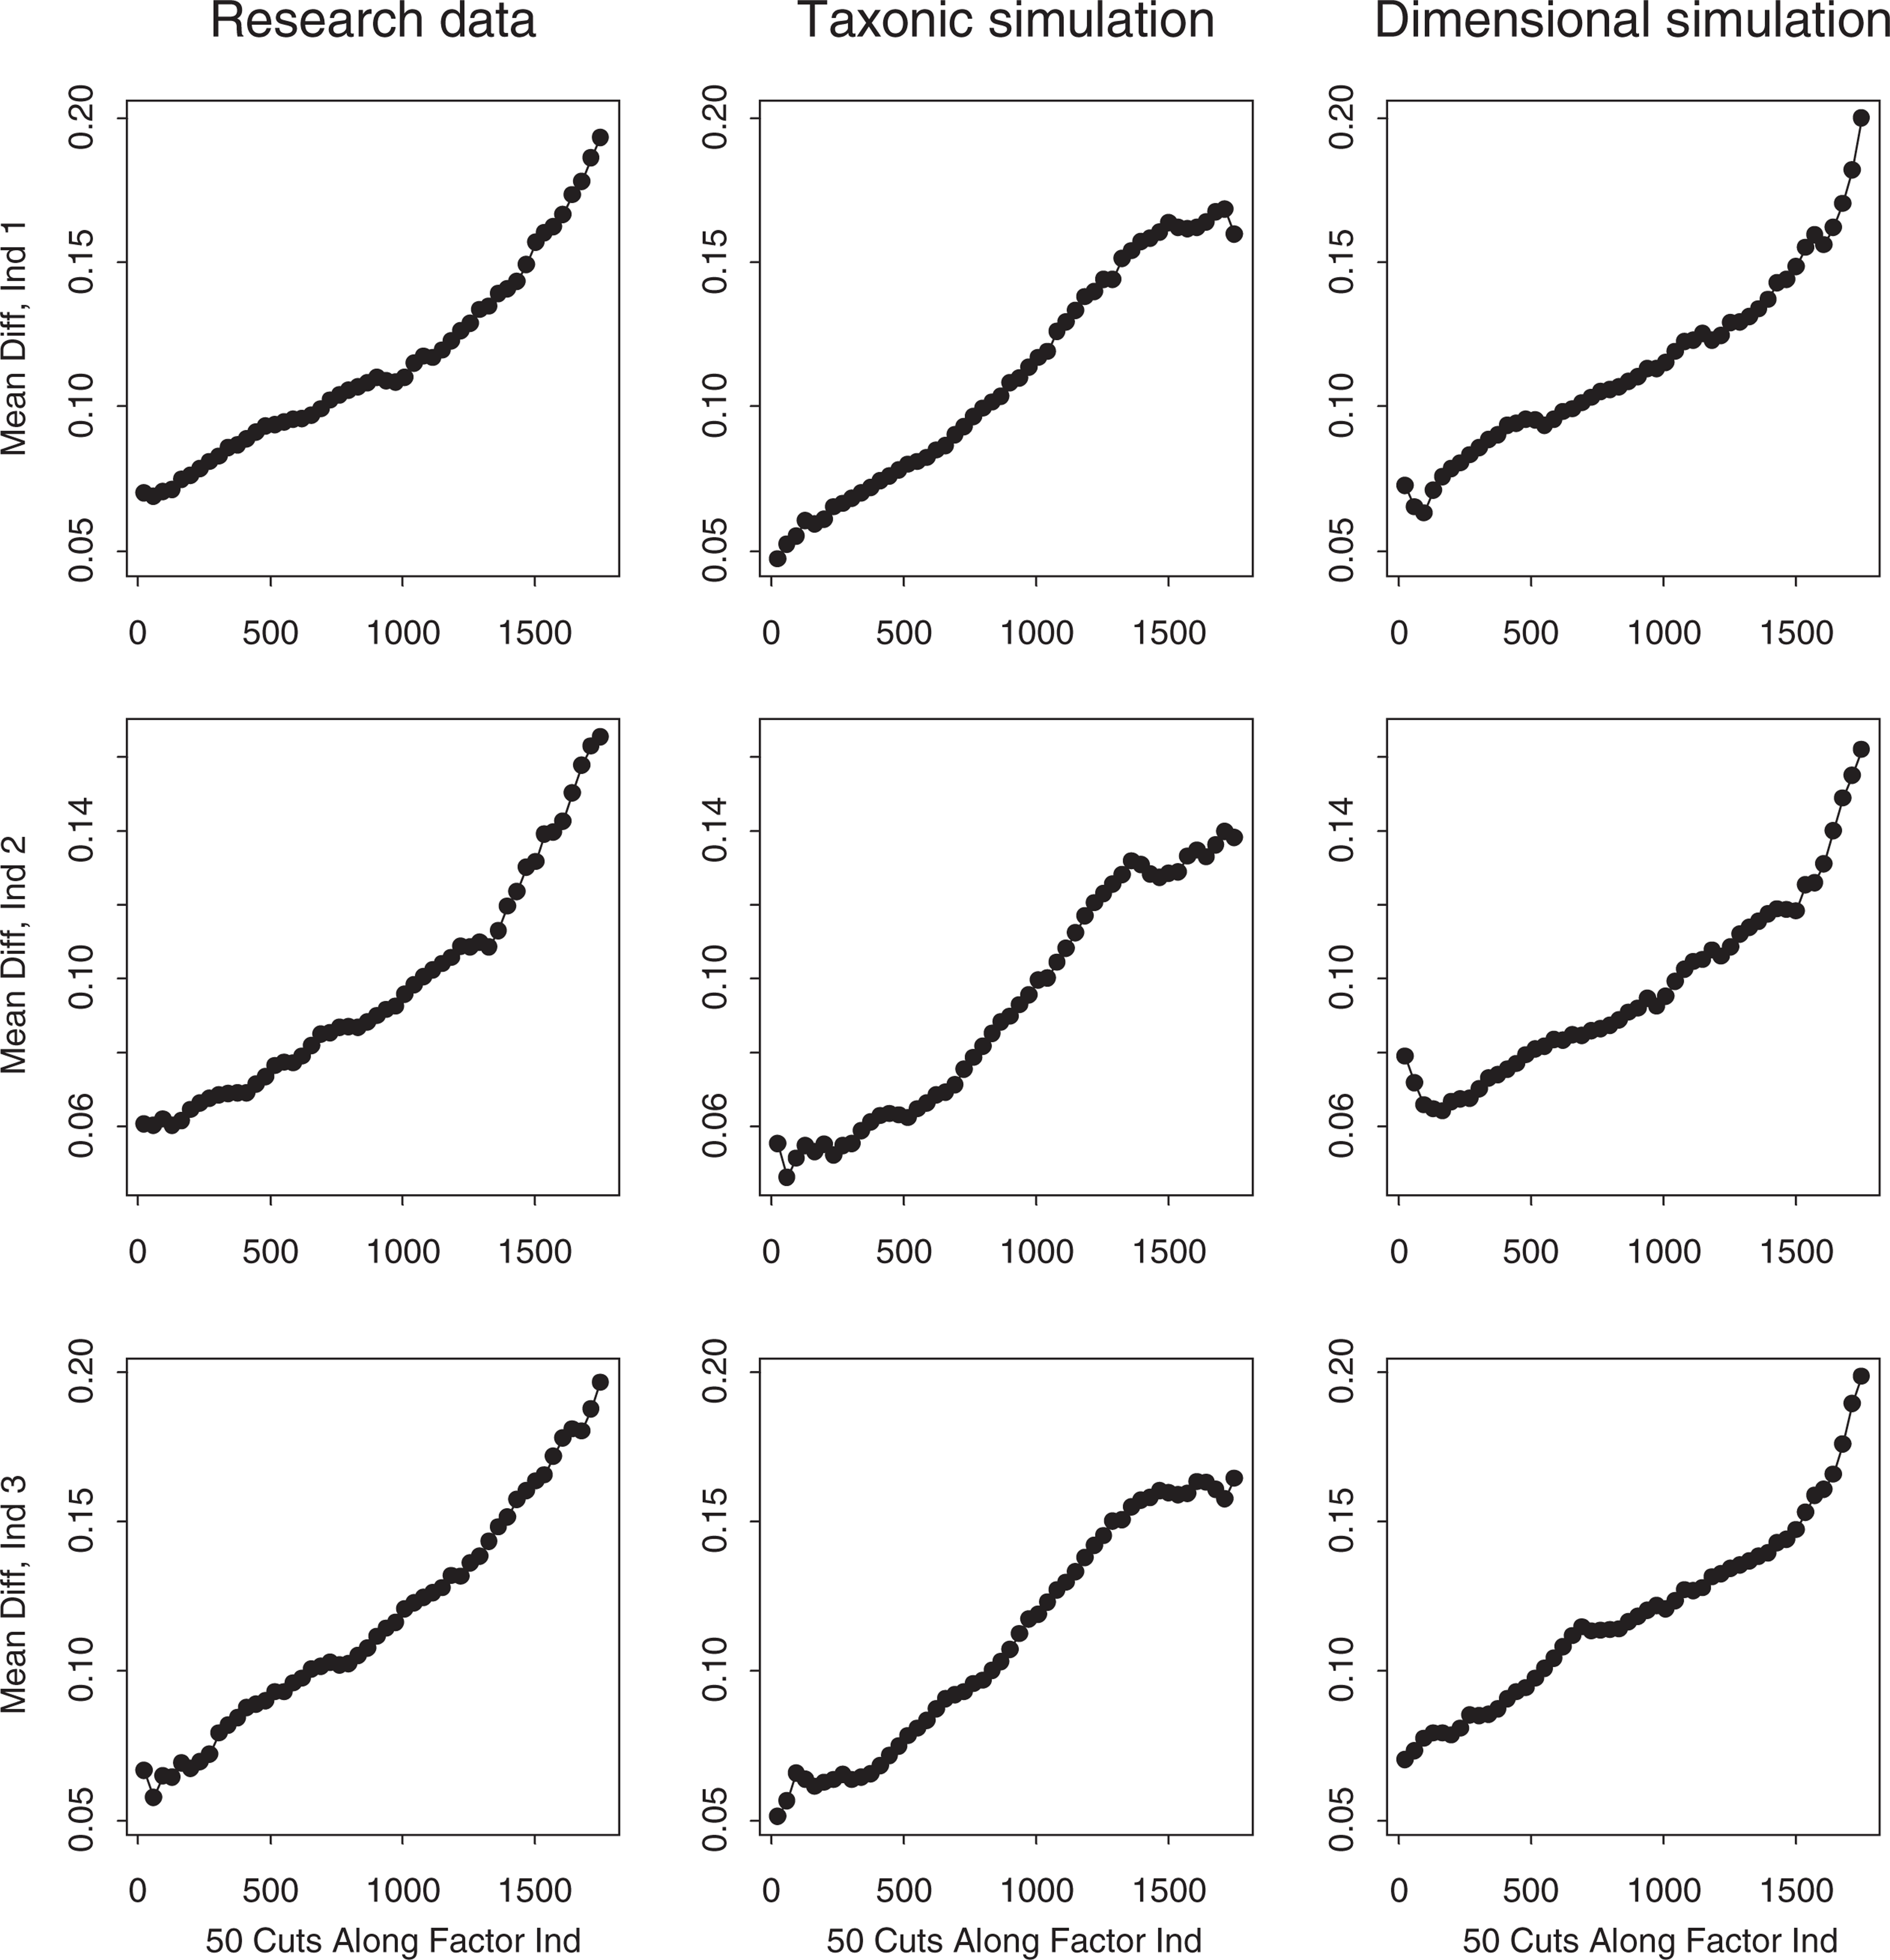
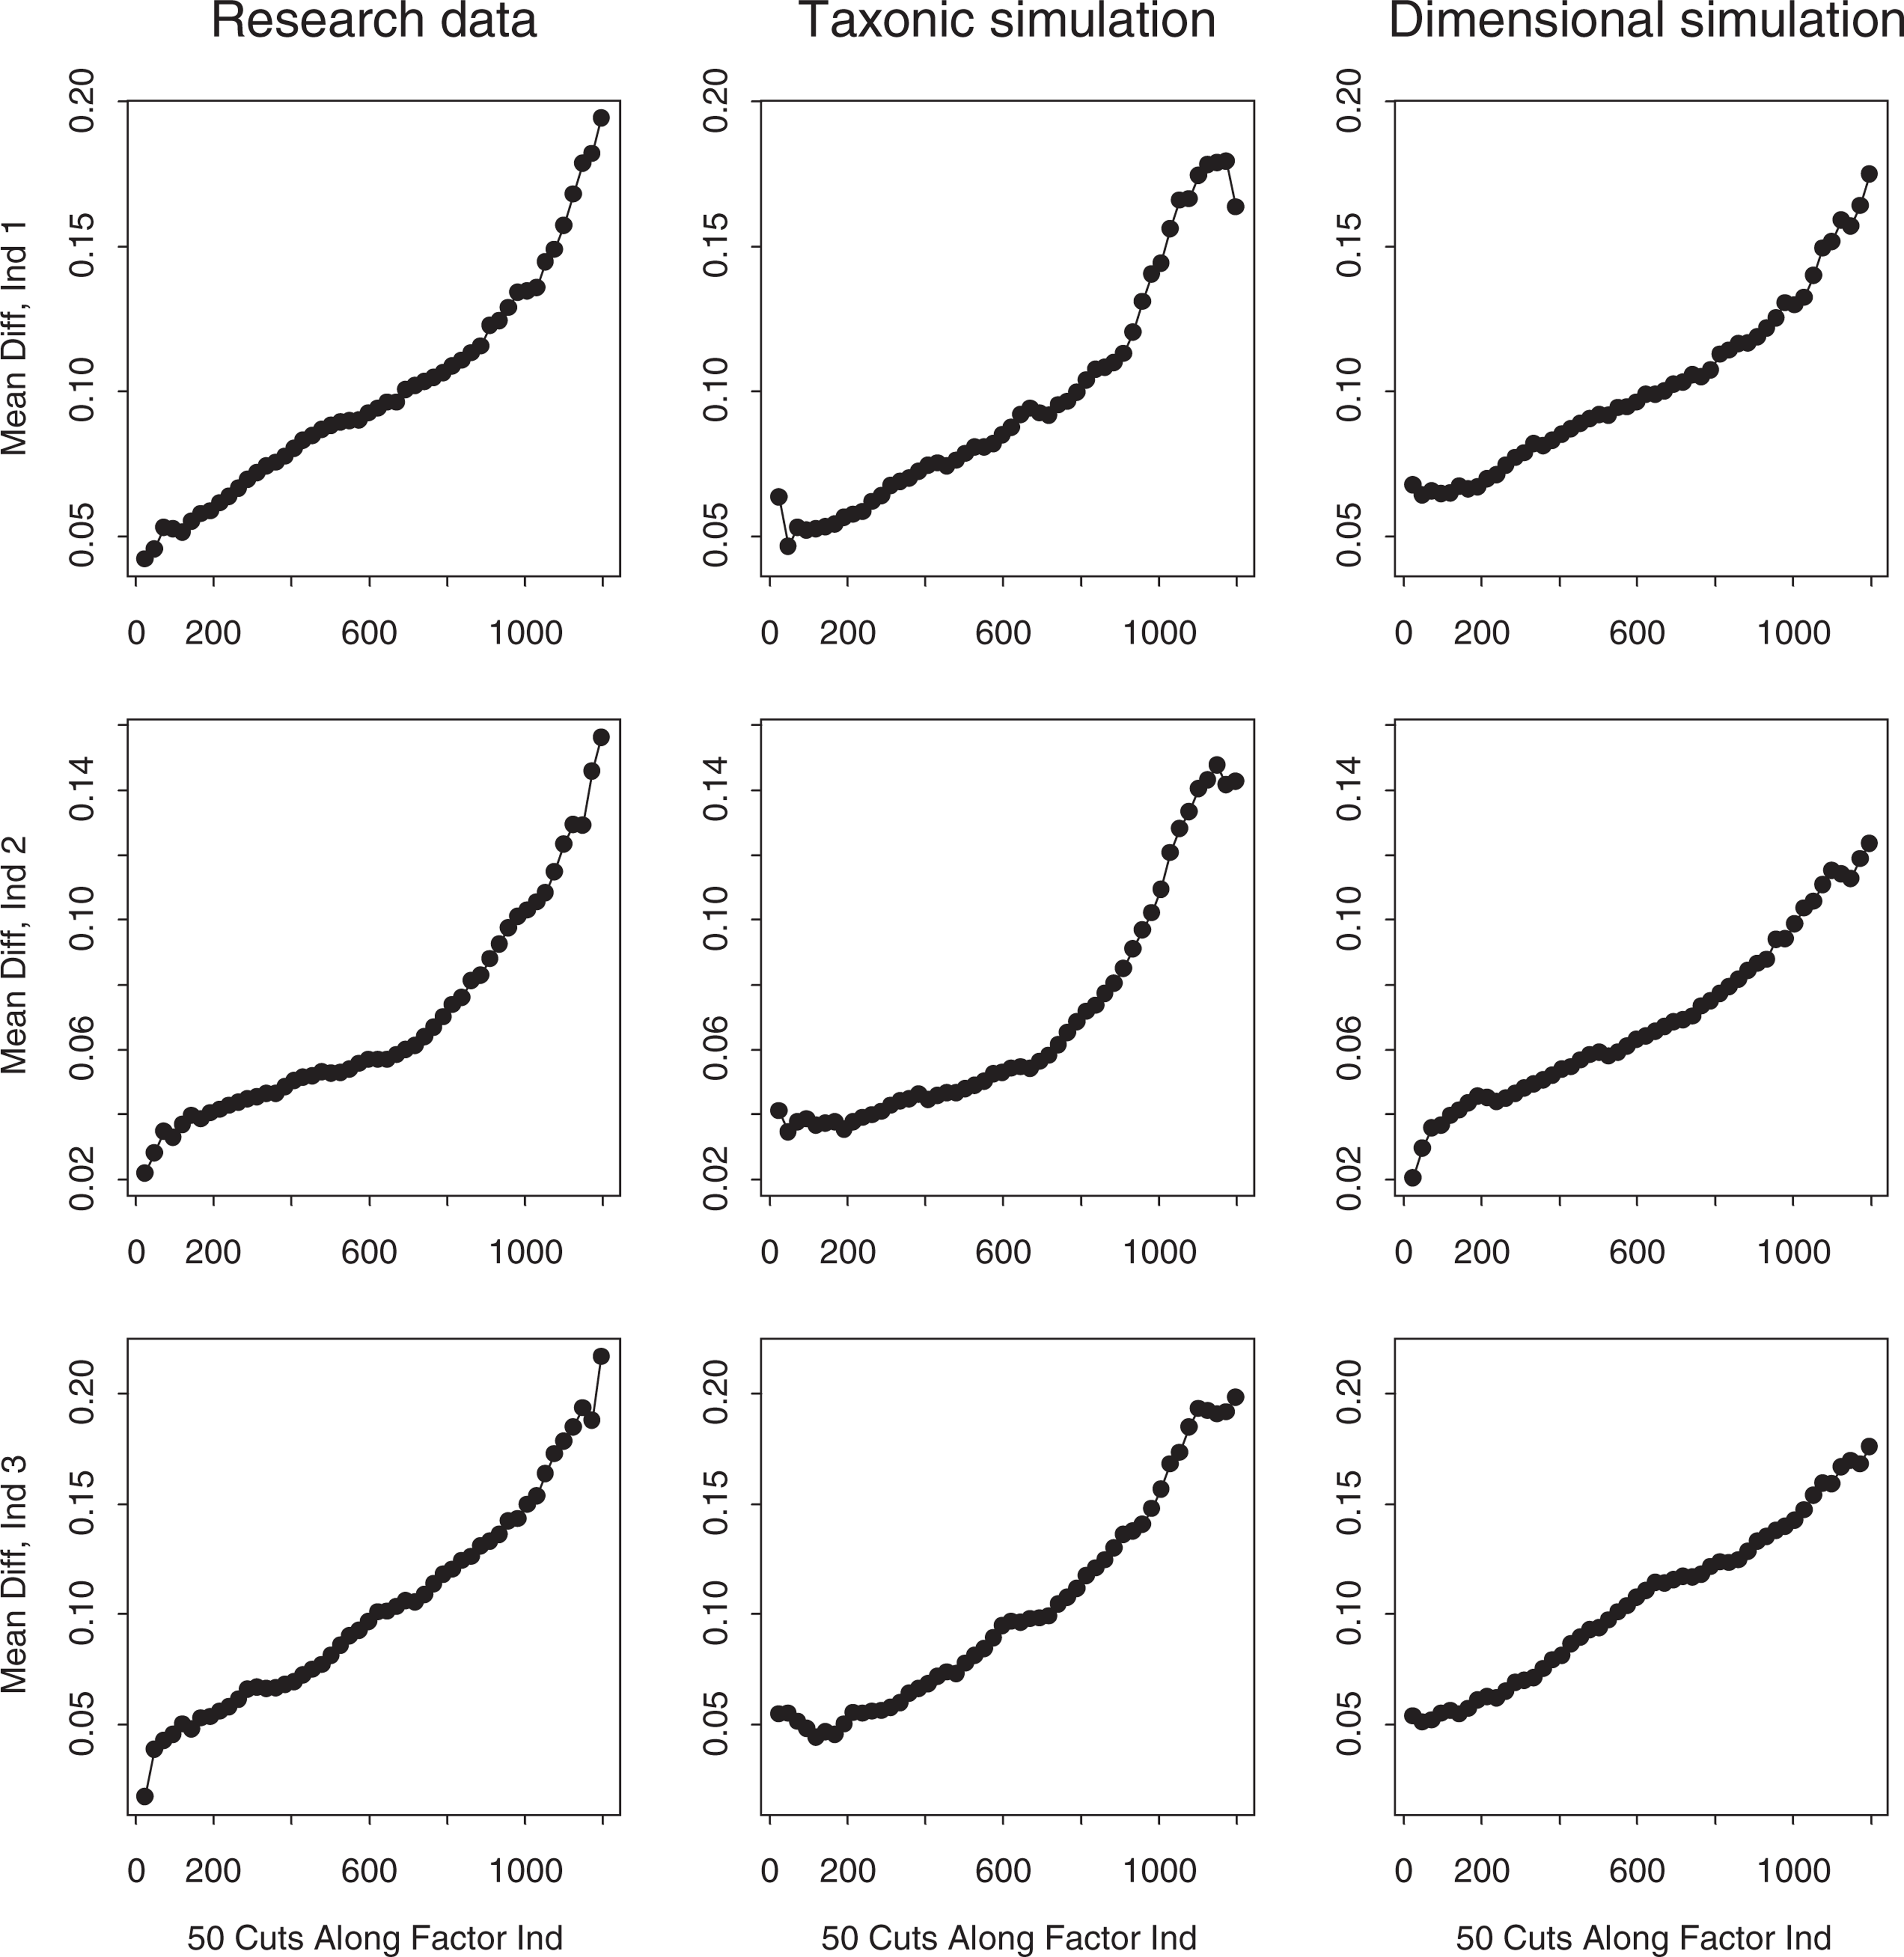
The MAMBAC plots for the child sample research data, presented in the first column of Fig. 3, rise linearly from left to right with no hint of the right-end peak that would indicate a low prevalence taxon. The dimensional simulation plots similarly show no peaks, and if anything tend to rise slightly more steeply at the right end. The taxonic simulation plots, however, all show right-end peaks or plateaus and have lower elevations than the research and dimensional simulation plots. The Fitd index (+ 3.26) indicates that the dimensional simulations approximate the research data markedly better than the taxonic simulations. Thus, MAMBAC clearly supports a dimensional view of childhood ADHD.
The MAMBAC plots for the adolescent sample research data, presented in Fig. 4, rise monotonically in the same manner as the dimensional simulation plots. Although the Fit d index (− 0.53) suggests that the taxonic simulations resemble the research data slightly better than the dimensional simulations, they all have right-end peaks whereas the research data have clearly dimensional (unpeaked) shapes. Thus the MAMBAC analysis favours a dimensional model of ADHD among adolescents.
Taken together, the two taxometric procedures strongly support a dimensional view of ADHD in the child and adolescent samples. MAXEIG and MAMBAC plots derived from the research data were consistently dimensional in appearance, and tended to resemble the dimensional simulation plots better than the taxonic simulation plots.
Discussion
The findings of the present study strongly favour the continuum view of ADHD in childhood and, somewhat less strongly, in adolescence. Although this view is widespread, research evidence for it has been inconclusive. While they have established strong genetic contributions along the entire distribution of ADHD-related phenomena, behavioural genetic studies have lacked the statistical power to rule out the existence of a discrete ADHD category, and the statistical methods to test directly between categorical and dimensional models. Earlier evidence of the unimodal distribution of ADHD symptoms and of their association with broad personality traits is also inconclusive. The present study's direct attention to latent structure, using methods of proven capacity to discriminate latent categories and continua, places the continuum view on a firmer footing than before. Our findings yield no positive evidence for an ADHD taxon, and considerable evidence that a dimensional model fits our data better than such a taxon. Ideally, future research on ADHD's latent structure will provide further evidence pertinent to this important issue, using different quantitative methods, samples and measures. Ideally, such work would use additional taxometric procedures or mixture modelling, adult as well as child samples, and cognitive assessments as well as ratings.
One implication of our findings is that it may not be fruitful for models of ADHD to propose causes that are specific to diagnosed cases. If there is no underlying discontinuity between cases and non-cases, then ‘specific aetiologies’ that imply a discontinuity (i.e. where experiencing a dichotomous causal factor entails having the disorder) are inadequate. The continuum model of ADHD implies instead that many causal factors combine to determine each person's position on a severity dimension. Our findings therefore suggest that genes, environmental factors, or gene–environment interactions that have been proposed as specific to ADHD cases may be less determinative than has been claimed. Alternatively, the continuum model could imply that a single preponderant causal factor for ADHD exists, but is itself distributed in a continuous fashion.
The present study's support for the continuum view of ADHD could be taken to imply that the placement of a diagnostic threshold for the disorder is arbitrary, and that classification systems such as DSM-IV should cease to draw a boundary where none exists. On the other hand, although it does suggest that no clear and ‘objective’ diagnostic boundary exists, the present study does not imply that categorical diagnosis of ADHD is inappropriate or that a threshold can only be set arbitrarily. First, categorical diagnostic decisions are pragmatically necessary in many clinical contexts, even if the distinctions that they draw are not rooted in objective discontinuities. Second, in the absence of such an ‘internal’ discontinuity the placement of a diagnostic threshold can be nonarbitrary if it is based on external criteria, such as impairment or need for treatment. Even if ADHD falls on a continuum, impairment may tend to become clinically meaningful at a certain level of severity, at which a categorical diagnosis might reasonably be made. Kessler [43] has advocated the use of taxometric analysis in diagnostic revision, arguing that when it supports a continuum model, researchers should locate thresholds by seeking inflection points in the association between severity and external criteria such as impairment. Although the relationship between severity and impairment appears to be relatively linear [8], Kessler's suggestion implies that this relationship offers a principled way of deciding where the diagnostic threshold should be set. Nevertheless, the apparent continuity of ADHD helps to explain why despite their similarity of content, the DSM-IV criteria for ADHD yield higher rates of diagnosis than the ICD-10 criteria for hyperkinetic disorder [44]. If it is not possible to ‘carve nature at the joints’, because no joints exist, then these divergent carvings are to be expected.
In conclusion, we urge that taxometric methods become more widely used in research on child and adolescent psychopathology. These methods are powerful and flexible, and have been used profitably with adults for some time. Ideally, our findings would be replicated, particularly in clinical samples where higher rates of ADHD might improve the method's sensitivity, and with indicators that are not all based on a single information source, in this case ratings by and interviews conducted with one parent. Numerous other forms of childhood disturbance could benefit from taxometric attention. Whether autism and Asperger's syndrome differ in kind or only by degree is one pressing example. Another potential application of taxometrics concerns not single disorders but their subtypes. Some taxometric research on subtypes of depression has been conducted [29], but the status of ADHD subtypes, for instance, remains moot. Although it is difficult to formulate how a discrete subtype could occur in the absence of an overarching discrete ‘type’, this possibility should be tested and the dimensions along which putative subtypes differ speci- fied if no taxa are found. Future research might use taxometric methods to clarify these and related questions.