
Abstract
Since Glover's pioneering 1938 study documenting large regional differences in the rates of tonsillectomy in England [1], the analysis of geographical variations in health has become an ‘industry’ in its own right. We have separately reviewed what is now commonly called the small area variations (SAV) literature in health [2]. In general, a SAV study analyses differences in per capita utilization of a medical service over defined geographical areas. Some SAV-type studies have been undertaken of mental health services. For example, hospitalization rates [3–5] and the use of pharmacological and non-pharmacological therapies [6] have been analysed in this way.
With respect to electroconvulsive therapy (ECT), there have been studies which documented changes in utilization over time (temporal variations) and in location. Thompson et al. have calculated that ECT use in the USA fell by 46% between 1975 and 1980 [7] and then remained approximately constant from 1980 to 1986 [8]. Analysis of a population of US Medicare beneficiaries indicated that ECT utilization began to rise in the 1990s [9]. Some of the variations over time may be explained by changing government regulations [10, 11].
Changes over time in ECT use have also been observed in other countries. Pippard's [12] data for two regions in England between 1980 and 1990 indicated a decline in use, whereas Malla [13] found no decrease in Newfoundland, Canada. Similarly, Stromgren found that there was stable utilization in the Nordic countries [14]. Geographical variations in the use of ECT have been documented for Ireland [15, 16], the UK [12] and the USA [17, 18]. Thus, there is some evidence to indicate variations both over time and location in ECT utilization in various countries. In Australia, there have been few studies of ECT utilization over time or across locations. For example, in one small study, Galletly et al. [19] found a gradual decline in ECT between 1981 and 1985 in Hillcrest Hospital, South Australia.
This paper attempts to answer three questions. First, what proportion of psychiatric services in Australia are ECT services? Second, how has this share varied through time? Third, has there been any variation by state in the use of ECT in Australia?
Method
Under Australia's national health insurance scheme, Medicare, all medical services provided by private medical practitioners (operating on a fee-for-service basis) are recorded in a national database. Aggregated data can be made available by the Commonwealth Department of Health and Ageing (within legislative confidentiality and privacy guidelines) by item numbers or aggregations of item numbers. Quarterly data (from the introduction of Medicare on 1 February 1984) by state/territory until the second quarter of 2004, aggregated at the state level, were provided for this analysis. To ensure that privacy provisions were met, ACT data was included with NSW and NT data with SA. The raw and derived data (shares, utilization rates, etc.) are available from the authors on request.
We grouped psychiatric services, using the individual item numbers or attendances listed in the Medicare Benefits Schedule, into four categories: individual patient consultations (whether in consulting rooms, hospital, nursing home or home visit), group psychotherapy, interviews with a person other than a patient and ECT services.
To describe the share of ECT services in all psychiatric services, first we compared the number of ECT with the number of all psychiatric services, and second the total expenditure on ECT with expenditure on all psychiatric services (whether funded by governments or individuals), and third the share of Medicare Benefits for ECT services compared to Medicare Benefits for all psychiatry services.
These three shares (S
1
S
2 and S
3) are defined as follows:
It is worth observing that the difference between the middle-ranked measure and the lowest-ranked measure represents the relative importance of net fees, or out-of-pocket expenses, for consumers.
The analyses for variations in ECT over time (temporal utilization) and by state involve utilization rates (i.e. numbers of services per 100 000 population). All data reported in our analysis are quarterly, and such data typically exhibit a seasonal pattern, as do the data on general practitioner services [20]. Even though there is no known statistically identifiable seasonality in the ECT utilization rates, seasonally adjusted data have been employed in our diagrams in order to concentrate attention on the temporal trend [21].
Results
Figure 1a shows the percentage of all psychiatric services in terms of the previously defined fourfold categorization of services from the third quarter of 1984, that is, 1984(3), to the second quarter of 2004, that is, 2004(2). The Y-axis of Fig. 1a has a logarithmic scale to base 10. Although there have been some temporal changes in service delivery, for example, group psychotherapy has declined from 6.8% of all services in 1984(3) to 2.0% in 2004(2), there were no ranking reversals of the four categories in the period analysed. ‘Consultations’ dominate the mix of services provided by private psychiatrists, increasing from 91.7% of services in 1984(3) to 97.2% in 2004(2).
Various measures of the place of ECT services (and other services) in total psychiatric services in Australia from 1984(3) to 2004(2). (a) Percentage share of ECT and three other types of services to all psychiatric services. (b) Three measures (quantities, Gross Fees charged and Medicare Benefits paid) as a percentage of total psychiatric services. (c) Utilization of ECT services per 100 000 population, unadjusted and smoothed. (d) Smoothed utilization of ECT and all psychiatric services (excluding ECT) per 100 000 population. Note: The data analysed exclude several new items applicable to private for-fee service psychiatry (tele-psychiatry and consultations subsequent to telepsychiatry) introduced in 2003. Quantitatively these new items are not large, being only 177 in the year 2003–04. ECT, electroconvulsive therapy.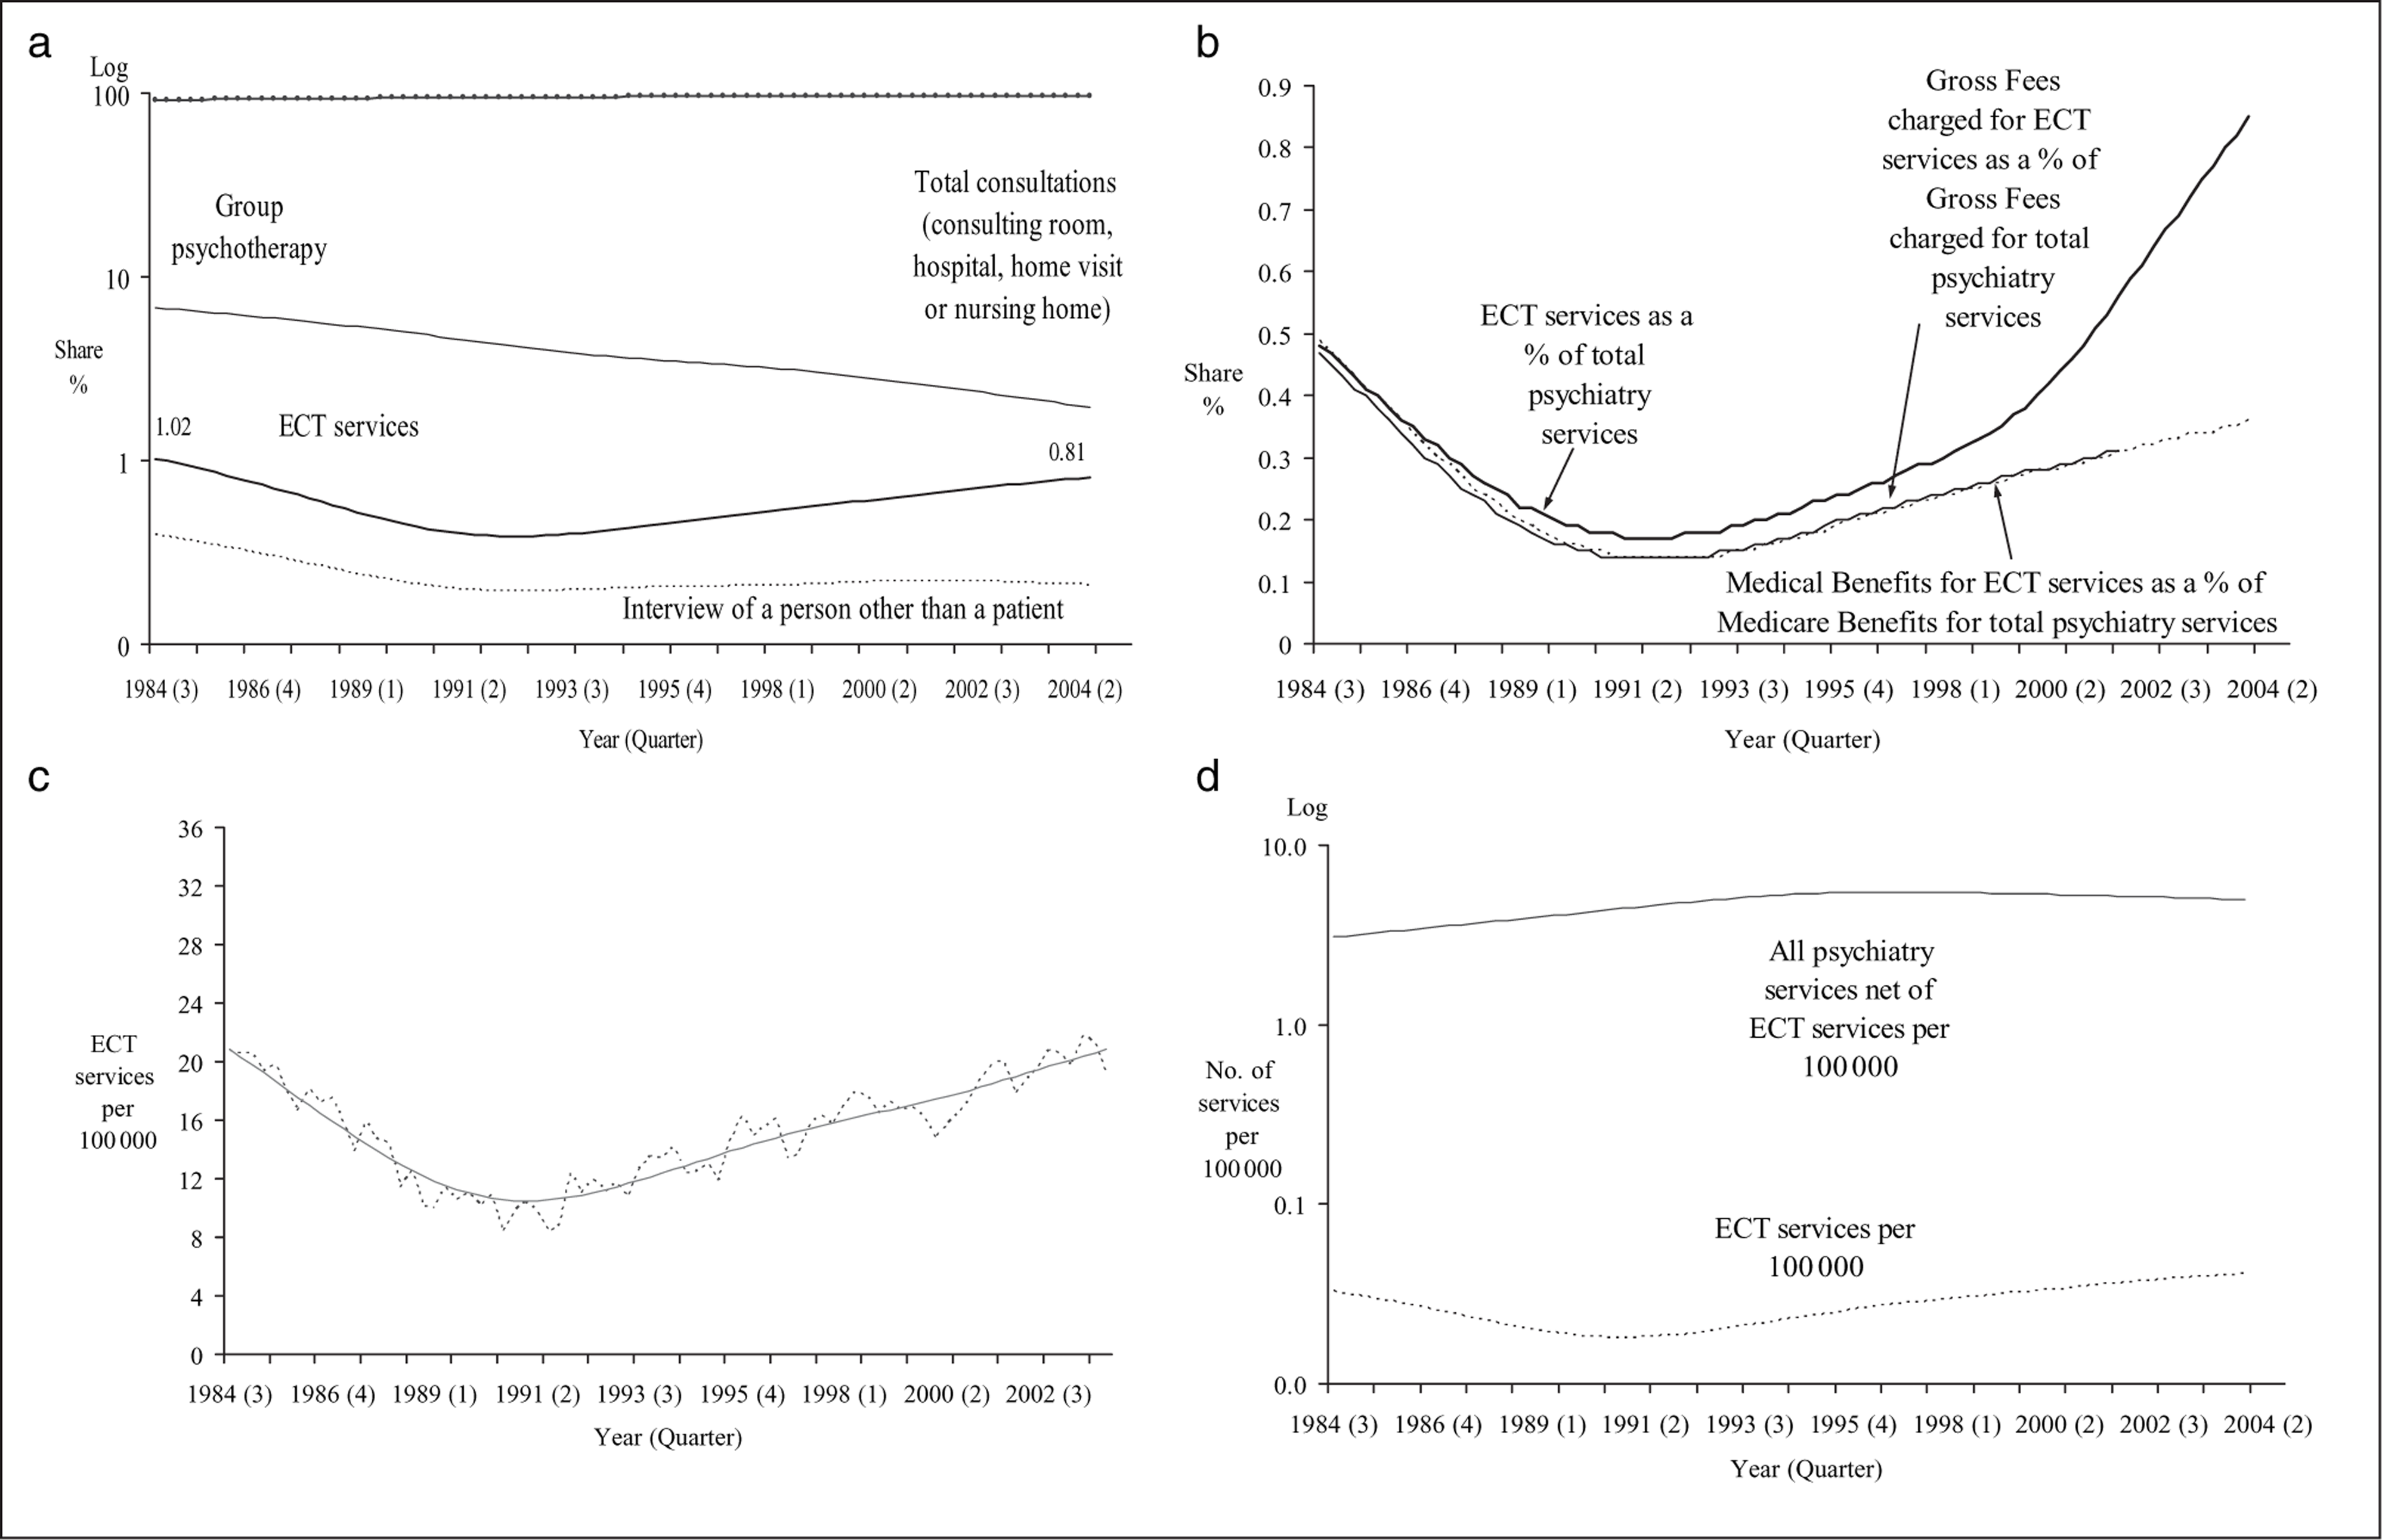
Electroconvulsive therapy represented only 1.0% of all services in 1984(3) and 0.8% in 2004(2). The period in which the percentage was lowest (0.3%) was 1991(3). There seems to be a U-shape to ECT's percentage share of services, but given the low numbers involved, this is not particularly obvious even with the use of the log scale for the Y-axis.
Figure 1b presents the two other measures of relative shares of ECT services. One graph (the highest) repeats the measure considered in Fig. 1a, although the scale on the Y-axis is different from the scale in Fig. 1b. The second highest graph depicts the ECT share of total expenditure for all psychiatric services. Data on Gross Fees charged from 2001(4) were not available. This relationship is also U-shaped, indicating the changing share of expenditure on ECT through time. That this graph lies below the physical quantity share graph indicates the prices of ECT services are, on average, less than those for all psychiatric services. It is beyond the scope of this paper to analyse the ‘relative values’ of the various psychiatric services. The third (lowest) graph represents the financial significance of ECT services from the perspective of the Australian Government (in the form of Medicare Benefits). This relationship is also U-shaped given that the Medicare Benefits are determined as 75% and 85% of schedule fees for in-hospital and outof- hospital services, respectively.
Variation through time
Figure 1c presents the quarterly data for Australia on the number of ECT services per 100 000 population for the period 1984(3)–2003(4). The dashed line indicates the unadjusted quarterly utilization rate, whereas the solid line indicates the seasonally adjusted rate. Again, the curve is U-shaped; the utilization rate falls from the first observation in 1984, reaches a minimum in 1991, and then rises.
Figure 1d presents the variation over time in the utilization rate of all psychiatry services excluding ECT services and the ECT rate. Note that the Y-axis in Fig. 1d has a log scale. The graph for ‘all psychiatry services excluding ECT’ in Fig. 1d indicates a rising utilization rate to about 1996 and a gradual decline thereafter. The U-shaped ECT rate is different, raising the prospect that different factors are influencing utilization rates.
Variation by state
Figure 2 shows ECT utilization rates for the six states of Australia, and Australia as a whole. Data from the ACT and the NT have been included with NSW and SA, respectively. The state diagrams are comparable to Fig. 1c, the aggregate experience for Australia. Queensland, SA/NT and Victoria have the highest rates, and WA seems to have, by far, the lowest rate. Casual observation suggests that the U-shape may exist in all regions with the exception of SA/NT, where the utilization rate may be linear.
Number of ECT services per 100 000 population, six states/territories of Australia and Australia from 1984(3) to 2003(4), actual and seasonally adjusted. Note: The vertical lines indicate turning points, which are estimated from the equations in Table 1, not from the seasonally adjusted data superimposed on the graphs. ECT, electroconvulsive therapy.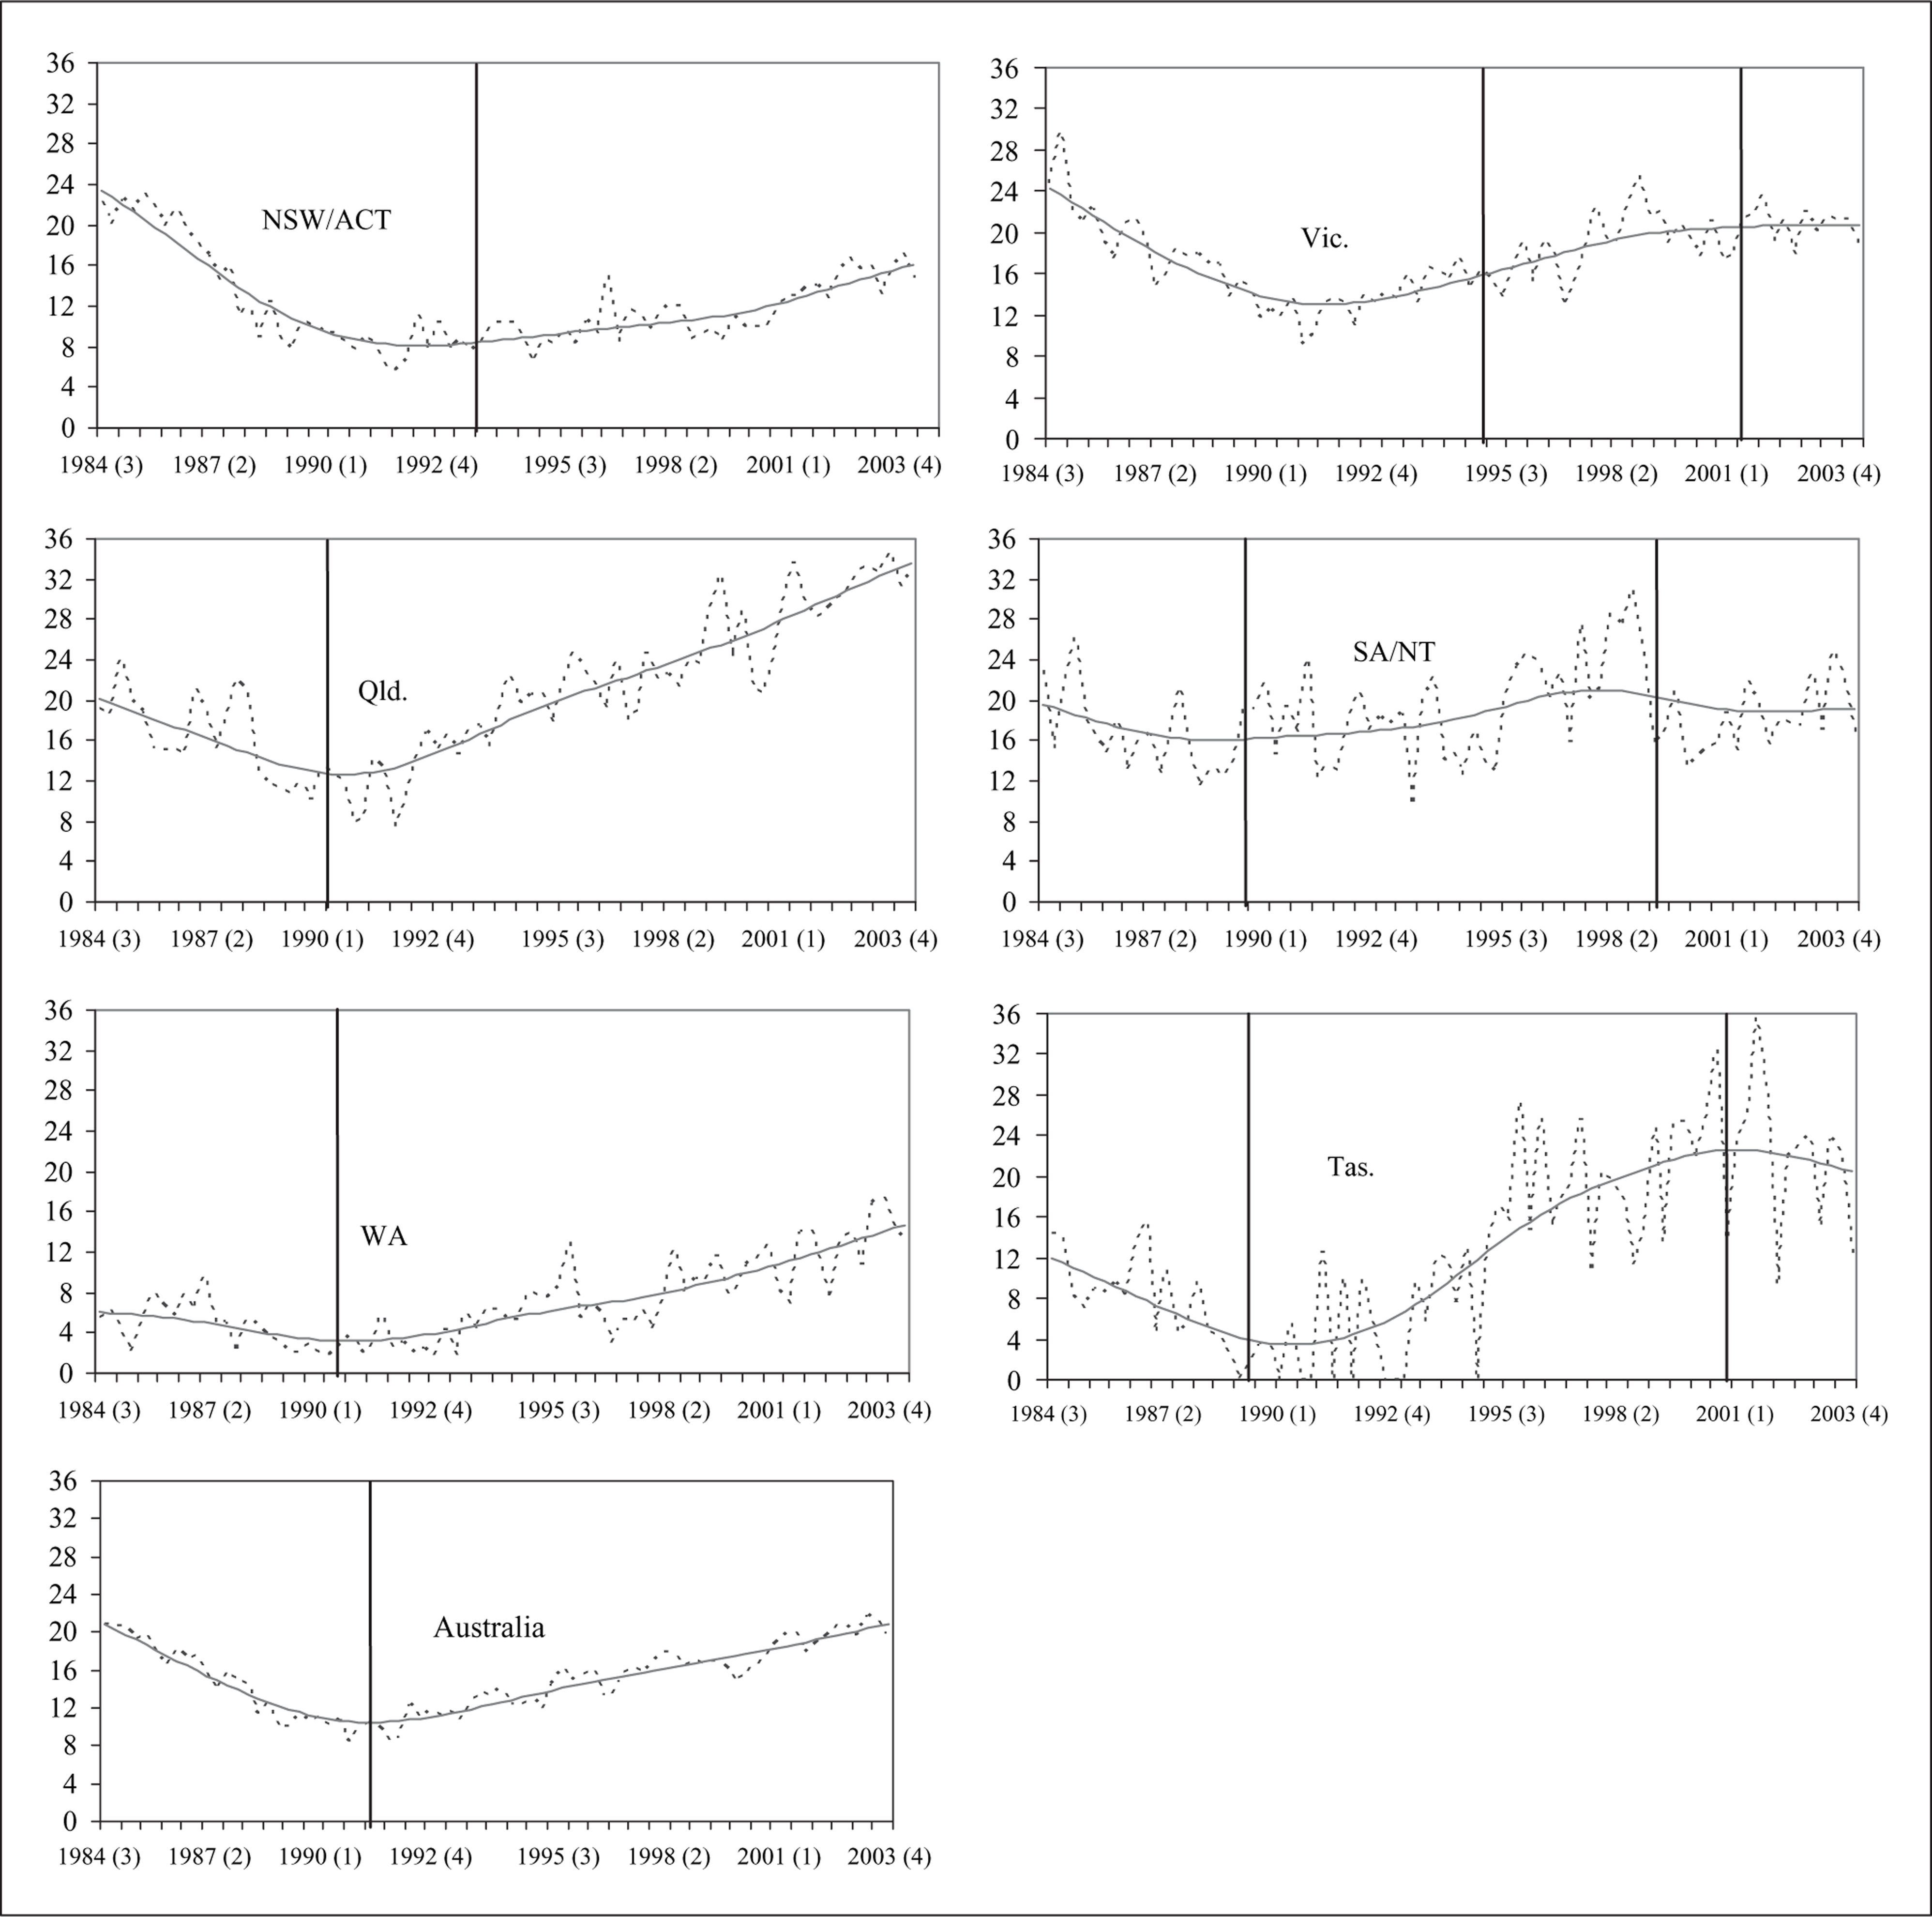
Temporal variation has been modelled by a cubic time-trend for the individual states and Australia; any seasonality has been accounted for in order to emphasize temporal variation, and it was found necessary to allow for second-order autoregression. Table 1 presents the results for the temporal variation component.
Fitted equations of ECT utilization per 100 000 people, states/territories and Australia, 1984(3) to 2003(4)(a)
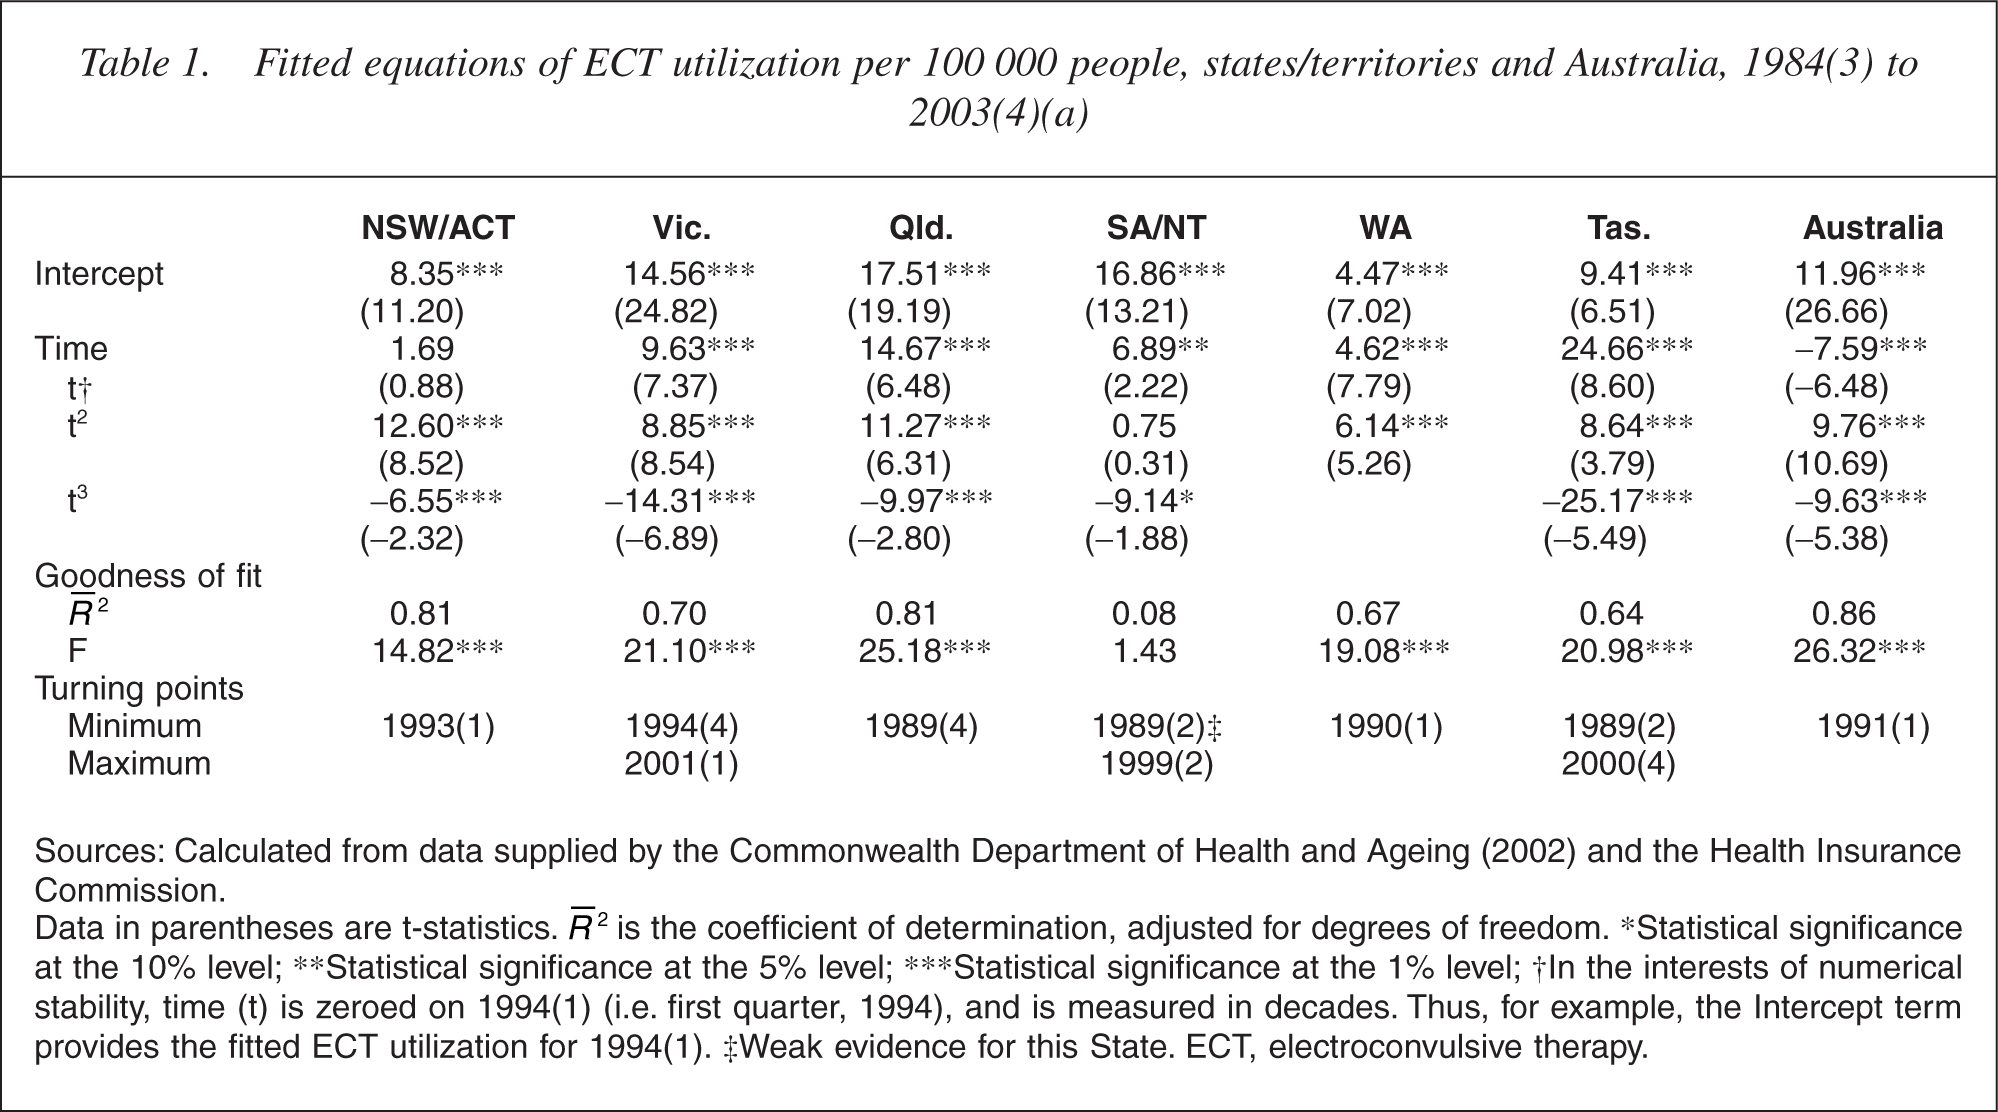
Sources: Calculated from data supplied by the Commonwealth Department of Health and Ageing (2002) and the Health Insurance Commission.
Data in parentheses are t-statistics. R 2 is the coefficient of determination, adjusted for degrees of freedom. ∗Statistical significance at the 10% level; ∗∗Statistical significance at the 5% level; ∗∗∗Statistical significance at the 1% level; † In the interests of numerical stability, time (t) is zeroed on 1994(1) (i.e. first quarter, 1994), and is measured in decades. Thus, for example, the Intercept term provides the fitted ECT utilization for 1994(1). ‡Weak evidence for this State. ECT, electroconvulsive therapy.
Attention should be focused on the quadratic term (t2) in Table 1, in terms of analysing the ‘apparent’ U-shape. In six of the seven equations, this coefficient is statistically significant at the 1% level. This indicates that the U-shape is confirmed statistically, except for SA/NT. In some states (e.g. Victoria and Tasmania), there has been a second turning point, that is, a maximum, in more recent years (2000 and 2001). In the present context, it is useful to note that the minimum utilization levels have occurred in the late 1980s and early 1990s, the turning point for Australia as a whole being 1991(1). These turning points are indicated on the seven diagrams of Fig. 2.
Discussion
Electroconvulsive therapy has a small but important role in psychiatric treatment. It remains a relatively safe [22] effective treatment for severe depression, probably more effective than pharmacotherapy [23] and is particularly valuable when a rapid response is required or other therapy has failed [24, 25]. However, despite being declared one of the most efficacious treatments in medicine, it has remained controversial [26] and this controversy has created resistance to its use, especially among some patients.
Our study shows that the use of ECT in the private psychiatric sector in Australia has been subject to considerable variation since 1983. Utilization fell from 1984 to 1991 (and may have been falling long before that) but since then has been rising. The rise has continued even with other MBS-funded service utilization falling. Around the time ECT utilization rates started to rise, there were a number of innovations in the treatment, for example, EEG monitoring and the more widespread use of high-dose right unilateral treatment (which tends to be associated with fewer cognitive side-effects). In addition, training programs were made more widespread for medical and nursing staff, for example, [27] and this may have led to a greater recognition of its utility and a greater acceptance of its role in treatment.
Data at the level of the states indicate that the U-shape pattern exists in five states, whereas SA/NT has a linear utilization rate. No conclusions could be drawn from the data as to why the SA/NT utilization should be different, nor why the ECT utilization rate in WA is low compared with the other states. Further, disaggregation at the level of the state indicates nothing about the geographical variations that might exist between metropolitan cities, major regional cities and rural and remote regions: such regional differences may well be more important than the interstate differences analysed here. Finally, we do not know if the utilization patterns in the public sector parallel those in the private sector. Nevertheless, we do know that ECT is constantly being refined as a treatment and its use is on the rise again in Australia.
Footnotes
Acknowledgements
The authors would like to acknowledge the general assistance of the Australian Department of Health and Ageing, and in particular the provision of the data on which this study is based. In addition, we acknowledge the very useful suggestions made by the two anonymous reviewers. The usual caveat applies.