
Abstract
The relationship between mental health and rurality of residence is yet to be systematically investigated. A number of disparate reports have described urban–rural differences in either prevalence rates or levels of psychological distress [1], but the significance of these studies is compromised by ad hoc definitions of rurality. Previous epidemiological studies have defined rural on the basis of interviewers’ judgements of the area around respondents’ homes [2], population density within an arbitrary administrative unit [3], or population size of a named centre [4]. Rurality, if it means anything as an exogenous impact on mental health, is likely to be multifaceted [5] and careful measurement is needed to maximize the likelihood of differences being revealed. As part of a research program designed to improve service delivery in rural and remote Australia [6], we conducted a survey study in non-metropolitan locales to investigate the mental health impact of one potential parameter of rurality – accessibility.
The definition of ‘rural’ has proved an elusive goal [7], but in response to health planning needs a number of frameworks have been developed [8–10]. Driven by federal government concern over access to services in rural and remote areas, the bipolar dimension of accessibility/ remoteness has received substantial attention in Australia. The Accessibility/Remoteness Index of Australia (ARIA) [11] is a measure of the accessibility of services and social opportunities, based on road distances to centres of various sizes (see Method). ARIA was developed as a strictly geographical index, on the grounds that it would facilitate clarifying interactions between locational and social barriers to interaction. The index has been used as a predictor variable in a number of studies and has been described as a useful tool for health service planning and epidemiological research [12], [13]. While accessibility/remoteness clearly does not capture the range of potentially important aspects of rurality (e.g. population size and growth, community relationships, economic and aesthetic variables) [7], it is a face-valid parameter of rurality that is believed to have meaning in the health context [11]. The ARIA index constitutes a transparent, objective, independently derived and validated parameter of rurality and was selected as the predictor variable in the present study.
Outcome measures were selected to be sensitive to variations in mental health, broadly defined. Mental health can be understood as having two correlated but distinct components, psychological distress and subjective wellbeing [14]. Psychological distress is a common focus in psychiatric epidemiology, both because it is the most parsimonious explanation of neurotic phenomena [15] and because the continuum of severity is a critical factor in service planning [16]. Two common psychological distress scales were used here, as well as a measure of physical and mental disability associated with distress. Subjective wellbeing can be understood as divisible into cognitive/judgemental and hedonic components [17], which were measured separately. Psychotic phenomena are rare in Australia [18] and were not assessed.
Of particular interest was whether any independent effects of ARIA remained after individual-level predictor variables were included in analyses. Demographic variables such as employment and marital status have consistently been shown to affect risk of distress disorders [19] and previous investigators have typically controlled for these compositional features of locales [20]. Personality is also a reliable predictor of common mental disorders [21] and subjective wellbeing [22] but has not been measured in any investigations to date. Beyond ARIA, the predictor set here included demographic variables and a measure of the five-factor model of personality (FFM) [23]. Analyses explored ARIA both as a sole correlate, and in conjunction with demographics and personality variables.
Method
Sampling region and sampling frame
The sampling region covered approximately 540 000 square kilometres, from southern Victoria to northern NSW (total population = 400 000 approx.) The majority of the population in the region is Australian-born with significant indigenous communities in central and northern NSW and northern Victoria. ARIA values in the sampling region range from ‘highly accessible’ (0.00–1.84) to ‘very remote’ (3.52–12.00). The electoral roll was chosen as the sampling frame because it provides a complete list of adults living in the region. To ensure adequate representation of remote areas, the sample was stratified by ARIA with an oversampling of rolls with higher ARIA values; 20 000 names were then selected from these rolls.
Measures
Accessibility/remoteness
ARIA was developed to measure and classify the accessibility of populated localities in Australia, as measured in the road distance to service centres of various sizes [11]. It was assumed, and subsequent analyses confirmed, that an association would exist between the size of service centres and the availability of services (particularly government-provided services such as health and education).
Distress and disability
Results from two measures of distress are reported here. The 10-item Negative Affect (NA) scale from the Positive and Negative Affect Scales (PANAS) [24], is the most commonly used measure of NA in the general population, with a range of validating data [25]. The K10 scale of non-specific psychological distress [16] contains 10 items about anxiety and depressive symptoms. Internal reliability for the K10 has been reported as 0.93 [26]. Disability was measured on the 12-item Short Form Health Survey (SF-12) [27], a scale with good psychometric properties [28]. The SF-12 generates two subscale scores (physical component summary [PCS] and mental component summary [MCS]), which measure role limitations due to physical and emotional factors, respectively.
Subjective wellbeing
Diener's five-item Satisfaction With Life scale (SWL) [29] was used to measure the cognitive component of subjective wellbeing. A range of validating data exists for the SWL [30], and internal consistency has been reported as 0.87 [29]. The hedonic component of wellbeing was measured on the 10-item Positive Affect (PA) scale of the PANAS.
Demographic and personality variables
Seven demographic variables were used in analyses: age; gender; highest level of education; employment; country of birth; indigenous heritage; and household composition. The traits of the FFM were measured here on 50 items from the International Personality Item Pool (IPIP) [31]. Scales based on the IPIP items have demonstrated adequate internal reliability (range: 0.75–0.85) [32].
Procedure
The Bendigo Health Care Group Human Research Ethics Committee approved the design of the study. Return of the completed questionnaire was taken as informed consent to participate. Letters were personally addressed and mailed to potential respondents with a covering letter, the survey, a reply paid envelope and an instant lottery ticket [33]. If a survey had not been received from a potential participant after two weeks, a second letter was mailed.
Analyses
Non-normality was expected on the majority of scales, so analyses were conducted using dichotomised dependent variables. Categorization was based on discontinuities in the distributions as assessed by inspection of histograms. Analyses involved three sets of logistic regressions. The six binary dependent variables (dichotomised scores on K10, NA, PCS, MCS, SWL and PA) were investigated separately in each set. The first set of analyses used ARIA as the sole predictor, demographic variables were added to the predicting group in the second set of analyses and the third set involved personality variables as well as demographic variables and ARIA. Higher scores on ARIA indicate more remote locations, and positive scores on the dichotomous dependent variables represent poor outcomes, so odds ratios <1 would indicate a positive association between accessibility and better outcomes.
Results
Response rate
Of the 20 000 individuals initially contacted, 3106 were identified as ineligible (2823 incorrect addresses, 155 deceased, 128 incapable of participating) Of these, 1922 could be replaced in the sampling frame during the surveying period, leaving 1184 individuals from the original frame who were ineligible and not replaced. The response rate was therefore 40.5% (n = 7615).
Demographics and representativeness
Representativeness of the sample was assessed by comparison with the 2001 Commonwealth Census data for the sampling frame. Mean age of the sample was 52.2 years (SD = 16.3), compared with 47.3 years (SD = 19.6) in the complete census data. In the census, 50.3% of adults were female, and 87.5% were born in Australia while 57.1% of our respondents were female and 95.3% were born in Australia. ARIA values in the sample ranged from 0.00 to 11.11 (mean = 2.75, SD = 1.88). The distribution of ARIA was markedly bimodal, with peaks around 2.5 and 0.5.
Scale exploration
Missing data was insubstantial across the questionnaire, with the exception of the first three scales (SWL, PA and NA), on which 5.2%, 9.0% and 7.3% of respondents had more than one missing item (Table 1). Inspection of individual data showed that the non-response was due to a proportion of respondents selecting items to represent their response rather than selecting ratings on each item. List-wise valid cases for the 11 scales in Table 1 were 6509 (85.5%), with valid response strongly associated with younger age (OR = 0.95, CI = 0.946–0.954).
Distributions and internal reliability alphas for scores on the six dependent variable and five personality scales. Also shown are frequencies in the binary versions of the scales and the cut-points that generated the dichotomy
As shown in Table 1, internal reliabilities of the scales were all adequate at alpha < 0.70. Distributions were comparable with relevant existing data for each scale. Data in Table 1 show that the dichotomization process produced approximately equal proportions on all variables. As a point of comparison, previous surveys using the K10 have interpreted a score of 20 as indicative of moderate distress, and the likely presence of a mild mental disorder [34].
ARIA as a correlate of mental health
As shown in Fig. 1, panel 1, the data show an inconsistent effect of unadjusted ARIA across the dependent variable set. A trend appears in only some variables for accessibility to be associated with better outcomes. This trend is significant at p < 0.05 for SWL (OR = 1.04, CI = 1.01–1.08), and approaches significance for PA and PCS. The data in panel 2 shows that adding the eight demographic variables to the predicting set has little effect on the influence of ARIA: accessibility remains significantly associated with increased likelihood of favourable SWL (OR = 1.05, CI = 1.01–1.08), and the same trend is discernible in PA and PCS. The addition of the five personality predictors to the model (panel 3) makes the trend even less clear, but the association between accessibility and favourable SWL remains (OR = 1.05, CI = 1.01–1.09).
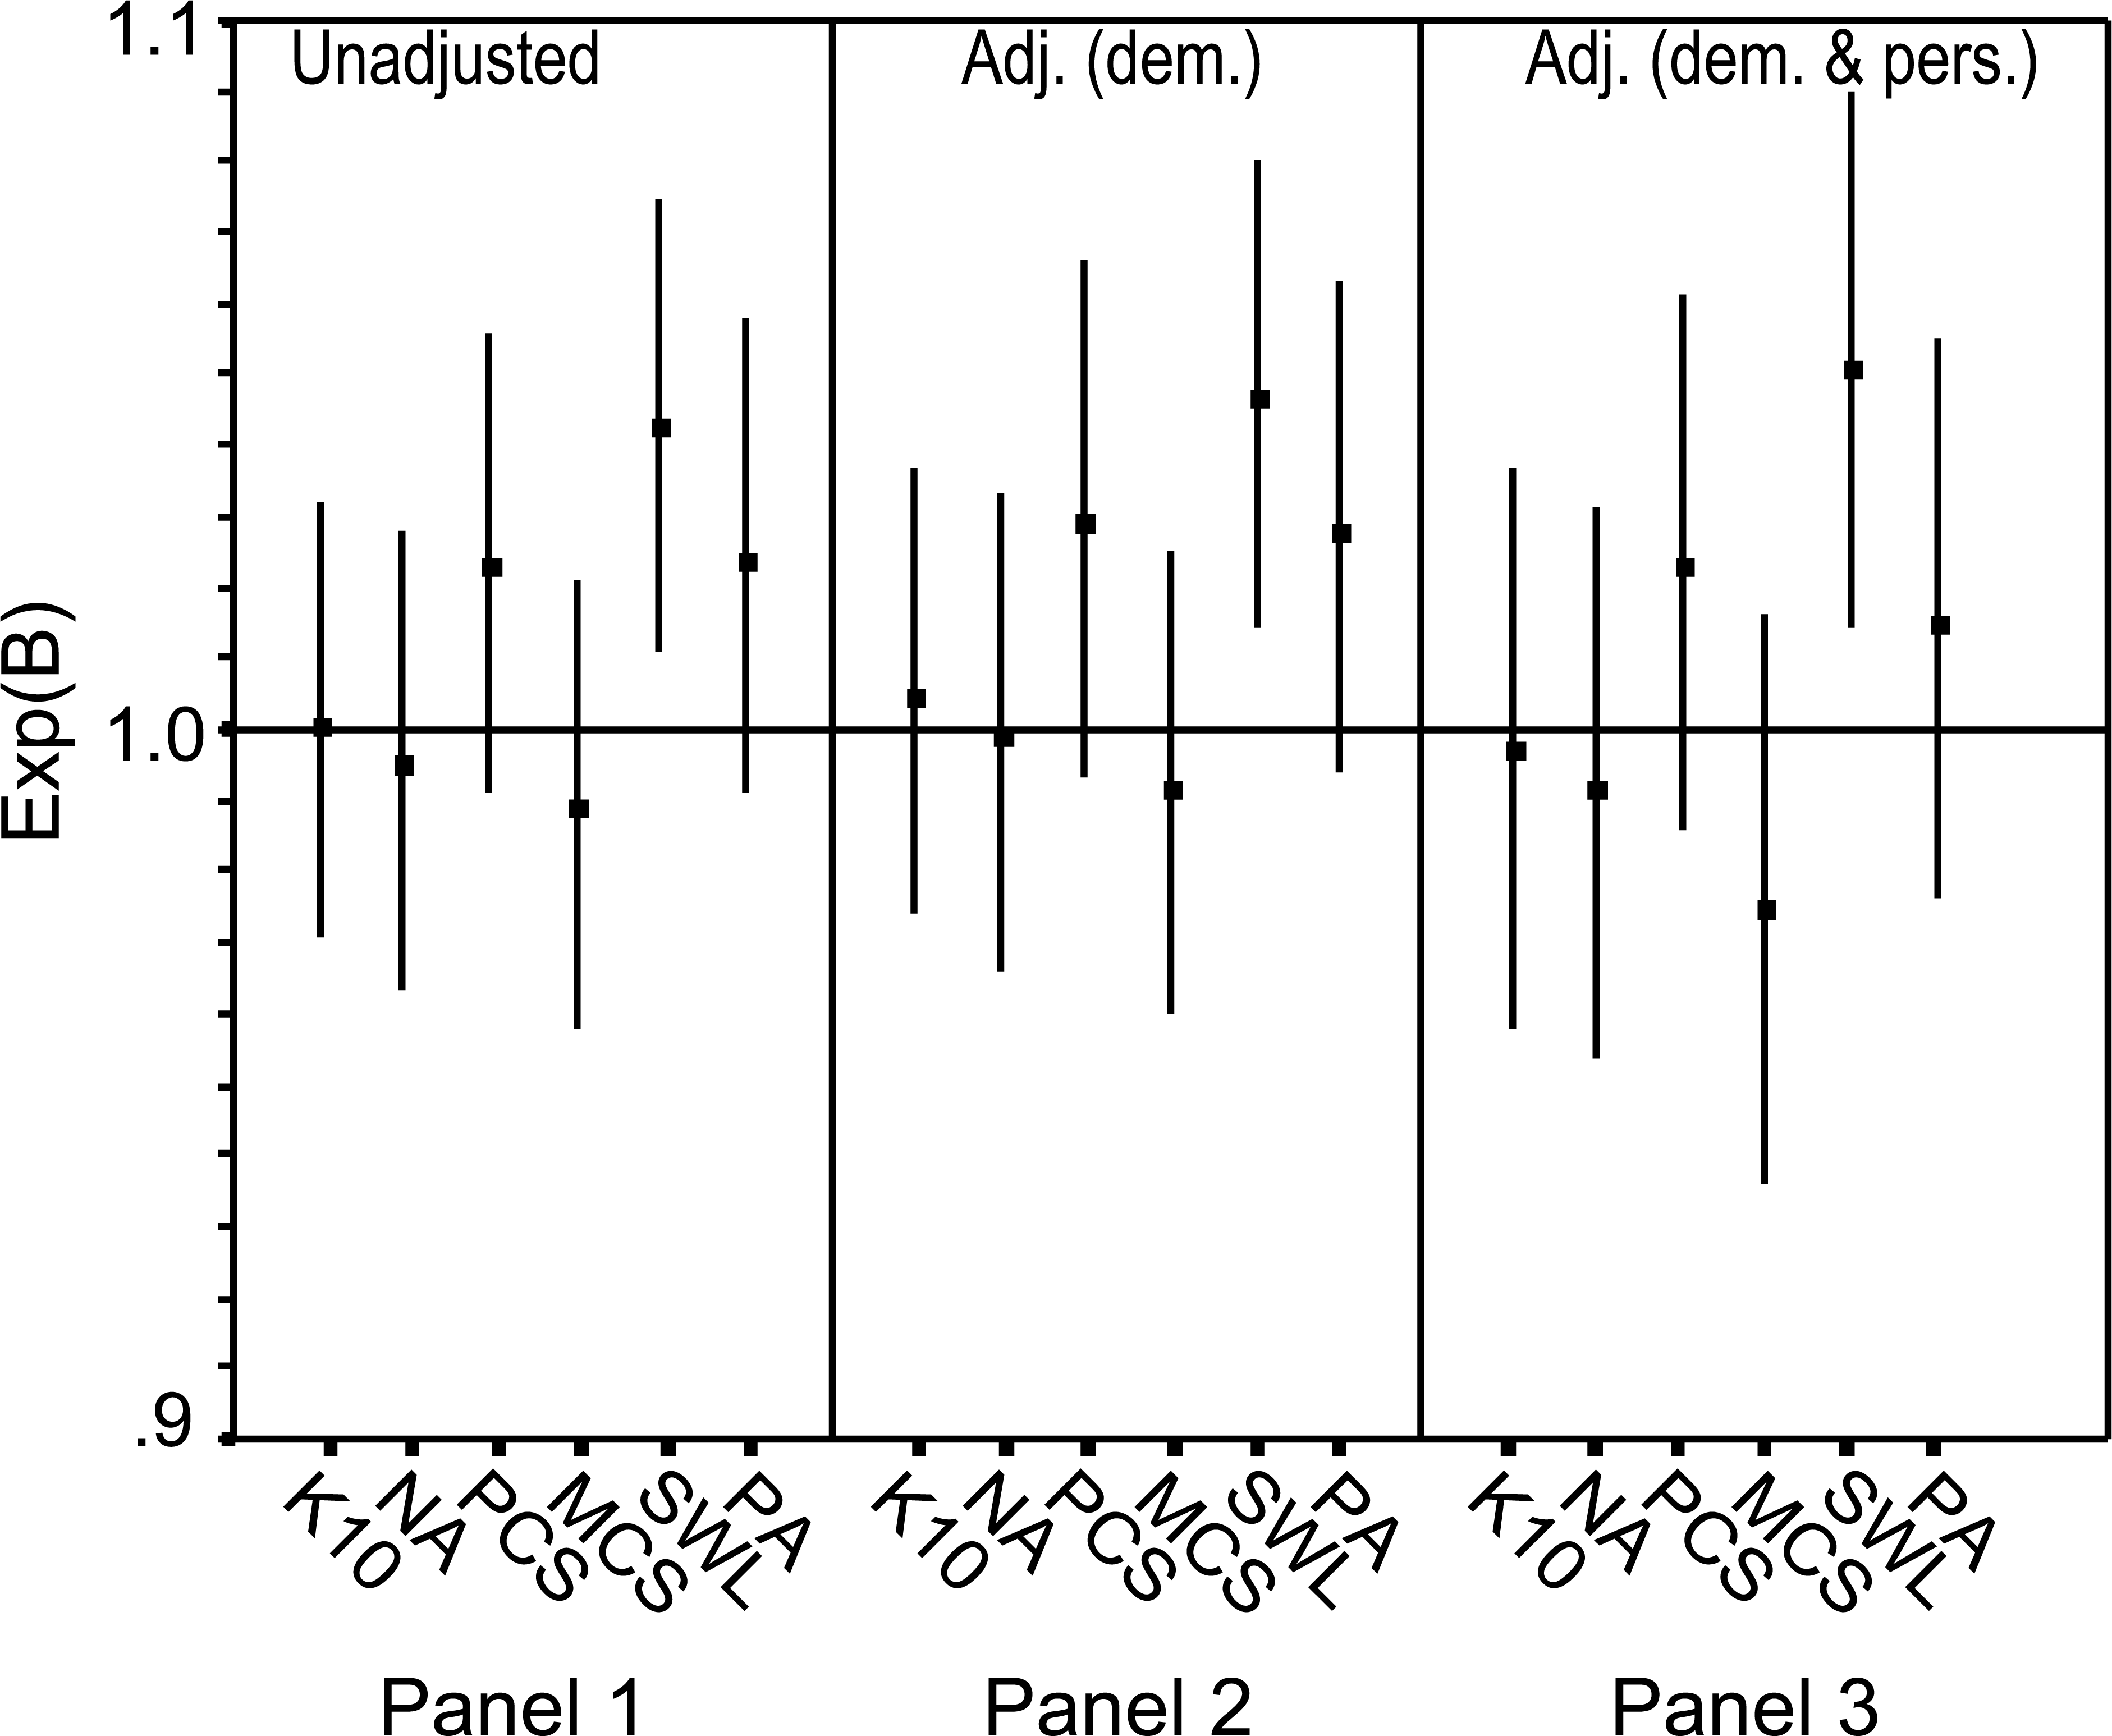
Odds ratios and 95% CIs for logistic regression analyses with ARIA as a sole predictor (panel 1), adjusted for demographic variables (panel 2) and adjusted for demographic and personality variables (panel 3). Odds ratios >1 indicate a positive association between accessibility and better outcome.
As shown in Fig. 1, PA showed a non-significant trend paralleling the other wellbeing variable: SWL. Unlike the other outcome measures, the distribution of PA scores was approximately normal (skew = −0.26; kurtosis = −0.34), permitting its use in more powerful analyses as a continuous outcome measure. Positive affect score was therefore investigated again in a series of linear regressions corresponding to the logistic regressions represented in Fig. 1 (polychotomous predictors dummy-coded). When used as a sole correlate, ARIA showed a small significant negative relationship with PA score (β = −0.03, t = −2.15, p < 0.05). The relationship remained significant when demographics were entered along with ARIA (β = −0.03, t = −2.47, p < 0.05), but not when both demographics and personality were controlled for (β = −0.01, t = −1.29, NS).
Discussion
The mailout survey of non-metropolitan regions of Australia achieved an adequate response rate (cf. e.g. 34.6% in a recent national government survey) [35]. As expected with this methodology [36] the mean age of the sample was somewhat higher and the proportion of women was somewhat elevated compared to complete census data.
The study had two major findings. No significant association was found between accessibility and either psychological distress (as measured on K10 and NA) or disability (PCS and MCS). In contrast, locations with greater access to services and social interaction were found to be associated with higher levels of subjective wellbeing (as measured on SWL and, with one qualification, PA). While the former finding is broadly consistent with existing literature, the second is novel and demands further exploration.
The absence of a consistent accessibility effect on distress and disability is the strongest evidence to date that rurality of residence is unrelated to this component of mental health. Using a post hoc population-based categorization, a similar conclusion has been drawn previously in Australia [37] and Canada [38]. In both Canada and Australia, it had previously been reasoned that scarcity of mental health services, increased physical morbidity and cultural changes in the importance of agriculture would tend to increase mental health problems in rural and remote areas [38], [39]. Data is accumulating against this view. It is not clear whether less accessible locales somehow moderate the assumed risk factors, whether these factors impact more strongly on subsets of the population or particular phases of disorder within individuals, or indeed whether these factors are less relevant to mental health status than is commonly thought.
The data indicates a small significant association between accessibility and subjective wellbeing, as measured on SWL and to a lesser extent PA. Adjusting for individual level, correlates affected the two measures differently. The association between ARIA and SWL was robust to the impact of both demographic and personality covariates, suggesting that the effect is unrelated to compositional differences across ARIA. In contrast, the effect of ARIA on PA fell below significance when personality traits were statistically adjusted for. Given the interrelationship between its two components [14], the most valid conclusion is that subjective wellbeing is associated with accessibility to services and opportunities for interaction, and the effect may be partly due to personality characteristics.
If verified, our findings have implications for mental health services. Wellbeing can be understood as a resilience dimension, expected to impact on responses to life challenges [41], as well as broader health-related behaviour [42], [43]. The disadvantage of more remote locales appears not to be in the domain of distress, but that of resilience. Substantial resources are devoted to attracting and retaining mental health workers in rural and regional areas [44]; perhaps credentials in wellbeing enhancement should be weighted more highly than clinical expertise in selecting professionals.
Future research can explore possible causes of the apparent association between accessibility and wellbeing. Social activity is a reliable state determinant of wellbeing [45] and one testable hypothesis is that increased quantity and quality of social interaction mediates the relationship between accessibility and wellbeing. Accessibility may also have an indirect effect on wellbeing via neighbourhood characteristics. For example, a specific population shift of the affluent ‘creative class’ away from metropolitan centres has advantaged attractive coastal and peri-metropolitan communities but not more remote regions [46], [47]. Studies can test whether the vibrancy of more accessible neighbourhoods impacts on wellbeing of residents.
Epidemiological research is complemented by individual-level investigation of mechanisms by which location of residence might affect mental health [6]. With improved understanding of how mental health relates to a highly individualized and contextualized notion of rural place [48], we may be able to theorize effects based on geographical units or dimensions. As an example of this, we are conducting second stage interviews in the sample, using social network models [49] to test hypotheses about individual and community-level moderators of wellbeing.
Although the range of accessibility investigated was adequate for statistical purposes, generalization to extremely remote areas of Australia must be tentative. Potential participants were randomly selected from the electoral roll in each region but the design does not ensure that respondents were representative of the population along the dimension of ARIA. Accessibility was measured only on ARIA, other variables may be more sensitive indicators of accessibility as an impact on mental health. For example, ready access to cars may reduce the significance of the ARIA road distance metric.
Measurement of ecological and other macro-level units remains problematic [50]. This may explain why research based on inconsistent taxonomies of rurality has failed to generate mental health correlates [1], [2]. By selecting one promising parameter, a null association between rurality and distress was confirmed and a link between residence and wellbeing was discovered. Future research will identify other parameters and aggregations of rurality worthy of investigation [5], [51], but conclusions enable testing of specific hypotheses about person– environment interactions.
Footnotes
Acknowledgements
We acknowledge beyondblue: The National Depression Initiative for financial support and Gavin Andrews for comments on an earlier draft.