
Abstract
Doctors are unhappy. They are not all unhappy all the time, but when doctors gather, their conversation turns to misery and talk of early retirement [1].
Although mental health services in Australia have been in an almost constant state of change for more than two decades, there are no recent systematic data about Australian psychiatrists' work satisfaction. Should we be concerned whether psychiatrists are happy or unhappy with their lot? The answer is affirmative for a variety of reasons. Studies suggest that satisfied medical practitioners are more effective, have more satisfied patients, change jobs less often and retire later than dissatisfied practitioners [2]. High work-related stress and dissatisfaction are also associated with poorer health among physicians [2], [3]. Further, the Australian Medical Workforce Advisory Committee [4] has noted a dearth of psychiatrists in Australia, which impairs the delivery of services. In this context, dissatisfaction may not only encourage dropping out but also discourage future generations from entering the profession, resulting in more shortages.
Alongside changes in mental health services, the public image of psychiatry in Australia has suffered in recent years due to a variety of negative issues widely reported in the media. Have these events and the related publicity impacted on the image that psychiatrists have of themselves and their professional pride?
This report describes psychiatrists' current perceptions about their profession, stress and satisfaction. Although these data are cross-sectional, they provide a good starting point that can be used for comparison in future surveys. With the Second National Mental Health Plan having ended in 2003 and a third plan starting in 2004, this is an opportune time to examine these matters.
Method
A survey was mailed in December 2002 to all Fellows of the Royal Australian and New Zealand College of Psychiatrists (RANZCP) living in Australia (n = 2059). The survey was anonymous and independent of the RANZCP, government bodies and industry groups. Apart from general demographic (e.g. gender, age) and practice (e.g. state, subspecialty) data, the questionnaire sought the views of psychiatrists about their professional satisfaction, stress and other matters. A copy of the questionnaire is available from the authors on request.
By the end of February 2003, 1039 Fellows had returned the questionnaire. Of these, seven were blank (four disapproved of the survey and three had retired) and were not included in analysis. The distribution of respondents according to state/territory and gender is presented in Table 1. There were no statistically significant differences between respondents and RANZCP members according to state/territory and gender.
Number of questionnaire respondents per state or territory according to gender
Overall, there were few missing data. However, there were questions in the survey for all psychiatrists and questions exclusively for psychiatrists who had private or public practice. As a result, numbers reported may vary depending on the aspect examined. Percentages are rounded to the nearest unit.
With the exception of descriptive data, only results of bivariate statistical analysis that were at or near p = 0.01 are reported. Alpha was set at 0.05 for multivariate analysis. Multivariate analyses (logistic regression) were performed when testing whether there were differences according to gender, age group, state or territory, or subspecialty (all these were simultaneously entered as predictor variables). Only states or territories or subspecialties with more than 70 respondents were considered in analyses in order to minimize false positive findings; as a result, no separate analyses were performed for the ACT, Northern Territory, Tasmania, consultation-liaison, forensic, old age and ‘other’ psychiatrists. Size of differences reported represent the adjusted odds ratios obtained following these analyses, that is after controlling for the effect of these confounders. χ2 results are those obtained for the predictor variables found to be significantly associated with the dichotomised dependent variable in logistic regression analyses (and these are reported if p = 0.05).
Results
More than half the respondents described themselves as general psychiatrists (n = 575/1019, 56%). Psychotherapists and child and adolescent psychiatrists were the next most common specialties with 12% of respondents each (n = 119 and n = 117, respectively). There were no statistically significant gender differences among the specialties.
Approximately 19% (n = 190/1019) of respondents worked exclusively in the public system, while twice as many (n = 371, 36%) worked exclusively in private practice. About two-fifths (n = 418, 41%) worked in both. A small number were academics (n = 27, 3%) or administrators (n = 13, 1%) and some of these did clinical work in the public or private systems or both.
Pride about being a psychiatrist
The large majority of respondents (n = 800/1018, 79%) were proud of their profession while a very small minority (n = 37, 4%) was not proud. A small proportion (n = 181, 18%) was neither proud nor not proud. The rates of being proud about the profession were similar between males and females, those working in the public and private systems, and among the states and subspecialties.
Work satisfaction
The large majority (n = 822/1021, 80%) of respondents believed that the practice of psychiatry had met (62%) or exceeded (18%) their expectations. There were no differences between men and women or according to age, state or subspecialty. Consistent with this, most psychiatrists (n = 830/1024, 88%) reported being satisfied with their work, while 12% (n = 119) were dissatisfied.
In multivariate analysis, female psychiatrists were 1.7 times as likely as male (17% vs 10%) to be dissatisfied or very dissatisfied. Psychiatrists older than 60 years were half as likely to be dissatisfied as younger ones. However, dissatisfaction was similar between those working in the public and private systems, and among the states and subspecialties.
The reasons for dissatisfaction nominated by respondents according to type of practice are presented in Table 2. There was a consistent dose-response association in all the reasons for dissatisfaction: psychiatrists who only have private practice at one end, those with only public practice at the other, and psychiatrists with both public and private practice in-between.
Most dissatisfying aspects of psychiatric work according to practice type
Private psychiatrists nominated litigation/indemnity issues as the most frequent reason for dissatisfaction (69%), while the most common reason for dissatisfaction for public psychiatrists was lack of beds (47%). Private psychiatrists were more likely to be dissatisfied by issues related to litigation/indemnity, income, patients' demands, isolation and CME. Lack of beds, resources (e.g. offices, computers) and lack of support from administration were important causes of dissatisfaction for public psychiatrists but much less so for private psychiatrists. Administrative demands were a common cause of dissatisfaction for all psychiatrists (although this may have different meanings in the public and private systems).
The reasons nominated for satisfaction followed the same doseresponse pattern as for dissatisfaction. Overall, helping patients get better, face-to-face clinical work, the intellectual component and challenge, meeting colleagues, teaching and supervision were the reasons for work satisfaction most often quoted, with helping patients get better (72%) and face-to-face clinical work (54%) being the most common.
Contrary to what occurred with the reasons for dissatisfaction, the ranking of the various reasons for satisfaction was similar for all psychiatrists, but there were significant differences between private and public psychiatrists in their frequency. Private psychiatrists were more likely to be satisfied by issues related to helping patients get better, face-to-face clinical work, the intellectual component and challenge, the holistic approach, and advancing knowledge. Public psychiatrists were more likely to be satisfied by issues related to teaching, supervision, being part of a team, research and managing the service.
Work-related stress
The majority of psychiatrists (n = 636/1024, 62%) found their work in the previous 12 months to be quite, very or extremely stressful. Female psychiatrists were more likely to report being stressed than male (70% vs 59%, χ2 = 10.05, df = 1, p = 0.01). Psychiatrists older than 60 years reported being less stressed (35%) than those aged less than 40 (66%) and those aged 41-60 years (69%) (χ2 = 72.77, df = 2, p = 0.001). However, there were no differences in the reports of stress according to private versus public practice, specialty and state, although there was a trend for NSW psychiatrists to be more stressed (66% vs 60%). There was a strong association between stress and dissatisfaction: psychiatrists who reported being dissatisfied were 11 times as likely to report being stressed as well.
Threats of legal action
Overall, one-third (n = 351/1024, 34%) of psychiatrists had been threatened with legal action at least once in the previous year (9% were threatened 2–3 times and 4% more than three times). Male psychiatrists were 1.4 times as likely to be threatened with legal action as females, while those in public practice were 1.7 times as likely to be threatened with legal action as those in private practice. The rates of threat of legal action for male and female psychiatrists were similar in public practice but male psychiatrists in private practice were more likely to have been threatened than female (34% vs 24%, χ2 = 10.88, df = 3, p = 0.01). There were no differences between the states but psychotherapists were 1.8 times less likely to be threatened with legal action than other psychiatrists.
Formal complaints
Overall, 39% (n = 401/1028) of psychiatrists reported having to answer at least one formal complaint by a patient or relative in the previous year (12% had to answer 2-3 and 5% more than three complaints). Male psychiatrists were 1.7 times as likely to have a formal complaint as female, while those in public practice were 2.3 times as likely as those in private practice. There were no differences between the states but psychotherapists were 2.1 times less likely to have to answer formal complaints as other psychiatrists.
Verbal and physical abuse
Two-thirds of psychiatrists (n = 686/1028, 67%) reported having been verbally or physically abused by a patient or relative at least once in the previous year (25% had been verbally or physically abused 2-3 times and 24% more than three times). There were no gender differences but older psychiatrists were less likely to report having been abused than younger ones (78% of those aged 40 or less, 68% of those aged 41-60 and 50% of those aged more than 60 years χ2 = 35.43, df = 2, p = 0.001). Public psychiatrists were 1.9 times as likely to be abused as those in private practice. There were no differences between the states but general psychiatrists were 1.5 times as likely to be abused as other psychiatrists.
Suicide of patients
Almost one-third of psychiatrists (n = 293/1029, 29%) reported that at least one patient under their care had completed suicide in the previous 12 months (7% had 2-3 and 1% more than three patients). Male psychiatrists were 1.6 times as likely to report having at least one patient dying of suicide as female. Public psychiatrists were 1.6 times as likely to have patients who had completed suicide as those in private practice. There were no differences between the states. While child and adolescent psychiatrists were half as likely to have patients who had killed themselves, general psychiatrists were 2.2 times as likely.
The large majority of participants (74%) believed that aggression, complaints and legal threats are as common in Australia as in other developed countries. Respondents were more likely to believe that these problems apply to psychiatrists more often than to other medical practitioners (41%) rather than the reverse (4%) 43% considered these problems apply to all medical practitioners.
The profession in 10 years
The rates for the various aspects measured are presented in Fig. 1. Overall, psychiatrists were more pessimistic about the future than optimistic, particularly in relation to income: 439 psychiatrists (43%) were pessimistic compared with 142 (14%) who were optimistic. The only aspect in which optimists outnumbered pessimists was quality of care, but not by much (426, 42%, were optimistic while 363, 35% were pessimistic).
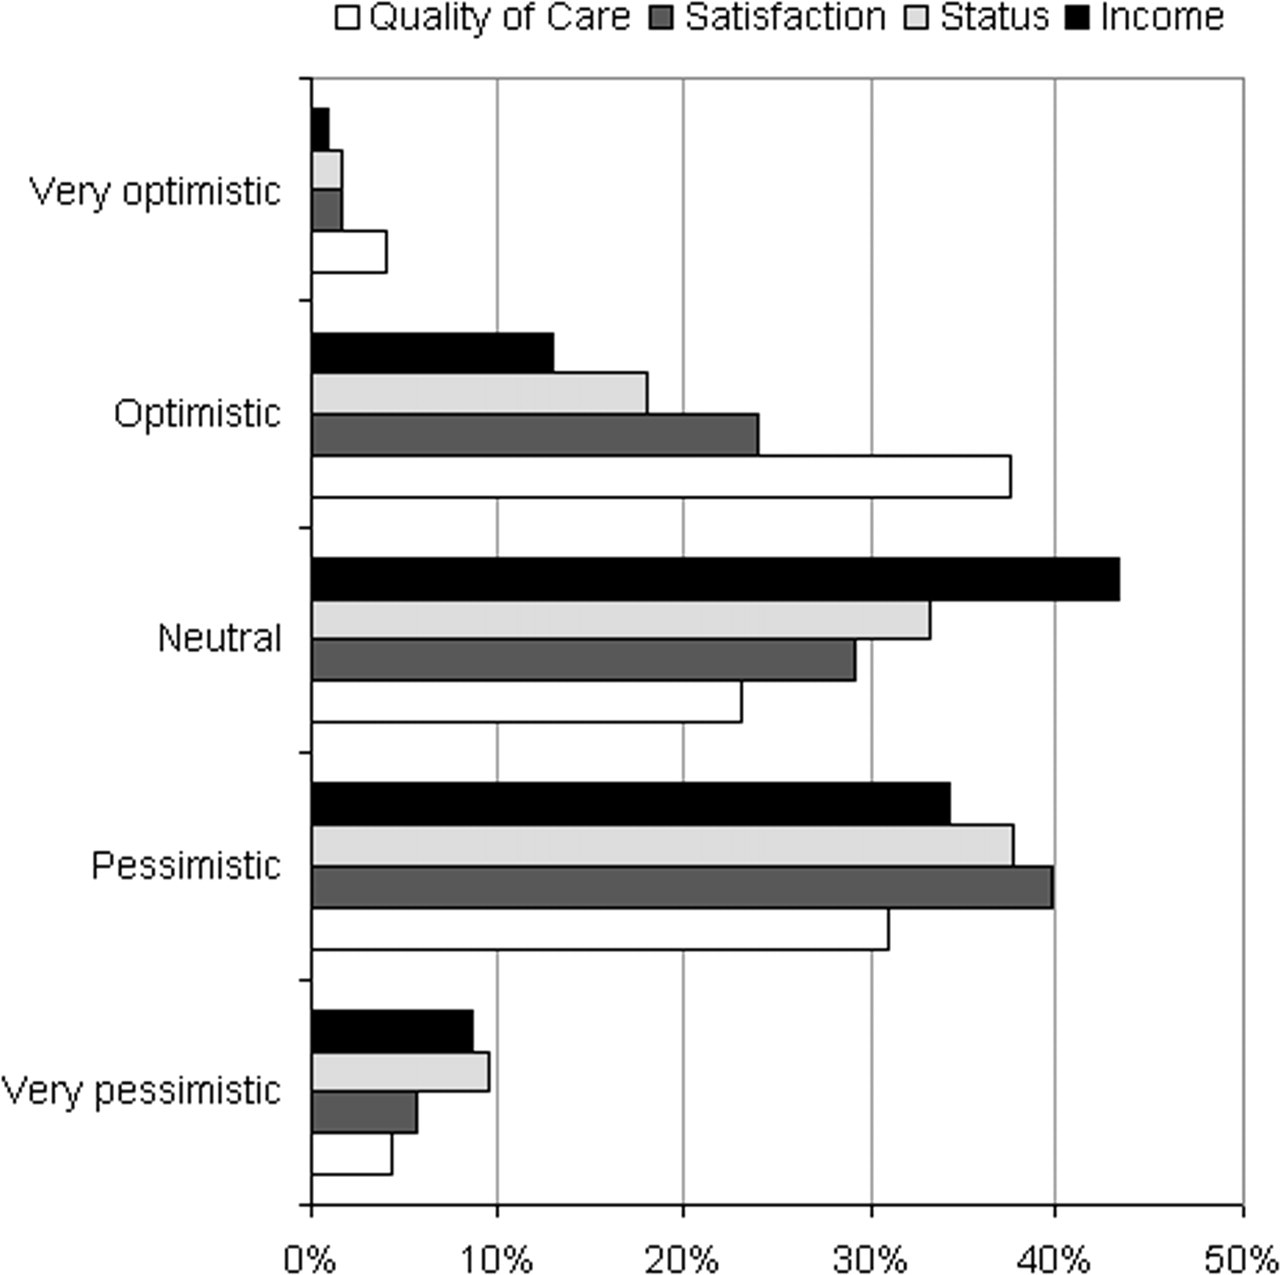
Psychiatrists' optimism about the future.
For multivariate analysis (logistic regression), perceptions about the future were dichotomised into those who were optimistic or very optimistic and those who were not. The dichotomised view was the dependent variable, while gender, age group, state, subspecialty and whether they were proud or stressed were the predictor variables. In relation to quality of care, child and adolescent psychiatrists (adjusted OR = 1.8) and general psychiatrists (adjusted OR = 1.5) were more likely to be optimistic. Otherwise, there was no association with age, gender or state. In relation to income, Western Australian psychiatrists were more likely to be optimistic than the rest (adjusted OR = 3.4) while general psychiatrists were less likely (adjusted OR = 0.5). There was no association with age or gender. In relation to satisfaction, general psychiatrists (adjusted OR = 0.7) and psychotherapists (adjusted OR = 0.5) were less likely to be optimistic. There was no association with age, gender or state. In relation to status, the only difference observed was for psychotherapists who were less likely to be optimistic than the rest (adjusted OR = 0.5). There was no association with age, gender or state.
‘Would you become a psychiatrist again?’
Respondents were asked whether they would choose to become psychiatrists again if they could go back in time. The large majority (n = 703/1027, 69%) responded in the affirmative while a small but substantial group (n = 150, 15%) responded negatively; the rest were unsure. In the hand-written comments, many of those who said ‘no’ stated that their objection was more with becoming a medical practitioner than a psychiatrist.
There were no differences according to age, gender, state and subspecialty in the decision to do psychiatry again. However, child psychiatrists were more likely to state they would like to do psychiatry again (92% vs 85% for the rest, χ2 = 4.77, df = 1, p = 0.03). Not wishing to do psychiatry again was not associated with having been abused by patients, complaints, threats of legal action or patients' suicide but it was independently associated with not being proud (adjusted OR = 3.5), being dissatisfied (adjusted OR = 2.6), and feeling stressed (adjusted OR = 1.8).
Discussion
In spite of all the problems and changes experienced by psychiatrists in Australia in the last 20 years, most are proud of their profession and satisfied with their work. This appears to be in disagreement with the prevailing view that medical practitioners are unhappy [1], [2]. The cross-sectional nature of the study prevents conclusions about changes in satisfaction over time. The study design also limits conclusions about causation and can only identify associations.
Are these opinions representative of all Australian psychiatrists? We believe so, because: (i) the sample is large (1039, half of the 2059 members of the RANZCP younger than 75 years living in Australia) (ii) 96% of practising psychiatrists are members of RANZCP [4], p.9] and (iii) there are no statistical differences between respondents and RANZCP membership according to state/territory and gender. A response rate of 50% is acceptable given that the survey was anonymous and that no reminder letters were sent to non-responders. Consultation with colleagues before the survey was conducted suggested that anonymity was important to allay psychiatrists' concerns about privacy and confidentiality. By comparison, a recent telephone survey in the US with similar content achieved a 59% response rate [5].
Although health systems differ widely from country to country, the results are consistent with those reported for medical specialists elsewhere. For example, 81% of 4723 medical specialists (about 10% were psychiatrists) were satisfied while 18% were dissatisfied in 2001 in the US [5]. The rates in this survey are broadly similar (88% and 12%). A survey of psychiatrists conducted in 1997 in the US reported that 21% of psychiatrists were dissatisfied [6]. The US studies showed that levels of satisfaction were not different between psychiatrists and other specialists [6] and that satisfaction had decreased only slightly between 1997 and 2001 [5].
The causes of doctors' dissatisfaction have been identified in the literature as doctors feeling overworked and under-supported, increased patients' expectations (fuelled by politicians' promises), longer waiting lists and lack of hospital beds [1]. Other research suggests that decreasing clinical autonomy and inability to obtain services for patients are important [5]. Studies focusing on psychiatrists have also highlighted the role of organizational, administrative and personality factors in determining psychiatrist dissatisfaction [3], [7], [8]. Australian psychiatrists, like physicians elsewhere, want the best for their patients. Helping patients is their main source of satisfaction while not being able to provide the best care is one of the main causes for dissatisfaction [1], [5]. The surprising similarity in levels of satisfaction between the Australian states, among countries and specialties [2], [5], [6], in spite of widely different systems and work conditions, suggest that satisfaction is the result of a range of personal, institutional and social factors [3].
Female psychiatrists report higher levels of stress and lower levels of satisfaction than male. Similar findings have been reported elsewhere among physicians [e.g. 9]. Differences between male and female psychiatrists occur in a variety of areas, not just satisfaction. For example, female psychiatrists were less likely than male to be threatened with legal action, to have to respond to formal complaints and to have patients who killed themselves, even after controlling statistically for type of practice, subspecialty and state. Female psychiatrists were also more likely to support the RANZCP taking an active role in topical societal debates [10]. To understand gender differences better requires a more detailed analysis and is beyond the scope of this paper. However, the proportion of female psychiatrists in Australia is steadily rising (they comprise 40% among the younger than 40 years group compared with 18% in the older than 60 years group). This may have considerable implications for psychiatry. Understanding the gender differences may be useful to manage change in a profession that has been male-dominated until now.
Examining the satisfaction of psychiatrists with their work has received little attention in Australia, even though physician satisfaction is a significant factor that influences quality of care and workforce issues. Studies of psychiatrists' satisfaction have been conducted in the US [6], Canada [8], Scandinavia [3] and the UK [7]. It may be that governments, administrators and professional bodies in Australia consider this research unnecessary or self-indulgent. Alternatively, lack of information in this domain may just reflect the wider lack of interest in health services research in Australia. Understanding the possible reasons for psychiatrists' satisfaction is necessary if governments and managers are to improve mental health services. In our view, regular surveys examining these issues are important. The Commonwealth Government, the states and the RANZCP may need to take a more active role in this regard if they wish to manage mental health workforce matters proactively.
Footnotes
Acknowledgements
We thank Fellows of the RANZCP who completed the questionnaires and the RANZCP for providing membership data.