
Abstract
Modern mineral exploration involves making discoveries in geological environments where detecting deposits is increasingly difficult. This study presents an integrated, knowledge-driven prospectivity mapping approach to exploration in the glacial till-covered region of the Quesnel Terrane in British Columbia, Canada. The Quesnel Terrane hosts base and precious metal deposits; however, a ∼20, 000 km2 area consisting of variably thick glacial overburden truncates surface exposure, likely masking buried deposits. Through a combined fuzzy logic and index overlay approach, geophysical, structural, and geochemical criteria were integrated into a prospectivity model. Three concealed porphyry Cu targets were identified in the till-covered region and were validated by statistical analysis of lake and stream sediment geochemistry. The process of integrating various geoscientific disciplines and identification of targets has provided valuable insight for future exploration in covered regions. Moreover, the adopted approach leverages open-source public datasets, highlighting advantages of utilising such datasets for regional-scale exploration.
Keywords
Introduction
In the last century, dependence on technology and the steady growth of the world's population has led to an increased demand for mineral resources. This occurs at a time when discovery rates of new large mineral deposits are declining (S&P Global Market intelligence 2018). Exploration ventures are challenged by the reality that a significant portion of ‘traditional’ exploration areas have been previously investigated and exploited; thus, new projects in non-traditional environments must employ or develop new strategies to make discoveries. New frontiers, such as areas under glacial overburden, represent a challenge as they prevent direct access to collect samples and observations. Recent work to address covered regions include biogeochemistry (e.g. Reid and Hill 2010; Stewart et al. 2012), geochemistry of unconsolidated cover material (e.g. Xie et al. 2011; Laukamp et al. 2016; Yang et al. 2017), geophysical methods (e.g. Smith and Frankcombe 2006; González-Álvarez et al. 2016), and integrated approaches (e.g. Dugdale et al. 2010; Salama et al. 2016). The development of methods and techniques that will refine targets within prospective but non-traditional terranes will decrease exploration risk and favour strategic and effective allocation of exploration budgets.
Mineral prospectivity mapping (MPM) is a tool that leverages large and complex databases to highlight areas of interest for mineral exploration. There are two classes of MPM: data-driven, which identifies patterns in data (available methods summarised and evaluated in Pan and Harris 2000; Rodriguez-Galiano et al. 2015), and knowledge-driven, which relies on expert knowledge (Bonham-Carter 1994). Each approach provides a unique set of strengths and weaknesses that can suit one scenario more than another. Suitability depends on information availability in relation to data density, completeness, quality, and complexity, as well as the level of a priori geological knowledge of an area at local to regional scales (Dubois et al. 1999; Porwal et al. 2003). For instance, a knowledge-driven approach would be favoured in greenfield settings where there are few known deposits and data are sparse.
In this study, a combined continuous Fuzzy Logic (Kuratowski and Mostowski 1976) and Index Overlay (Bonham-Carter 1994) MPM approach is used to combine prospective signals from geological and geophysical layers. Results of this prospectivity analysis were then prioritised and validated using prospective lake and stream sediments selected using Principal Component Analysis (PCA) and Cluster Analysis (CA). This workflow is outlined in Figure 1. The method is designed to be accessible to a wide audience of geoscientists as it attempts to take a simplified and streamlined approach to calculate prospectivity at a regional scale. Moreover, the MPM performed here utilises publically available datasets and knowledge-driven criteria, thereby demonstrating that refining exploration models and target generation can be performed in a cost-effective manner.
Schematic of inputs and weighting factors used in the mineral prospectivity modelling (MPM) performed in this work. Seven criteria were integrated to obtain a prospectivity map highlighting mineral targets, whereas two were used for target validation. Weights, represented as percentages (%), were assigned using knowledge of data quality and the dataset's ability to reflect relevant mineralising features. See methodology section for further details on criteria definition, weighting, normalisation and integration techniques.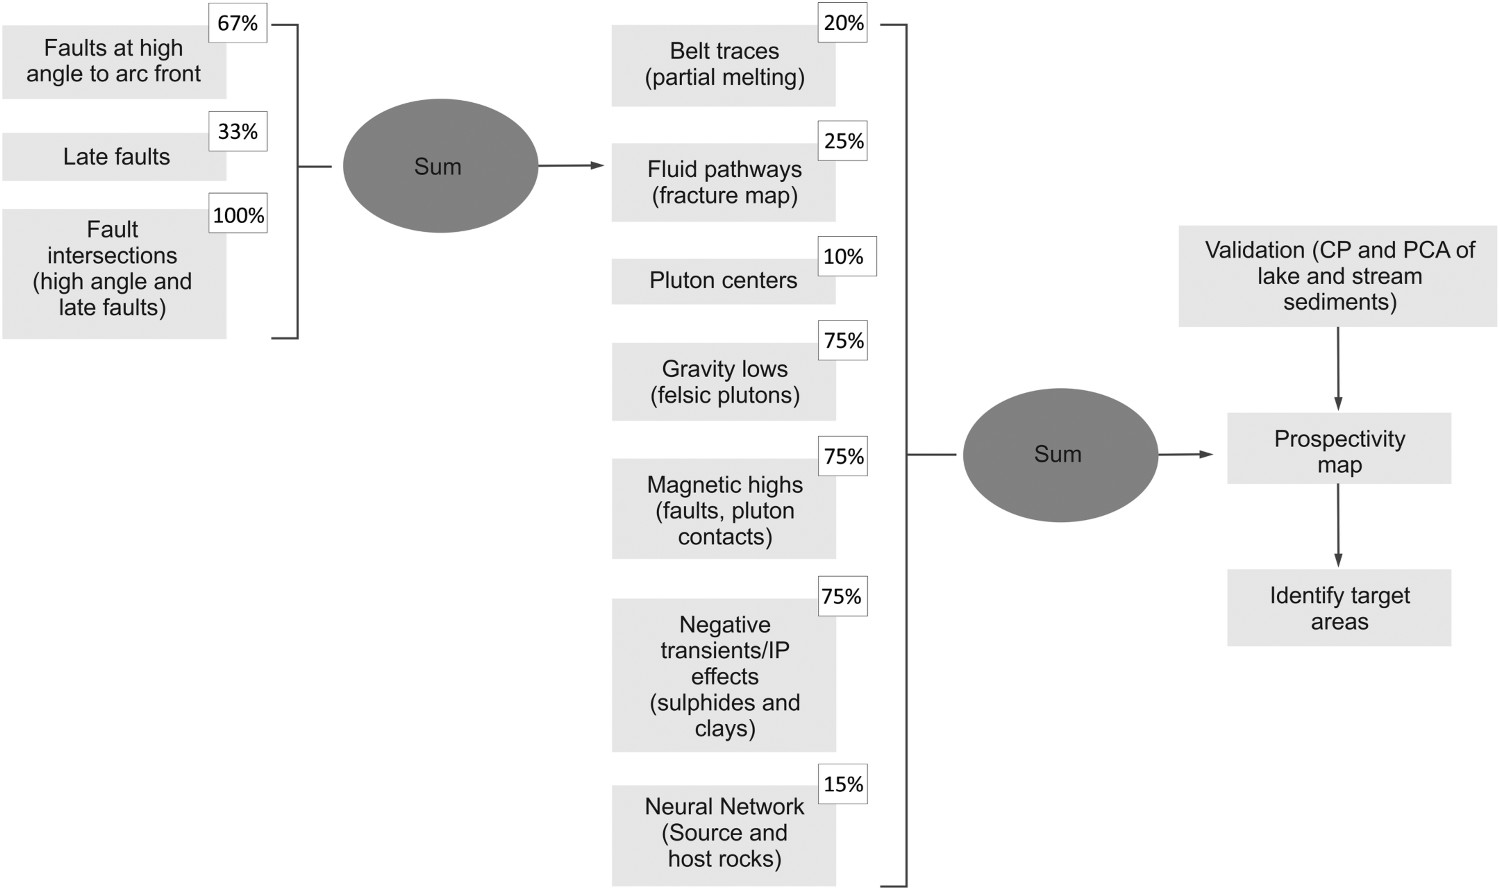
We apply MPM to an area covered by Quaternary sediments in the Quesnel terrane (Quesnellia) of British Columbia. This terrane forms part of a Paleozoic to Mesozoic magmatic arc of the Intermontane Domain of the Canadian Cordillera that hosts several large Cu–Mo and Cu–Au porphyry deposits (e.g. Gibraltar, Mt. Milligan, Mt. Polley). The reader is referred to Logan and Mihalynuk (2014) and references therein for a comprehensive description of individual deposits. The central portion of the Quesnel Terrane, which is centred on Prince George, is highly prospective for porphyry Cu but is grossly underexplored due to the presence of thick glacial overburden (Figure 2(A)). To address this, a publically funded geoscientific campaign, the Quesnellia Exploration Strategy, or QUEST (Geoscience BC 2009; 2019) was carried out and is responsible for the collection of a comprehensive geoscientific database in southeastern British Columbia. Acquired data notably consists of lake and stream sediment geochemistry and regional geophysical surveys. Additionally we created new datasets based on the geology of the area and knowledge acquired from analogous geological environments. In this work, we filtered these datasets to obtain signals consistent with the occurrence of mineralisation, and integrated these signals together in MPM (Figure 1) to refine the regional prospectivity model and generate targets for further exploration.
Detailed geology of the QUEST area (after Cui et al. 2017) geology of Quesnel; (A) overburden thickness map with ice flow directions (modified from Maynard et al. 2010); (B) geology of QUEST area (distribution of glacial till) with deposit locations; (C) age domains of mapped lithologies after Cui et al. (2017).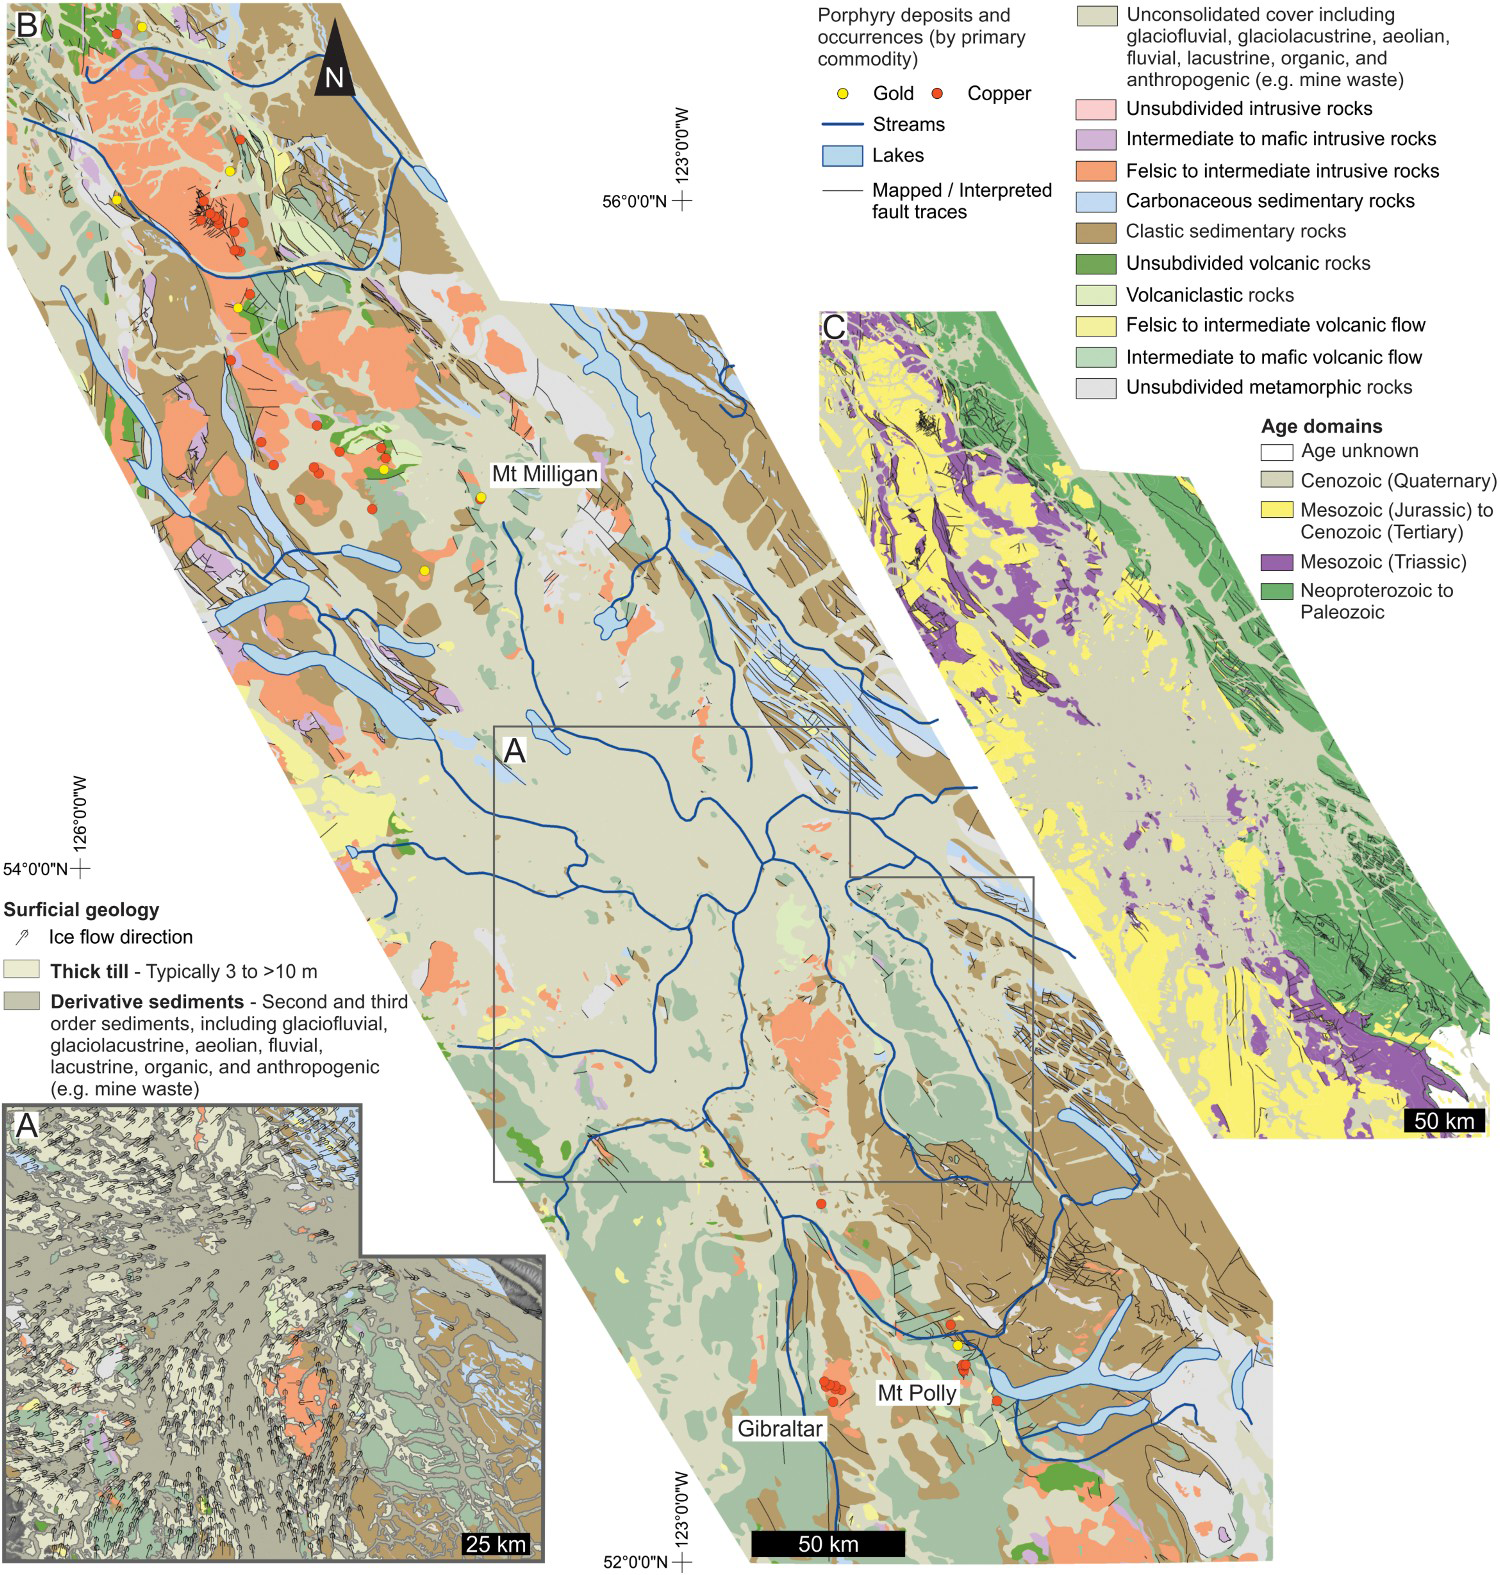
Background
Regional geology
The Cordilleran Orogen can be grossly divided into three domains (Johnston 2008): the eastern foreland domain (or North American margin) consisting of autochthonous sedimentary rocks, the central intermontane domain consisting of accreted allochthonous oceanic terranes, and the western insular domain consisting of allochthonous terranes of both continental and oceanic origin. We focus here on oceanic arc terranes of the intermontane domain, which originated offshore in the Paleo-Pacific (Mihalynuk et al. 1994).
The Devonian to Early Jurassic intermontane arc complex consists of two roughly coeval volcanic arc terranes, Stikinia and Quesnellia, and an associated accretionary complex, the Cache Creek terrane. The geology of the Quesnel terrane and its mineral deposits is described in detail by other authors (e.g. Logan and Schiarizza 2011; Logan and Mihalynuk 2014) and is only summarised here. Supracrustal rocks of the Quesnel terrane dominantly consist of upper Triassic volcanic to volcaniclastic rocks, including shoshonitic and pyroxene-phyric basalts of the Nicola and Takla Groups, and minor phyllite. Late Triassic to Early Jurassic calc-alkaline to alkaline intrusions are also ubiquitous with the terrane. Porphyry Cu–Au and Cu–Mo deposits associated with calc-alkaline and silica-undersaturated alkaline intrusions and transverse structures at a high angle (>70°) to the subduction front that locally intersect major arc-parallel faults. These deposits, along with other genetically associated mineral deposits, make Stikinia and Quesnellia the most economically important metallogenic terranes of British Columbia (Nelson et al. 2013; Logan and Mihalynuk 2014). Most mineralisation occurs within a 15 million year window, with a peak of mineralisation within a 6 million year phase centred at 205 Ma (Logan and Mihalynuk 2014).
In the QUEST area, bedrock geology under thick (typically >10 m and locally up to ∼100 m) glacial overburden (Figure 2) has been indirectly inferred from aeromagnetic and gravity grids (Sánchez et al. 2015; Caron et al. 2019) and projected mapped bedrock geology along trend from outside the covered region. Mineral deposits and showings have been identified both north and south of the QUEST area along trends parallel to the orogenic front. These trends are interpreted to represent at least four temporally and spatially distinct intrusive magmatic belts, exhibiting an eastward younging (Logan and Schiarizza 2011; Schiarizza 2014). Additionally, some deposits within the southern Quesnel terrane, such as the Afton deposit within the Iron Mask batholith, occur at the intersection of NW and E-trending structural corridors (Logan and Mihalynuk 2014).
Data sources
Inputs for MPM stem from datasets provided through Geoscience BC and the British Columbia Geological Survey (BCGS). The majority of data used was released through Geoscience BC's QUEST dataset (Geoscience BC, 2008; Geotech Limited, 2008; Sander Geophysics Limited, 2009; Geoscience BC, 2009; Williams and Ma, 2010). Additional datasets with more specific applications were acquired from Geoscience BC, and the BCGS (Maynard et al. 2010; Sánchez et al. 2015). From these inputs, nine prospectivity criteria were generated for MPM. All datasets used in this study are described below and an exhaustive list of data sources is available in Tschirhart et al. (2018).
Lake and stream sediments
Lake and stream sediment geochemical data were obtained from Barnett and Williams (2009). This dataset contains elements such as Ag, Al, Bi, Ca, Cd, Cu, Ga, Hg, K, Mg, Mn, Mo, Ni, P, Pb, S, Se, Sr, Ti, Tl, V and Zn, measured by inductively coupled-plasma mass spectrometry (ICP-MS) and As, Au, Ba, Ce, Co, Cr, Fe, La, Na, Sb, Sc, Th and U, measured using instrumental neutron activation analysis. Because the geochemical data were obtained over three decades in different field seasons, Barnett and Williams (2009) levelled and blended data of adjacent map sheets so that survey data were comparable across the entire study area. More information about sampling and data treatment is presented by Barnett and Williams (2009).
Geophysics
Two airborne geophysical surveys were flown as part of the QUEST project. These include 25, 499 line kilometres of airborne gravity (Sander Geophysics Limited 2008) and 11, 583 line kilometres of airborne Versatile Time Domain Electromagnetic (VTEM) and magnetic data (Geotech Limited 2008). Airborne gravity data was acquired along traverse and control lines oriented 90°/150° and spaced 2000 m and 17, 000 m, respectively and VTEM and magnetic data were acquired along traverse lines oriented 90° and spaced 4000 m. No control lines were planned or flown for the VTEM survey. The airborne gravity and magnetic dataset was gridded using the minimum curvature algorithm. For the gravity grid, a 500 m grid cell size was used, while the VTEM (channel 11) used a 1000 m grid cell size. Additional aeromagnetic datasets were also available through the Canadian Geoscience Data Repository along 90° oriented traverse lines spaced 800 m apart has a 200 m grid cell size.
Geology
Interpreted and observed lithology and Quaternary sediment layers were compiled from the BCGS's 2015 Digital Geology database (Cui et al. 2017). Fault traces were inferred using projection from areas with exposed bedrock (Logan et al. 2010 and references therein), and were subsequently re-interpreted by Sánchez et al. (2015) using aeromagnetic surveys.
Methodology
The workflow for MPM used here is presented in Figure 1, which involves the normalisation, weighting and integration of model inputs. We describe how model inputs and associated prospective signal characterisation were obtained in the following section, whereas processes of normalisation and weighting involved in constructing the MPM are described in section ‘Data integration’.
Model inputs and signal Isolation
Mineral prospectivity mapping involves the integration of collected (e.g. geophysical grids) and interpreted (e.g. fault traces) criteria. When exploring for deposits of a given system, key features related to that system are identified and their signal within the criteria layers is isolated. This section describes the methods that were used to isolate these prospective signals.
Geochemical inputs
Using lake and stream sediment geochemistry (Figure 3(A)), a neural network map was constructed by Barnett and Williams (2009; Figure 3(B)), whereas principal component analysis (PCA) and cluster analysis (CA) were performed as part of the current study (Figure 3(C)). PCA and CA identified prospective samples that express similar geochemical signatures as those found near known mineralisation. These were then used to independently validate and prioritise MPM results.
Geochemical inputs: (A) distribution of lake and stream sediment samples overtrain on grouped lithologies from Cui et al. (2017). Lithologies were categorised based on interpreted relationship to productivity for porphyry Cu mineralisation; (B) neural network predicted lithologies grouped using the same lithology classification as panel A. These lithologies compare well with mapped/interpreted units from Cui et al. (2017); (C) prospective samples selected by Principal Component Analysis (PCA) and Cluster Analysis (CA) over lain on top of a digital elevation model and hydrologic network to show transport direction of sediments.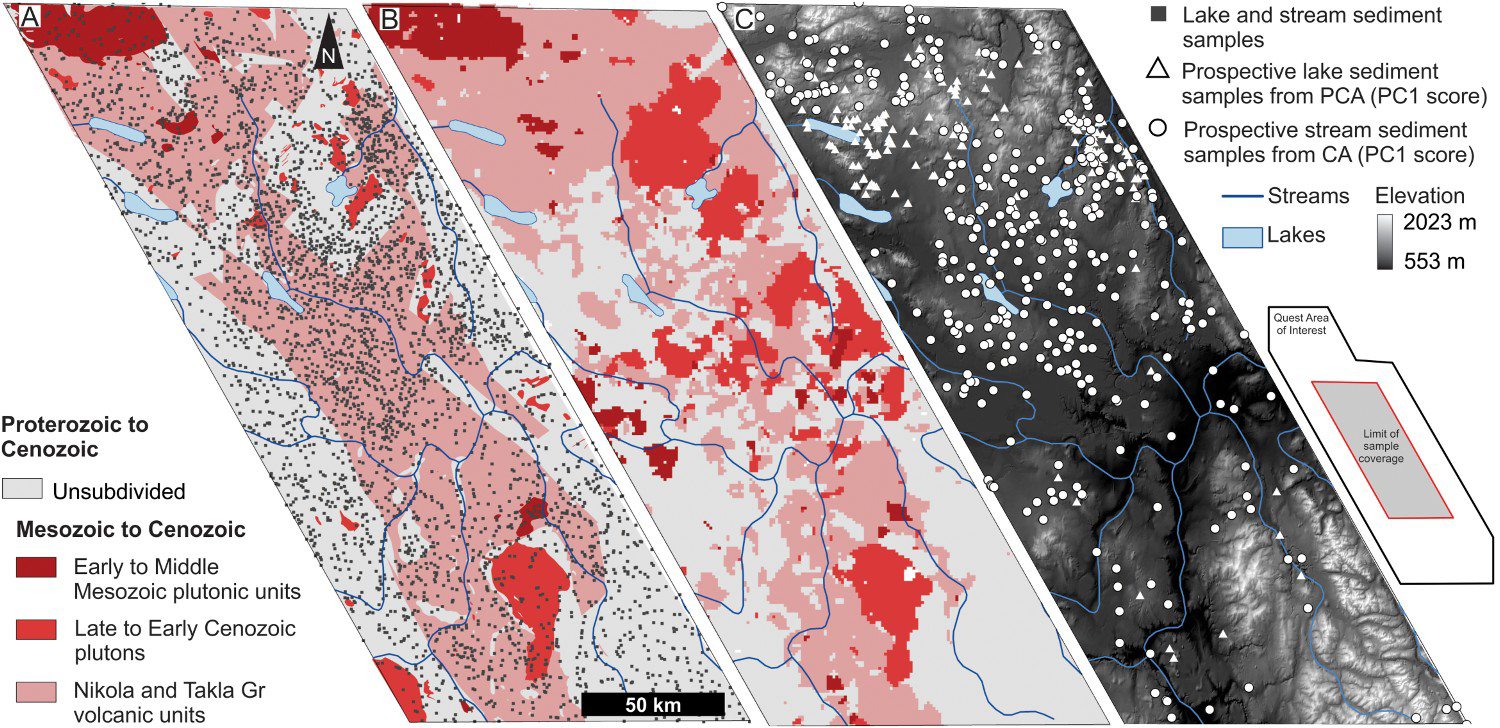
Principal component analysis
Stream and lake sediment geochemical data were treated separately for PCA because of inherent differences between the sampled media; nevertheless, the element lists for both are identical (see above). Compositional data are inherently closed because values sum to a constant (1 or 100%), which results in forced inter-variable correlations if the multivariate statistical analysis is directly applied to the raw data (Aitchison 1982; Filzmoser et al. 2009). The ‘closure problem’ was overcome by transforming the data using the centre-log ratio (CLR) transformation (Aitchison 1982; Thió-Henestrosa and Martín-Fernández 2005). PCA was performed using the ‘RGR’ package of Garrett (2013) within the R statistical software environment (R Core Team 2018). The resulting loadings and scores are displayed in CLR space where compositional biplots are shown (Figure 4(A, B)).
(A) Distribution of Cu concentrations of the stream sediment database in PC space. Samples with high values of Cu yield low PC2 values, and are associated with two distinct element assemblages defined by low (Cu–Ag–Cd–Hg–Se–Sr–S–Mo–Au) and high PC1 (Cu–Mg–Cr–Ni–Ca–V–Ti–Sc) values. (B) Distribution of Cu concentrations of the lake sediment database in PC space. The data distribution is more limited, and in general, higher contents of Cu and other pathfinder elements (e.g. S–Mo–Cd–Au–Ag) tend to have low PC1 values. (C) the results of the stream sediment K-means clustering classification plotted in PCA space.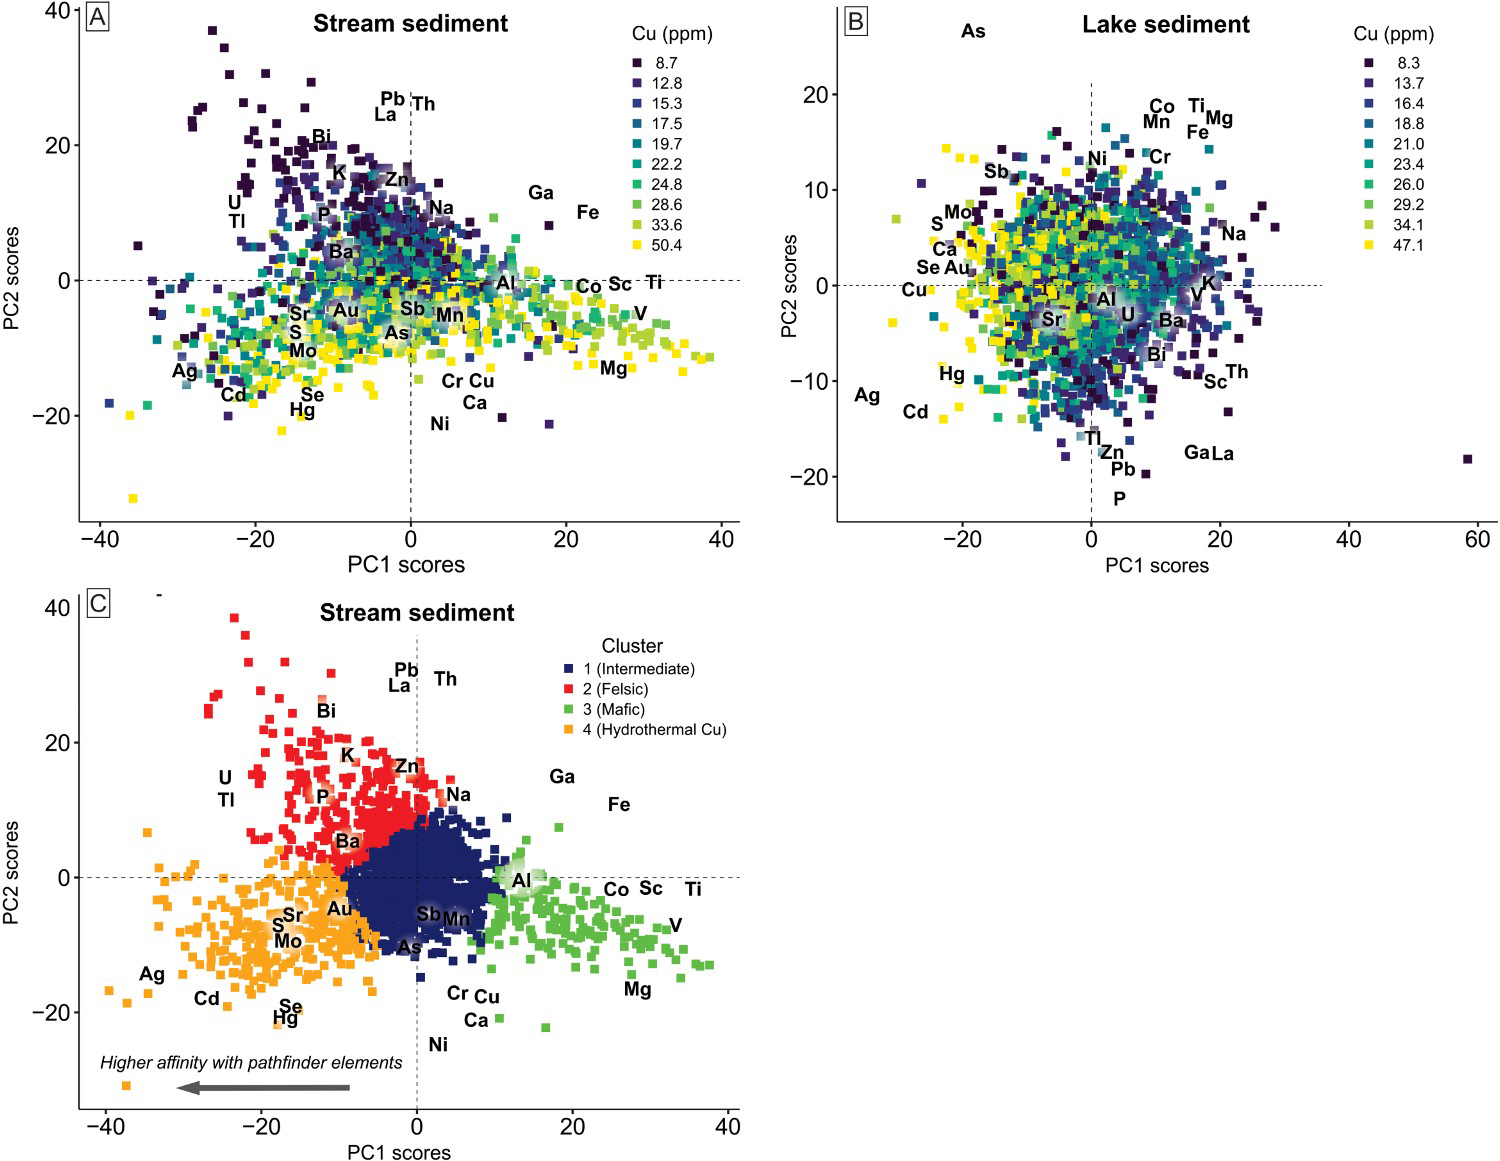
Results from PCA of stream sediments show that elements having higher affinity for Cu display high PC2 loadings, where samples with negative PC2 scores achieve higher Cu concentrations. The PC1 versus PC2 biplot (Figure 4(A)) shows that two assemblages of elements covary with Cu. The first is Cu–Mg–Cr–Ni–Ca (V–Ti–Sc), and the second is Cu–Ag–Cd–Hg–Se (Sr–S–Mo–Au). Samples correlated with assemblages one and two overall yield high and low PC1 scores, respectively (Figure 4(A)). Our interpretation is that elements from assemblage one are consistent Fe–Mg-rich minerals contained in mafic rocks. Elements from assemblage two are typical of a hydrothermal source indicative of Cu–Au porphyry mineralisation style. Herein, assemblages one and two are referred to as magmatic and hydrothermal, respectively. The lake sediment shows much less variation along PC1 and PC2 relative to the stream sediment data, where Cu–Mo–Au–Se–S–Ag–Hg yield low PC1 values while most major elements, Cr, V and Th yield high PC1 values (Figure 4(B)).
Cluster analysis
In this study, we used clustering tools to partition PC scores into their natural groupings to simplify further analysis. Because mineralogic and/or lithologic clusters in log ratio-based PC space may be approximated by multivariate normal distributions, the resultant natural groupings commonly define circular to ellipsoidal clusters. Clustering was performed on the first six PC axes, which correspond to 65% of the dataset variance, using the K-means algorithm in the ‘stats’ package (R Core Development Team 2018). The preferred number of K-means clusters was based on a majority vote rule of multiple statistical tests (n = 30) carried out using the R package NbClust (Charrad et al. 2014), which defined four clusters. The selection of PCs accounting for 65% of the data variance was subjective but aimed to include components that account for at least more than half of the data variability. Further inspection of the data shows that a decrease or increase of the PC axes as input for K-means clustering did not result in change of the estimate for the number of appropriate clusters.
Figure 4(C) displays the cluster analysis results in PCA space. Clusters 2, 3 and 4 are representative of the three ‘branches’ described by the data in the PC1 versus PC2 biplot. High affinity of cluster 3 to the magmatic Cu element assemblage indicates a detrital component derived from a mafic source (Figure 4(A, C). In contrast, cluster 2 has elevated concentrations of large ion lithophile (e.g. Ba, K) and high field strength (Th, U) elements suggesting a detrital component dominated by a felsic source (Figure 4(A, C)). Cluster 1 is indicative of samples with intermediate compositions, and thus, most of them group around the origin (Figure 4(C)). Cluster 4 encompasses samples having the hydrothermal Cu fingerprint, and as such, these are regarded as the most prospective for Cu–Au porphyry mineralisation (Figure 4(A, C)). A second-order discrimination criteria to assess the prospectivity of samples from the hydrothermal Cu group is their variation along the PC1 axis. Samples having lower PC1 scores have more affinity with pathfinder elements (e.g. Ag, Cd, Se, Hg) relative to samples having PC1 scores closer to zero (Figure 4(C)).
Cluster analysis was also carried out on the lake sediment database, however, its reduced variability in PC space lead to limited results that are not reported here. The lower variability is interpreted to reflect the narrow geographic distribution of these samples (Figure 4(B)). Additionally the lake catchments are situated on areas of glacial overburden that may contribute homogenised fine-grained sediments to lake sediment surveys and mask geochemical differences. Although the natural groupings are diminished (such as compared with stream sediment data), PC1 values were used as the main prospectivity discriminator, and thus, lake sediment samples having PC < −8 (percentile of 20%) were regarded as the most prospective.
Neural networks
Barnett and Williams (2009) applied neural network algorithms to infer bedrock geology using stream and lake sediment geochemistry. Regardless of the transported nature of the analysed media, Barnett and Williams (2009) assume that at a regional scale, lake and stream sediments are representative of local (laterally and underlying) bedrock sources. Therefore, bedrock lithology can be inferred using predicted results from the neural network (see Figure 12 in Barnett and Williams 2009 and Figure 3(B) in this publication). These lithologies were classified and ranked according to the relationship to mineralisation. Four lithologic groupings related to Cu mineralisation in the covered area were mapped: (1) Early to Middle Mesozoic plutonic rocks that host major porphyry Cu-Au deposits and mines (e.g. Mount Milligan; Logan and Mihalynuk 2014); (2) Late Mesozoic to Early Cenozoic plutonic rocks that are prospective for other types of deposits (e.g. placer Au; Allan et al. 2013); (3) Nikola and Takla Group volcanic rocks that are interpreted to be a barrier that channelled magma flow during the formation of several large porphyry districts (Logan and Mihalynuk 2014). (4) Unsubdivided Proterozoic and Paleozoic rocks that are unlikely to have played a role in the porphyry Cu system.
Geophysical inputs
Airborne gravity and magnetics
Derivatives and transformations were calculated from the gridded airborne gravity and pole reduced (RTP) magnetic data to further enhance magnetic textures, the locations of structures and contacts, and short wavelength anomalies (Figure 5(A, B)). These included the first vertical derivative (1VD) for the gravity and magnetic grids and tilt angle (TILT; Miller and Singh 1994) for the magnetic grid.
Geophysical inputs: (A) first vertical derivative of the pole reduced magnetic field; (B) first vertical derivative of Bouguer Gravity; (C) VTEM Channel 11 (db/dt); (D) induced polarisation (IP) negative transients. Inset of location and extent of geophysical surveys within the QUEST area of interest.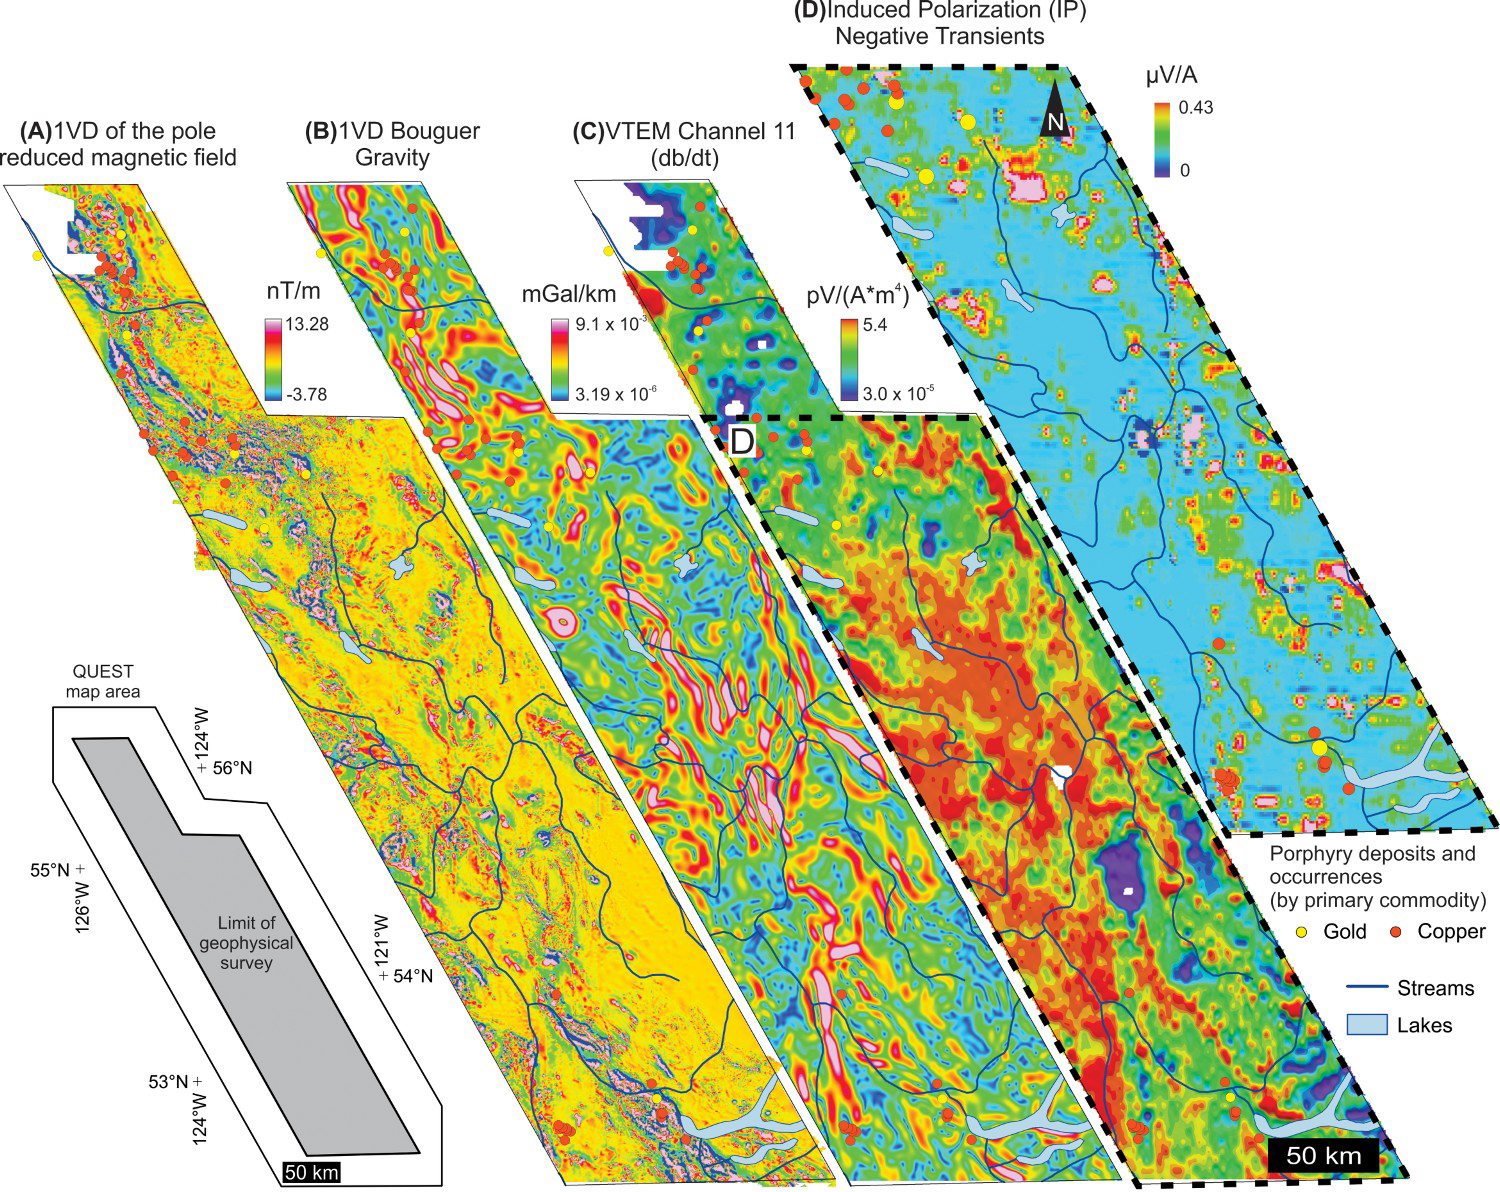
Induced polarisation and transient electromagnetics
Induced polarisation (IP) effects from transient electromagnetic (EM) datasets are observed to be associated with clays, sulphides, and graphite (Smith 2016). At Mt. Milligan, pyrite content increases outwards from the potassic to propylitic alteration zone which surrounds the stockwork and along with chalcopyrite in the potassic zone are primary controls on the chargeability response of the deposit (Oldernburg et al. 1997). The negative transients were extracted along-line from the VTEM dataset by summing negative amplitudes in the mid to late channels (Figure 5(C, D)). Summing the negative transients highlights additional prospective areas along-line, especially when anomalies cannot be correlated to man-made features (e.g. power lines, electricity plants) or lithology.
Knowledge-based structural inputs
Structural fluid pathways: Faults and cross-arc structures
Hydrothermal mineralisation and fluid flow are strongly dependent on the presence of preexisting and/or active structures in arc terranes. A notable relationship exists in arc terranes between mineralisation and the presence of transverse structures at a high angle (strike > 70°) to the subduction front that locally intersect major arc-parallel faults (e.g. Andean porphyry belt of Chile, Richards et al. 2001; Oyu-Tolgoi District, Mongolia, Khashgerel et al. 2008). Fault intersections and faults at high angles to the structural grain (trending between 035 and 050°) are thus considered to be the most prospective fluid pathways (Figure 6) while pre- to syn-tectonic faults are considered to be moderately prospective.
Interpreted fault traces using upward continued deep pseudogravity-transformed Reduced To Pole (RTP) magnetic data (after interpretation by Sánchez et al. (2015)). Faults and intersection points are classified based on prospectivity. Intersections between fault at a high angle to the arc front and late faults are considered to be the most prospective.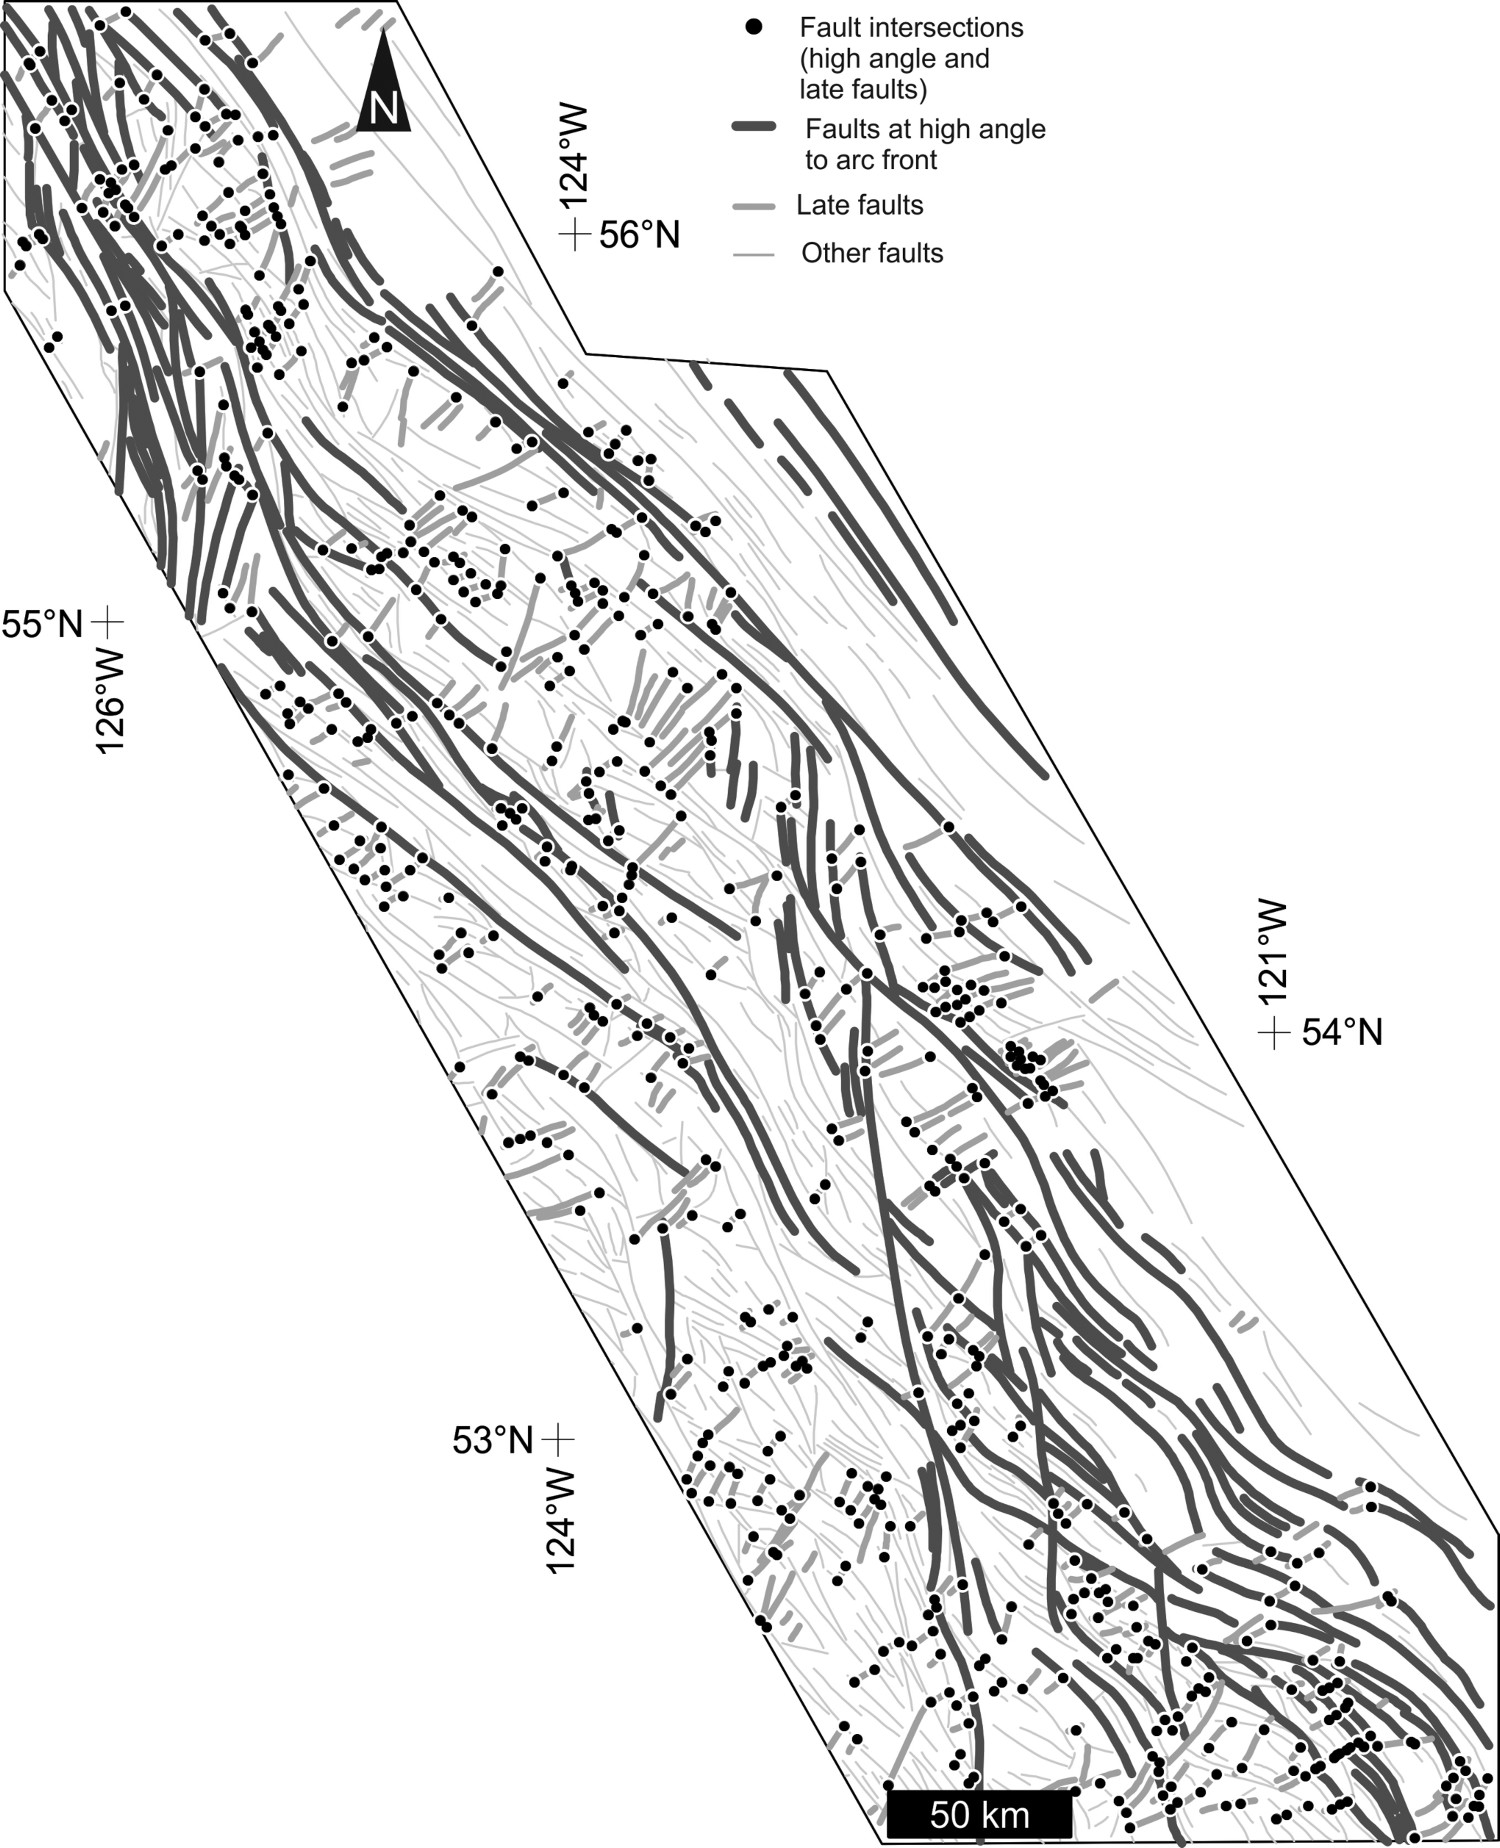
Architecture of arcs: Magmatic belts
Porphyry Cu systems tend to occur along orogen-parallel semi-continuous belts, ranging in length scale from 100s to 1000s of kilometres (Popov et al. 2002; Sillitoe and Perrelló 2005; Sillitoe 2010). Four temporally and lithologically distinct belts are defined in the exposed portions of the Quesnel terrane (Logan and Schiarizza 2011; Schiarizza 2014) using known intrusions and associated mineral deposits to the north and south of the covered area (Figure 7(A)). The westernmost and oldest belt, named Belt W herein, includes the Gibraltar deposit but extends northwards outside of the QUEST area and is thus not considered further in this work. The three remaining belts (1, 2, and 3) are interpreted to extend underneath the covered region since intrusions and deposits that define the belts occur along trends on either side of the covered area. The trace of Belts 1–3 are relevant to the prospectivity of the QUEST area because of their observed relationship to mineralisation outside of the covered area. Figure 7(B) shows the result of our interpretation of the extension of the belt traces into the QUEST area, while respecting post-magmatic fault displacements of the belts utilising the structural interpretation of Sánchez et al. (2015).
Belts and pluton centres of Quesnellia: (A) simplified geology of the area southeast of QUEST, known as south QUEST herein (refer to provided inset). Magmatic belts used for MPM in the QUEST are defined from the exposed geology in this area (see text for discussion). The figure is modified after Schiarizza (2014) and Logan and Schiarizza (2011). Batholith and intrusion names are provided in italics; an asterisk indicates that the intrusion lacks a known mineral deposit (Logan et al. 2010; Logan and Schiarizza 2011). Abbreviations (deposit name, if different from the batholith name, is provided in brackets): Belt W: GC: Guichon Creek batholith (Highland Valley), GM: Granite Mountain batholith (Gibraltar); Belt 1: CM: Copper Mountain, IM: Iron Mask batholith (Afton), RR: Rayfield River, PL: Peach Lake, MP: Mount Polley; Belt 2: BM*: Bromley batholith, PN: Pennask batholith (Brenda), WH*: Wild Horse batholith, TY*: Thuya batholith, TK: Takomkane batholith (Woodjam); Belt 3 (deposit names): HF: Heff skarn, DL: Deer Lake skarns, BO: Bogg; SG: Sleeping Giant; (B) projected plutonic belts and centres within the covered region of QUEST overlain on map of fault traces interpreted by Sánchez et al. (2015) and mapped plutonic bodies and the mapped limits of late Paleozoic to Mesozoic wall rocks.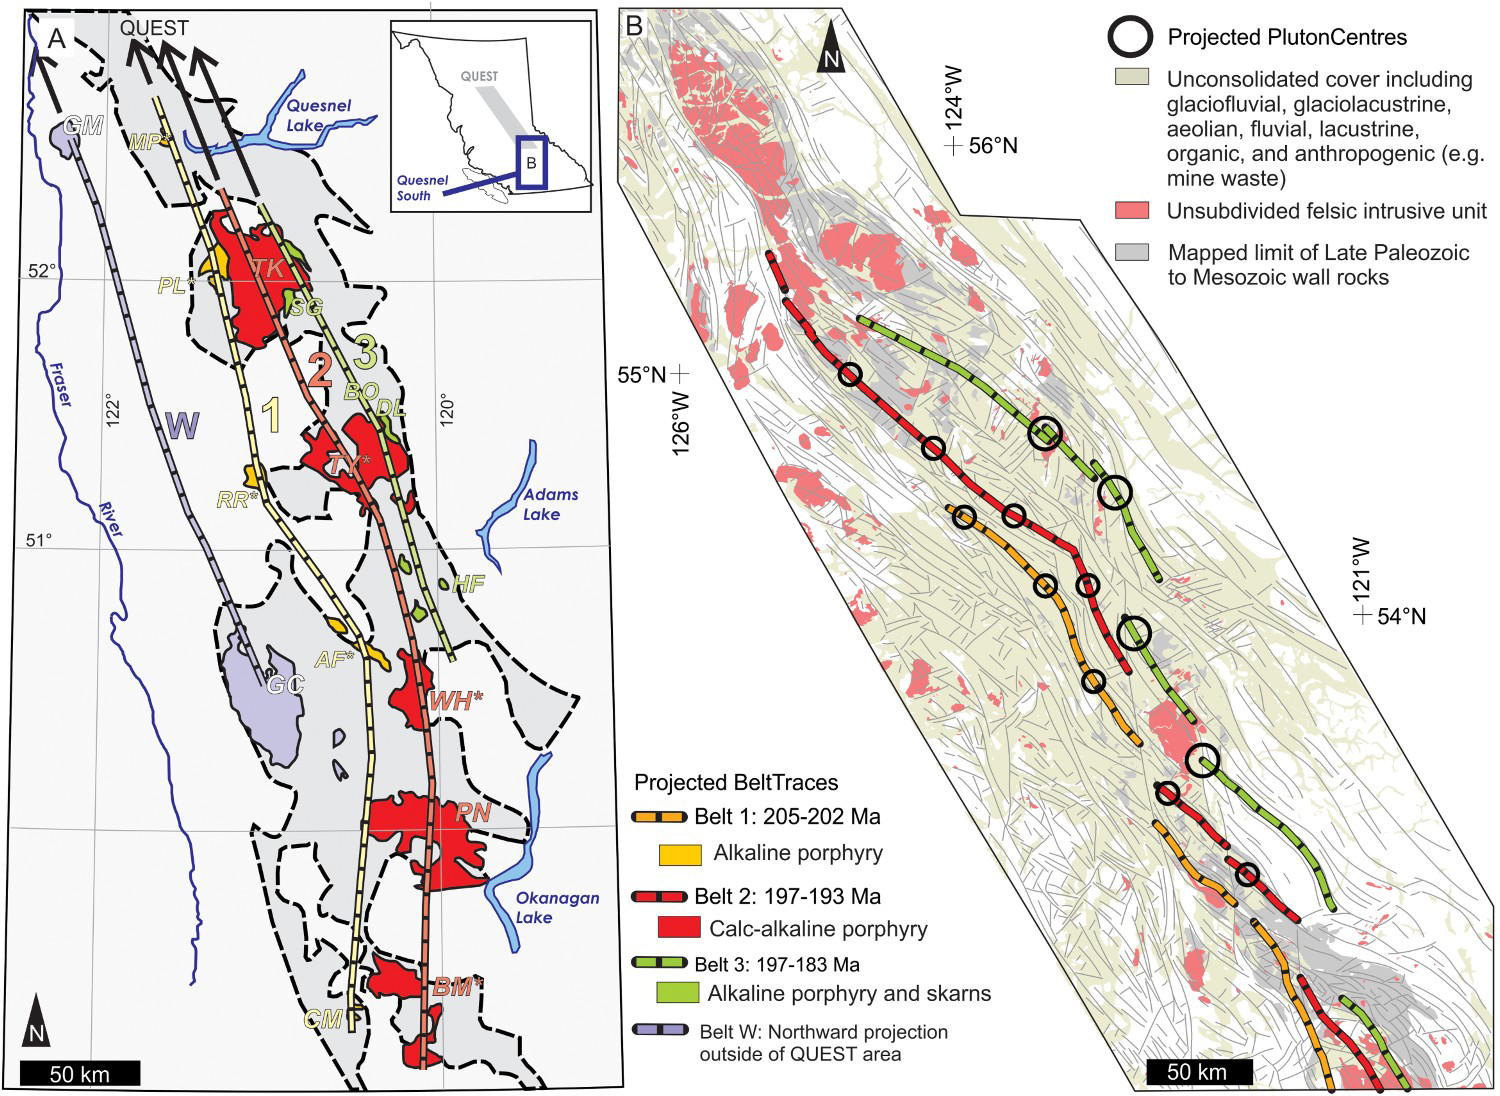
Architecture of arcs: Characteristic spacing of plutonic centres
Along magmatic arcs, plutons tend to exhibit a characteristic spacing between volcanic centres, on the order of 100 km (e.g. Marsh 1979). This spacing is controlled by magma production rates and magma funnelling processes during upward transport from the base of the mantle wedge (e.g. Cruden and McCaffrey 2001). Plutons of the southern Quesnel terrane exhibit such characteristic spacing (Figure 7(A)); notably, Logan and Mihalynuk (2014) indicate that characteristic spacing of plutonic centres represents a ‘crude exploration targeting method’. Pluton spacing, extended northwards into the QUEST area (Figure 7(B)), gives the likely position of plutonic centres assuming that characteristic spacing is maintained. This technique is supported by the occurrence of known Cu deposits adjacent to projected pluton centres north of the covered area. For the model, the size of circles representing pluton centres is related to the size of the plutons within that given belt and the degree of confidence in evaluating characteristic spacing. Plutonic centres for Belts 1 and 2 (green and orange, respectively; Figure 7(A)) are interpreted to have a 5 km radius and 50 km spacing based on observations south of the covered area that show that deposits tend to be associated with large 10 km-scale plutonic bodies (Figure 7(B)). Centres for Belt 3 (red) are 7.5 km in diameter (Figure 7(A)), based on the observation that deposits along this belt, north and south of QUEST (Figure 7(B)), tend to be located within regularly spaced clusters of smaller intrusions.
Inferred plutonic centres obtained from characteristic spacing are broadly consistent with the positions of intrusions mapped using neural networks (Figure 3(B)), thereby increasing confidence in these projections.
Data integration
The approach of MPM relies on mapping and integrating identified prospective signals. A combination of two MPM methods was applied here, Continuous Fuzzy Logic (Kuratowski and Mostowski 1976) and Index Overlay (Bonham-Carter 1994). Geophysical and geological criteria were integrated in the manner described below. However, prospective samples statistically selected from the lake and stream sediment geochemical database (Figure 3(A)) were not included in the integration. Instead, these samples were used as an unbiased validation tool (Figure 1) to prioritise and increase confidence in targets generated by the MPM.
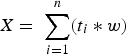
Evidence layers of prospective signals are normalised using the following equation:
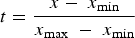
The normalised layers were then weighted using a weighting factor (w), which is determined using expert knowledge. Weights are assigned (see Figure 1 for weights for each evidential layer) based on knowledge of data quality and the dataset's ability to reflect relevant mineralising features in the present geologic setting. The origin of a dataset is also an important factor to consider. Interpreted datasets (e.g. fault traces or pluton centres) are given lower weights than collected datasets (e.g. geophysical maps) because they are biased uniquely by individual geoscientists and are subjective.
Similar to the Index Overlay method, the weighted layers were added together to produce a single prospectivity map using Equation (2) where X is the prospectivity value and t is the normalised value from each evidential layer.
As an early phase of integration, fault traces and their intersections were combined into a ‘fluid pathways map’, which was increased into MPM as a single input. This was done to diminish the effect of overrepresentation of faults in the final map.
Results
The final prospectivity map (Figure 8), presents several regions of elevated prospectivity (areas with normalised prospectivity > 0.5) that cover ∼2% of the map's surface area. Within the map, three regions were identified as priority exploration targets (red circles in Figure 8). Within these zones, several evidential layers indicate prospectivity at the same location, and these are validated by a close spatial relationship with lake and stream sediment samples selected by Principal Component Analysis and Cluster Analysis. In the north end of Figure 8, zones of high prospectivity are spatially associated with known mineralisation (Mt. Milligan, Chuchi Lake and other sampled prospects), thus increasing confidence that results reflect prospective targets. All other zones with high prospectivity were not prioritised because there are no prospective lake and stream sediments nearby. Additionally, there are two zones of known mineralisation in the northwest corner of Figure 8. These zones do not have high prospectivity values because they are not spatially associated with any geological criteria and have weak geophysical signals.
Prospectivity map of the till-covered region in the Quesnel Trough highlights areas of exploration interest. Colour values range from low (blue – 0) to high prospectivity values (pink – 1). Lake and stream sediment samples selected using cluster analysis (circle; CA) and principal component analysis (triangle; PCA) that show a spatial association with zones of high prospectivity are used to validate target locations.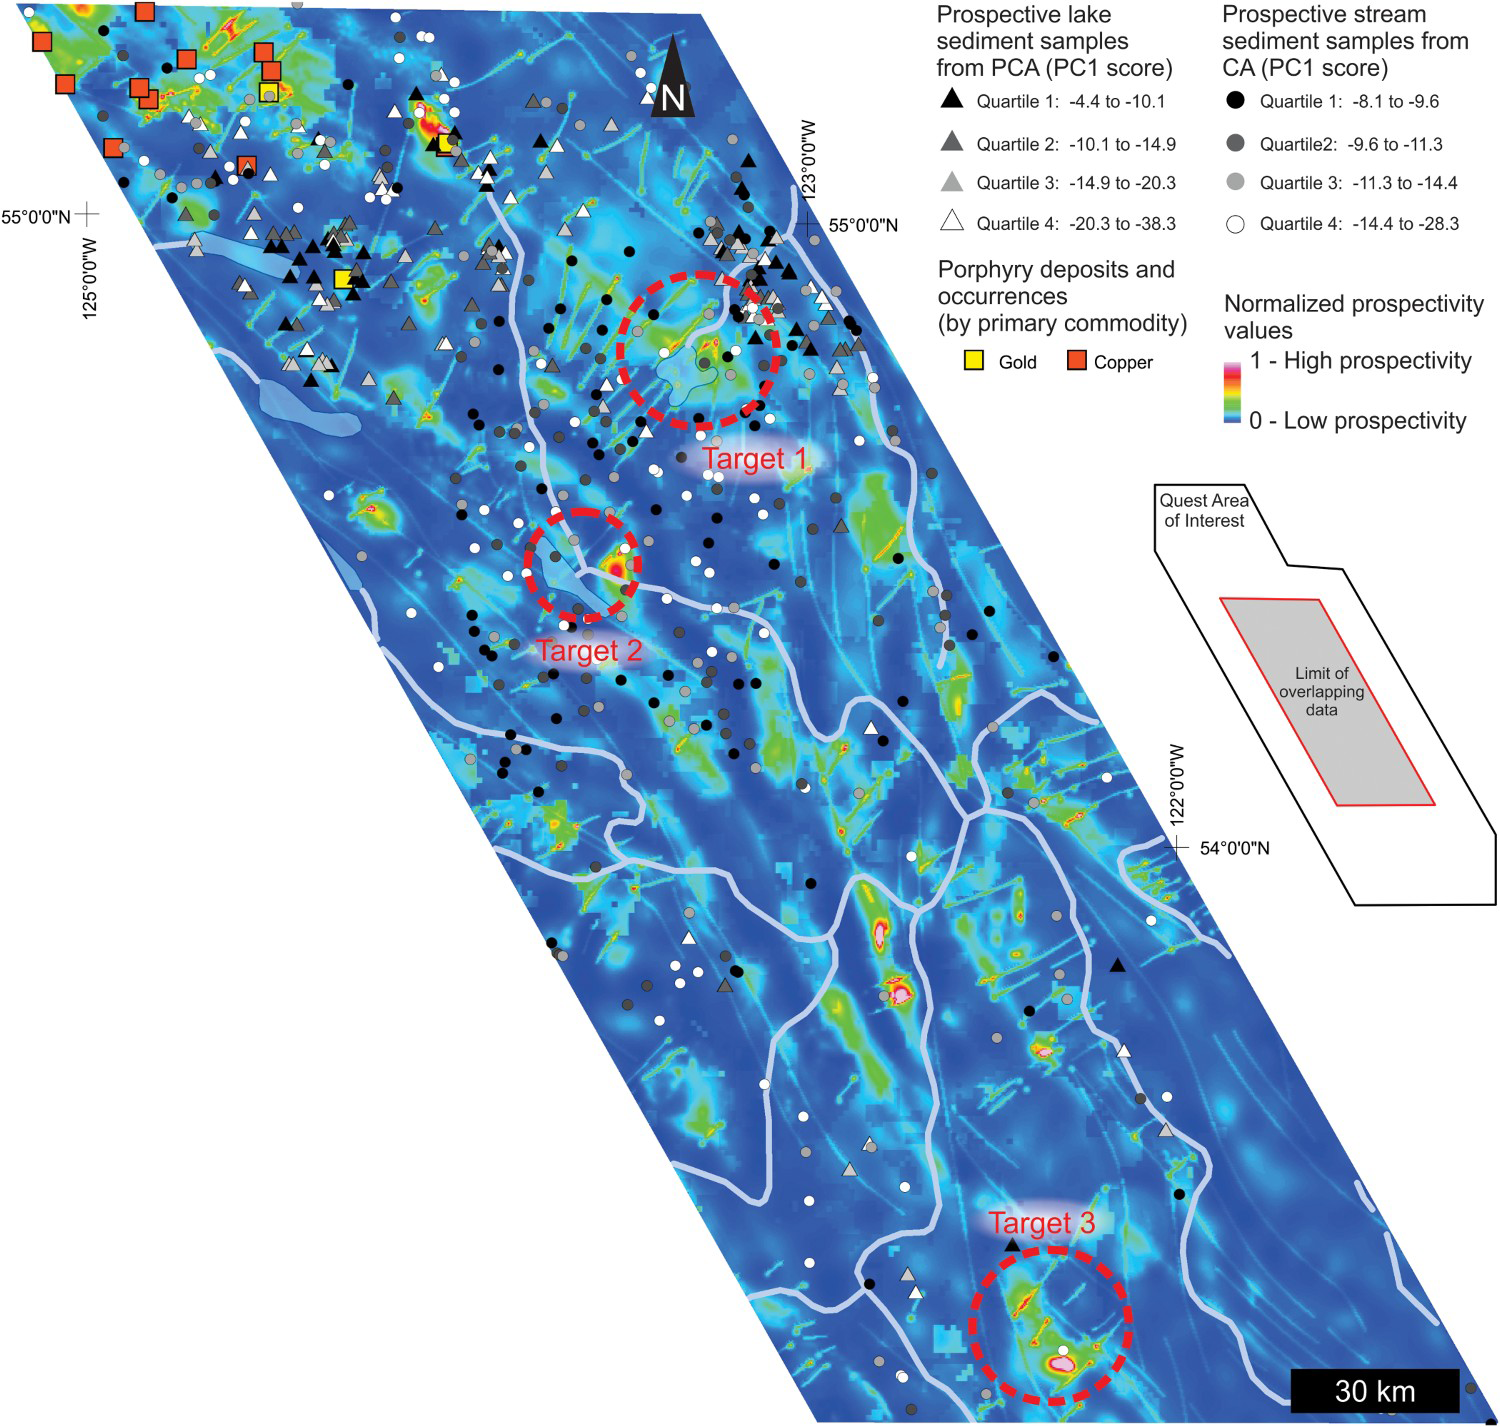
In the centre of Target 1 (Figure 9(A)) is a projected pluton centre (Figure 9(B)), which is supported by a predicted plutonic lithology from the neural network (Figure 9(C)). Additionally, there are anomalous magnetic highs (Figure 9(D)), gravity (Figure 9(E)), and conductance from IP effects (Figure 9(F)) surrounding the ‘pluton zone’ that are consistent with high mineral potential. The co-location of these independently derived signals, as well as the abundance of nearby prospective samples from cluster analysis and principal component analysis, makes this region a desirable target for future exploration. Similarly, Targets 2 and 3 (Figure 9(G, M)) also contain a projected pluton centre (Figure 9(H, O)) and co-located circular magnetic anomalies (Figure 9(J, P)). The pluton in Target 3 is further supported by a predicted plutonic lithology in the neural network (Figure 9(N)) and a circular gravity low (Figure 9(Q)). Again, proximity to this felsic intrusive body, the high magnetic and gravity signals surrounding the plutons, as well as the conductance anomalies at their periphery, make these areas good candidates for future exploration.
Prospectivity result and evidential layers for the two targets selected for further exploration: (A, G, and M) prospectivity results with overlain PCA (lake sediment) and CA (stream sediment) selected samples and inset location map for Targets 1, 2, and 3 respectively; (B, H, and N) predicted lithologies from lake and stream sediment neural network. Legend for lithological groups presented in Figure 3(B); (C, I, and O) digital elevation model (m) and knowledge-based inputs (projected pluton centres, belt traces, fault traces); (D, J, P) first vertical derivative of airborne magnetic intensity (nT); (E, K, Q) first vertical derivative for airborne gravity (mG/km); (F, L, R) negative transients (μV/A) for Target 1, 2, and 3 respectively. Continued.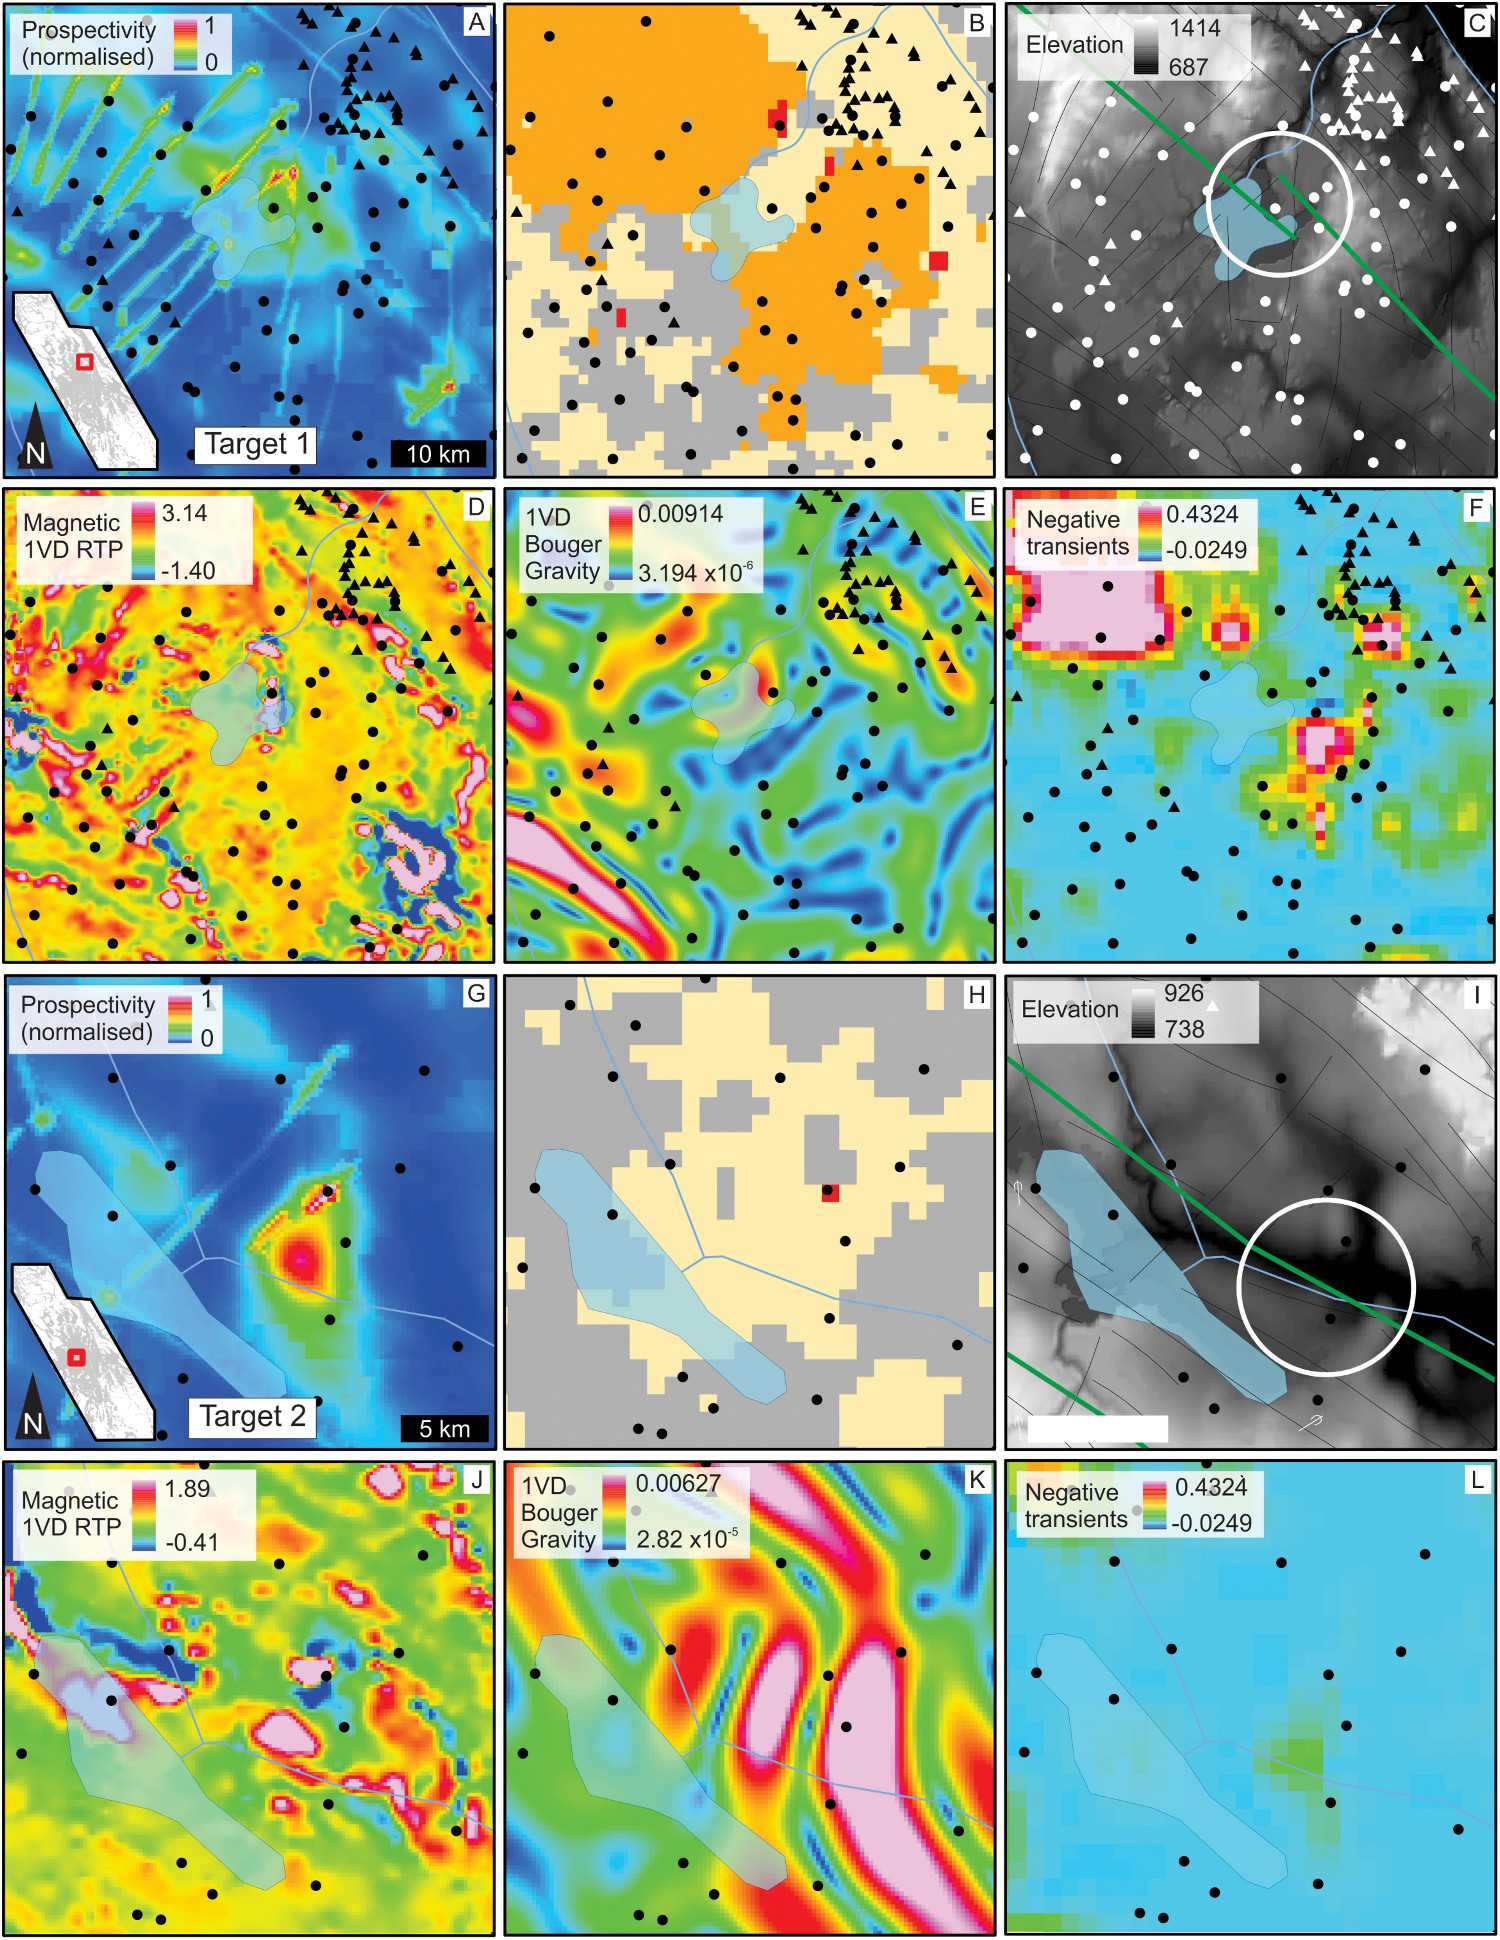
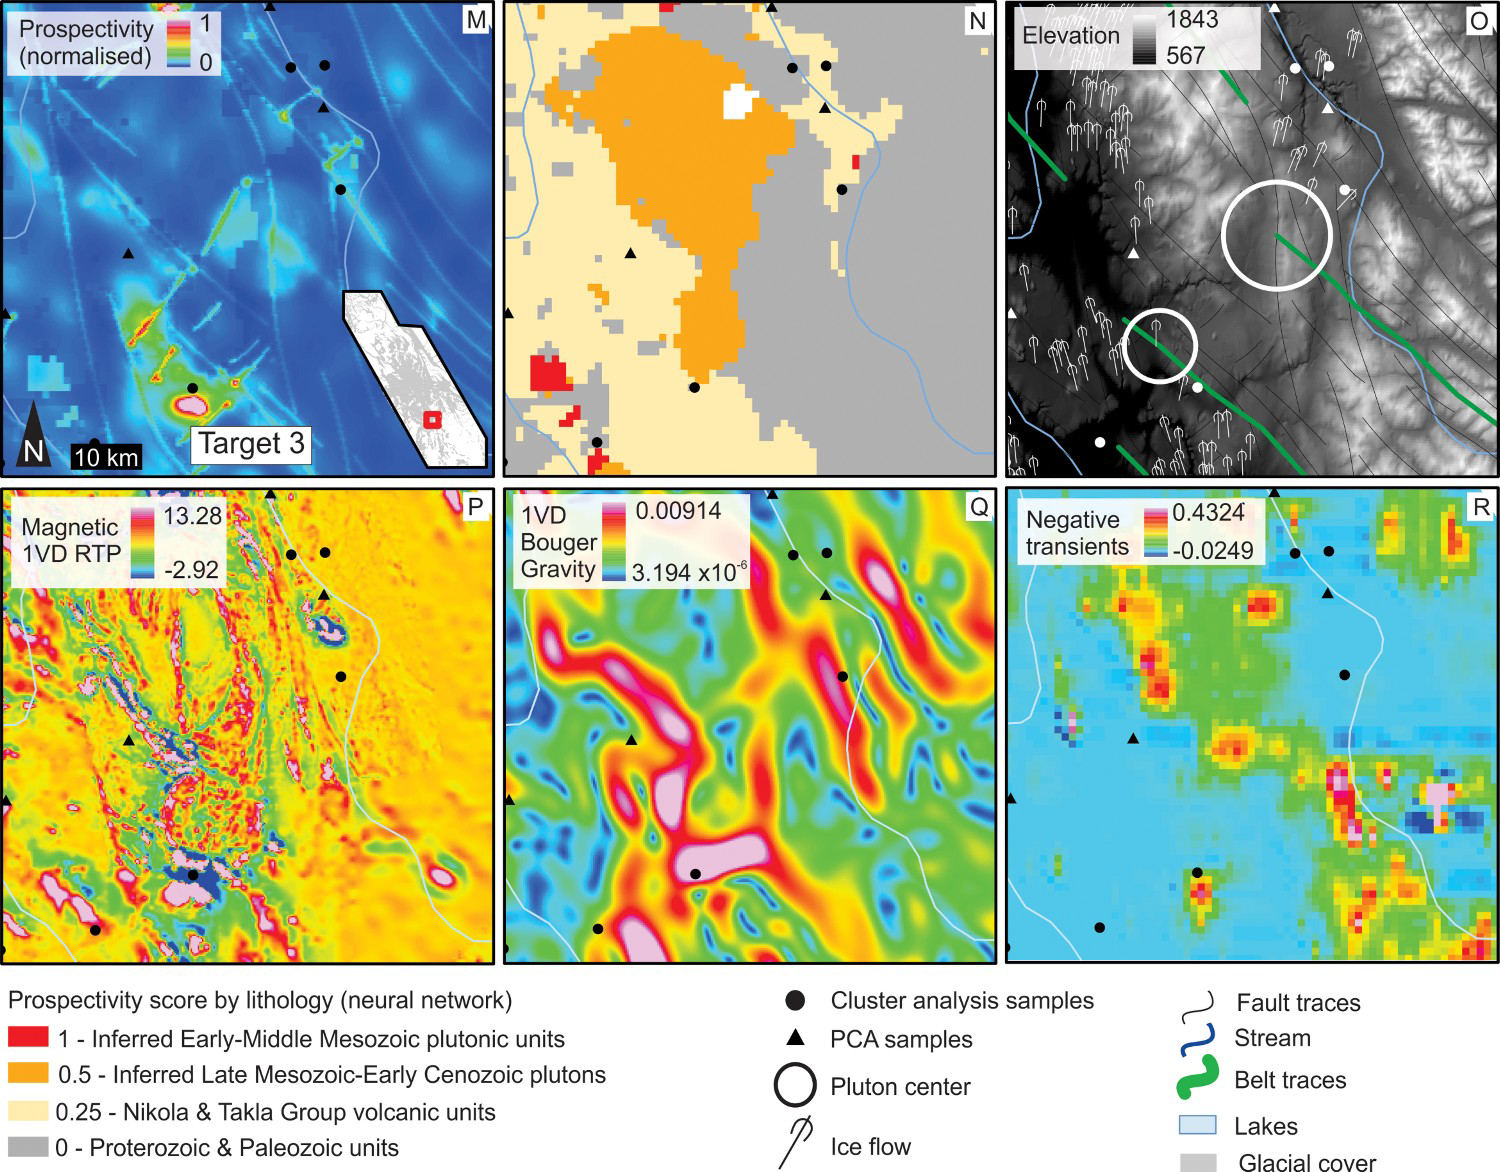
In many cases, geophysical datasets support interpreted layers such as fault traces since interpretations were created using geophysical grids as constraints, thereby introducing an internal dependance. However, in some cases, interpretations were made independently from geophysical datasets and still show strong spatial relationships to anomalous patterns in those datasets. For example, in Figure 9(P), there is a circular magnetic high that likely defines a magnetite-rich rim of a pluton. This magnetic pattern sits very near a projected pluton centre and, therefore, increases confidence that a pluton centre actually exists within the Target 3 region (Figure 9(G)).
Discussion
On strategies, bias, and model variability
Most knowledge-based prospectivity case studies begin with collected datasets such as field measurements or airborne geophysical surveys. From these, knowledge-based criteria (i.e. proxies for mineralisation) are derived using local geological knowledge and understanding of the targeted mineral system. Carranza and Hale (2001) use features (e.g. fault traces and intrusive contacts) extracted from regional maps, which represent integrated geological knowledge, for the Baguio gold mining district of the Philippines. Using these features, new proximity maps were generated to represent the distance to heat sources and fluid pathways while the orogenic mineral system was active. Almasi et al. (2017) used a similar approach by employing Au assays of stream sediments as well as airborne magnetic and radiometric surveys to interpret various components of an orogenic mineral system in the Saqez-Shardaht Goldfield, Iran. Knowledge-based criteria extracted from these datasets include density and proximity to faults, contacts, and prospective lithologies. Therefore, various datasets can be integrated into the MPM workflow, depending on the available datasets, their quality, and the level of confidence of the user(s) in utilising the data. MPM is most efficient when it is done in a team setting, with specialists from different geoscientific fields contributing their expertise (with as little bias as possible) so that appropriate weights can be assigned to model inputs.
The current study relied heavily on interpreted data sets and input weighting, both of which carry an inherent bias. Other methods currently used in the mining industry are purely data driven (e.g. big data), without direct implicit bias. There is abundant discussion in the literature with regards to the explicit vs. implicit end-members of modelling (Dubois et al. 1999; Porwal et al. 2003; Ford et al. 2016), from regional to deposit-scale perspectives. In summary, data-driven methods can be used to investigate subtle relationships across multi-disciplinary datasets and generate new hypotheses; however, their application is sometimes convoluted and requires many ‘success cases’ (i.e. areas of known mineralisation) to train algorithms. Additionally, it is often a mathematically complex operation and optimisation requires independent, uniformly distributed, survey style datasets. While these methods could have been applied in the Quesnel Terrane, knowledge-driven methods, we argue, are more appropriate given the present setting.
Limitations
The application of both data-driven and knowledge-based prospectivity results in a suite of models as settings, weighting factors, number of clusters, etc. are all optimised through iterative trial and error. The model presented here (Figure 8) represents our interpretation of an optimised model based on our knowledge of the data and the geological setting; however, varying weighting factors or using other operators to combine datasets will produce a range of models. Bias within datasets and weight attribution carries the risk of fitting observations to models, making models themselves too biased and generating false positives in terms of targets. This, can be mitigated by the utilisation of collected criteria in MPM (e.g. geophysics, geochemistry) and honest critical thinking, communication and exchanges between geoscientific experts in a team setting.
Consensus is also required with respect to how individual datasets are used in the workflow. For instance, interpolations of PCA and CA could have been added to the MPM to lend additional confidence to the final model. However, it was determined that using these geochemical criteria as an unbiased validation tool provided more value.
Expanding to 3D
Three-dimensional geological models can assist in validating or prioritising prospectivity targets (Schetselaar et al. 2013; Li et al. 2015; Xiao et al. 2015). Workflows used to create a 3D model, in both data-dense and data-sparse settings, also encourage familiarity with the available data (limitations, usefulness, relationships) as each set must be levelled and integrated.
With respect to the prospectivity of Quesnellia, Tschirhart et al. (2018) present an application of 3D geophysical inversion and downward continuation for the QUEST region. Subsurface geometry and dip-directions of units were determined using multi-scale edge analysis (‘worming’) applied to magnetic and gravity datasets, thereby enhancing the understanding of the regional architecture and mineral system.
Conclusion
Mineral Prospectivity Modelling (MPM) is a useful tool to highlight areas of interest in challenging exploration settings. Through integration of publicly available geophysical and geochemical datasets as well as geological knowledge, nine evidential layers representing prospective signals/features for porphyry Cu exploration were generated. These were then combined using a knowledge-driven prospectivity modelling approach to highlight targets for future exploration under glacial cover in the Quesnel terrane.
This method demonstrates a cost-effective approach to exploration in regions covered by thick glacial overburden, as it leverages publically available data and a simple workflow. Public datasets, now readily available in many jurisdictions, present an excellent and cost-effective opportunity for initial knowledge gathering and first-pass investigations prior to further expenditures related to ground truthing and deposit-scale surveys. Many startup companies and government agencies have implemented public datasets in their workflow, from compilation of regional-scale datasets (e.g. Sánchez et al. 2015; Brouillette et al. 2019) to advanced integrative techniques utilising big data analytics (Harris et al. 2015; Lulin 2018). With new technologies and continued advances in computing power, the possibilities and impact for first-pass exploration with public datasets should continue to grow.
MPM is effective when performed in a team setting, with experts from different geoscientific fields contributing their expertise so that appropriate weights were assigned to model inputs. Indeed, the method's proper implementation relies on the collaboration of experts working together in an open forum, within a common model. Development of integrative techniques, such as the one presented here, is key to unlocking the untapped mineral potential of non-traditional exploration settings.
Footnotes
Acknowledgements
This work represents a product of the winning submission for the 2017 Frank Arnott Award (Tschirhart et al. 2018; FAA ![]() ); the authors wish to thank the Award organizing committee for the opportunity to conduct this unique collaborative project. The work stands on the shoulders of the many geoscientists the British Columbia Geological Survey and Geoscience BC who had the vision for the Quesnellia Exploration Strategy and carried it out. We also acknowledge and thank numerous experts and mentors that guided our team throughout this project: Eric De Kemp, Jim Craven, Alain Plouffe, Christopher Lawley, Alexandre Zagorevski, Yao Cui, and Mike Hillier. Stéphane Perrouty also provided invaluable guidance and suggestions during the writing and review process. Finally, we thank two anonymous reviewers for thoughtful comments that improved the quality and clarity of this manuscript, as well as Simon Jowitt for additional comments and editorial handling.
); the authors wish to thank the Award organizing committee for the opportunity to conduct this unique collaborative project. The work stands on the shoulders of the many geoscientists the British Columbia Geological Survey and Geoscience BC who had the vision for the Quesnellia Exploration Strategy and carried it out. We also acknowledge and thank numerous experts and mentors that guided our team throughout this project: Eric De Kemp, Jim Craven, Alain Plouffe, Christopher Lawley, Alexandre Zagorevski, Yao Cui, and Mike Hillier. Stéphane Perrouty also provided invaluable guidance and suggestions during the writing and review process. Finally, we thank two anonymous reviewers for thoughtful comments that improved the quality and clarity of this manuscript, as well as Simon Jowitt for additional comments and editorial handling.
Disclosure statement
No potential conflict of interest was reported by the authors.