
Abstract
The composite microhardness (SCH) and composite fracture toughness (SCFT) of seven sinter samples were calculated utilising the modal proportion of distinct particle textural types, ‘sinter microtypes’ (SM). Ten SM were defined based on phase association, phase texture and particle texture. The SCH/SCFT of each microtype was calculated by defining an idealised composition and utilising the mean microhardness/fracture toughness of different textural forms of common sinter phases. Comparison of SCH and SCFT with sinter metallurgical indices and major element chemistry showed relatively stronger linear correlations with the latter. Modifying the idealised compositions of SM to calculate SCH/SCFT did not notably change correlations with sinter RDI, RI, TI. Calculating SCH/SCFT by weighting the input of SM variably improved correlations with sinter RDI, RI, TI. Providing additional weighting to nuclei/primary phase-bearing SM provided the best correlation with RDI and RI, whereas additional weighting to bonding phase-bearing SM provided the best correlation with TI.
Introduction
Determining macro-scale Fe ore sinter metallurgical properties based on the micro-scale properties of its constituent phases has been attempted for several decades (e.g. Shigaki et al. 1986; Loo et al. 1988; Loo and Bristow 1994; Yang and Loo 1997; Ying et al. 2006; Sinha and Ramna 2009; Silva et al. 2016; Sinha et al. 2017). These studies have utilised microindentation testing on the most abundant sinter phases (hematite, magnetite, silico-ferrite of calcium and aluminium – SFCA – and glass) to determine mean microhardness and fracture toughness. This micro-scale approach has the advantage that it does not require the need for large-scale physical test work and can be potentially conducted automatically by optical image analysis, if a database of mean microhardness and fracture toughness has been established for common sinter phases/textures.
This study aimed to build on a previous publication which calculated sinter composite microhardness (SCH) and sinter composite fracture toughness (SCFT) using the modal abundance of common sinter phases and textural sub-types (Peterson 2019, 2021). That study then examined the relationship between SCH/SCFT and sinter metallurgical indices and major element chemistry.
Alternatively, this study utilised a particle-based approach to determine if it could produce metallurgically-meaningful calculated SCH and SCFT from the same crushed pot grate sinter samples. A similar approach for lump Fe ore particles demonstrated correlations between ore composite microhardness and composite fracture toughness and ore Tumble Index (TI) and major element chemistry (Peterson 2022).
For this study, crushed sinter particles were allocated to one of ten different ‘sinter microtypes’ during manual point counting. Sinter microtypes were defined based on distinct phase abundance, association and phase textures commonly observed in fluxed pot grate sinter produced from blended Fe ore fines. The mean microhardness and fracture toughness of each sinter microtype (SM) was calculated based on an idealised phase/textural association.
Methodology
Samples
Seven pot grate sinter samples (designated P1 to P7), produced from single Australian Fe ores or ore blends, were utilised for the analysis. The samples were roll-crushed and dry screened to −2 mm. The sinter samples all included high proportions of the three main sinter phases: hematite (∼34–50%), magnetite (∼20–29%) and SFCA (∼21–36%). Further details of the samples are given in Peterson (2019, 2021).
Sinter textural classification
An attempt was made to characterise the composite microhardness (CH) and composite fracture toughness (CFT) of the crushed sinter samples on a particle basis. This approach has also been utilised for lump iron ore by calculating CH and CFT for particle material types (ore groups) with distinct metallurgical properties (Peterson 2022). It has the potential advantage, over a phase-based approach, of being able to better model bulk material physical properties based upon the mineralogical, textural and physical properties of constituent ore particles subjected to a downstream process (i.e. the unit inputs).
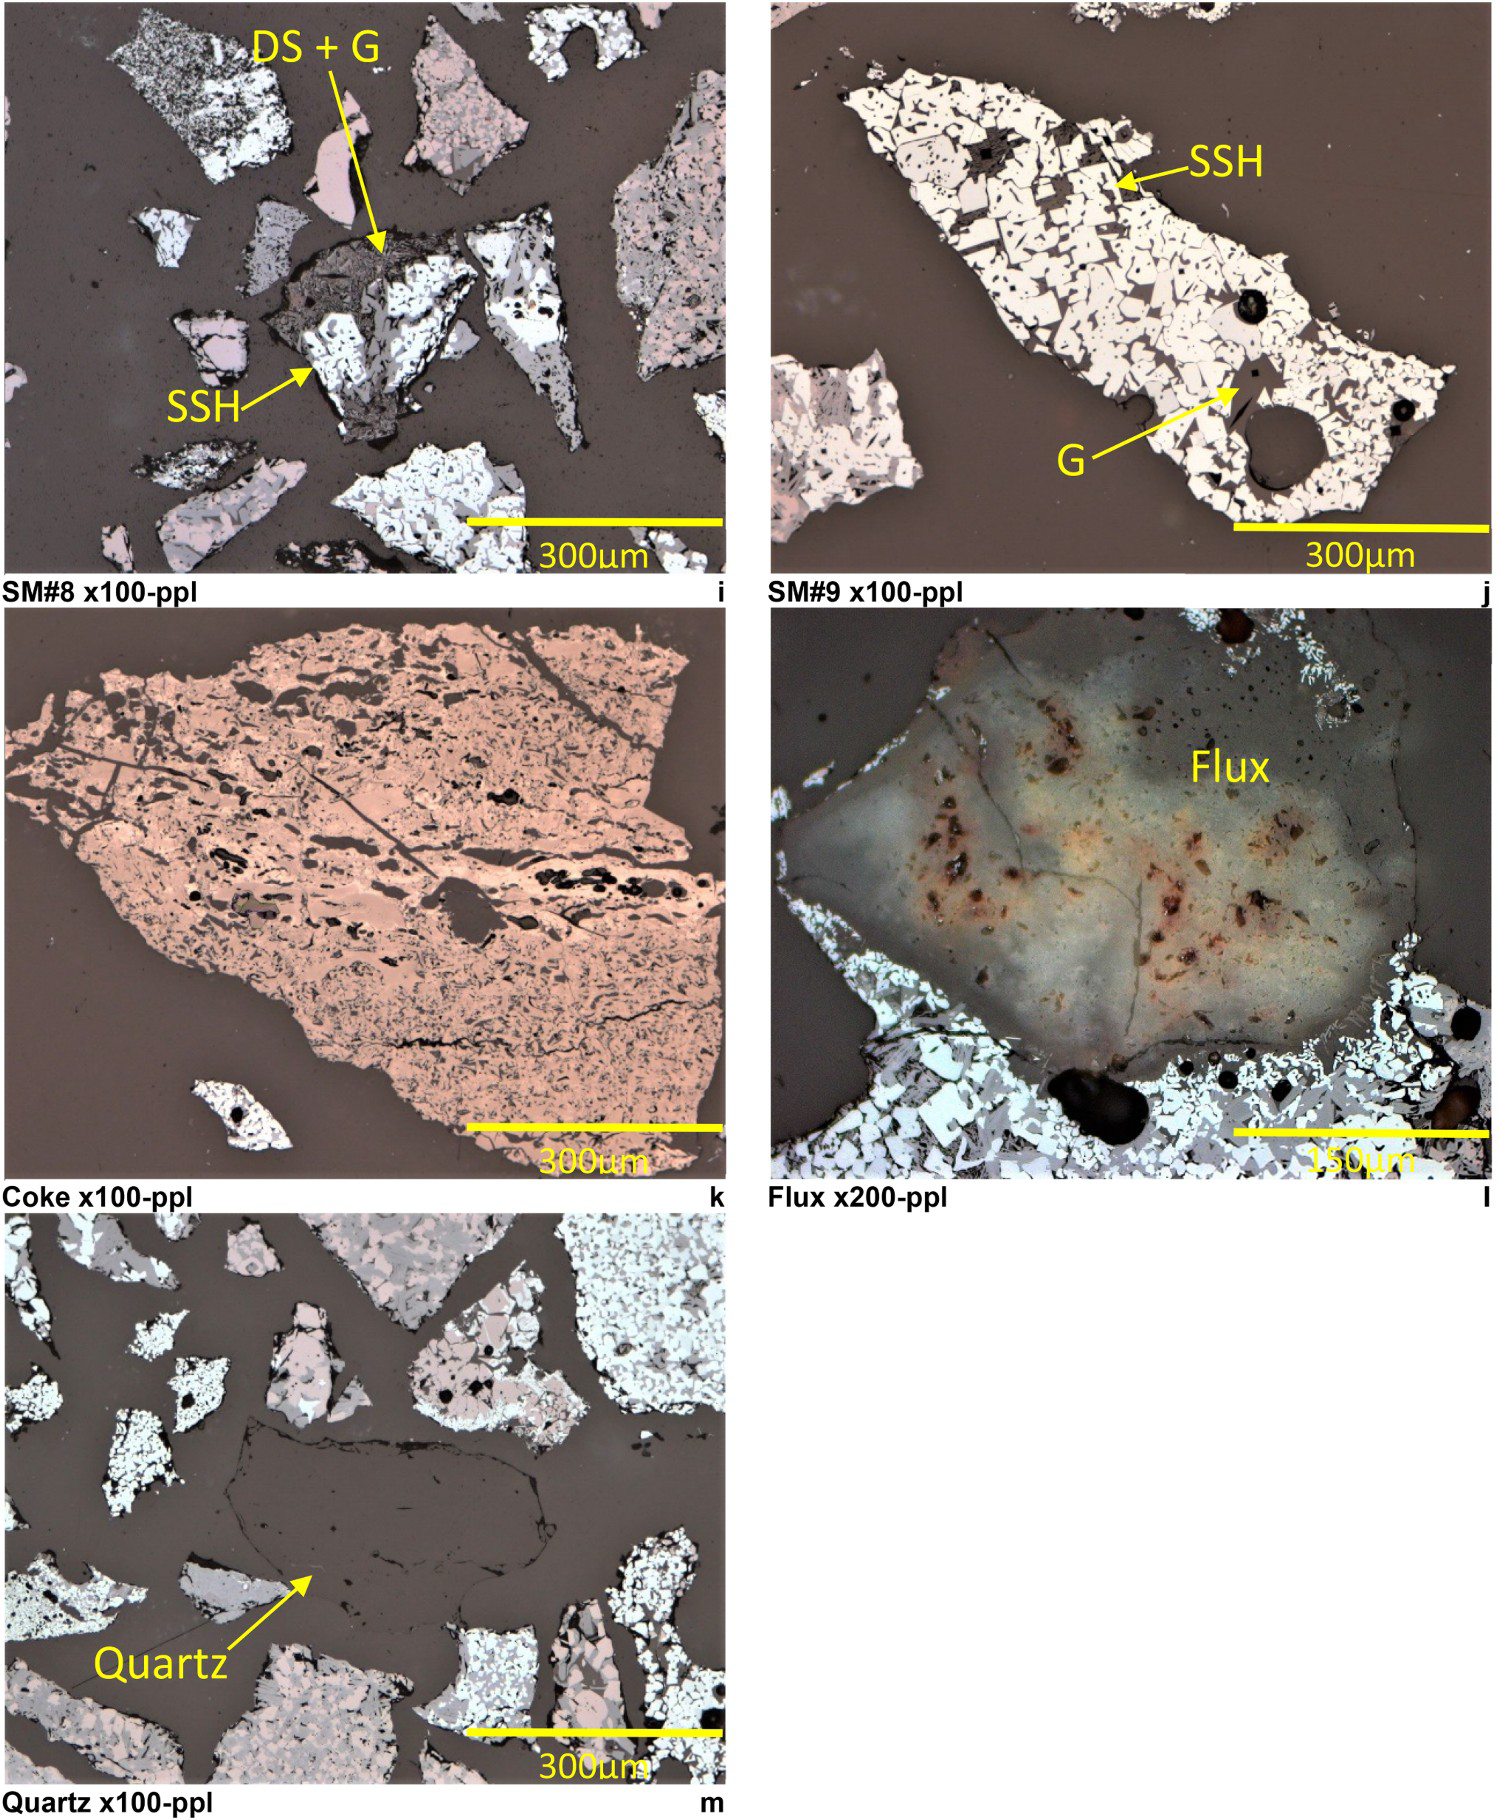
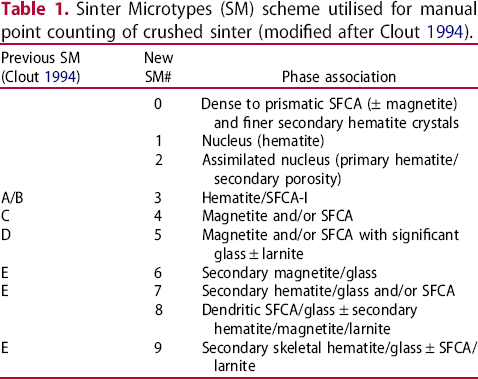
As this approach had not been previously undertaken for sinter, a sinter microtypes (SM) scheme was devised for use in manually point counting the sinter samples on a particle (rather than phase) basis (Table 1). This scheme was based upon a nascent scheme (SM ‘A’ to ‘E’) by Clout (1994). These categories were adapted, and additional categories were added, to reflect the range of sinter particle textures/associations, either stable nuclei or melt-precipitated, now commonly observed in fluxed sinter (Figure 1). Where a larger particle exhibited one or more SM, the particle was assigned to the dominant SM present.
Representative reflected light optical photomicrographs of sinter microtype texture and phase associations (Key to phase labels: NH – nucleus hematite; PH – primary hematite; SH – secondary hematite; SSH – secondary skeletal hematite; M – magnetite; S – SFCA; S1 – SFCA1; DS – dendritic SFCA; G – glass, L – larnite, ppl - plane polarised light). * NB. Flux particle not from the studied sinter samples. Continued Sinter Microtypes (SM) scheme utilised for manual point counting of crushed sinter (modified after Clout 1994).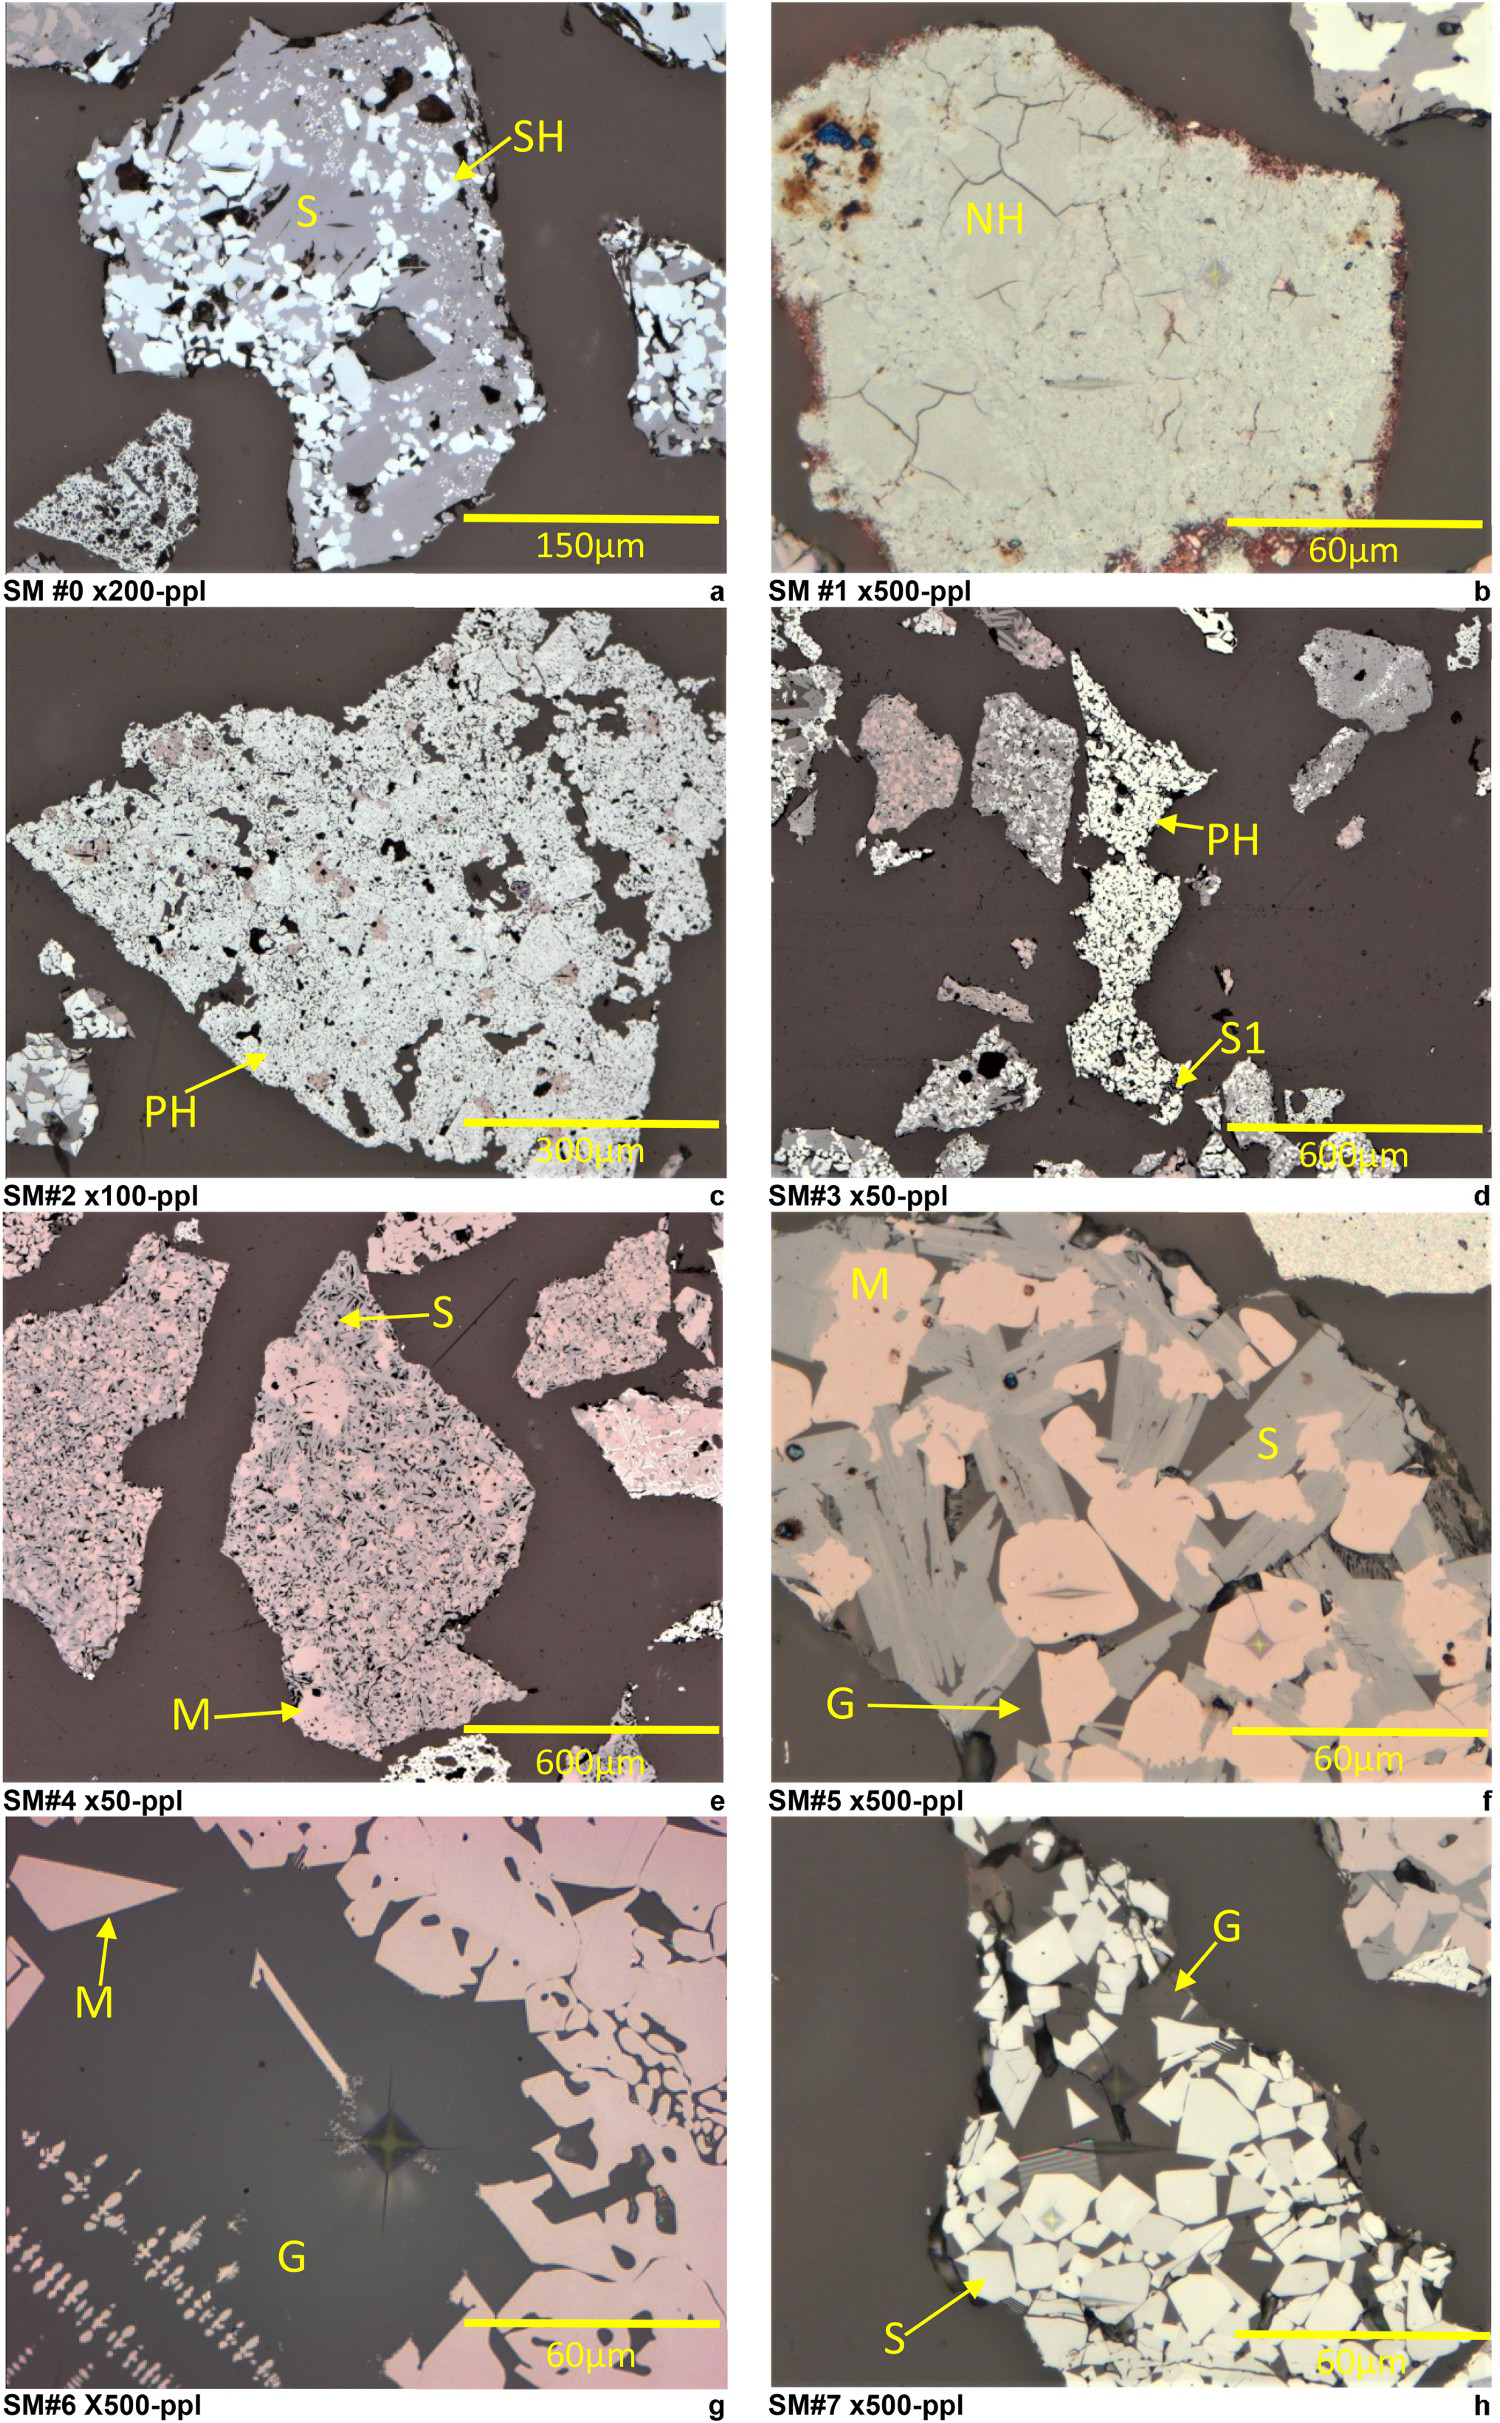
Microidentation testing
Microhardness and fracture toughness data for different sinter phases and phase textures was obtained by microindentation testing using a Durascan-20 microhardness testing machine. Further details of the methodology are provided in Peterson (2019, 2021).
The mean Vickers microhardness (HV), Knoop microhardness (HK) and fracture toughness (FT) for each defined textural type was obtained for each sinter microtype. Note some categories only contained a few (1 - 5) values. Thus, the mean value of each textural type was also calculated from the mean of all SM. This data was then used to calculate the CH and the CFT for each SM by assigning it an idealised textural composition.
The CH and CFT of each sinter plug was calculated by multiplying the SM-CH or SM-CFT by its modal abundance (in wt.%), summing the values for each SM and then dividing by 100. The CH/CFT of each sinter plug was then compared to sinter plug Reduction Degradation Index (RDI), Reducibility Index (RI), Tumble Index (TI), Fe-total, FeO, SiO2, Al2O3, CaO and sinter basicity (CaO + MgO)/(SiO2 + Al2O3).
Results
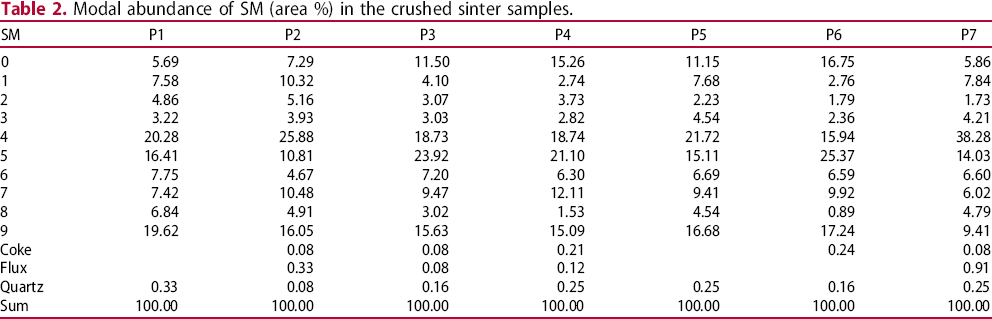
Modal abundance of SM (area %) in the crushed sinter samples.
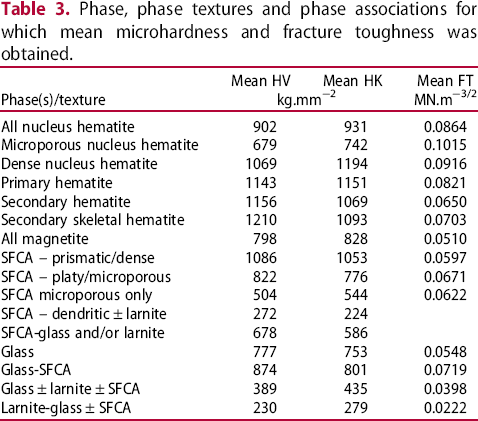
Phase, phase textures and phase associations for which mean microhardness and fracture toughness was obtained.
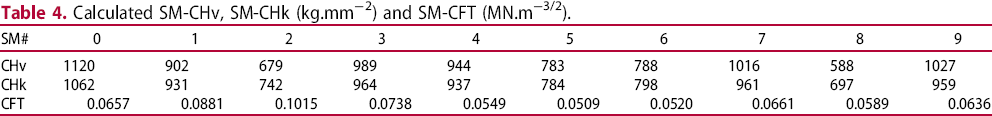
Calculated SM-CHv, SM-CHk (kg.mm−2) and SM-CFT (MN.m−3/2).
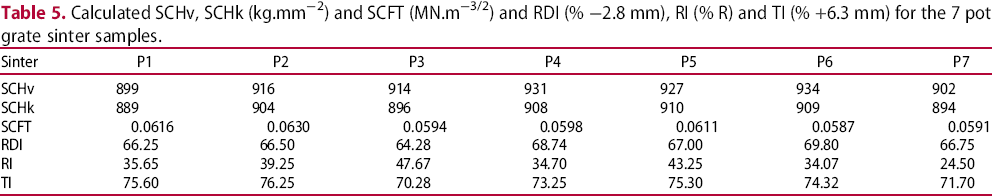
Calculated SCHv, SCHk (kg.mm−2) and SCFT (MN.m−3/2) and RDI (% −2.8 mm), RI (% R) and TI (% +6.3 mm) for the 7 pot grate sinter samples.
Sinter phase FT with sinter microtype
Sinter phase FT (e.g. hematite) by sinter microtype was compared to examine the nature and extent of any trends. Note that not every sinter phase (or textural form) is present in every sinter microtype and that some data sets included very few points. Note also, that some phases were identified in SMs for which they are not defined (e.g. hematite in SM#4), where sinter particles had two or more distinct textural domains (Figure 2). Outlying values often relate to a single data point.
Plot of mean hematite FT (a), SFCA FT (b) and magnetite FT-glass FT (c) by sinter microtype (hem – hematite, N.H. – Nucleus Hematite, d – dense, mp – microporous, P.H. – Primary Hematite, S.H. – Secondary Hematite, S.S.H. – Secondary Skeletal Hematite, pr/d – prismatic/dense, pl/mp – platy/microporous, mag – magnetite).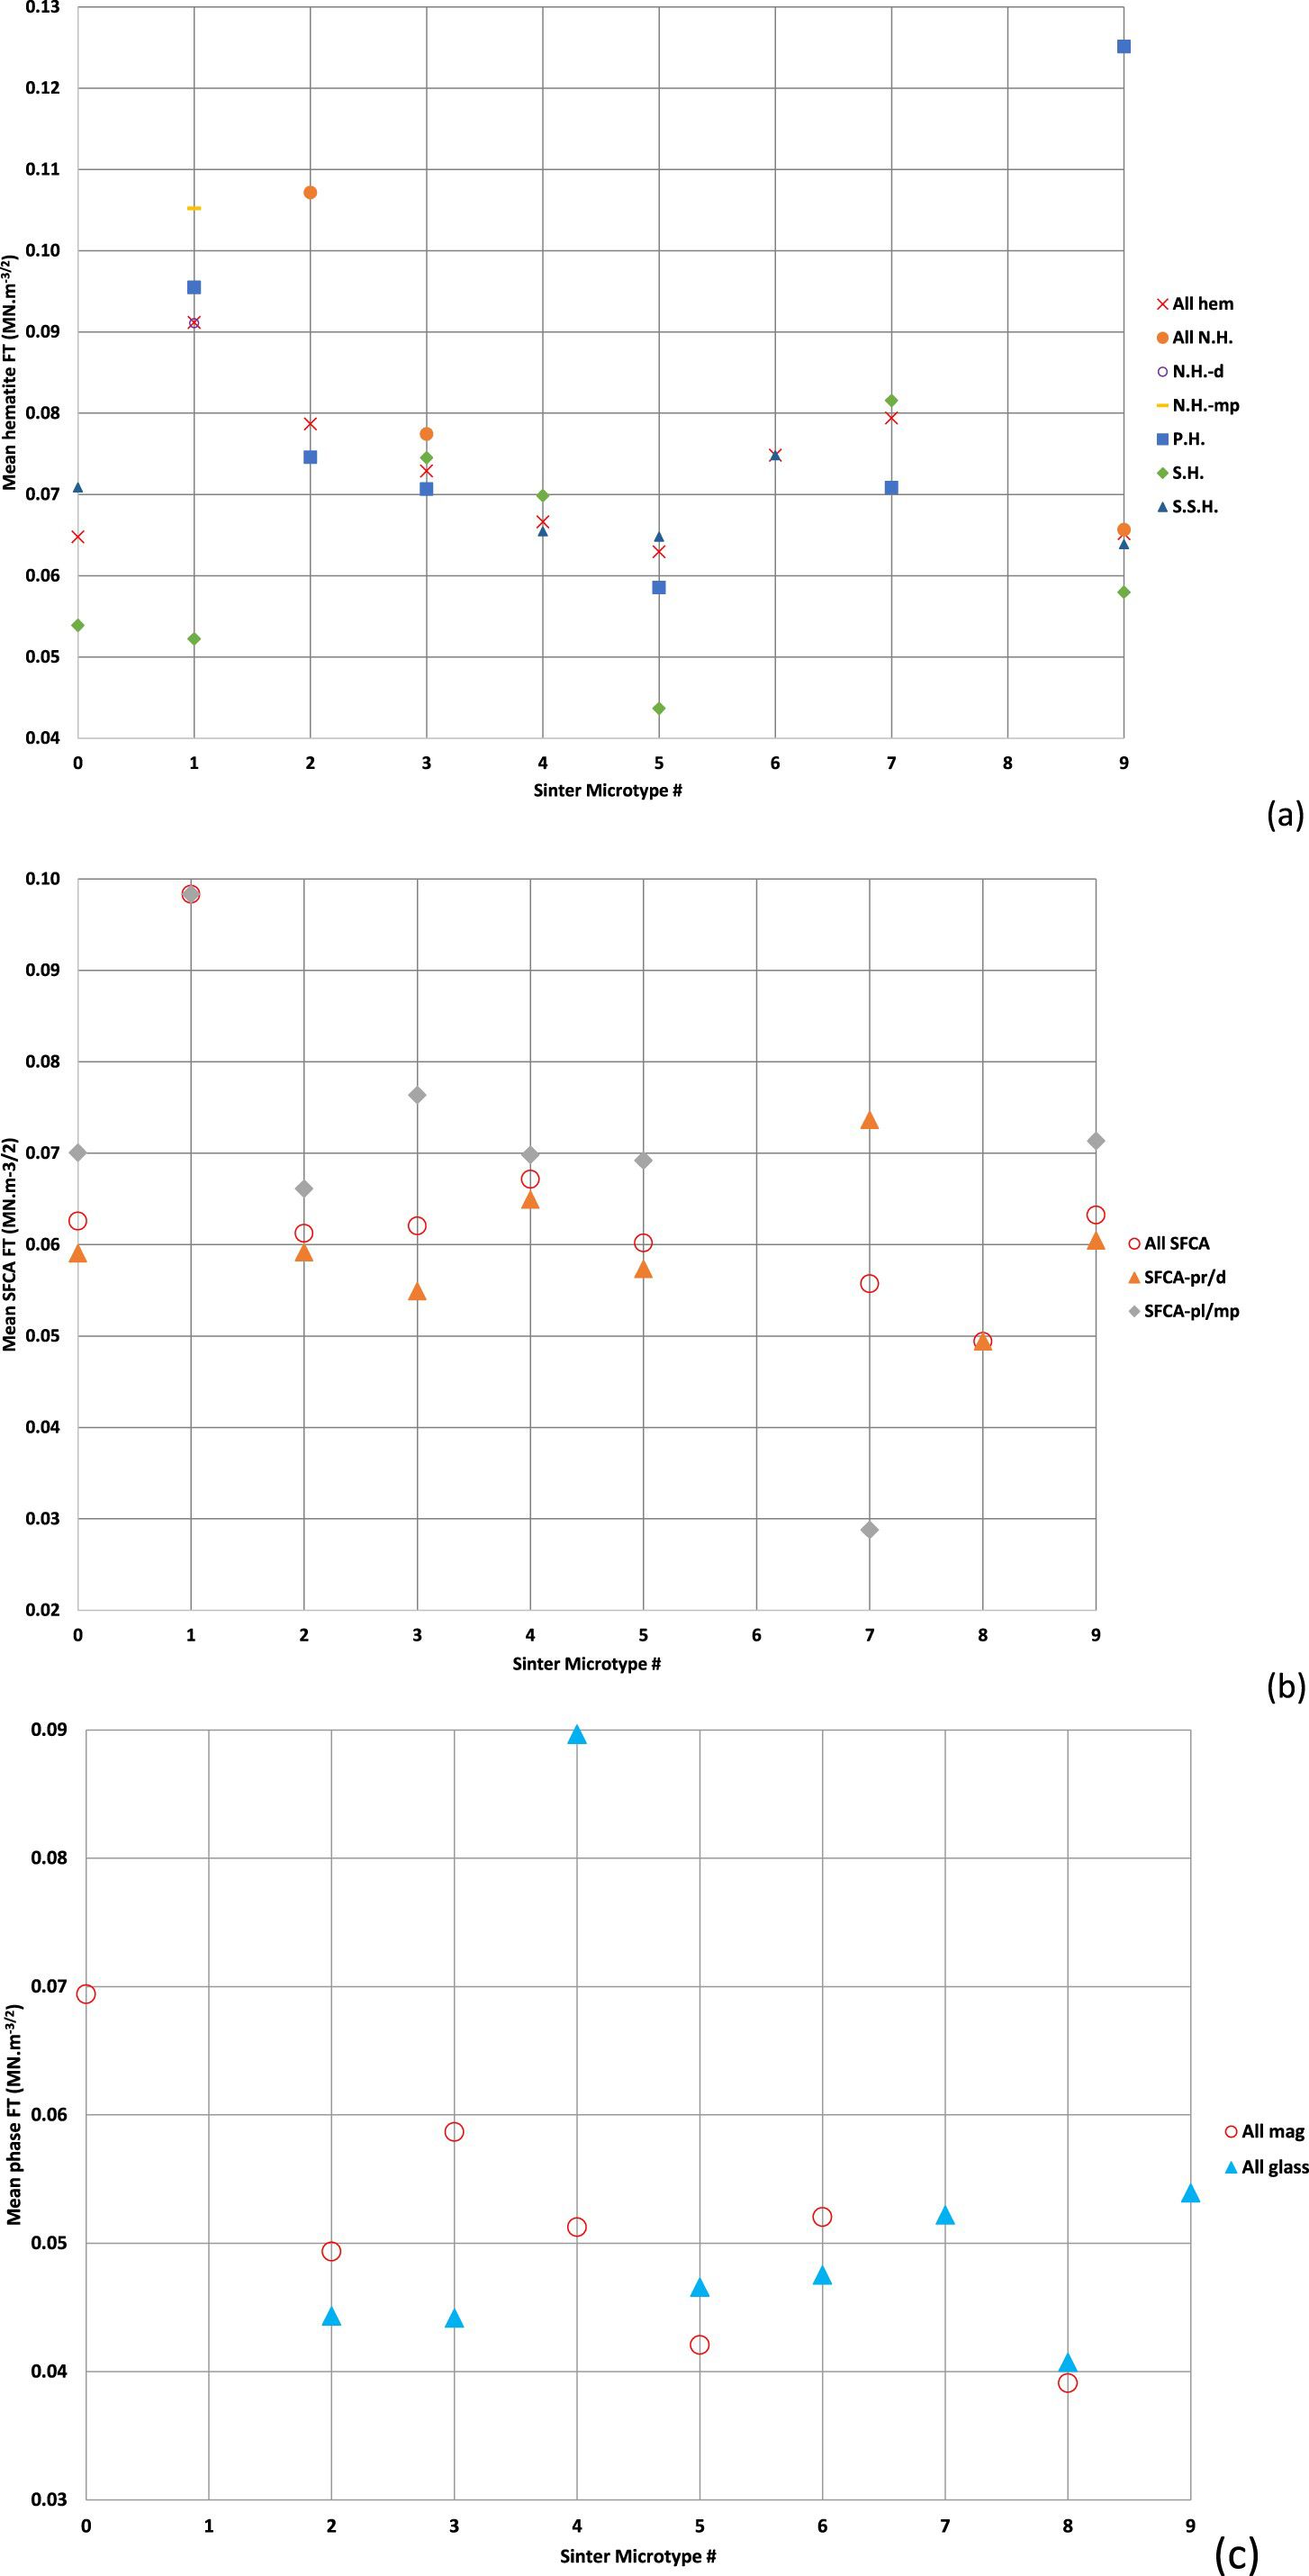
When grouped together regardless of textural form, the FT of sinter hematite decreased from SM#1 to SM#5 (Figure 2(a)). Primary hematite showed a similar trend. This trend reflects the influence of nucleus hematite and to some extent primary hematite with relatively higher FT in SM# 1–3. The reason for the higher FT of these forms of hematite most probably relates to the effect that phase microporosity and grain boundary contacts can play in impeding brittle fracture propagation (e.g. Dukino et al. 1995, 1996). Mean SFCA FT was similar across the different sinter microtypes (Figure 2(b)). Mean FT for platy/microporous SFCA was more variable, most probably reflecting the inherent variability of this texture. Mean glass FT was similar (with one outlying value) across the different sinter microtypes (Figure 2(c)). Mean magnetite FT was more variable, reflecting the relative proportions of secondary and secondary skeletal magnetite (the latter tending to have relatively higher FT).
Relationship of SCHv, SCHk and SCFT
As expected, there was a strong linear correlation between SCHv and SCHk (R2 = 0.88). This indicates that SCH calculated from the different methods of measuring indentation microhardness is capturing similar sinter phase and overall sinter properties. However, there was no correlation between SCHv and SCFT (R2 = 0.068) or between SCHk and SCFT (R2 = 0.002). This suggests that sinter composite fracture toughness calculated from Vickers indent-associated cracking is capturing sinter properties distinct from those captured by indentation microhardness. This is clearly different from observations on lump Fe ore, where composite microhardness and composite fracture toughness calculated using a particle-based method exhibited a strong linear correlation (R2 = 0.85; Peterson 2022).
Relationship of SCH/SCFT to sinter metallurgical indices
Correlations between SCHv and sinter metallurgical indices were generally similar to those between SCHk and sinter metallurgical indices, but SCHv usually exhibited relatively stronger correlations. Plots of SCHv/k and SCFT against sinter RI and TI are shown in Figures 3 and 4 respectively. As for SCHv/k or SCFT calculated using sinter phase abundance (Peterson 2019), sinter CH/CFT calculated from sinter microtype abundance often grouped into higher (orange ellipse – Figure 3(a)) and lower (green ellipse) CH/CFT subsets.
Plots of calculated SCHk vs sinter RI (a) and SCHv vs TI (b). Plots of calculated SCFT vs sinter metallurgical indices: (a) RI and (b) (TI).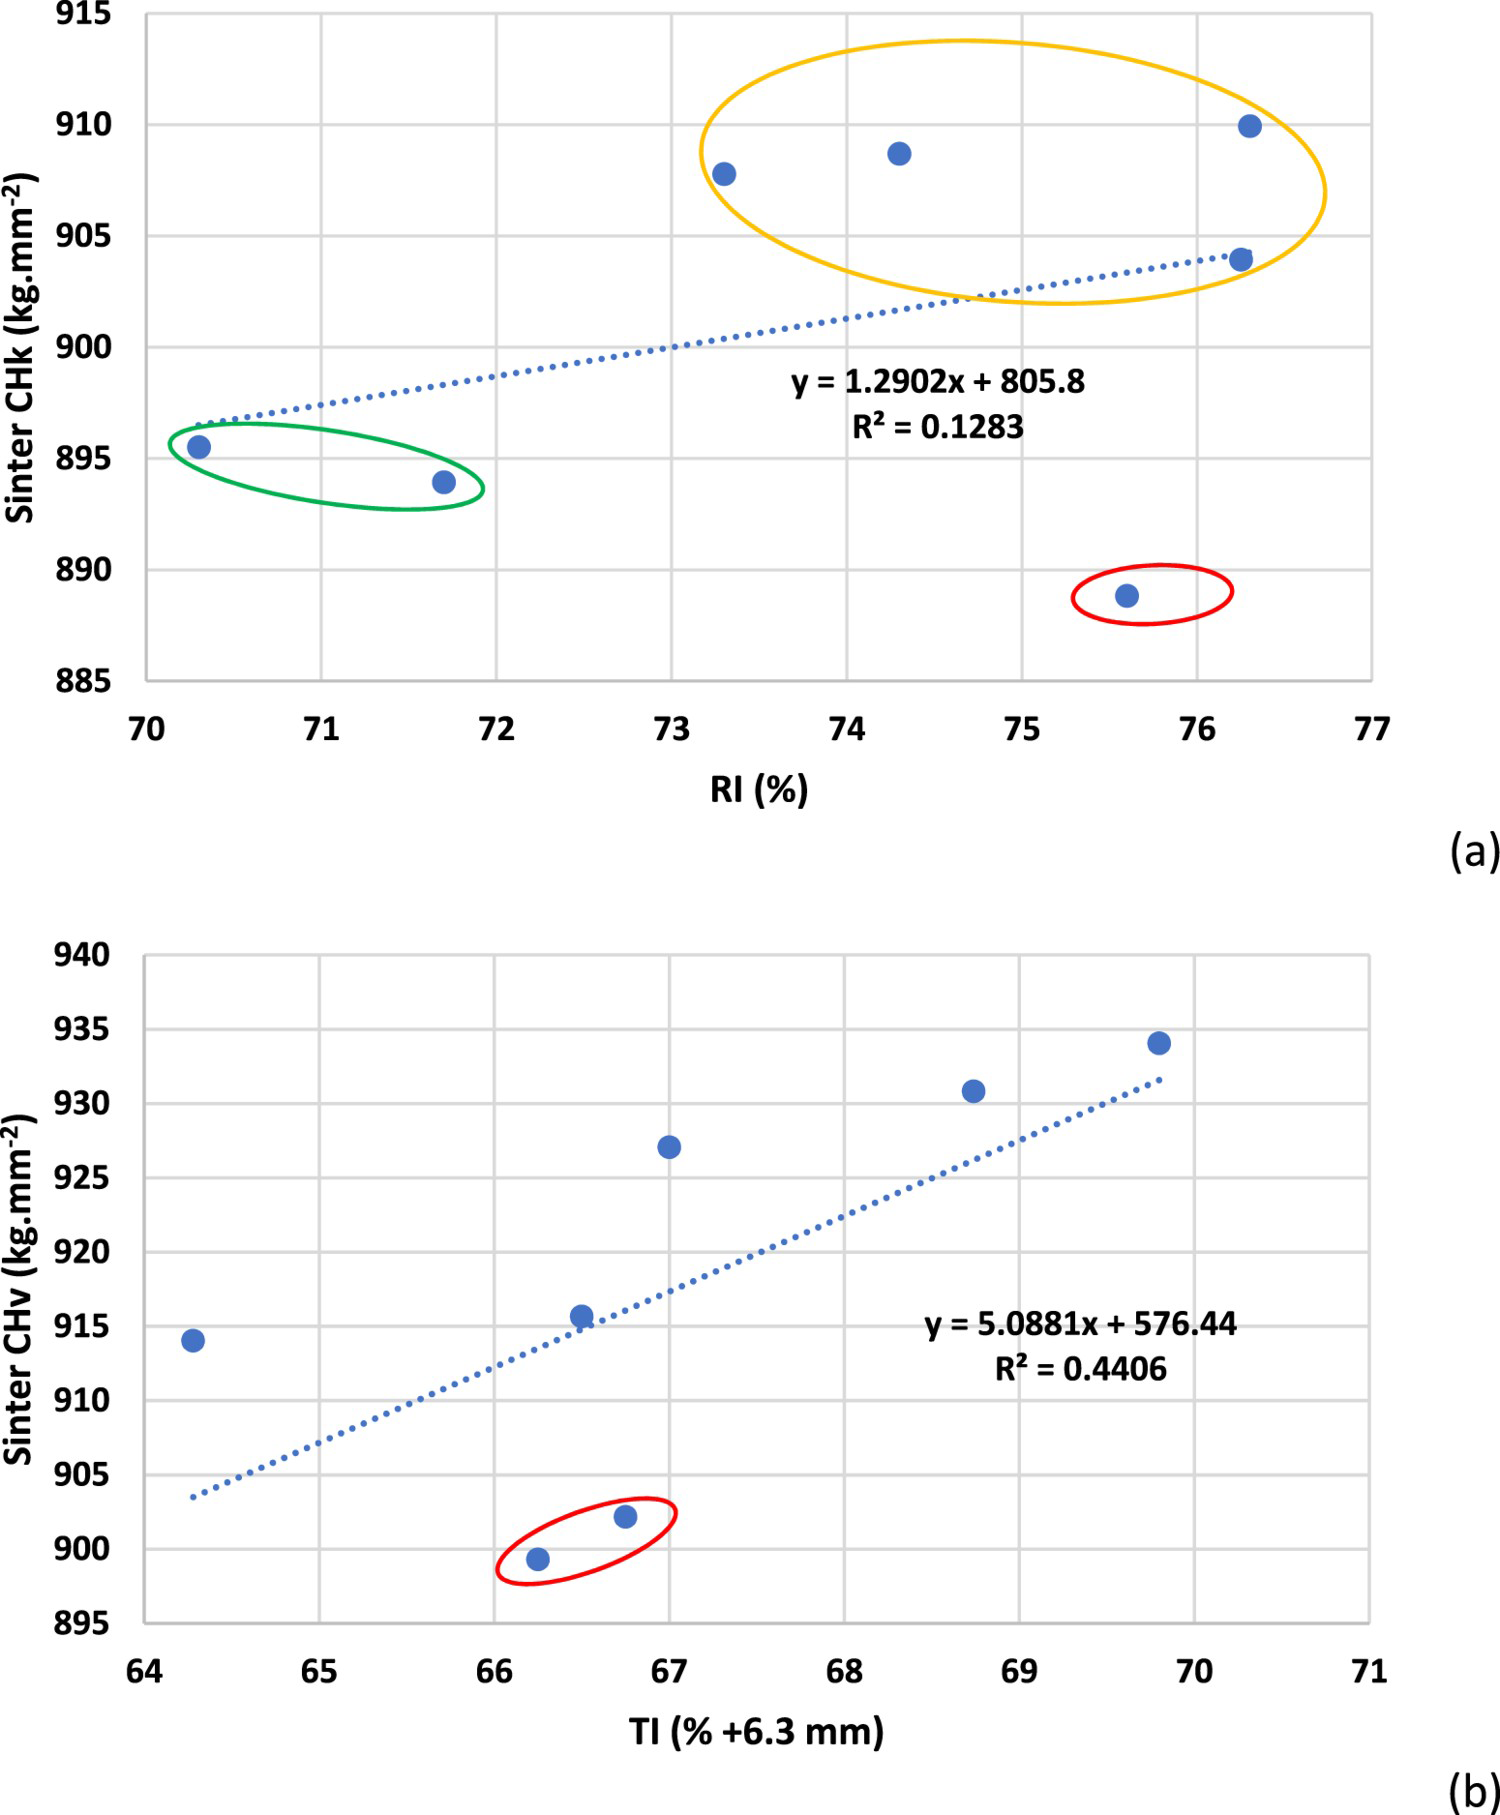
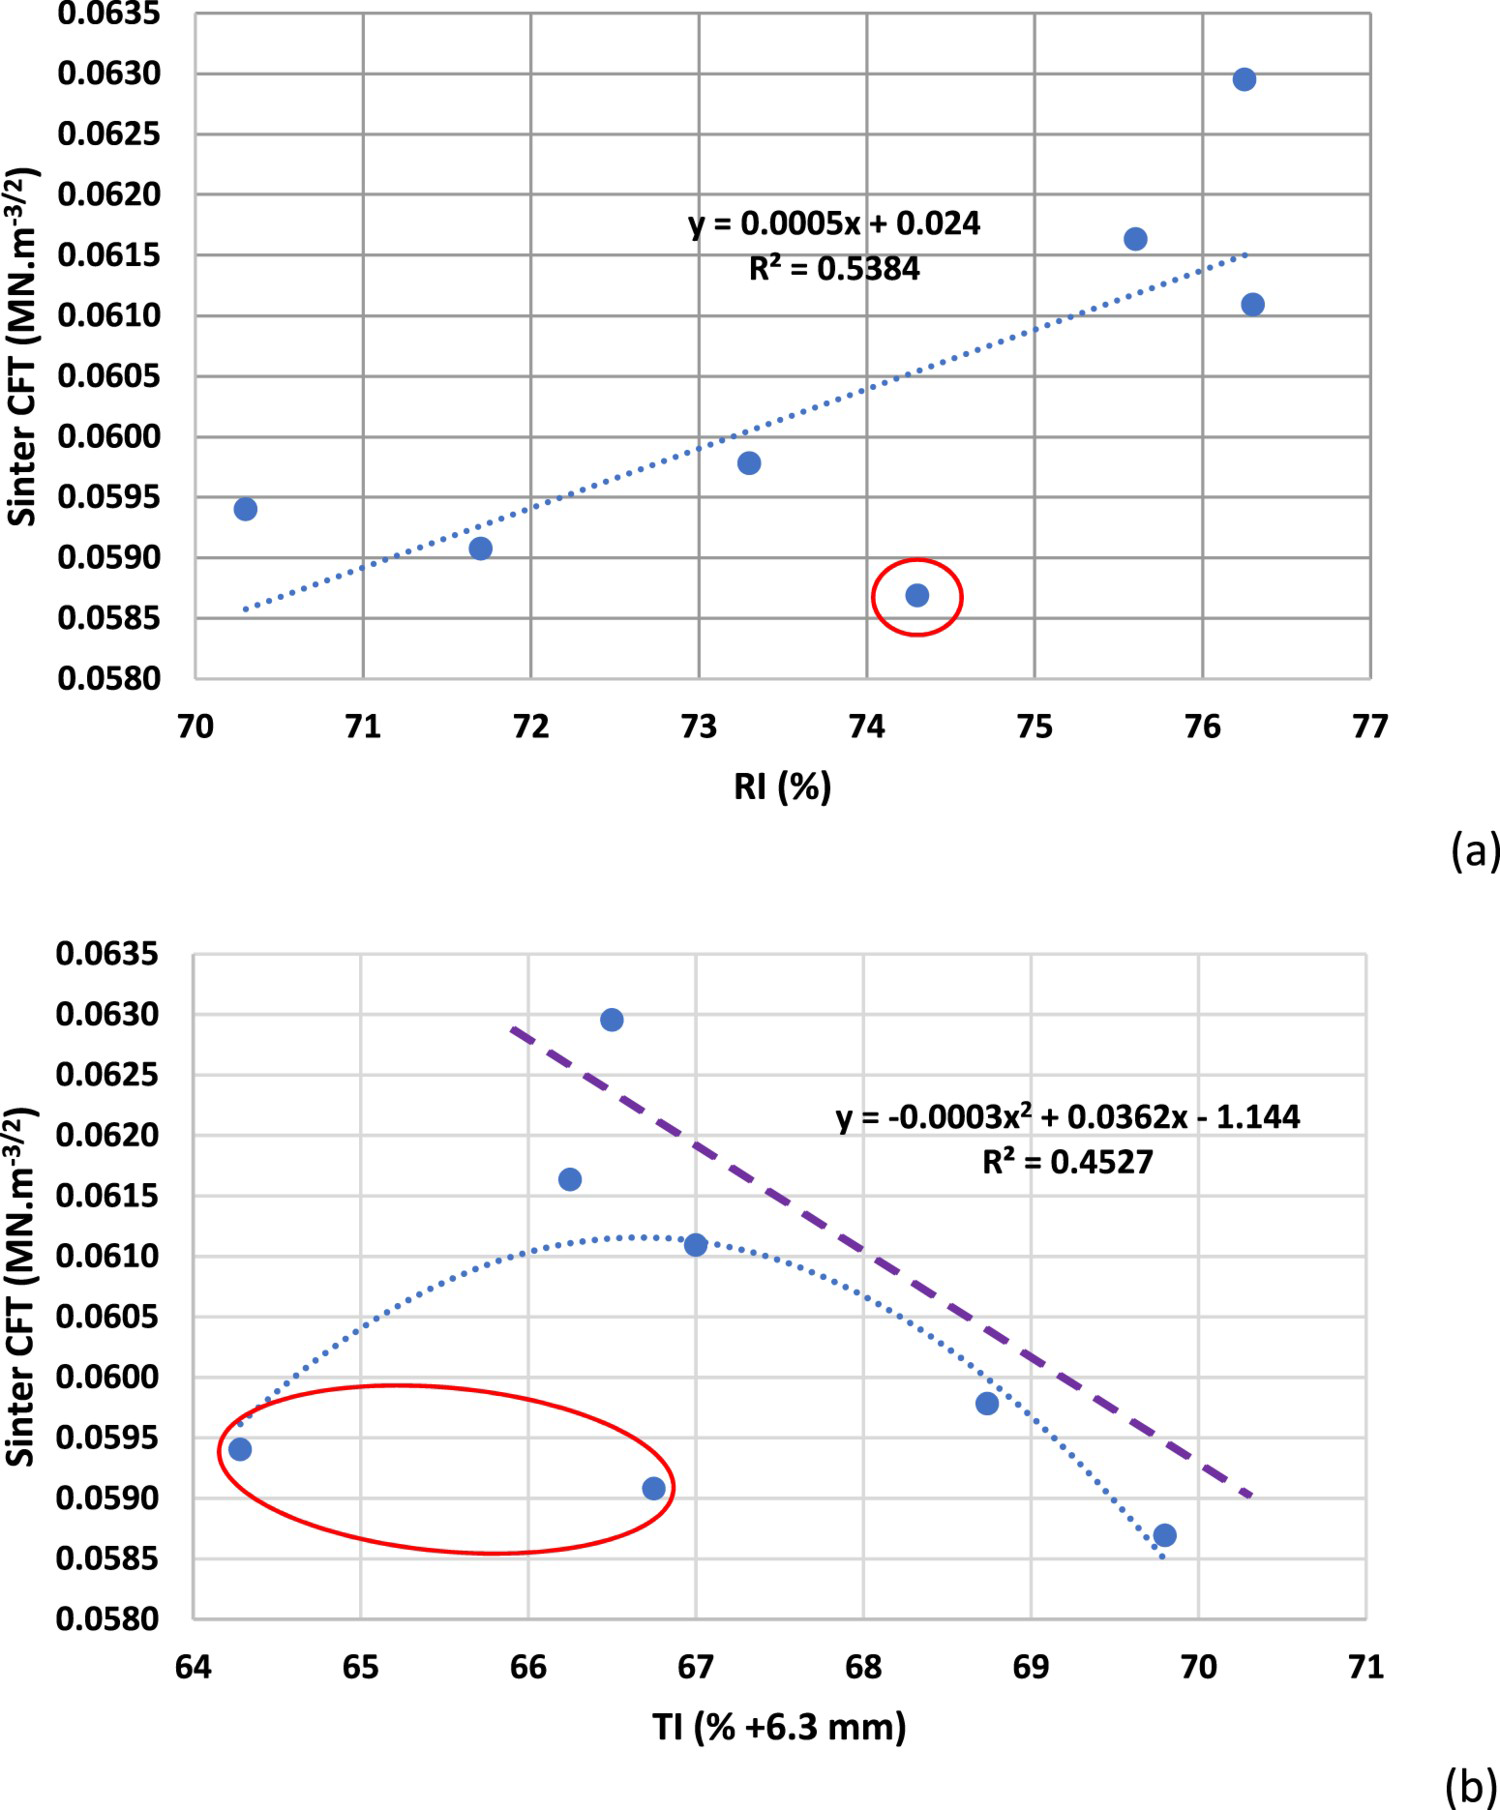
Linear correlations for SCHv/k with RI and TI were weak to modest and variable, generally due to the presence of 1–2 outlying data points (shown within the red ellipses in Figures 3 and 4). For example, R2 for RI and TI increased to 0.61 and 0.85 respectively, if the outlying values were excluded. Outlying values were typically those with lower or the lowest sinter CH/CFT. CHv/k and CFT exhibited linear correlations of opposite sign with TI, i.e. TI tended to increase with increasing CHv but decrease with increasing CFT (dashed purple line in Figure 4(b)). When calculated based on sinter phase abundance (Peterson 2019), SCH/SCFT exhibited negative correlations with sinter RI and positive correlations with sinter TI.
SCHv/k and SCFT did not show linear correlations with sinter RDI (R2 ≤ 0.1). However, if 2 outlying values were omitted, a modest negative linear correlation was evident, with R2 increased to 0.55 for SCHv and 0.45 for SCHk. A modest positive correlation (R2 = 0.4) was evident between SCFT and sinter RDI if 1 outlying value was omitted. When calculated on the basis of sinter phase abundance (Peterson 2019), SCH/SCFT exhibited negative correlations with sinter RDI.
Relationship of SCH/SCFT to sinter major element chemistry
Plots of SCHv and SCFT against sinter major element chemistry are shown in Figures 5 and 6 respectively. Again, SCHk exhibited similar correlations to SCHv, but with lower R2 values. CaO data grouped into higher (orange ellipse) and lower (green ellipse) SCH subsets with one outlying value (Figure 5(b)). Sinter CHv/k decreased with increasing sinter basicity (Figure 5(c)), but this was not evident for sinter CFT.
Plots of calculated SCHv vs sinter major element chemistry: (a) Al2O3 (b) CaO and (c) (CaO + MgO)/(SiO2 + Al2O3). Plots of calculated SCFT vs sinter major element chemistry:(a) SiO2, (b) FeO, (c) Al2O3 and (d) CaO.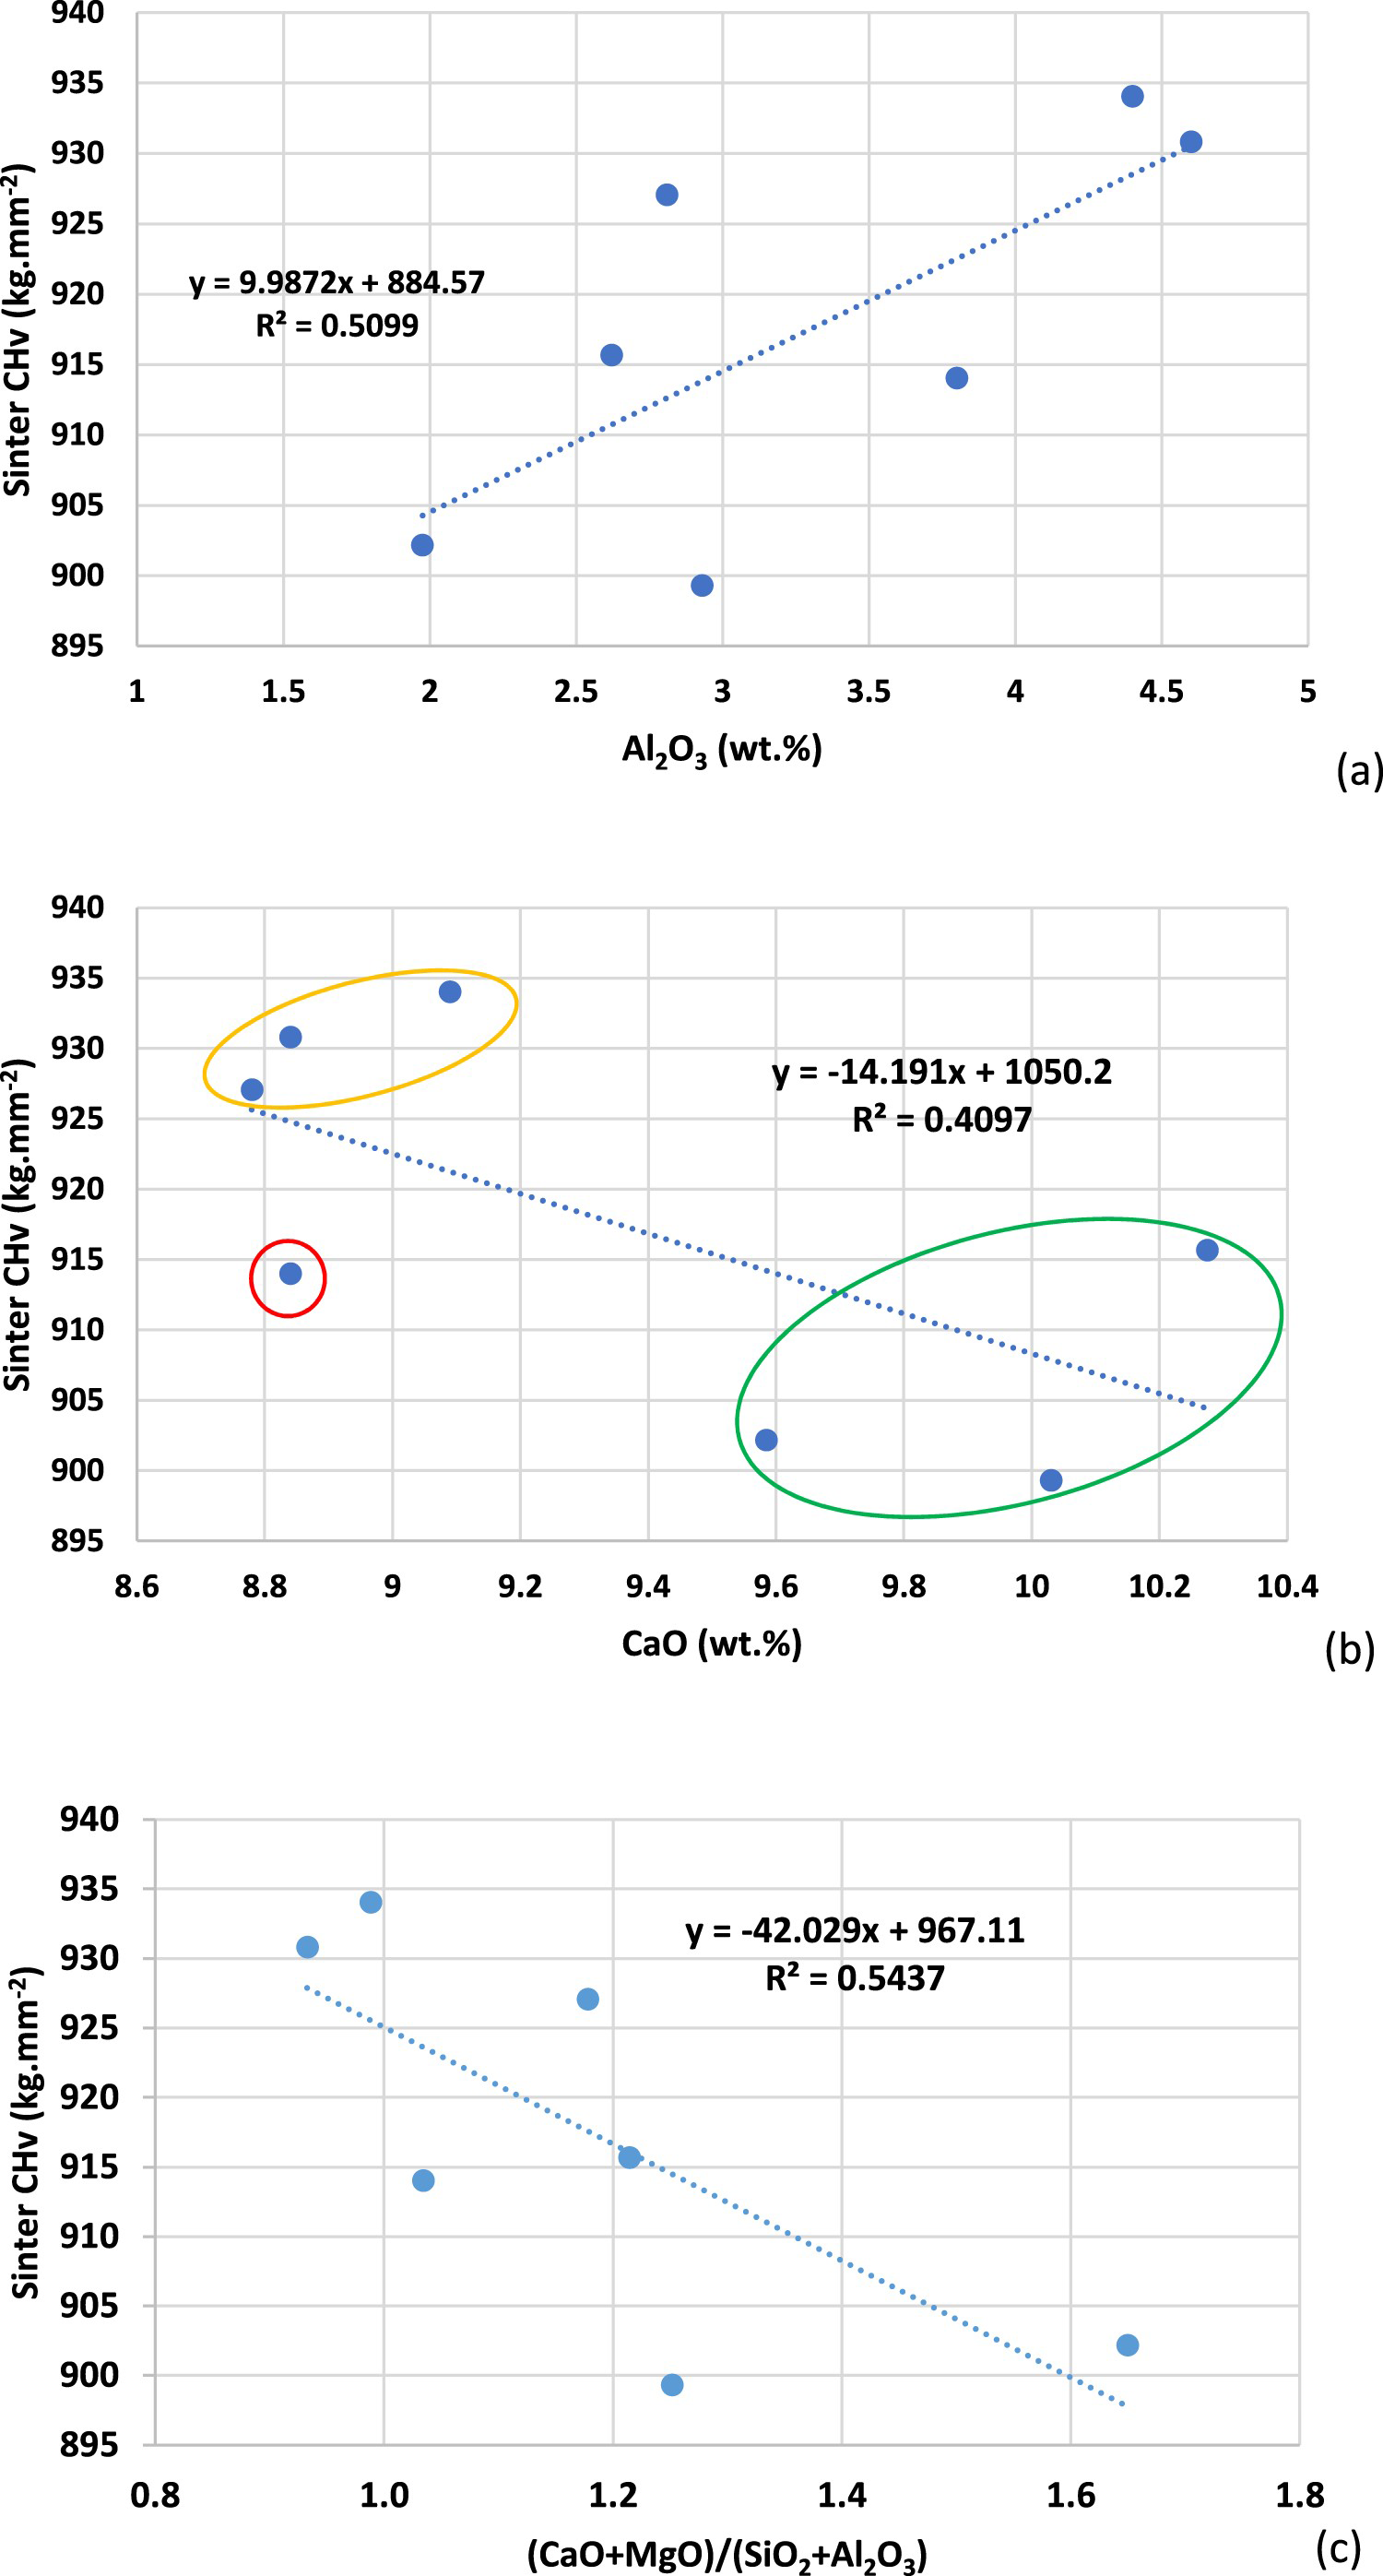
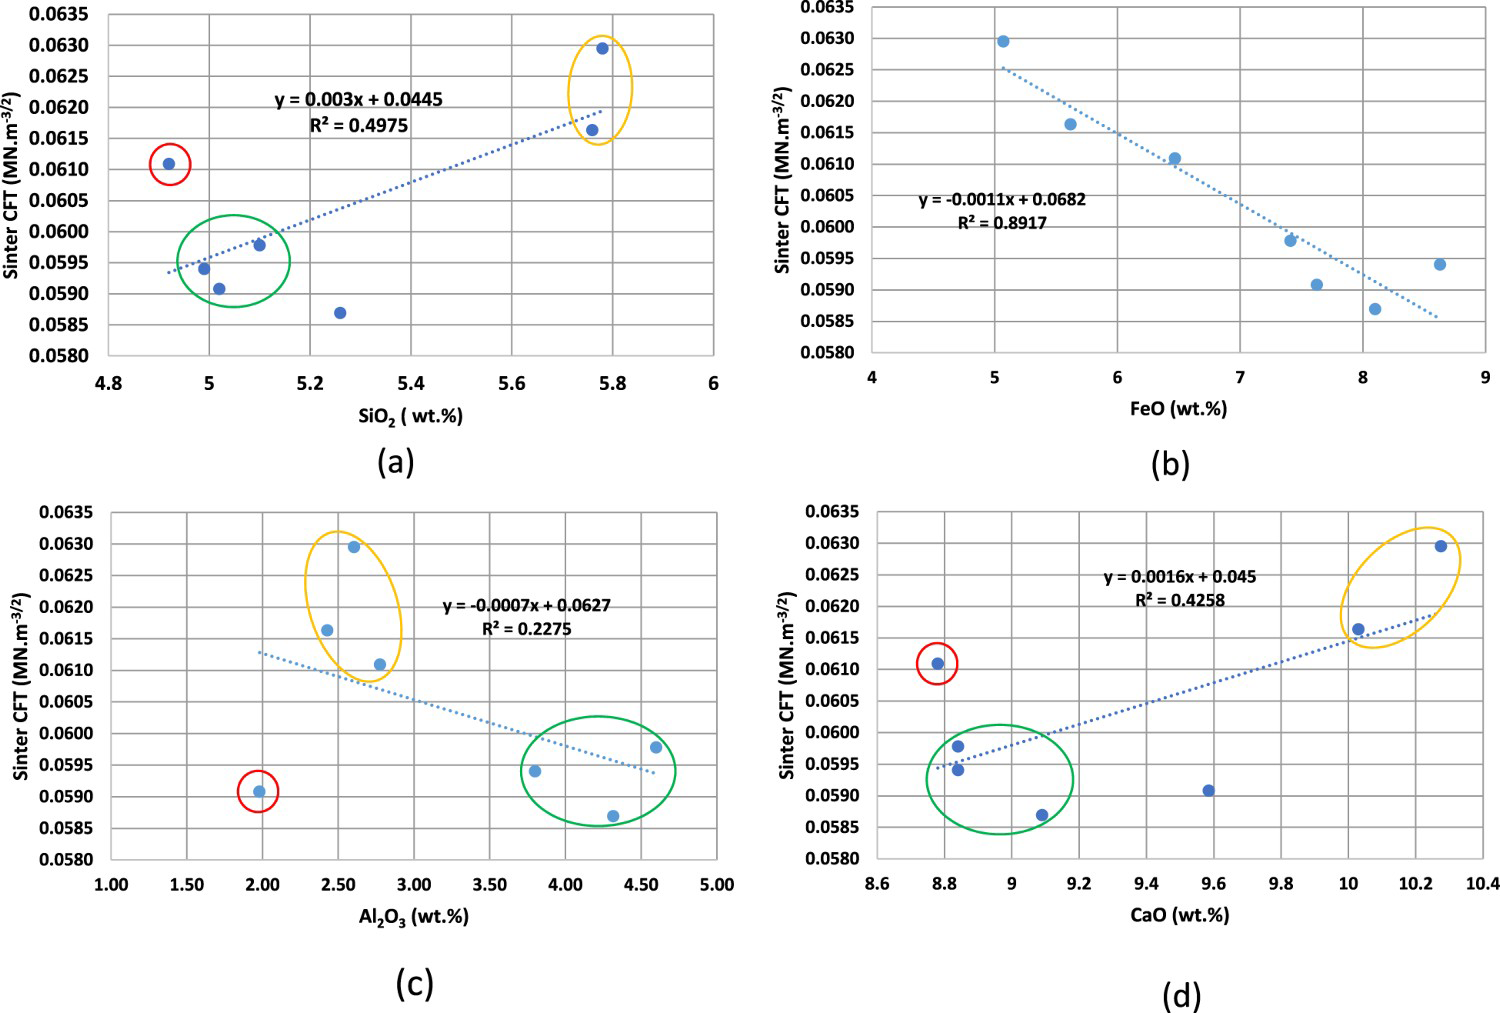
SCFT tended to increase with increasing SiO2 and CaO (Figure 6(a, d)) but decrease with increasing FeO and increasing Al2O3 (Figure 6(b, c)). Note that SiO2, Al2O3 and CaO data grouped into higher (orange ellipse) and lower (green ellipse) SCFT subsets with one outlying value (red ellipse – Figure 6(a, c)). Correlations between SiO2 and CaO data and SCFT were much stronger if fitted with a polynomial curve (R2 = 0.88 and 0.9 respectively), due to the presence of outlying values previously mentioned.
There was no linear correlation evident between SCHv/k (or SCFT) and Fe-total, likely a reflection of the high Fe content of phases with quite different microhardness or fracture toughness. Decreasing SCFT with decreasing FeO, largely reflects the increasing proportion of magnetite-bearing sinter microtypes, as magnetite tends to have lower fracture toughness (Table 3). Increasing SCFT with decreasing Al2O3 and with increasing CaO most probably reflects changes in the abundance of SFCA-bearing SM and in the form/composition of SFCA present in them.
Overall, SCHv and SCFT exhibited relatively stronger correlations with major element chemistry data than with metallurgical indices, particularly SCFT. SCHv exhibited correlations with major element chemistry of opposite sign to correlations exhibited between SCFT and major element chemistry (e.g. Al2O3 – Figures 5(a) and 6(c)).
Alternative means of calculating SM-CH/CFT
Three different calculations were undertaken using different formulas to calculate the composite hardness and fracture toughness for some sinter microtypes to see the effect on correlations between SCH/SCFT and sinter metallurgical indices. Essentially the proportion of different sinter phases/textural sub-types in some SM was modified. These calculations did not significantly change the strength of polynomial correlations between SCH/SCFT and sinter RDI, RI and TI. Very modest increases were apparent in the strength of correlations with RI and TI, whereas that with RDI was the same or slightly weaker.
Alternative means of calculating SCH/SCFT
Polynomial correlations (R2) for sinter composite microhardness (a) and sinter composite fracture toughness (b) with RDI, RI and TI for the three different sinter microtype (SM) weighting calculations; v – Vickers, k – Knoop. N.B. Calculations were undertaken with the initial SM idealised compositions.
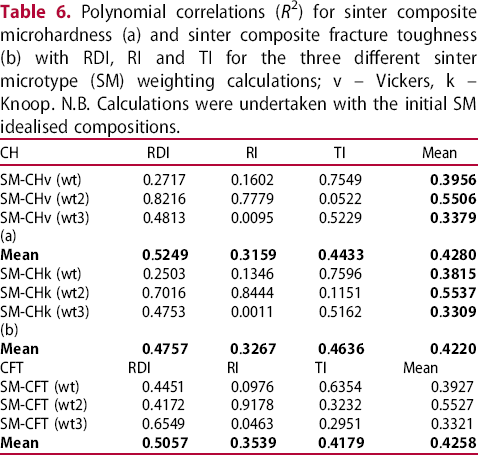
The three different calculations variably improved/maintained polynomial correlations with one or two metallurgical indices, but the strength of the correlation with the third index would decline. For example, the weighting used in the second CHv/k calculation significantly improved the strength of the correlation with RDI and RI, but the strength of the correlation with TI significantly declined.
Overall, additional weighting applied to nuclei-bearing SM produced the strongest correlations for CHv/k and CFT with RI, whereas that with additional weighting applied to bonding-phase bearing SM produced the strongest correlations for CHv/k and CFT with TI (Table 6). The results with RDI were variable, with weighting applied to nuclei-bearing SM produced the strongest correlations with CHv/k, whereas weighting applied to magnetite and glass-bearing SM produced the strongest correlations with CFT. Across the three calculations, correlations between RDI and CH/CFT were the most consistent, whereas those between RI and CH/CFT were the most variable (Table 6).
Discussion
Linear correlations between sinter CH/CFT calculated using sinter microtypes and sinter major element chemistry or sinter metallurgical indices were generally weak to moderate. Overall, correlations with sinter CH/CFT calculated from sinter phase abundance (Peterson 2019, 2021) were relatively stronger, especially with the metallurgical indices. The results with sinter major element chemistry were different for sinter CH and CFT, the former tending to correlate better with the particle-based method, the latter with the phase-based method. The three main reasons for the phase-based method producing overall better correlations are:
The difficulty in calculating a CH/CFT for some sinter microtypes that encompass their natural compositional variability (e.g. the relative proportions of magnetite and SFCA in SM#4). The method used to calculate sinter CH/CFT is based only on the modal abundance of each SM, which assumes that the influence of each SM on overall sinter physical properties (TI for example) is broadly similar if present in similar quantities. Sinter microtypes were defined on the basis of common sinter phase/textural associations, regardless of their microhardness or fracture toughness characteristics and implications.
Modifying the idealised SM compositions is one means of potentially improving correlations between sinter CH/CFT and sinter chemistry/met. indices. However, the three exercises using slightly different phase abundances for some SMs to calculate overall sinter CH/CFT did not notably improve correlations with sinter metallurgical indices. This was because slightly modifying SM compositions did not significantly affect overall sinter CH/CFT. It would only be expected to do so if particular SMs are present in relatively high abundances and also if the relative phase abundances for these SMs are significantly changed.
Alternatively, it could be possible to improve correlations between sinter CH/CFT and sinter metallurgical indices by modifying the new proposed SM classification scheme. This could include the sub-division of SM#4 and SM#5 into magnetite-dominant (SM#4m) and SFCA-dominant (SM#4s) sub-classes to account for their notably different microhardness. This would enable the scheme to better reflect observed sinter particle textural types.
Additional attempts at calculating SCH/SCFT by weighting constituent SM to bonding or nuclei-bearing SM provided encouraging but variable results. Another means to potentially improve correlations involves providing additional weighting to particular SMs that have very high or very low CH/CFT (e.g. SM with significant larnite) to reflect the expectation that they might have relatively greater positive or negative influences on sinter CH/CFT. This would most likely only influence the sinter CH/CFT significantly if these SMs were present in relatively high abundances (e.g. >20%). These modified approaches could be better examined if sinters with a wider range of ore blends are analysed. The CH and CFT of several of the sinter samples was somewhat similar, resulting in higher and lower CH/CFT clusters, making discrimination on this basis alone challenging.
The sign (positive or negative) of correlations between SCH (or SCFT) calculated using sinter microtypes and sinter metallurgical indices was often the opposite of correlations when SCH (or SCFT) was calculated using sinter phases. This indicates that either the phase-based and particle-based methods are capturing different elements of sinter physical properties or that the method used to calculate SCH/SCFT from the constituent SM needs to be modified (e.g. by weighting the input of certain SM, as discussed).
The sign of correlations between SCH and sinter major element chemistry was often the opposite of correlations with SCFT. This was also observed to some extent when SCHv and SCFT were calculated from sinter phase abundance (Peterson 2019, 2021). This difference was typically not the case for correlations between SCH/SCFT and metallurgical indices (when calculated by either method). Note that the trends for SCH and SCFT with a particular element could vary depending on the method used to calculate them. For example, when calculated from sinter phase abundance, SCHv and SCFT showed positive correlations with sinter Al2O3. Yet, when calculated from sinter microtype abundance, SCHv showed a positive correlation and SCFT a negative correlation with sinter Al2O3.
These observations indicate that the relationship between sinter composite microhardness and major element chemistry is different to that between sinter composite fracture toughness and major element chemistry. The large difference between the strength of the correlation between SCFT and sinter FeO and that between SCH and sinter FeO is one clear example of this. Other notable differences include sinter basicity, SiO2 and Al2O3. Hence the proportion and texture/composition of complex calcium ferrites (including SFCA) and Fe-spinels (including magnetite) likely has a greater influence on sinter composite fracture toughness than on sinter composite microhardness.
The fact that there was no correlation between SCFT and SCHv/k lends support to the hypothesis that sinter composite microhardness and sinter composite fracture toughness determined by the particle-based method are recording different sinter properties that are not necessarily directly comparable. An analysis of the relationship between the texture, composition, microhardness and fracture toughness of complex calcium ferrites and of Fe-spinels is warranted to clarify the effect of phase composition/texture on fracture propagation.
Conclusions
This study demonstrated that metallurgically-meaningful sinter composite microhardness and composite fracture toughness can be calculated from the modal abundance of particle-based sinter microtypes. Correlations with SCH/SCFT calculated using sinter phase abundance were generally relatively stronger, however, particularly for sinter metallurgical indices. This was because the contribution of each sinter microtype (SM) to the composite data was the product of its modal abundance only. Correlations could be improved by modifying the idealised composition of some or all SM and/or by changing the method by which each microtype's contribution to the composite data is calculated (e.g. providing additional weighting to bonding-phase bearing SM). It is probable that correlations can be best improved by providing additional weighting to the composite data for particular sinter microtypes with especially beneficial or deleterious microscale properties.
SCH and SCFT exhibited relatively stronger linear correlations with sinter major element chemistry compared to that of sinter metallurgical indices. The variable sign and strength of correlations with SCH and SCFT, suggests that these indices are capturing different aspects of sinter properties and might not be directly comparable Therefore, sinter comprised of higher proportions of phases with relatively higher microhardness might not necessarily have greater fracture toughness and resistance to brittle degradation. This observation is distinct from observations recently made on lump Fe ore using a similar approach.
Footnotes
Acknowledgments
The authors would like to thank CSIRO Mineral Resources for funding the work and for permission to publish.
Disclosure statement
No potential conflict of interest was reported by the author(s).