
Abstract
The objective of this study is to improve the accuracy of the real contact area calculated by the semi-analytical method (SAM). Two types of surface pairs are investigated: an analytically generated sinusoidal wavy surface against a rigid flat, and a pair of real rough surfaces. The results suggest that the real contact area calculated by the SAM is extremely sensitive to the resolution of input, i.e. the grid size. The SAM results of the real contact areas show poor convergence, especially in the case of the real rough surfaces. The main reason for this difference is the ‘over-covering’ effect when SAM calculates the real contact area. An exponential extrapolation technique is proposed to predict the real contact area values when further refinement of the grid resolution is unfeasible.
Introduction
Contact between rough surfaces has long been a matter of concern in tribology. Accurate characterization of the contact pressure and the real contact area in rough surface contacts are desired because of their linkage to the tribological performances. Both contact pressures and real contact areas are considered essential factors of dry friction mechanisms [1]. Further, stresses generated by contact pressures are crucial for common wear mechanisms including abrasive and fatigue wear [2]. Therefore, obtaining information of real contact areas and contact pressures will contribute to the theoretical estimates of friction and wear. While ‘in-situ’ measurements of contact pressure and real contact area by experiments are still difficult [3], numerical simulations are extensively employed to perform a rough surface contact analysis, thanks to their flexibility and versatility.
The semi-analytical method (SAM) provides an effective approach in numerically solving contacts of rough surfaces. With the acceleration techniques of fast Fourier transform (DC-FFT) and the conjugate gradient method [4], SAM is applied to solve various rough surface contact problems efficiently by feeding in different analytical solutions. With Love's equation [5], the simple homogeneous elastic contacts were solved by Bjorklund and Andersson [6]. By applying O'Sullivan and King's solution of layered structure [7], Nogi and Kato [8] solved the elastic single-layered contact, Cai and Bhushan [9] solved the elastic bi-layered contact, and Yu et Al. [10] further solved the elastic contact of materials with arbitrary number of layers. Jacq et al. [11] extended the SAM to solving elasto-plastic contact with the help of Chiu's analytical solution of eigenstrains [12,13]. With the same analytical solutions, a series of contact between materials with inclusions were also considered [14,15,16]. Despite the versatility in dealing with variety of contact types, SAM is also efficient in computational time. As opposed to the finite element method, which needs a very fine mesh and a large calculating domain, SAM requires the computation to be made only on the contact domain involved [4]. Due to these advantages, SAM is extensively employed in a variety of cases to understand the complicated tribological phenomena including running-in [17–19], fretting [20–22] and partial-slip [23–25] based on the rough surface contact calculation.
As a numerical method, SAM requires discretized surface geometry data as input. However, a dilemma is encountered when choosing the resolution of input data to model rough surface contacts. On one hand, the resolution of the surface inputs should be high enough to accurately model the real rough surface contact. It has long been known that material surfaces consist of molecular and super-molecular structures. Sizes of asperities can be as small as nanoscale (∼10 nm). Under certain circumstances, the local real contact area can be extremely small when single asperity contacts are formed. In such cases, high resolution of the surface inputs should be applied so that these small asperities can be accurately depicted. However, very high resolution of input is not always feasible due to the computational costs of SAM algorithms. For a simple elastic contact calculation, the complexity of the SAM algorithm is O(N(logN)2) and the memory consumption is O(N2) [4], suggesting that doubling the input resolutions in both x and y directions means eight times more calculating time and four times more memory demands. For some elasto-plastic contact cases, the complexity will be even dramatically higher because the calculation domains are 3D instead of 2D for the simple elastic contact cases. Wang et al. reported an 864MNL*ln(8MNL) +432MNL*ln(4MN) complexity for an algorithm solving an arbitrarily shaped inclusion in an elasto-plastic contact [26]. Therefore, compromises on input resolutions sometimes have to be made in order that calculations can be completed within a reasonable time duration.
Owing to this conflict, the effects of input surface resolution on the accuracy of SAM results need to be examined carefully. A sensitivity study is therefore necessary. In this article, the sensitivity on the maximum contact pressure and real contact area results with respect to the resolution of surface inputs are studied. First, the contact between an analytically generated wavy surface and a rigid flat are studied and compared with the analytical solution. The investigation is then extended to a real surface contact by studying the contacts of a steel ball and a grinded flat before and after running in.
Theory and methods
In this section, a SAM model for the rough surface contact with normal load is presented, allowing the pressure distribution and real contact area to be calculated.
First, a reference coordinate system is introduced, as shown in Figure 1. For simplicity but without loss of generality, a contact of an elastic object loading on a rigid flat is considered,
Schematic of the contact.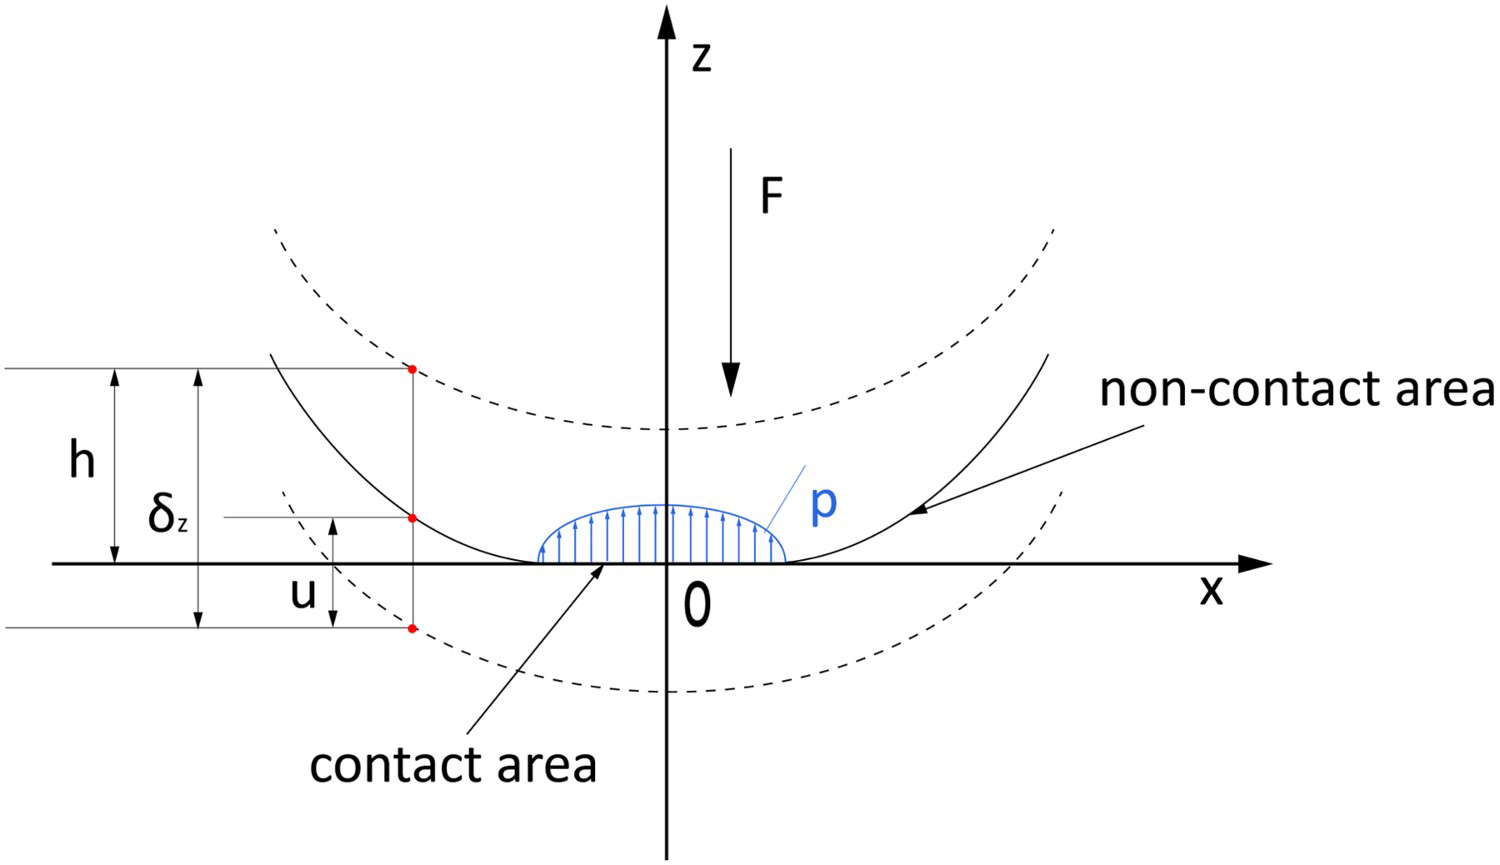
where:
In the whole domain in which contact and noncontact areas both exist the following Kuhn–Tucker complementary conditions hold:


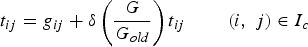
To solve this problem numerically by the semi-analytical method, the whole domain, including both the contact and non-contact area, is firstly discretized into m*n grids, where each grid has a size of 2a*2b (Figure 2).
Schematic of domain discretization.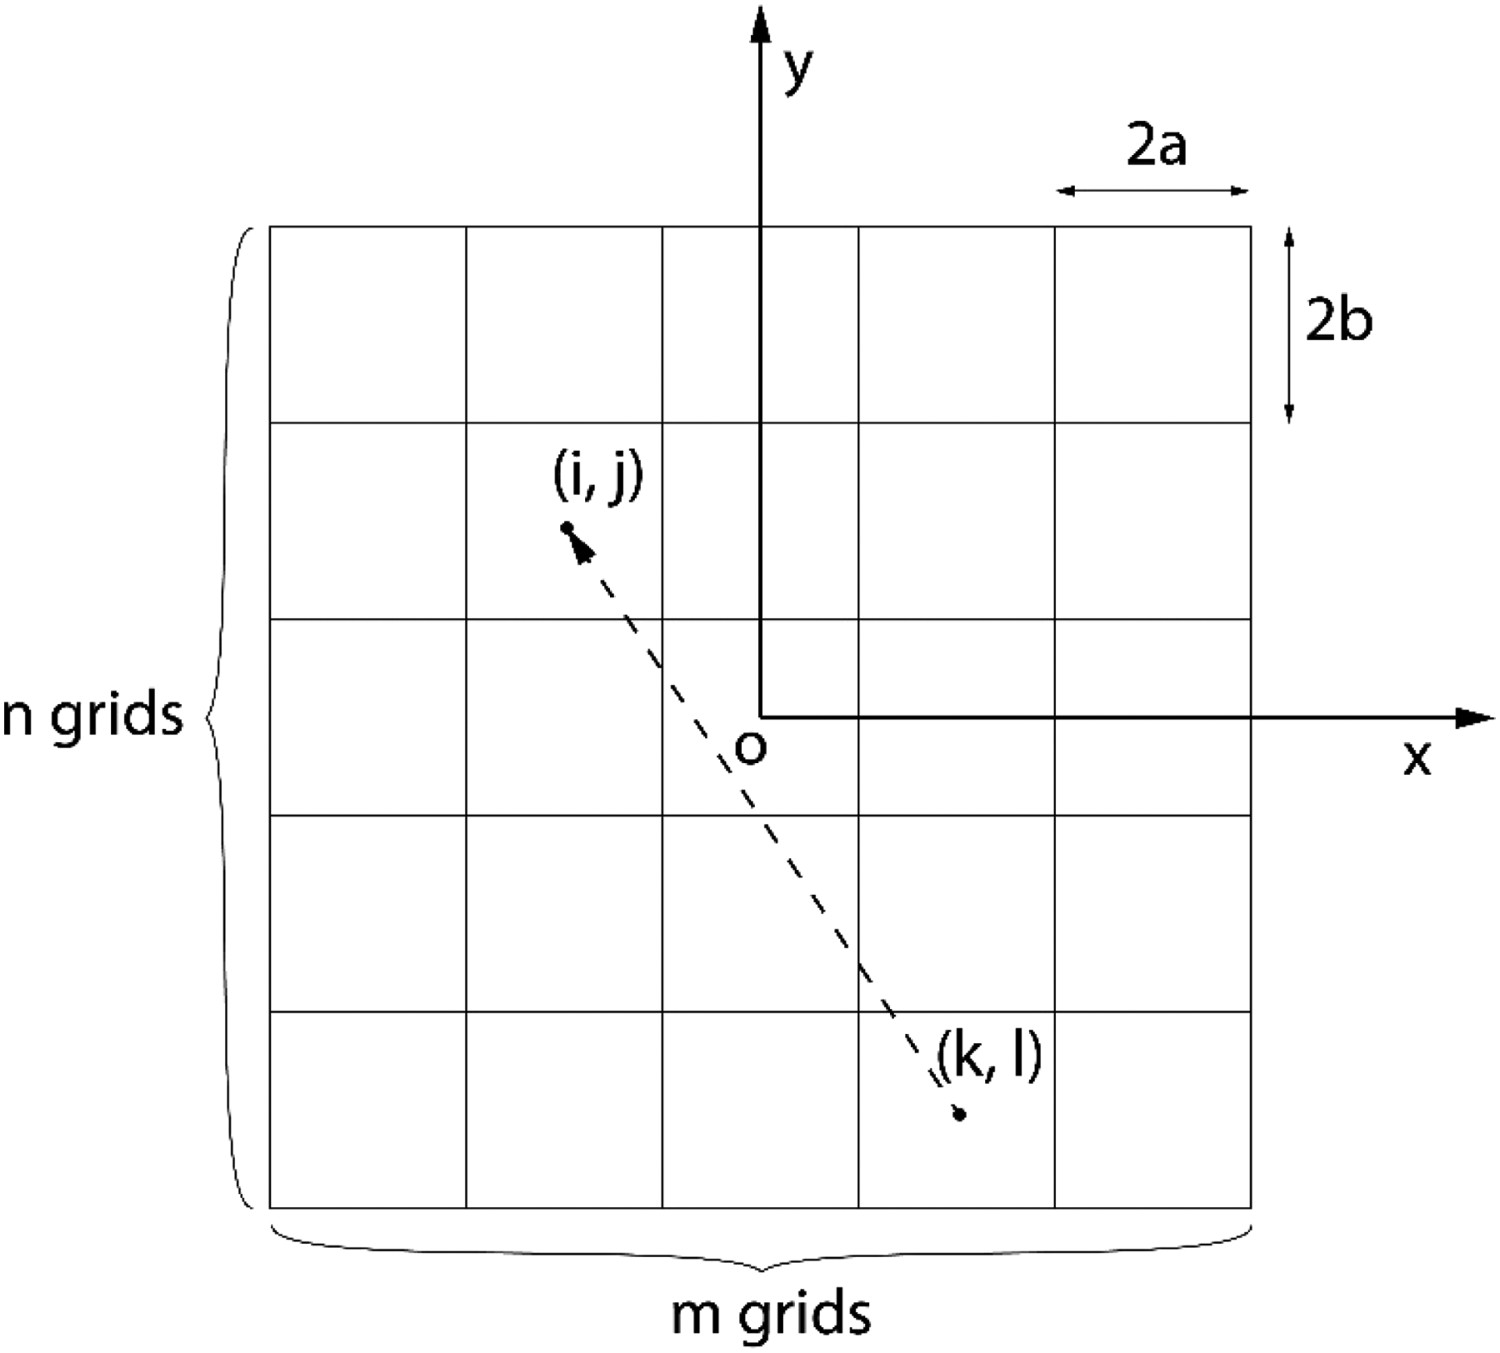
The equation can be further re-written in discretized manner:


 represents the whole calculating domain and
 represents the real contact area where
 .
.
In order to solve the pressure distribution
 , it is necessary to link
 to
to
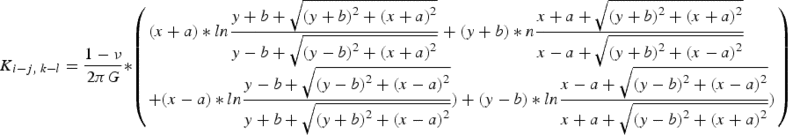
 . Here the analytical solution of Love for normal deflections under a uniform normal pressure [5] is introduced:

 is the deflection in grid
 caused by the contact pressure in grid
 , and the coefficient
 written as:

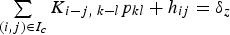
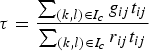
 is the sum of all the contact pressure contributions in the calculating domain. Now the Equations (3) and %(4) can be written as follows
First, a guess pressure distribution is made, and then the following iteration steps from (1) to (5) will be performed:
update the gap
calculate the new conjugate direction
calculate the new descending step length
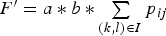
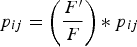
update the pressure distribution, enforce the inequalities and force balance
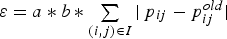
check the relative error


If
 , where
 is the preset tolerance, another iteration will be performed starting from step (1). Otherwise, the iteration stops and the current
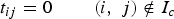
 results are the pressure distribution desired. The real contact area can also be acquired by counting the area where
 .
.
Wavy surfaces
In this part, the analysis is conducted on the contact between an elastic sinusoidal wavy surface and a rigid flat, with different nominal contact pressures. The maximum contact pressure and real contact area are calculated both analytically and by the SAM model with different resolutions of input. The results are compared and the errors of the SAM results as a function of the resolutions of input are investigated and discussed.
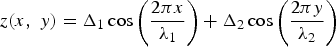
An elastic sinusoidal waviness was considered, see Figure 3. The geometric shape of the sinusoidal wave is defined by Equation (25), which is also illustrated in the literature [27].
The sinusoidal wavy surface: (a) 3D view; (b) cross-section view.
 and
and
 are amplitudes and wave lengths in x and y directions,

The size of the wavy surface is 250 μm*250 μm, while there are 20 waves in both x and y directions.
The elastic modulus of this wavy surface is set to 210 GPa, the same as steel. Elastic contacts between this surface and a rigid flat are considered. The three nominal contact pressures (
 ) used are 50, 100 and 200 MPa.
The analytical solutions of maximum contact pressure and real contact area are given in [27]:
 is the average nominal pressure, and
 is defined as:
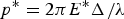
 is the reduced elastic modulus:
For the SAM calculations, the wavy surface is meshed into six different grid sizes: 64*64, 128*128, 256*256, 512*512, 1024*1024 and 2048*2048 as input. Then the contacts are solved by the method described in Section 2. The results of real contact area ratios and maximum contact pressures are presented in Tables 1 and 2 and Figure 4.
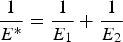
Relative errors of the SAM results compared with the analytical solutions with different nominal loads: (a) 50 MPa; (b) 100 MPa; (c) 200 MPa. Analytical and SAM results of the maximum contact pressures under different nominal load. Analytical and SAM results of the real contact area ratio under different nominal load.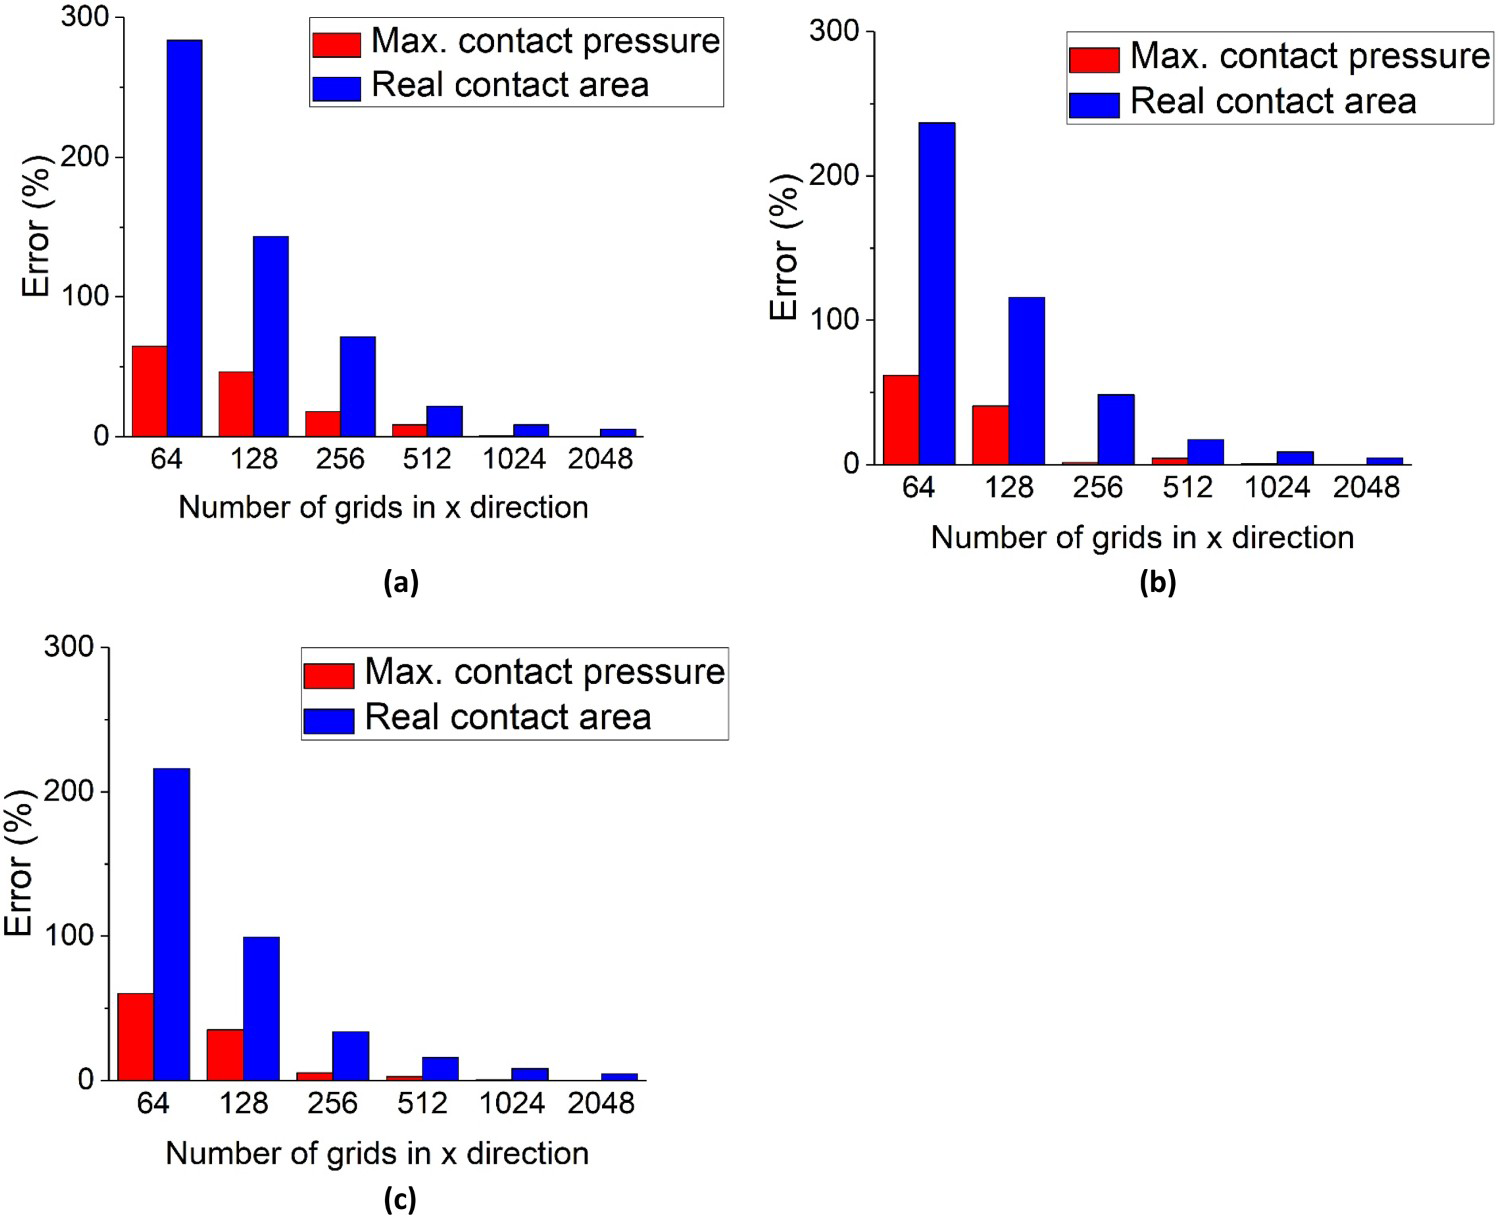
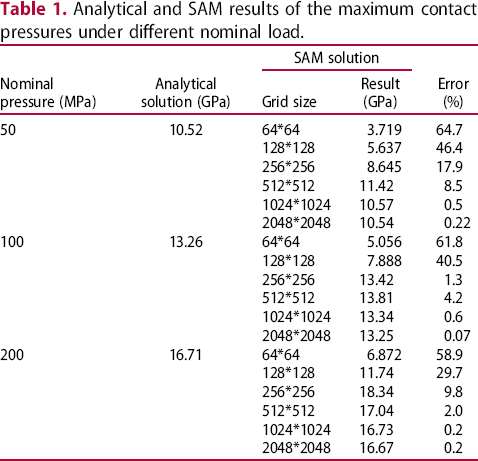
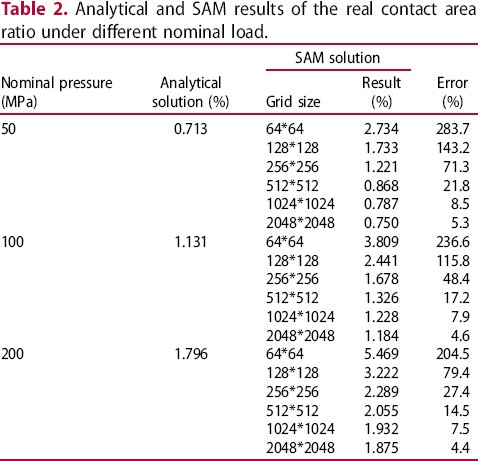
Clearly, the accuracy of the SAM results is sensitive to the resolutions of input: the higher the input resolution is, the smaller the relative error will be. Both maximum contact pressures and real contact areas converge to the analytical solution when the input resolutions go high. However, it is worth noting that the converging rate of the contact pressures and real contact areas are significantly different. Take the 100 MPa case for example: both starting from very large errors for the 64*64 case, the maximum contact pressure can be predicted by SAM with rather satisfactory accuracy under the resolution of 256*256 (1.26% relative error in comparison with the analytical solution), while the real contact area result under the same resolution is rather poor (48.4% relative error). Even with the highest input resolution of 2048*2048, the relative error of the real contact area remains 4.61%, in contrast to the 0.07% for the maximum contact pressure. Similar trends are also observed in the cases with other nominal contact pressures.
This phenomenon is caused by the different ways SAM calculates the contact pressure and real contact area. The contact pressures are calculated directly by SAM, as described in Section 2, while the errors come mainly from the inadequate input information. This issue can be resolved by increasing the resolution of input. The calculation of the real contact area is, however, indirect: the algorithm first determines the contact pressures on each grid, and the grids with non-zero contact pressures will be marked as ‘in contact’. Then the contact area will be calculated by the total area of the grids in contact. However, using rectangle grid size, the grids will usually overly cover the contact boundaries. This ‘over covering’ effect leads to larger errors in calculating the real contact area values.
An elaborated demonstration is presented in Figure 5, which gives a close look at the calculated results of local contact on a single summit of the wavy surface, under 100 MPa nominal contact pressure. The resolutions of input being used are 256*256, 512*512, 1024*1024, 2048*2048 respectively. It appears that with low input resolution (256*256) while the grid sizes are large, the over-covering effect is quite severe (Figure 5(a)). In this case, a rectangle shape is considered by SAM as the real contact in this spot, while the actual contact area shape is a circle. Consequently, a large error occurs here. With higher input resolutions, the sizes of grids become smaller, the over-covering effect become less severe, and more accurate coverages are achieved (Figure 5(b–d)). This provides a greater accuracy of the numerical results. Note that this over-covering effect only exists in calculating the real contact area, while the calculation of the contact pressures is hardly affected by this. The effect of this is that SAM shows much higher sensitivity to input grid size when calculating the real contact area than the contact pressure.
SAM results of real contact areas with different resolutions of input (yellow grids are in contact and blue grids are not in contact): (a) 256*256; (b) 512*512; (c) 1024*1024; (d) 2048*2048.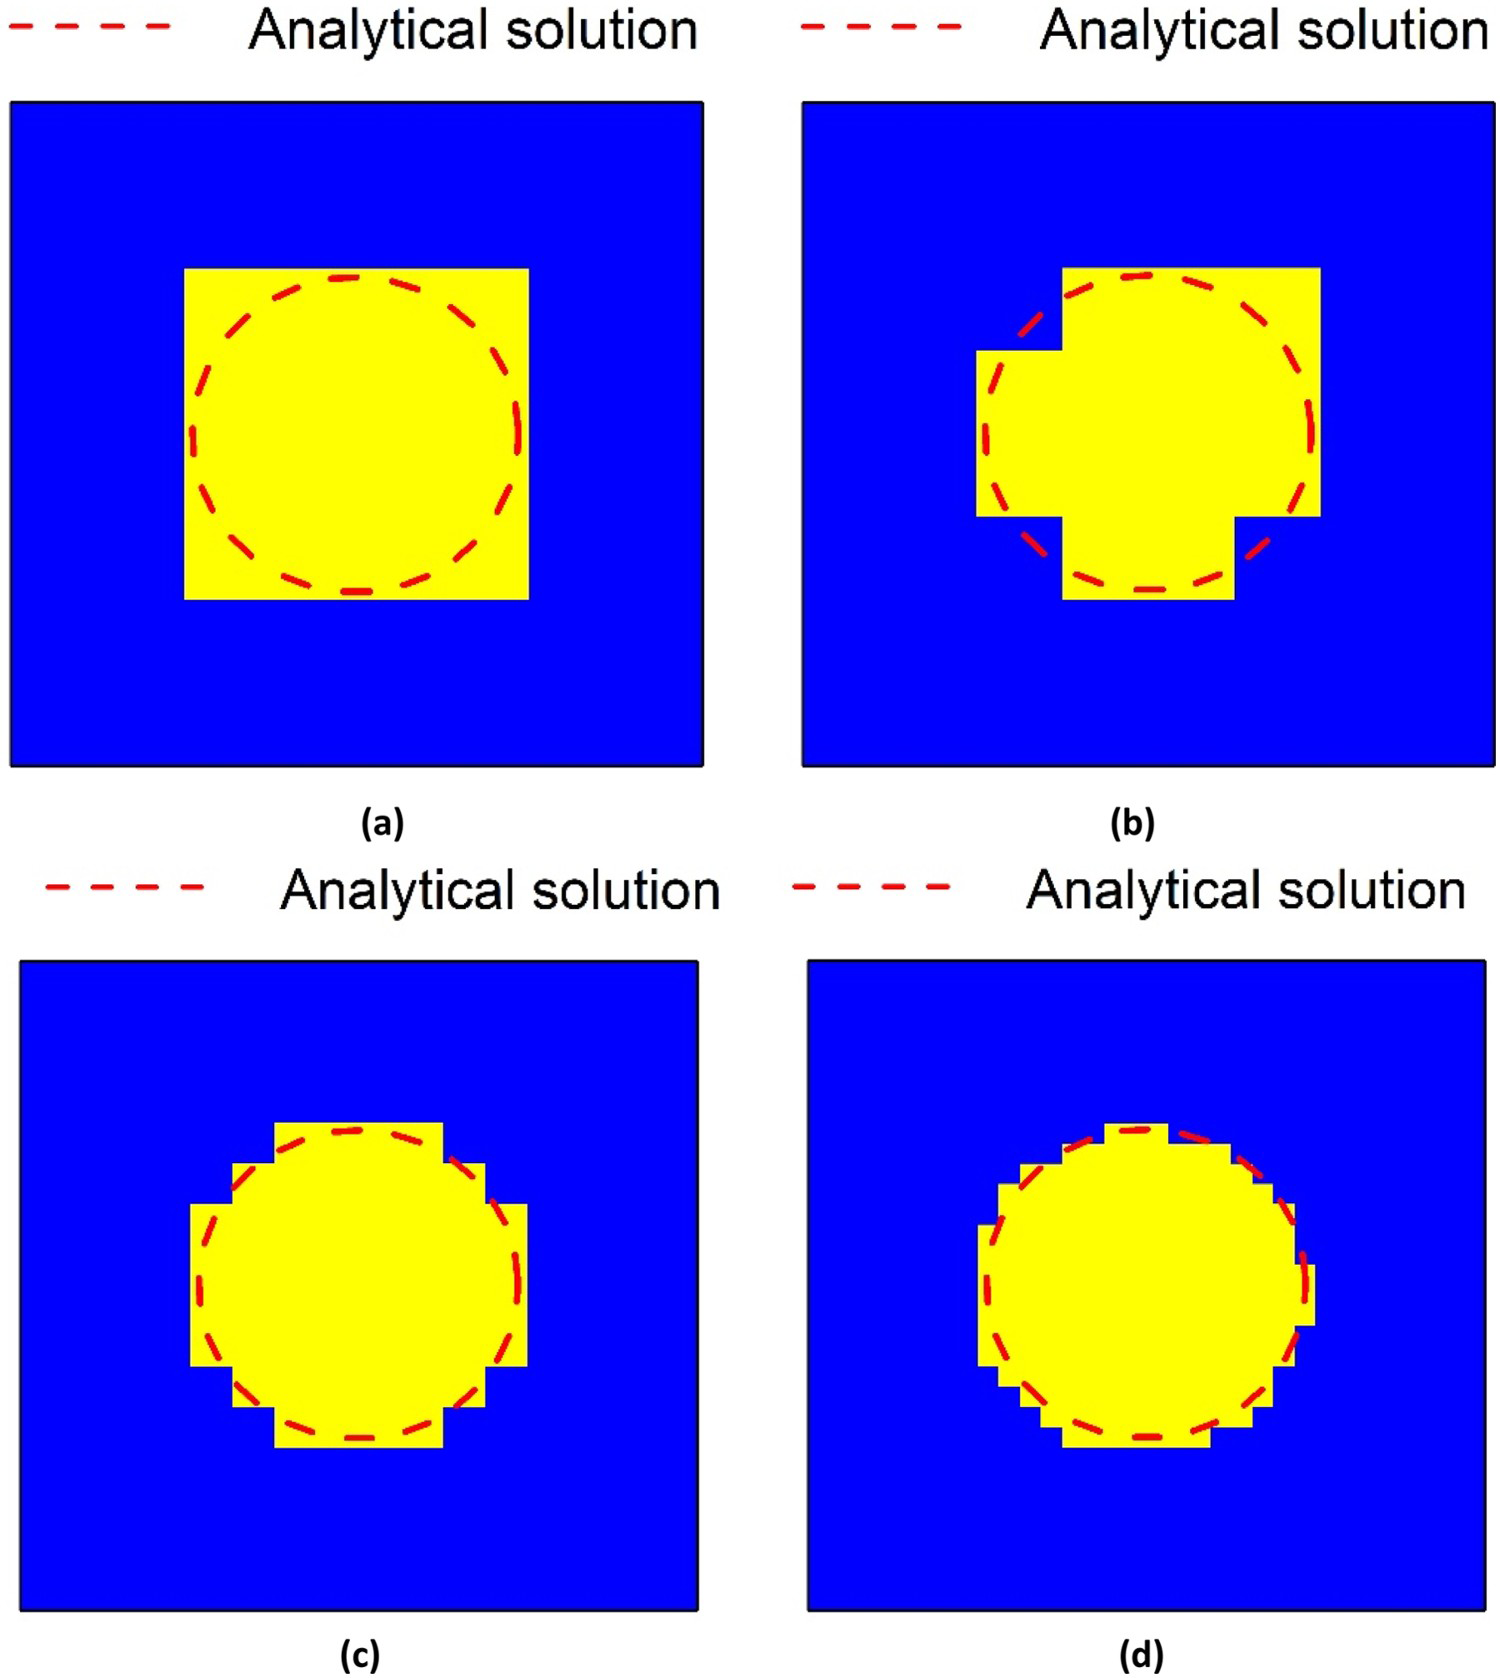
It should be noted that a resolution of 2048*2048 is quite high, thus may not be feasible in some situations. Usually, much lower resolutions are applied in contact analyses [14–26]. Therefore, it is possible that the calculated real contact areas by SAM are not reliable in many cases due to the inadequate resolutions of input.
An extrapolation method is proposed to acquire more accurate contact areas when further improving the input resolution is impossible or inconvenient. A three-parameter decayed exponential formula is used to fit the data points:
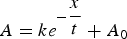
 is the real contact area calculated by SAM,
  ,
,
 and
and
 are the three fitting parameters. The term
 can be regarded as the error term caused by the over-covering effect. When the resolution term
  will be the predicted real contact area.
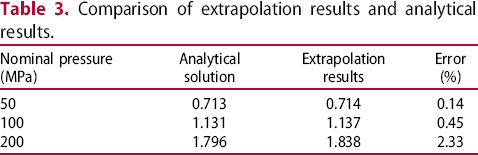
This technique is applied to the real contact area results of the wavy surface, see Figure 6. The exponential functions achieve satisfactory fitting accuracies for all three contact cases. For each data set, the six data points fall fairly close to the fitting curve. In addition, the fitting curves converge accurately to the analytical solution. See Table 3.
Exponential extrapolation of real contact area of the wavy surfaces. Comparison of extrapolation results and analytical results.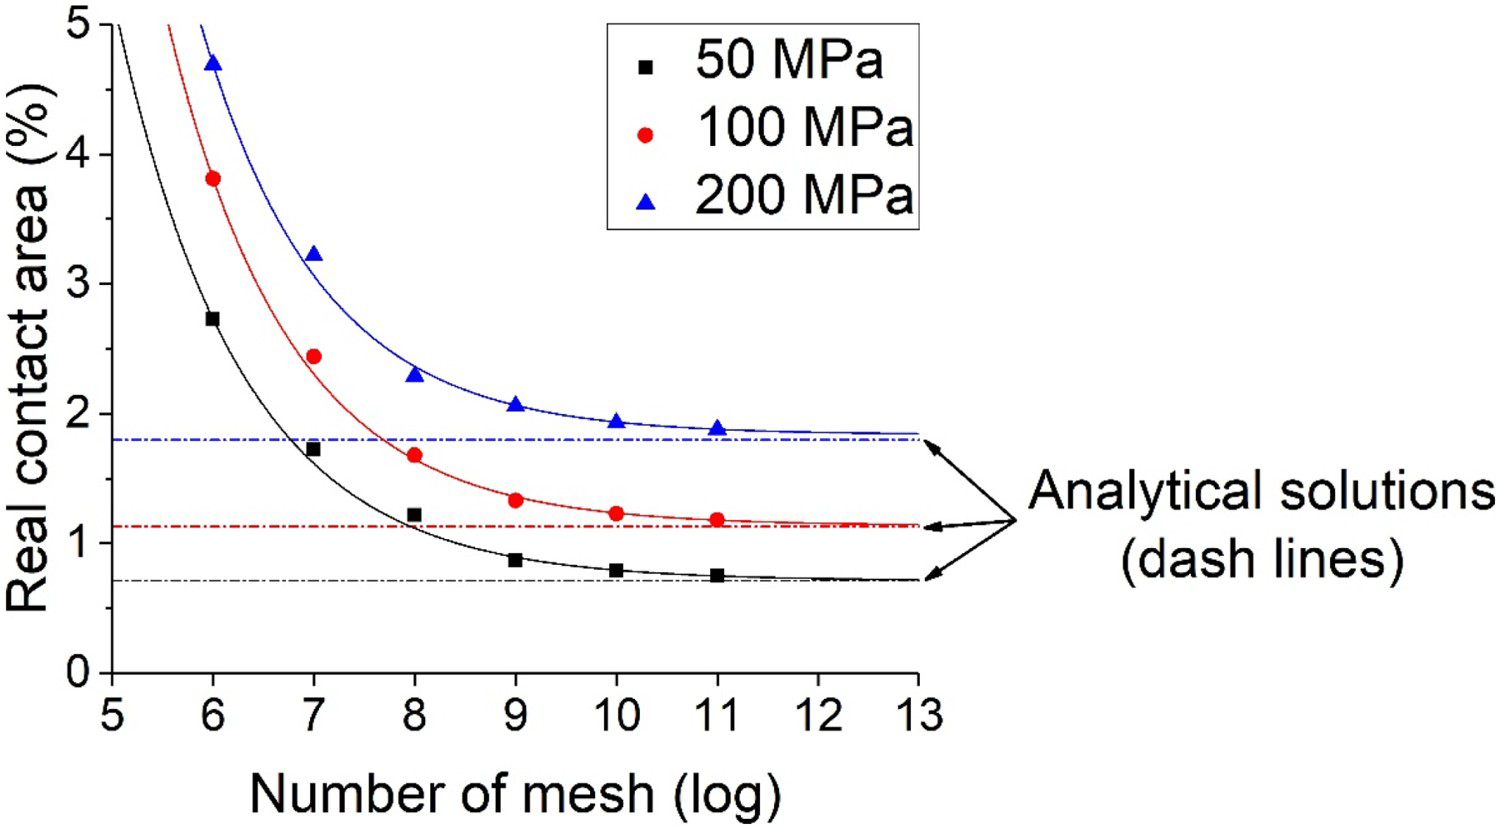
Based on the former discussion, it can be concluded that real contact area results are more sensitive to the resolutions of input surface, and therefore deserve extra attention. Exponential extrapolation can be employed to predict the real contact area value based on a series of results from different input resolutions. This technique can be further applied to the real rough surface contact calculation, which is elaborated in the following subsection.
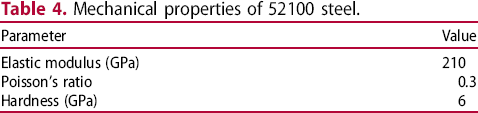
In this subsection, the elasto-plastic contact between a 5 mm radius ball and a grinded ring (Figure 7) is studied to investigate the sensitivity of the SAM results with respect to the resolutions of input. Both the ball and the ring are made of 52100 bearing steel. The mechanical properties are shown in Table 4.
Ball and flat surfaces samples. Mechanical properties of 52100 steel.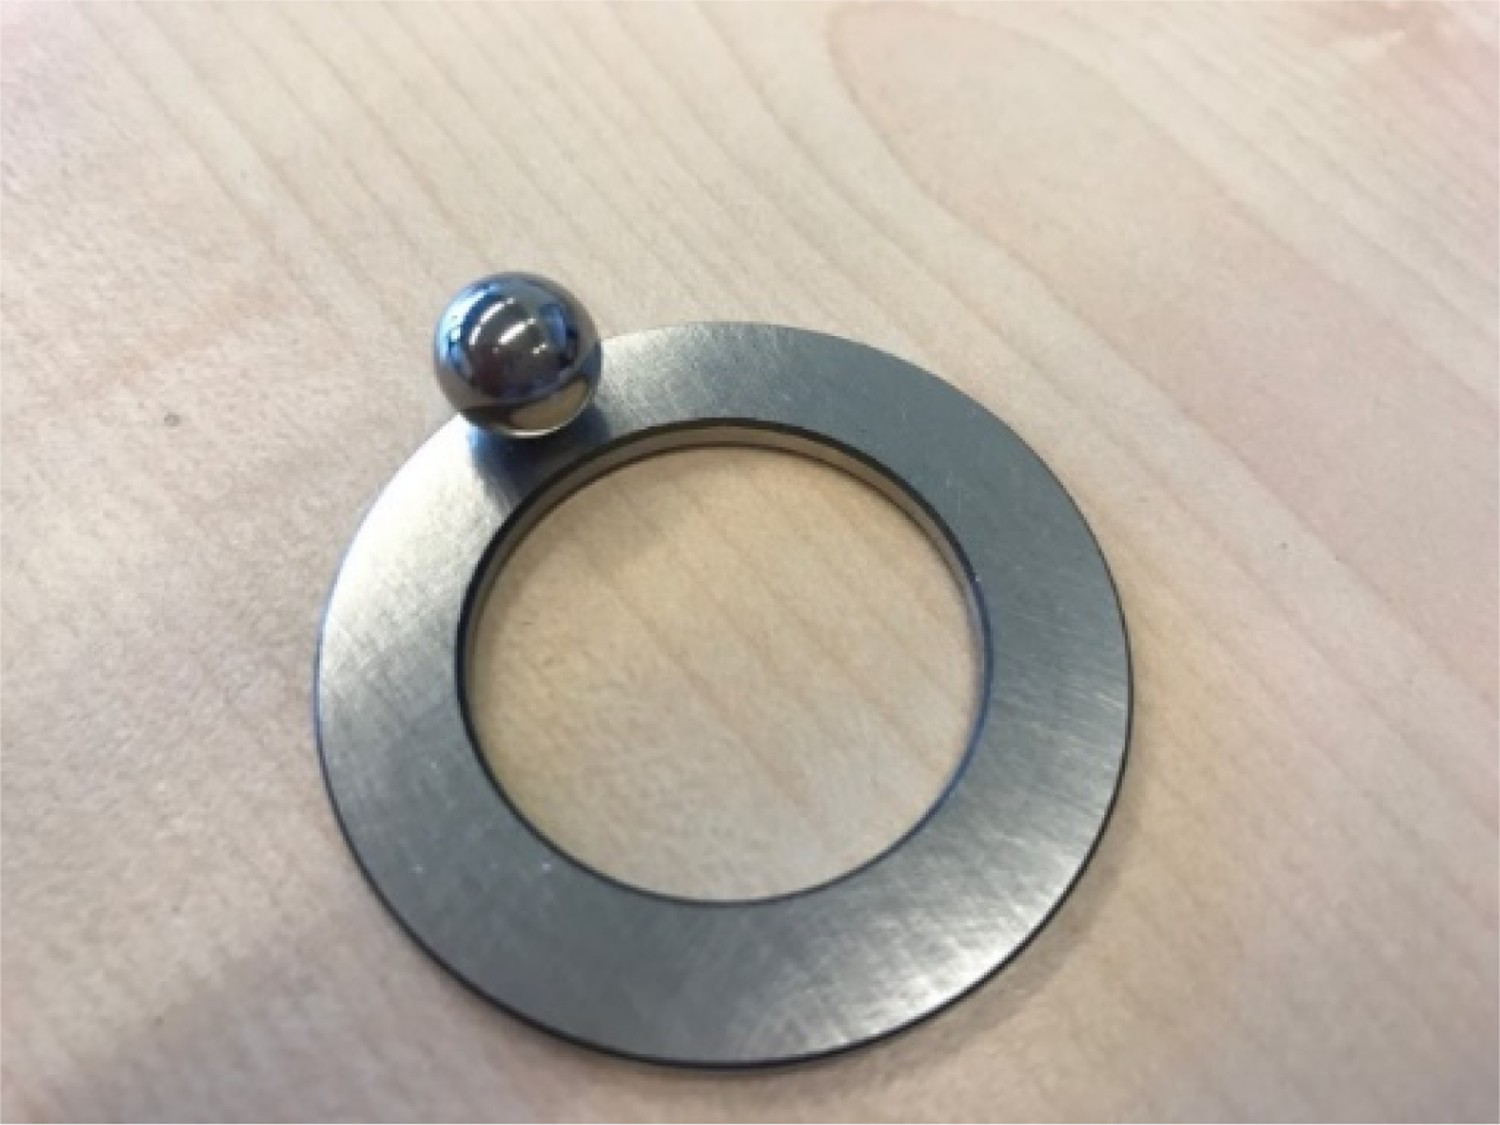
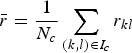
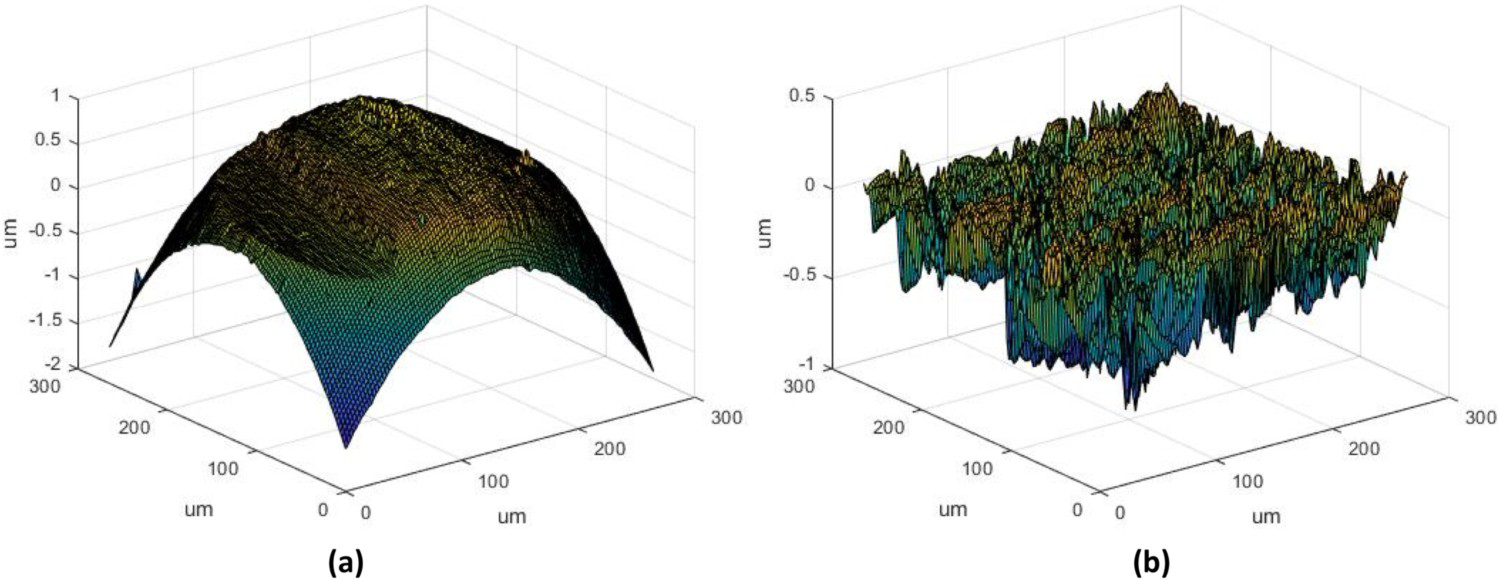
Two surface conditions are considered: before and after running in. The running in process was carried out by a pin on disk testing machine. The surface data were acquired by a confocal microscope SENSOFAR S Neox. The measuring domains are originally 264.2 μm*264.2 μm, with 2048*2048 grid size, as presented in Figures 8 and 9.
Surface profiles of samples before running in: (a) the ball; (b) the ring. Surface profiles of samples after running in: (a) the ball; (b) the ring.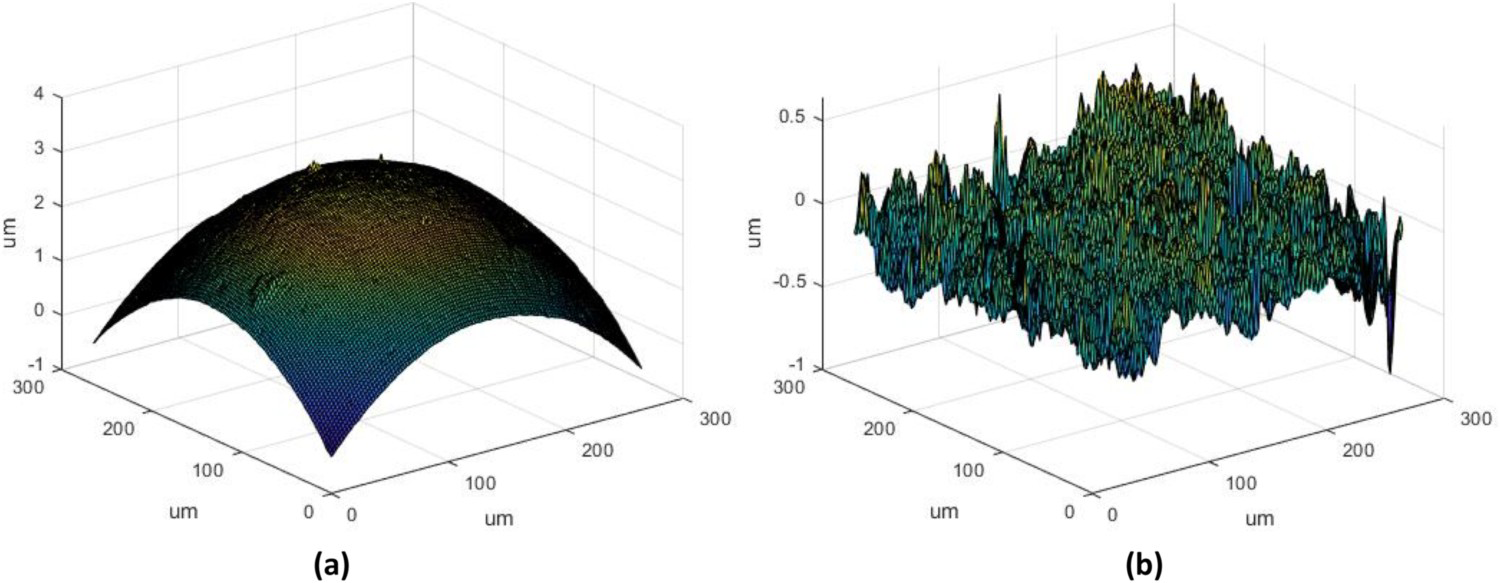
In order to investigate the effect of resolution, the surface data are scaled into five different lower resolutions 64*64, 128*128, 256*256, 512*512, 1024*1024 by the bilinear scaling algorithm. Together with the original 2048*2048 data, six different resolutions of input are acquired. Three different normal loads are applied, which are 2.5, 5 and 10 N, respectively. Considering the elasto-plastic property of the material, the maximum contact pressure is set to 6 GPa, the same as the hardness. A single elastic-perfect-plastic curve is employed in the calculation.
The calculated real contact areas with different surface input grid sizes are shown in Figure 10. The results indicate that, for the samples before running in, the real contact areas converge relatively well while, for the samples after running in, the results show substantial differences even with high input resolutions. Therefore, the accuracies of the calculated real contact area values remain questionable.
Real contact areas calculated by SAM with different resolutions of input: (a) before running in; (b) after running in.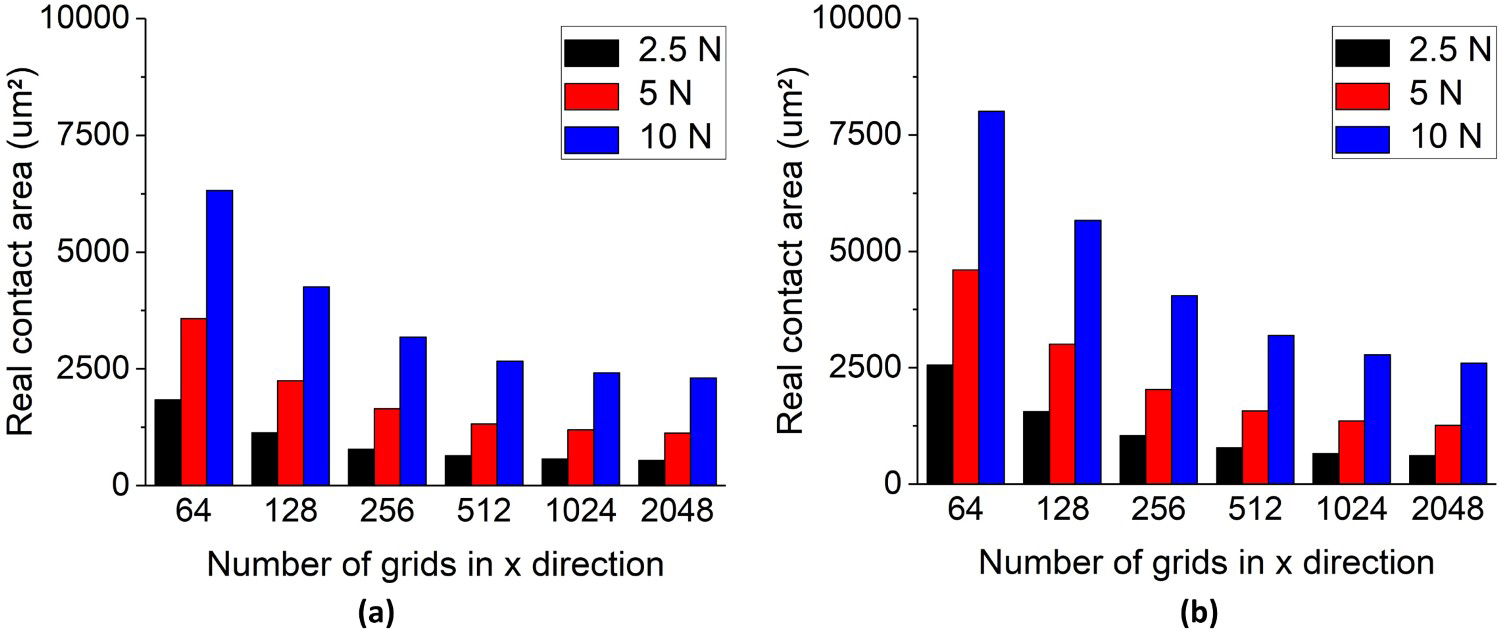
The real contact areas are predicted by the fitting technique proposed in subsection 3.1, see Figure 11. The results show that, for both cases, the results from the different input resolutions fall on the exponential curves nicely. The predicted results are compared with the SAM results with the highest resolution (2048*2048) in Table 5.
Exponential extrapolation of real contact areas of the samples: (a) before running in; (b) after running in. Comparison of real contact areas: SAM results and extrpolation results of samples.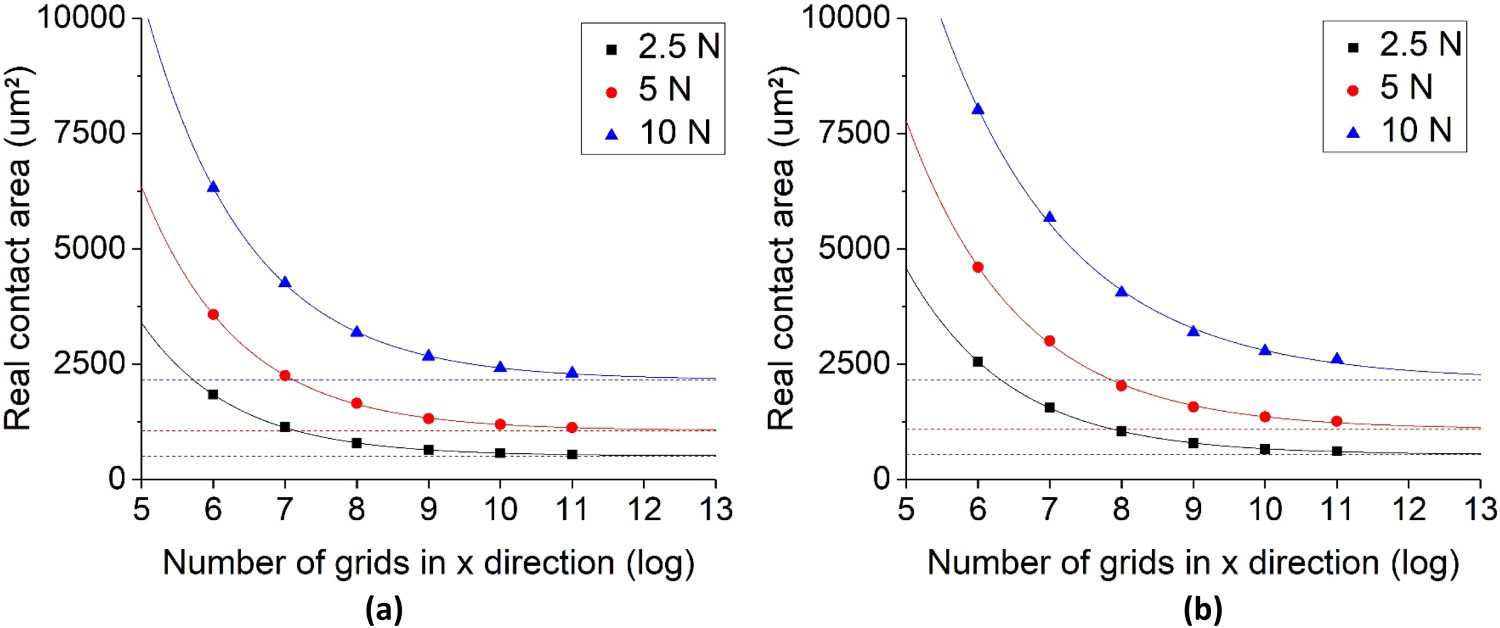
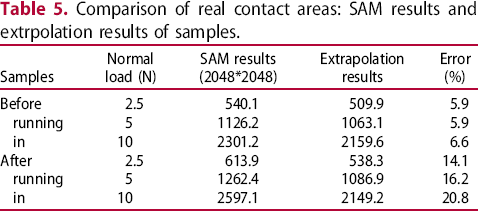
The extrapolation results confirm the concerns: for the case after the running in, the SAM results do not converge well even with the highest input resolution. This issue is particularly severe for the contact with 10 N normal load: the data point is obviously deviated from the converging line. A 20.8% of difference is observed between the SAM result and the predicted result of extrapolation.
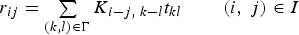
This phenomenon can also be explained by the over-covering effect. The contact pressure distributions of both cases with 10 N normal load are plotted in Figure 12 (2048*2048 in resolution). For the contact of samples after running in, the contact pressure distribution is more dispersed. This leads to more local contacts with very small contact areas. For these small local contact areas, the grid sizes being used are not small enough to precisely cover the boundary and therefore lead to a severe over-covering effect.
Contact pressure distribution of the samples: (a) before running in; (b) after running in.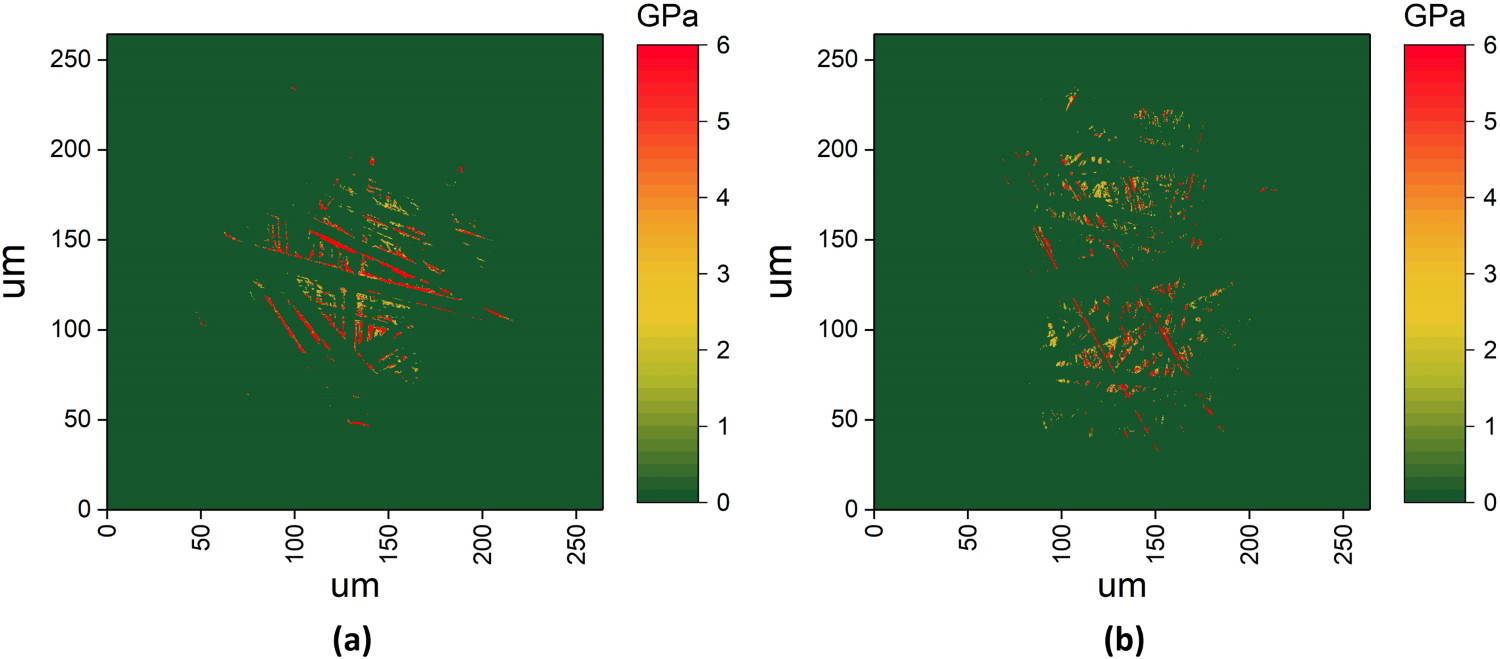
A close look at one of the local contacts is taken in Figure 13. The calculated results with different input resolutions (256*256, 512*512, 1024*1024, 2048*2048) are shown. These two adjacent contact areas are small in area (∼1 μm*1 μm). For the 256*256 case (Figure 13(a)), only two grids are included, which leads to a very coarse covering. A severe over-covering effect occurs and a very large error will occur. With an increase of input grid size, a finer and finer covering is achieved (Figure 13(b–d)). As can be easily seen, the calculated contact areas are decreasing. However, even in the highest resolution (2048*2048) case, there is still only a very limited number of grids included in the contact area, and the boundaries of contact are still relatively coarse. Therefore, the over-covering effect is probably still substantial. This causes the 20.8% difference between the SAM result and predicted result of extrapolation.
Local contact results calculated with different input resolutions: (a) 256*256; (b) 512*512; (c) 1024*1024; (d) 2048*2048.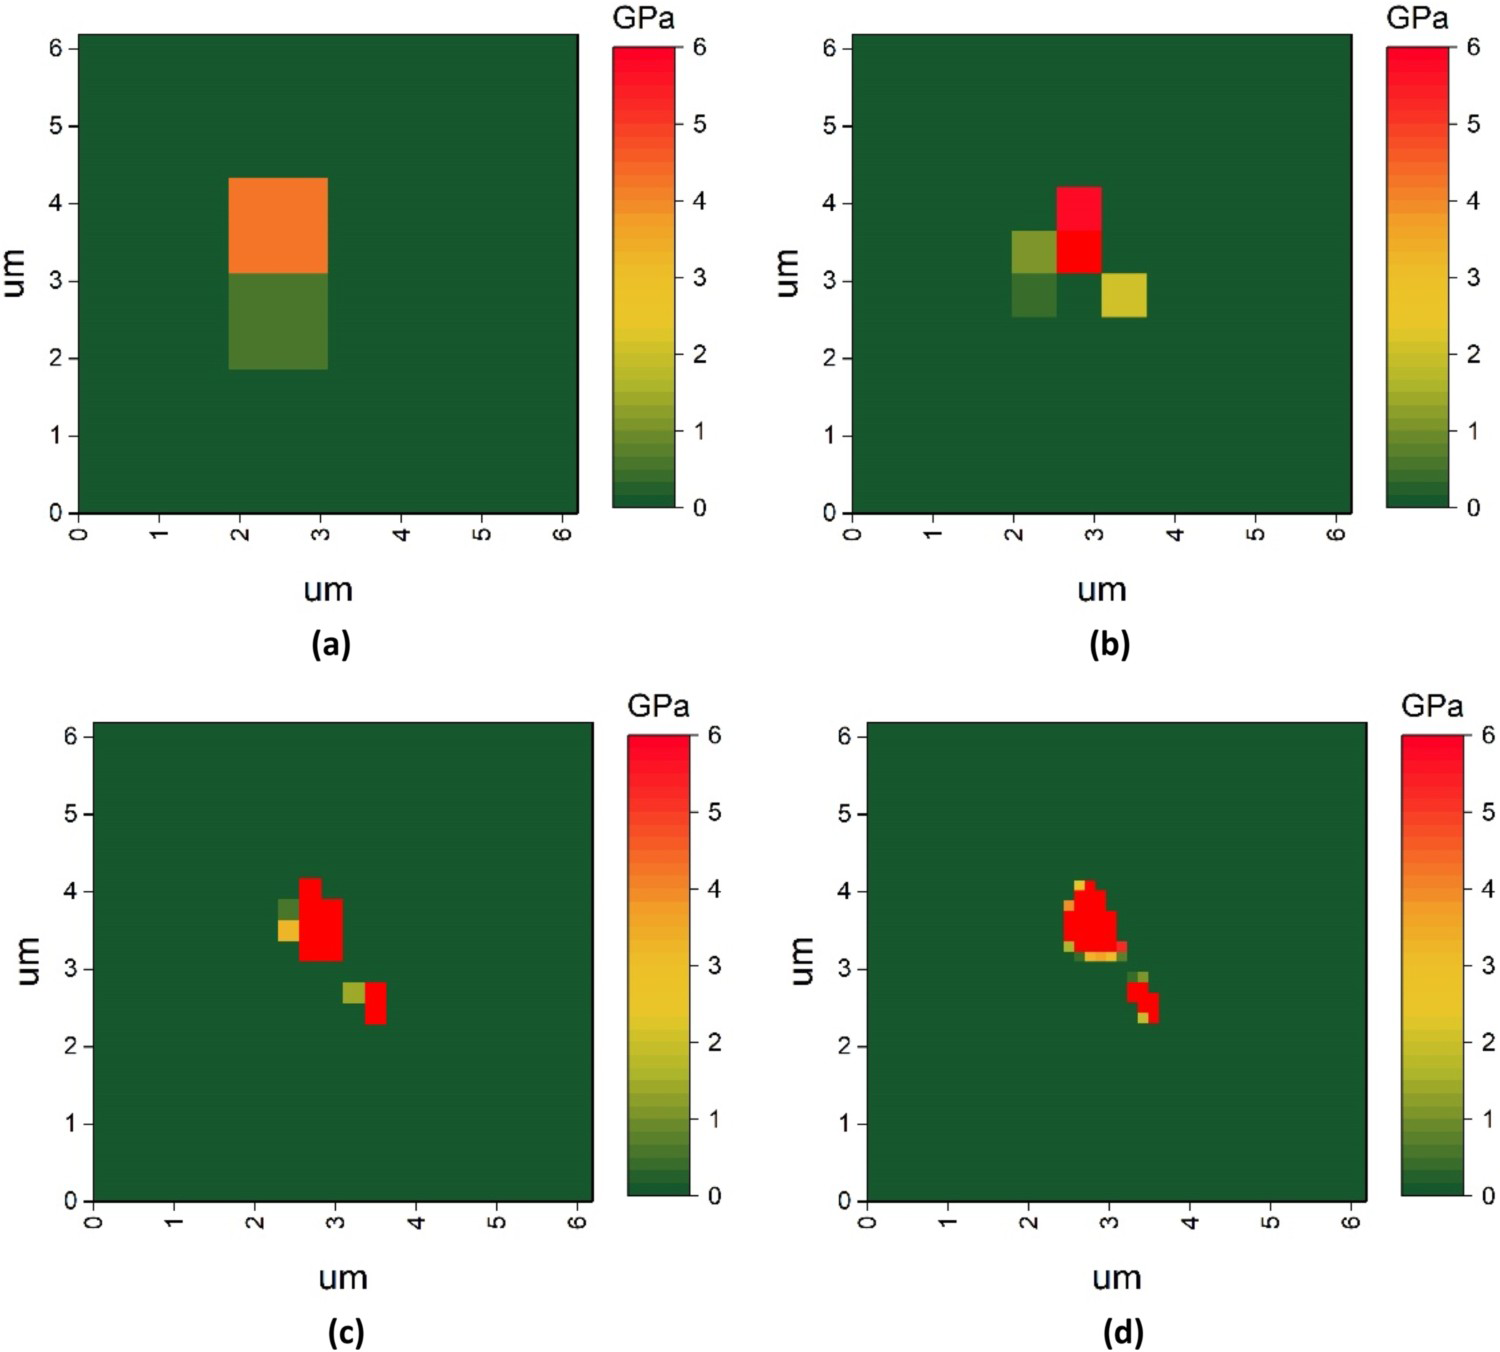
We have demonstrated, for the first time, the sensitivity of SAM results of rough surface contact to the resolutions of input. The primary conclusions are summarized below.
Compared to the maximum contact pressure, the real contact area results calculated by SAM are particularly sensitive to the input grid size of the surfaces. The converging rates of the real contact area results are significantly lower than the maximum contact pressure results. An over-covering effect occurs when SAM calculates the real contact area. This is the main reason for the high sensitivity of the real contact area results to the resolutions of input. The rectangle-shaped grids usually overly cover the boundaries of the contact area. The larger the size of the grid is, the more severe this effect will be. In real rough surface contacts, the ‘over-covering’ effect of SAM can be severe, especially in the cases where the contact pressures are distributed dispersedly. In these cases, local contact areas are quite small: similar or even smaller than the size of the grids. As a consequence, the calculated real contact area may significantly deviate from the real values. The exponential extrapolation can be employed to predict the real contact area, when further improvement the grid size of input is difficult. This method depends solely on the inputs, i.e. the calculation results from coarser meshes. Therefore, it is suggested that feasibly finer meshes should be used.
Footnotes
Disclosure statement
No potential conflict of interest was reported by the author(s).