
Abstract
Backward-masked primes presented outside conscious awareness can affect responses to subsequently presented target stimuli. Differences in response times have been used to infer a pattern of sub-threshold activation and subsequent inhibition of motor plans associated with the primes. However, it is unclear whether competition between alternative responses is fully resolved in the brain or whether activated responses can begin being executed before the final decision to act has been made. Here, we investigate the dynamics of responses evoked by masked primes using a continuous measure – voltage change in force-sensing resistors simultaneously in both hands. Masked primes produced the predicted pattern of motor activation and subsequent inhibition of the primed response. There is no evidence that the effects of masked primes interact with spatial compatibility (e.g., Simon) effects, suggesting separate mechanisms underpinning these effects. Moreover, masked primes evoked partial motor decisions – measurable at the effectors as small amounts of erroneous response – which were usually rapidly corrected. Together, these errors and fast corrections question the ‘sub-threshold’ nature of responses evoked by masked primes and provide important constraints on models of decision-making.
Keywords
Introduction
Backward-masked ‘prime’ stimuli can influence responses to subsequent ‘target’ stimuli even when primes are not consciously perceived (for a review, see Eimer & Schlaghecken, 2003). Usually, such masked-prime stimuli give rise to a positive compatibility effect (PCE) – response times (RTs) are faster to targets preceded by a prime mapped to the same response (‘compatible’) relative to a neutral or opposite (‘incompatible’) prime. Intriguingly, when the interval between mask and target is extended (e.g., 100-200 ms), incompatible trials can produce faster responses than compatible trials – a counter-intuitive negative compatibility effect (NCE) (e.g., Eimer & Schlaghecken, 1998, 2002; Eimer & Schlaghecken, 2000, 2002; Klapp, 2005).
As long as appropriate stimuli are used (see Sumner, 2008), PCEs subsequently turning into NCEs can be explained by a sequence of automatic sub-threshold response activation evoked by the prime, which is subsequently suppressed (e.g., Boy & Sumner, 2010; Eimer & Schlaghecken, 1998; Schlaghecken &Eimer, 2002) before the motor response to the target is executed. Initially, the prime partially evokes its corresponding motor action, which results in faster RTs when that response is required to the target (thereby producing the PCE). Subsequently, when another stimulus is presented (i.e., the mask; see, for example, Boy, Clarke, & Sumner, 2008), the sub-threshold motor plan evoked by the prime is suppressed, and the alternative response is disinhibited. This suppression means that it takes longer to initiate the suppressed response relative to a disinhibited response, thereby producing the NCE. This pattern of PCEs subsequently turning into NCEs is linked to a tri-phasic pattern of response preparation reflected in lateralised readiness potentials (LRPs) (e.g., Eimer & Schlaghecken, 1998; Seiss, Klippel, Hope, Boy, & Sumner, 2014).
However, the fate of ‘sub-threshold’ (e.g., Seiss et al., 2014) motor responses evoked by masked primes is not clear. Are partially programmed responses entirely inhibited in the brain? Or might some response escape suppression and be measurable at the effectors? One way to estimate the latent cognitive processes underlying motor decisions is through application of mathematical decision models to RTs.
Bowman et al. (2006) proposed a model of the decision process in masked priming which conceptualised the response-selection process as a race between evidence totals, one for each of the possible responses (e.g., left or right button press). Like many decision models applied to a variety of tasks (see Smith & Ratcliff, 2004 for a review of different model types), Bowman et al.’s model assumes that either a response is executed once sufficient evidence has been accumulated or evidence does not reach threshold and no response is made. This all-or-nothing property of Bowman et al.’s model (and almost all other decision models, but see recent work by Servant, White, Montagnini, & Burle, 2015) assumes that competition between response alternatives is resolved in the brain before the response is made. Moreover, like many other models of decision-making, Bowman et al.’s model included a relative decision rule. That is, the threshold for response execution is based on the difference between the evidence totals: Once there is sufficiently more evidence in favour of a particular response over the other(s), that response is executed. Thus, the model also predicts that competing responses cannot be simultaneously activated – the evidence for both responses cannot simultaneously exceed that for the other by the criterion amount (see also Mattler & Palmer, 2012).
However, most methods used to infer response activation are not well-suited to detecting partial response activation, if it was present. For example, the binary nature of button presses means that either a button press is detected or it is not, and so small amounts of force applied to a button might escape detection. Some researchers have used LRPs as an electrophysiological indicator of motor preparation (e.g., Eimer, 1998). LRPs are calculated by subtracting the motor-related activity over one hemisphere from the other. As such, they represent differential activity recorded by electrodes located over left and right motor cortices (linked to the right and left hand, respectively) and so cannot show concurrent activation of competing responses from the left and right hand.
By using response force or electromyography (EMG) from hand muscles to provide a direct measure of response activation in the effectors, it is possible to measure response activation simultaneously in both hands more sensitively and directly than by measuring button press RTs or LRPs. These measures have revealed ‘partially’ executed responses when there is competition between responses (e.g., Burle, Possamaï, Vidal, Bonnet, & Hasbroucq, 2002; Eriksen, Coles, Morris, & O’hara, 1985; McBride, Sumner, & Husain, 2012) which are likely to have escaped detection by conventional measures such as button presses and LRPs. Findings such as these suggest that the concept of an all-or-nothing threshold used in models might not accurately reflect the dynamics of overt response execution (Servant et al., 2015).
To the best of our knowledge, this continuous approach to response measurement has not been applied to motor activation evoked by masked primes (except to study the automatic motor control in a very rare neurological patient with alien hand syndrome: McBride, Sumner, Jackson, Bajaj, & Husain, 2013). If masked primes produce overt responses, it will demonstrate that activity evoked by subliminal stimuli can flow all the way to motor execution and would strengthen challenges (e.g., Servant et al., 2015) to the widespread assumption of an all-or nothing threshold in decision models. Moreover, the temporal dynamics of such erroneous responses and how quickly they are corrected in a new task could yield important constraints for models of action decisions.
The present study
In this study, we simultaneously recorded voltage changes from force sensitive resistors from both hands as a measure of response to directly investigate the effects of masked primes on responses to targets at short (20 and 30 ms) and long (150 and 200 ms) mask–target stimulus onset asynchrony (SOA). This provides an opportunity to examine whether ‘sub-threshold’ responses, automatically activated by masked primes, are truly sub-threshold or whether they are measurable at the effectors on individual trials and to directly measure whether responses can be activated simultaneously.
Method
Participants
A total of 27 healthy adults (18 females; aged 18-35 years) participated in the two experiments (13 in Experiment 1 and 14 in Experiment 2) after giving informed consent. All participants self-reported normal or corrected-to-normal vision and right-handedness (Edinburgh Handedness Inventory; Oldfield, 1971).
Stimuli and apparatus
Stimuli were displayed on a 21-in cathode ray tube (CRT) monitor (1024 × 768) which participants viewed binocularly from a distance of 60 cm. Stimulus presentation was locked to the screen refresh rate of 100 Hz, using a PC running Presentation software (version 13.1; http://www.neurobs.com).
Primes and targets were left- and right-pointing white double arrowheads (e.g., ‘<<’ and ‘>>’) presented on a mid-grey background. The lines making up the primes and targets were each 1 degree of visual angle long and had an angular separation of 60° (30° above and below the horizontal). Masks were constructed of 30 lines – each with a randomly (within limits) and independently determined orientation (any orientation outside 5° of the lines making up the prime and target) and length (between 1.5 and 3 degrees of visual angle). A new mask was constructed on each trial to prevent perceptual learning of the mask (Schlaghecken, Blagrove, & Maylor, 2008).
Participants made their responses by squeezing one of two force-sensing resistors (FSRs; Interlink Electronics FSRTM 400). One FSR was held between the thumb and forefinger of each hand, and participants made their responses by making a ‘pinching’ action and then releasing their grip. Voltage signal from the FSRs was digitised and stored using a LabJack U3 HV data acquisition device with DAQFactory Express (version 5.82; Azeo Tech Inc.) software. Data were sampled at 1000 Hz.
Design and procedure
Before the experiment began, participants practised making responses while observing the output from the FSRs on a computer screen. In Experiment 1 (short SOAs), each trial began with presentation of a central white fixation cross (subtending 1° × 1°) on a mid-grey background for 500 ms. Following a blank interval of 200 ms, the prime appeared in the centre of the screen and remained for 20 ms when the prime was replaced with the mask. 20 or 30 ms after mask onset, the target appeared 5 degrees of visual angle from the centre of the screen (to avoid overlapping with the mask, consistent with earlier studies; e.g., Boy & Sumner, 2010) in a direction that was selected randomly and independently of other variables (e.g., prime or target identity) on each trial. Both target and mask remained on the screen until the mask had been present for 100 ms since its onset, when it disappeared leaving the target present for an additional 20 or 30 ms (see Figure 1). Participants were instructed to ignore the target’s position and to respond to the direction of the target arrow as quickly and accurately as possible using their corresponding hand. There was a blank intertrial interval (ITI) of 1500 ms before the next trial began.
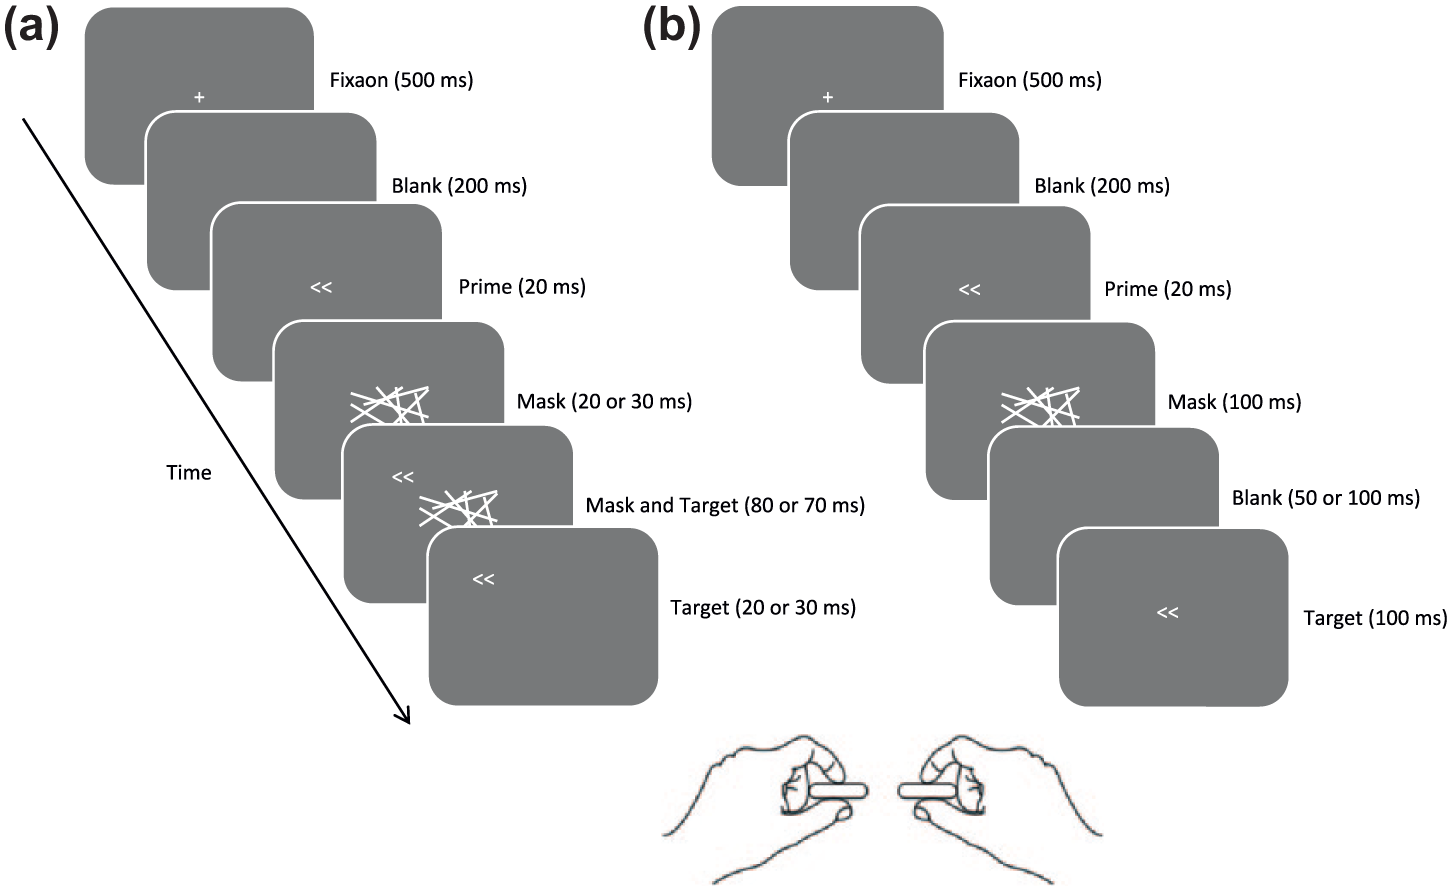
Illustration of the stimulus sequence and relevant timings in the masked prime tasks used in Experiments 1 and 2. As prime and target are associated with the same response, both trials shown are compatible trials. Participants made speeded squeeze responses according to the direction of the target presented on each trial (all trial types were equiprobable). (a) The trial sequence in Experiment 1 using short mask–target SOAs. The target arrows could appear anywhere on the circumference of an imaginary circle with a radius of 5° from the centre of the screen. The position of the target on this imaginary circle was determined randomly and independently on each trial. (b) The trial sequence in Experiment 2 using long mask–target SOAs. Note that in both experiments, the mask and target were each presented for a 100 ms.
Experiment 2 was very similar to Experiment 1 except that following the prime the mask was presented alone for 100 ms, and after a variable period (50 or 100 ms) in which the screen was blank, the target appeared in the centre of the screen for 100 ms (see Figure 1).
Two mask–target SOAs were used in each experiment (20 and 30 ms in Experiment 1 and 150 and 200 ms in Experiment 2) to increase the likelihood of observing reliable PCEs and NCEs. SOA was blocked within each experiment and alternated across consecutive blocks (which SOA was presented first was counterbalanced across participants). There was no reliable interaction between the effects of SOA and prime–target compatibility (all ps > 0.1) in either experiment, so analyses collapse across this factor.
Both experiments consisted of 12 blocks of 60 trials each (after practice), with rests between blocks. In each block, there were an equal number of trial types (compatible and incompatible trials with left and right targets) which were presented in a new randomly shuffled order for each block for each participant. No performance feedback was given.
Data analysis
Data recording and analysis followed methods similar to those reported in McBride et al. (2012). Voltage signal from the FSRs was locked to stimulus onset and epoched into periods of 2000 ms, beginning 500 ms before target onset. Data were smoothed using a simple 5-ms moving average to reduce high-frequency noise – we averaged the voltage recorded over five consecutive time points (the original data point and the two either side of it) and re-plotted this average. We repeated this procedure for every data point recorded on every trial, for each FSR separately. The resulting waveforms were baseline corrected on a trial-by-trial basis according to the average baseline activity for each response device during the 200-ms pre-prime blank period on each trial. A response (either correct or incorrect) was said to have occurred in a trial if at any point after stimulus onset until the end of the trial, the voltage measured was greater than 3 standard deviations (SDs) from the mean voltage measured during the pre-stimulus baseline period plus 0.05 V, 1 and that was followed by at least 18/20 points that also reached this threshold. Response onset time for each hand was defined as the first point in each trial which satisfied these criteria. Note that smoothing has the effect of slightly anticipating onsets for deflections, but this effect is small (up to 3 ms here) and equal across conditions.
Repeated-measures t tests revealed no significant effects of prime–target compatibility on correct response peak amplitude in either experiment (both ps > 0.1), so peak amplitude was not analysed any further.
Results and discussion
We found that the trials fell into three types:
‘Pure-correct’, in which correct responses were accompanied by no detectable error. These accounted for 90% of all trials from Experiments 1 and 2 combined.
‘Correction’ trials contained at least one correct and one incorrect response in the same trial (9% of all trials).
‘Pure error’ trials contained an incorrect response with no detectable correct response (1% of all trials).
Examples of these responses recorded on three individual trials are shown in Figure 2a to c.
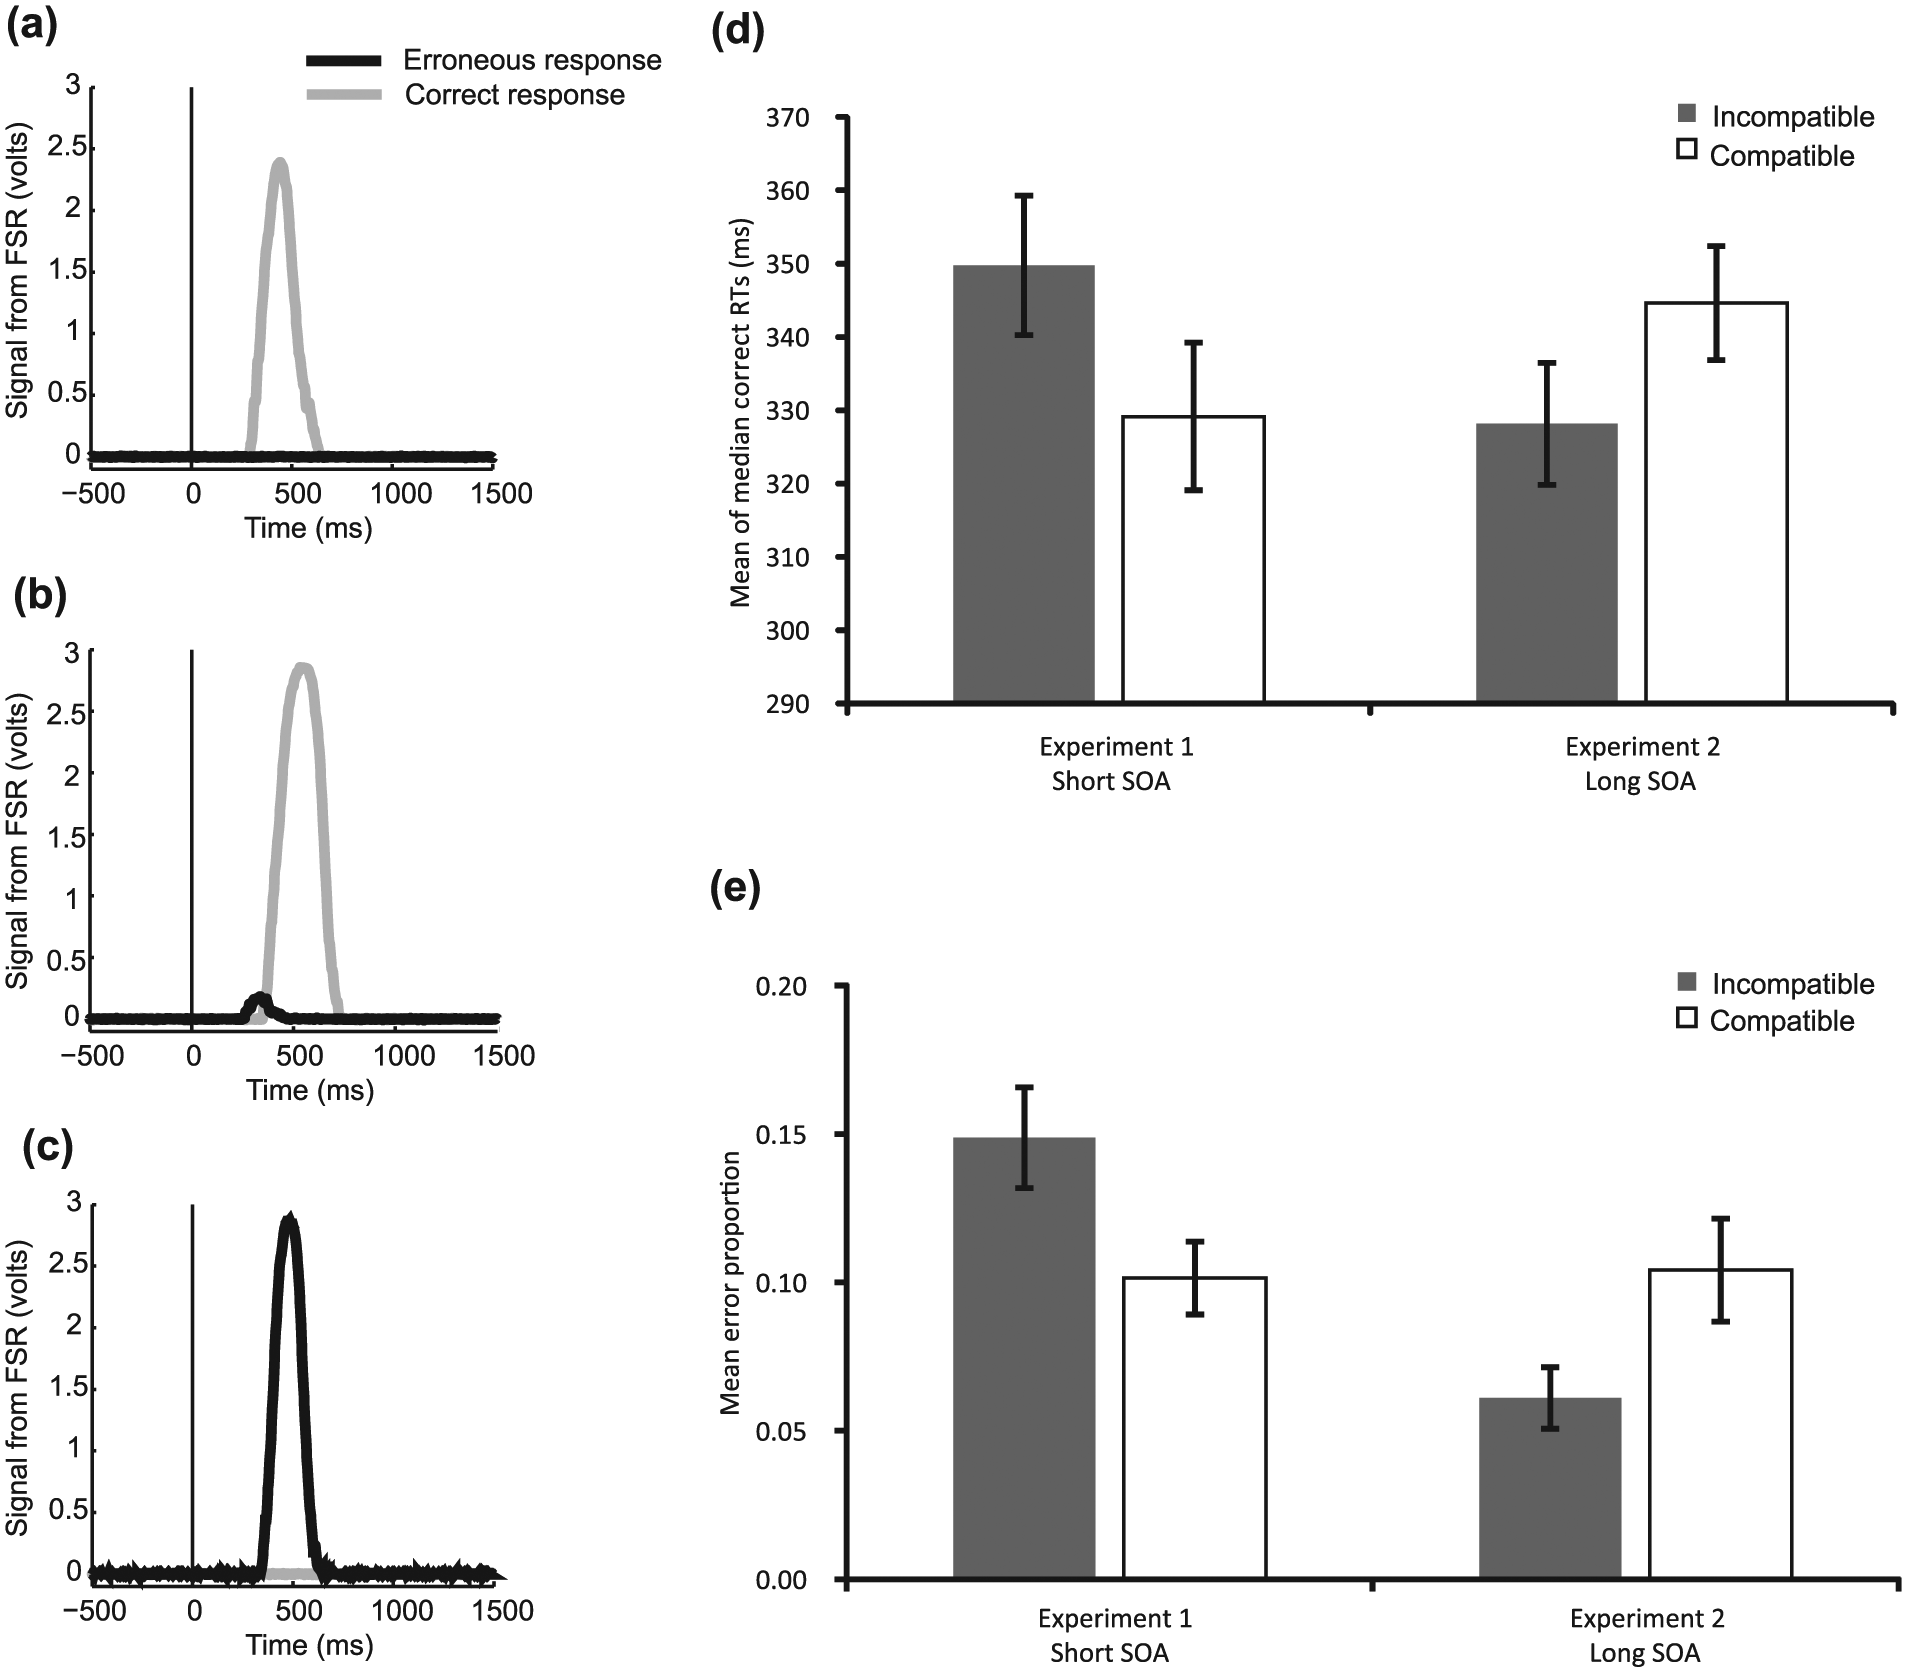
(a–c) Examples of the response recorded on individual trials of each type taken from one individual participant (selected arbitrarily). There appears to be more noise in trial (c) than (a) or (b). The reason for this is not clear – perhaps movement artefact from the participant – but this was temporary, not systematic, and did not affect trials in one condition more than another. The target appeared at time zero on the x-axis. (a) A trial where only a correct response was made – ‘pure-correct’; (b) An erroneous response followed by a correction – ‘corrected-error response’; and (c) Only an erroneous response – ‘pure-error’. (d) The mean of each participants’ median time to make a correct response (either a pure-correct or a correction) (e) The mean proportion of trials which contained an error (either corrected or pure-error) in each condition. PCEs were shown in both the RTs and error rates of Experiment 1, which were lower in the compatible compared to the incompatible condition (both ps < 0.01). NCEs were shown in both the RTs and error rates of Experiment 2, which were both lower for the incompatible trials relative to the compatible trials (both ps < 0.01).
Analysis of correct RTs includes correct responses from both pure-correct trials and corrections, and analysis of error rates includes erroneous responses from both correction trials and pure errors. The expected PCEs at short SOAs and NCEs at long SOAs were shown in correct RTs (see Figure 2d; Experiment 1: mean of participants’ median 2 PCE = 21 ms; F(1, 12) = 43.76, p < 0.01 and Experiment 2: mean of participants’ median NCE = 17 ms; F(1, 13) = 17.60, p < 0.01).
Direct evidence that masked primes evoke manual responses
In Experiment 1, significantly more errors were recorded on incompatible trials (14.1% trials contained an error) than on compatible trials (8.9% trials contained an error; t(12) = 5.83, p < 0.01). The opposite pattern was found in Experiment 2 (incompatible mean error rate = 6.3%; compatible mean error rate: 10.3%; t(13) = −3.36, p < 0.01; see Figure 2e). Many errors were small in magnitude (see Figure 2b, for an example) and might have escaped detection using button press measures. In both experiments, errors tended to occur early in the RT distribution (see Figure 3 for Conditional Accuracy Functions [CAFs]), with slower responses associated with near-perfect accuracy. This pattern is unlikely to result from fast guessing, which would have been expected to produce near-chance accuracy for both compatible and incompatible trials rather than the difference in error rates for compatible and incompatible trials shown here.
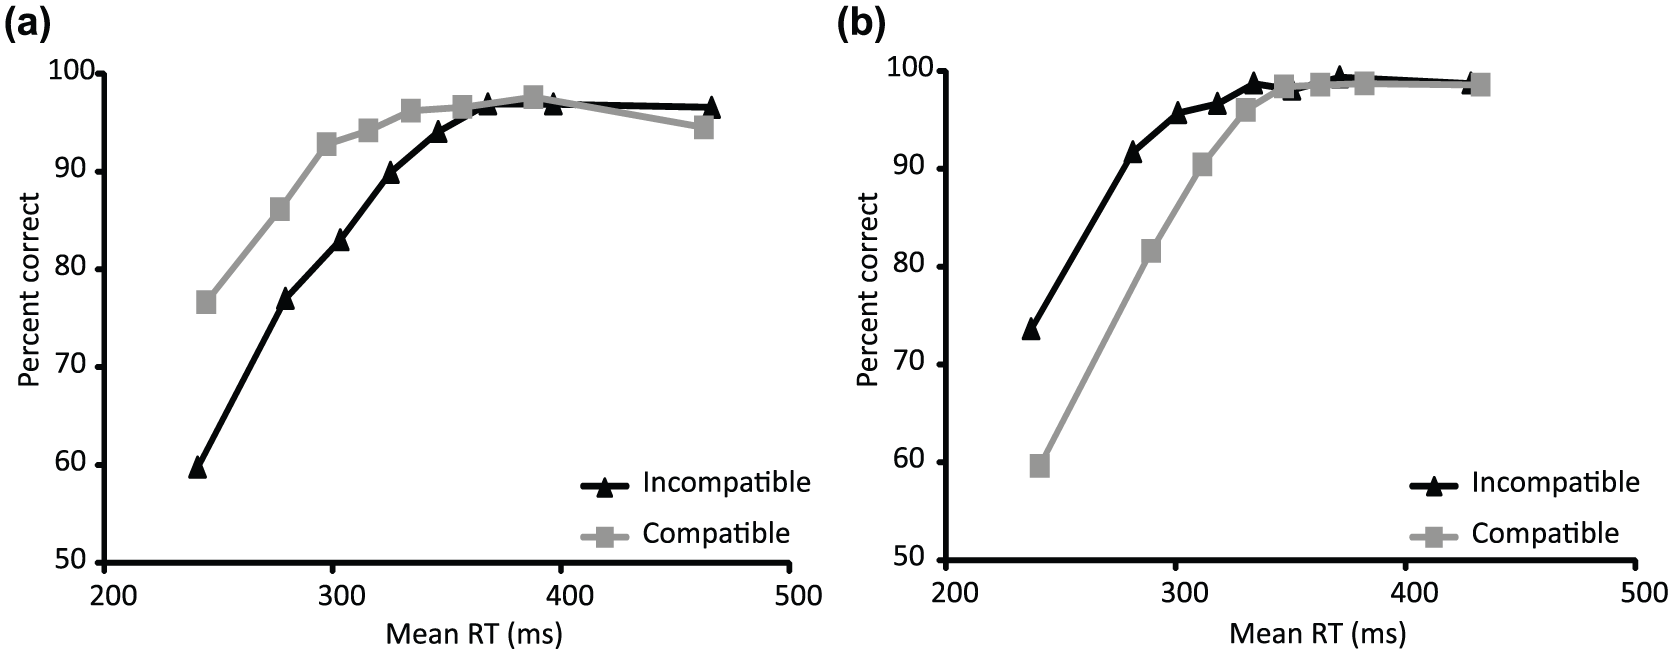
Conditional Accuracy Functions (CAFs) illustrate the increased tendency for fast errors to occur in response to targets preceded by (a) incompatible primes (black lines) in Experiment 1 using short mask–target SOAs and (b) compatible primes (grey lines) in Experiment 2 using long mask–target SOAs.
Spatial compatibility effects
Errors were more frequent in Experiment 1 than in Experiment 2 (see Figure 2d). This may be due, at least in part, to a Simon effect (see Lu & Proctor, 1995, for a review) in Experiment 1 that was not present in Experiment 2. In order to avoid targets overlapping with masks in Experiment 1, targets were presented 5 degrees of visual angle away from centre in a direction determined randomly and independently for each trial (consistent with previous studies; e.g., Boy & Sumner, 2010). As noted above, the position of the target was determined randomly and independently on each trial, and by chance, this will have produced some trials where the response required was opposite to the side the target was presented, potentially increasing the likelihood of error. Importantly, there was no systematic relationship between target position and target or prime identity, so it is unlikely that any Simon effect can account for the prime–target compatibility effects shown here (or the difference in these compatibility effects reported across experiments).
Nevertheless, to investigate the role of Simon effects in our data, we divided the possible target space into four quadrants with cut-offs at 45°, 135°, 225° and 315° (measured from the 12 o’clock position) and examined RTs and error proportions for targets whose location was ‘congruent’ with target identity (i.e., target position and identity were either both left or both right), ‘incongruent’ (target position was opposite target identity) or ‘neutral’ (target position was above or below centre). As target position was determined randomly and independently for each trial, targets were not equally distributed in each quadrant. In particular, there were around twice as many targets presented in the neutral (above and below centre) relative to the congruent and incongruent quadrants, so error rates were calculated as a proportion of the total number of trials in the spatially congruent, incongruent and neutral locations.
We found the predicted spatial compatibility and priming effects on the proportions of trials containing an error (Simon incongruent, prime incompatible = 0.24; Simon incongruent, prime compatible = 0.15; Simon neutral, prime incompatible = 0.14; Simon neutral, prime compatible = 0.09; Simon congruent, prime incompatible = 0.05; and Simon congruent, prime compatible = 0.03). A 3 (Simon congruency) × 2 (prime–target compatibility) repeated-measures analysis of variance (ANOVA) on the square-root arcsine-transformed error proportions revealed significant main effects of Simon congruency (F(1.18, 14.14) = 57.11, p < 0.001, Greenhouse–Geisser corrected) and prime–target compatibility (F(1, 12) = 58.52, p < 0.001) and no reliable interaction between these main effects (F < 1).
A similar pattern was shown for the correct median RTs (Simon incongruent, prime incompatible = 381 ms; Simon incongruent, prime compatible = 361 ms; Simon neutral, prime incompatible = 351 ms; Simon neutral, prime compatible = 330 ms; Simon congruent, prime incompatible = 318 ms; and Simon congruent, prime compatible = 305 ms). There were significant main effects of Simon congruency (F(1.15, 13.84) = 95.17, p < 0.001, Greenhouse–Geisser corrected) and prime–target compatibility (F(1, 12) = 32.58, p < 0.001) and no reliable interaction (F(2, 24) = 1.18, p = 0.33).
Thus, while Simon effects are present in the data reported in Experiment 1, there is no evidence that these effects interact with those of prime–target compatibility. This suggests that there may be independent mechanisms underpinning Simon effects and the effects of masked primes.
Competing decisions
Most trials containing an error also contained a correction (a correct response was detected on 87% of all trials which contained an error). We calculated ‘correction time’ as the time between the onset of the erroneous response and the onset of the correct response on correction trials. Importantly, error-corrections and pure-correct responses appear to form different distributions (see Figure 4), and corrections occur much sooner following an error (mean of each participant’s median = 145 ms) compared to how quickly pure-correct responses are made following onset of a target (mean of each participant’s median = 336 ms; t(26) = 13.74, p < 0.001). 3 Moreover, the distribution of corrected responses (green) is entirely contained within the distribution of standard correct responses (blue), rather than being a separate distribution of secondary responses.
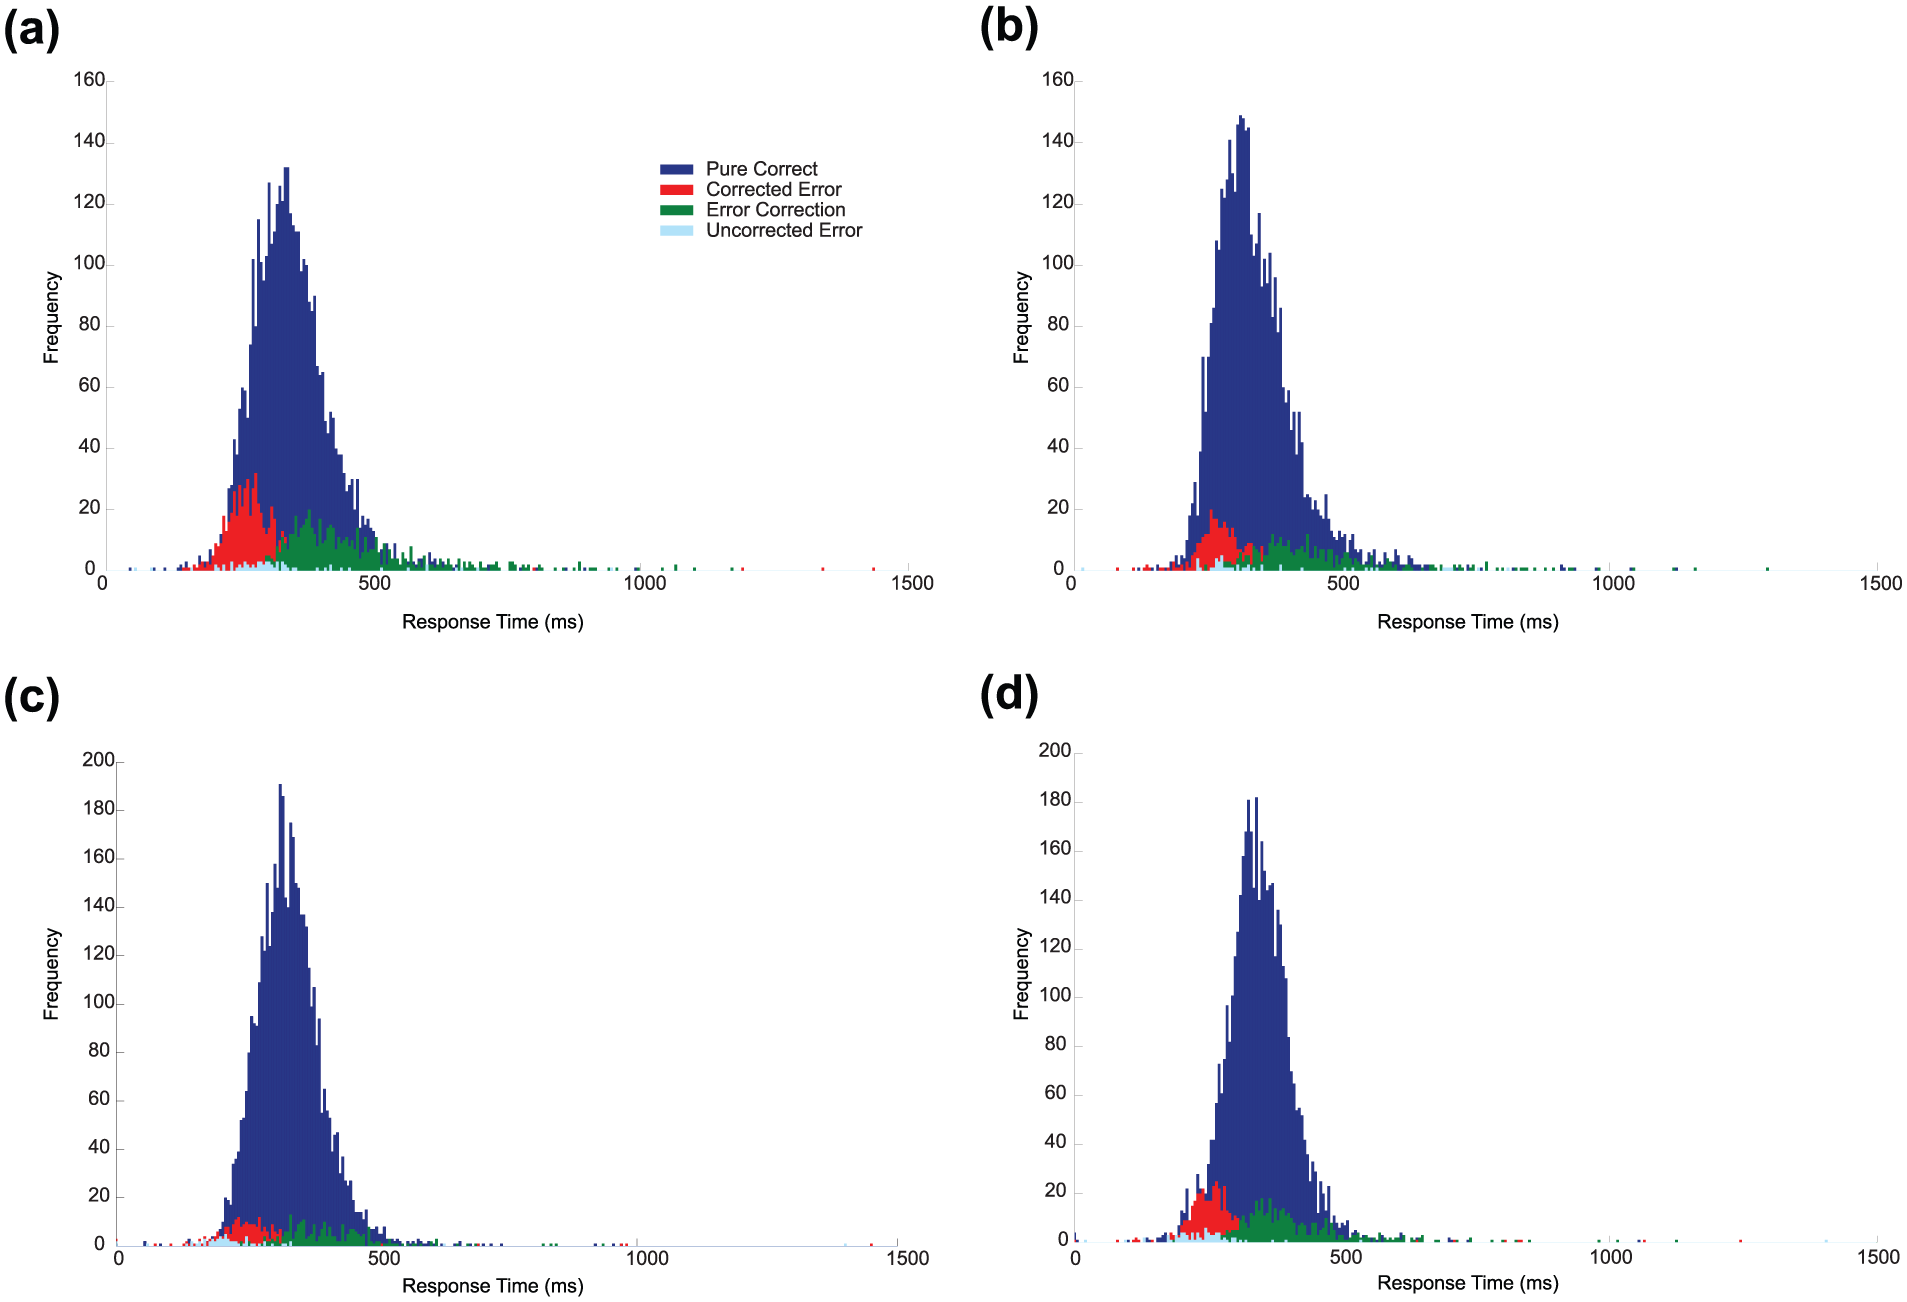
The response time distributions, collapsed across participants and experiments, for pure-correct responses (blue), correction responses (correct responses occurring on the same trial as an error; green), pure-error responses (turquoise) and corrected errors (red). Subplots show the responses to different trial types. (a) Incompatible trials in Experiment 1 (short SOA), (b) compatible trials in Experiment 1 (short SOA), (c) incompatible trials in Experiment 2 (long SOA) and (d) compatible trials in Experiment 2 (long SOA). The target stimulus appeared at time zero. In all cases, the distribution of erroneous responses overlaps with the early portion of the pure-correct response distribution. However, pure-correct responses and corrections appear to form separate distributions, with the correction response being made much more quickly following the erroneous response relative to how quickly pure-correct responses are made following onset of a target. Colour version of this figure is available online.
General discussion
Continuous voltage from the FSRs, recorded simultaneously from both hands, elucidated the dynamics of overt response execution during a masked priming task. This response measurement allowed detection of responses that were very small or overlapped with another response – both of which might have escaped detection with conventional button presses or LRPs. Errors in both experiments were largely confined to the fastest RTs (see Figure 3), with slower responses associated with near-perfect accuracy. Consistent with the usual PCE and NCE shown in RTs for short and long mask–target SOAs, respectively, errors were more frequent on incompatible trials at short SOAs (Experiment 1) and on compatible trials at long SOAs (Experiment 2). This suggests that the motor activation evoked by masked primes is not only ‘sub-threshold’, and instead that it is measureable at the effectors using sensitive response-measuring devices.
Sequential sampling models of two alternative forced choice (2AFC) decisions have been extremely useful in predicting the distribution of correct and erroneous responses in a variety of tasks (see, for example, Ratcliff & Smith, 2004). Bowman et al.’s (2006) model of masked priming successfully accounts for many of the effects reported in the literature. However, some aspects of this model, and sequential sampling models more widely, stop short of being able to explain the data presented here.
First, pervasive in models of decision-making is the assumption that either a response is wholly executed once sufficient evidence has been accumulated to reach a threshold or the accumulated evidence is not (yet) sufficient and no response is executed. This all-or-nothing property predicts that responses evoked by masked primes are ‘sub-threshold’ and that competition between alternative responses is resolved in the brain before any response is executed. However, some of the correct responses recorded here were preceded by an erroneous response (‘correction’ trials) which was often small in magnitude (see Figure 2b for an example). Thus, it appears that prime-activated responses are not simply ‘sub-threshold’ (e.g., Seiss et al., 2014). Consistent with our findings for priming, partial responses have been recorded in other tasks which evoke competition between alternative responses (such as the Simon task, e.g., Burle et al., 2002; Eriksen flanker, e.g., Eriksen et al., 1985; Servant et al., 2015; and object affordance, e.g., McBride et al., 2012) and so are not limited to responses evoked by stimuli that are not consciously perceived.
Second, most errors in our masked-priming experiment were followed by a correct response. The time taken to correct errors was short, and the average correction time was less than half that taken to make a pure-correct response, and not much more than the estimated motor output time for manual responses (around 100 ms) (e.g., Miller, Zanos, Fetz, Den Nijs, & Ojemann, 2009). This indicates that planning corrections may start before the first response is executed. This might appear incompatible with traditional models of decision-making containing antagonism between responses. As noted by Ratcliff and Smith (2004), in order for models to successfully predict behavioural data, they must include some form of interaction between competing evidence or activity favouring each outcome: They either require sufficiently more evidence in favour of one response compared to alternative responses (and each cannot simultaneously exceed the other by the criterion amount, such as in Bowman et al.’s model of masked priming) or evidence totals must mutually inhibit each other (as in accumulator-type models) (e.g., Usher & McClelland, 2001; see also Leach & Carpenter, 2001). This interaction or subtraction creates winner-take-all behaviour in a model so that competing responses cannot be simultaneously activated.
It is important to note that there is no evidence for entirely simultaneous responses in our data – the time between errors and their corrections was not zero (median correction time was 145 ms) and this might suggest that the two responses were activated sequentially. If the decision processes for a correction can occur fast enough in the non-decisional output time for the first response – in parallel with motor execution, but not with the preceding decision process – then amendments to current models would be sufficient to capture such behaviour. Servant et al. (2015) have recently presented a model of decision-making which can account for ‘partial’ responses recorded via EMG while participants responded with a conventional button press in an Eriksen flanker task. To account for their data, Servant et al. assumed more than one decision-criterion and allowed muscle activity to occur (and be measureable via EMG of the hand muscles) once the evidence for a particular decision had reached an ‘EMG bound’. From there, evidence accumulation continued until a standard decision threshold had been reached and a button press was executed. This allowed the brain to engage motor activity before a commitment had been made to a particular decision. This assumption of multiple decision criteria, in combination with assuming a variable drift rate for evidence accumulation, accounted for their Eriksen flanker data. A similar model incorporating multiple thresholds for engaging motor responses may also be able to account for the prime-related motor activity and rapid corrections recorded here.
One final possibility, which also goes beyond the assumptions of current models, is that a target stimulus initially elicits simultaneous activity for both responses before driving activity for the correct response. This would allow the first wave of motor activation elicited by masked primes to remain genuinely ‘sub-threshold’ and cross the threshold for a motor response to be engaged only after it is boosted by indiscriminate target activity. As the competing response has also received some activation following the appearance of the target, we might expect evidence for this response to rise-to-threshold quickly and result in the fast corrections which have been shown here. However, it is not clear how such a mechanism could account for the erroneous partial responses evoked by incongruent trials in other conflict tasks – such as those reported via EMG in an Eriksen flanker task (e.g., Servant et al., 2015).
Continuous response measurement
As noted in the ‘Introduction’ section, the usual response measures employed in conflict tasks – button presses – are not well-suited to detecting partial response execution, if it were present. Measuring response with squeezable devices in the present experiments meant that we detected an error on around 10% of all trials across the two experiments and conditions, which is somewhat higher than typically reported in masked priming tasks employing button press responses with similar stimuli (see, for example, Eimer & Schlaghecken, 1998). This apparently higher error rate is likely to be because the continuous response measure we used here is more sensitive than conventional button press responses – we can detect small amounts of erroneous response which might have been insufficient to be measured had we used a button press. Researchers using other continuous measures of response such as EMG report still higher error rates on other conflict tasks (e.g., Servant et al., 2015, report partial EMG errors on around 20% of trials in an Eriksen flanker task). This may be due to differences in the nature of the tasks used, but it is also likely that EMG provides an even more sensitive measure of motor and that as small amounts of EMG activation may not produce any detectable change in force. In any case, it is clear that continuous measures of response, such as voltage signal from the FSRs, or EMG, can elucidate richer response data than traditional button press or LRP measures.
Conclusion
In summary, grip force measurements provide a sensitive means of detecting erroneous response activity, and here they challenge the assumption that motor responses automatically evoked by masked primes are ‘sub-threshold’. In particular, the measurement of small errors and error-corrections has extensive application to other tasks used to study motor activation and control and has wider implications for models of decision-making.
Footnotes
Declaration of conflicting interests
The author(s) declared no potential conflicts of interest with respect to the research, authorship and/or publication of this article.
Funding
This research was supported by The Wellcome Trust: WT086453MA.