
Abstract
The parameters of the solidus and liquidus phase transitions for TaCx, HfCx and ZrCx are studied using a laser heating technique. A special emphasis is given to the accurate measurement of temperature and determination of spectral emissivity in course of the laser heating using advanced multichannel pyrometry. The phase transitions corresponding to the solidus and the liquidus are determined by means of the laser-probe reflectometry and by the peculiarities in the behaviour of spectral emissivity in the vicinity of the phase transitions and by the high-speed video recording of the melt formation and freezing. New data on solidus and liquidus parameters for the Zr–C system in the homogeneity domain (solid solution) are presented. The temperatures of congruent melting of super-refractory carbides TaC and HfC are determined along with the data on their solidus and liquidus lines close to the composition of congruent melting.
Introduction
Melting behaviour of non-stoichiometric carbides of tantalum and hafnium remains one of the most challenging tasks in the high-temperature materials science despite the fact that the first melting studies of these compounds are dated back to the beginning of the 1960s. However, the data on melting points of tantalum and hafnium carbides in the vicinity of their homogeneity domain is still very contradictory. The same can be said also about zirconium carbide – a more studied compound, which makes him a sort of a reference material for testing the method of investigation since its melting point is substantially lower. However, even for this material, the data on its solidus and liquidus parameters looks very incomplete and needs to be clarified.
Speaking about the most relevant studies of melting behaviour of the most refractory carbides one should firstly mention the very detailed study of Rudy [1] and that of Andrievsky et al. [2]. Here it should be noted that in both papers, as well as in all the similar studies of that time, the measurements were performed using the so-called Pirani method [3], which is actually nothing else but just the use of the direct Ohmic heating of a rod-shaped sample up to the melting temperature. The melting onset is defined by visual inspection of the blackbody hole in the sample through the optics of the disappearing-filament optical pyrometer. As for the pure metals, this procedure leads to the very adequate results but it does not look that straightforward for the incongruent melting of the non-stoichiometric carbides. In fact, the authors [1] having used the Pirani method described melting in terms of ‘incipient melting’ or the ‘collapse’ of the sample. Apart from the fact that these observations could be very subjective, their relation to the solidus and liquidus transitions looks highly ambiguous. If incipient melting could be associated with the solidus transition, collapsing of the sample could take place in general at any temperature above the solidus.
A new surge of interest in super-refractory carbides rose again about 10 years ago within the challenging task of the development of new ultra-high temperature ceramics (UHTCs). In addition, it is noteworthy that at the same time emergence of the laser heating technique have opened the new perspectives for studying incongruent melting of ultra refractory substances. Probably the first successful application of laser heating for melting of non-stoichiometric substances was reported in ref. [4] as applied to the superstoichiometric uranium dioxide (UO2+x). Later, the same method was used for investigation of solidus and liquidus of ZrCx in the vicinity of its homogeneity domain [5]. However, if the liquidus data of [5] was in a reasonable accordance with the current view of the Zr–C phase diagram [6] the solidus data revealed to be not very satisfactory. Quite recently the same method and apparatus were applied for melting point measurements of the most refractory carbides: HfC and TaC [7]. The fixed compositions carbides: HfC0.98 and TaC1.0 were used for measurements. If the reported in [7] melting point of HfC0.98 of 4232 ± 84 K turned out to be close to the most of the earlier measurements by the Pirani technique, the value for TaC1.0 appeared to be much lower than obtained previously by a conventional technique. Thus, one can conclude, that whereas [5,7] clearly demonstrated the potential of the laser heating method for investigation of the phase diagrams of the UHTC carbides they also outlined two major problems. The first one is obviously the temperature measurements, since apart from the extremely high melting temperatures the valid and reliable values of spectral emissivity in the domain of the melting point are strongly required. The use of literature values of emissivity for the sintered carbides having very wide data scatter and being usually limited to ca. 3000 K can possibly lead to considerable temperature errors, which rise linearly with temperature. Therefore, since emissivity generally depends not only on temperature but also on the state of the surface, its value has to be defined in situ in the domain of the relevant phase transition. The second basic problem is identification of solidus and liquidus phase transitions in course of laser heating. As the liquidus can be detected by the temperature plateau or the sharp inflection on the cooling flank of the thermogram the best way to detect solidus is the temperature rising flank [4]. However, as it is shown in [8] by the computer modelling of the laser melting of the Zr–C system the solidus transition does not result in any peculiarity on the thermogram as a consequence of a particular temperature dependence of enthalpy. Therefore, the only way of the solidus detection is the application of the advanced optical methods.
The above arguments constituted the basis for the formulation of the requirements for the experiment in the present study.
Experimental
In the present work, the study of the solidus and liquidus parameters of ZrCx, TaCx and HfCx was carried out by the laser heating technique, which at the first glance looks very similar to that of [4,5,7]. The scheme of the experimental setup is presented in Figure 1. Heating of samples was performed by a 5 kW CW-laser (TRUMPF TruDisk 5003) with the wavelength of 1030 nm according to the arbitrary function. As a rule, heating pulses of about 1 s duration with a nearly linear power ramp were used, and at the end of the pulse the laser power was switched to the much lower level in order to control the cooling rate of the molten sample surface. The latter was necessary to prevent undesirable undercooling of liquid carbide and to achieve an extended plateau of crystallisation on the thermogram, which increased the reliability of measurement of the liquidus and/or eutectic temperatures. Laser radiation was focused into a spot of 4 mm in diameter; a CCD camera controlled the uniformity of the laser power density over the spot. The sample was placed into the sealed chamber, which was evacuated and then filled with high purity argon up to 2–3 bars. This procedure was repeated several times to remove any possible traces of oxygen.
General diagram of the experimental setup.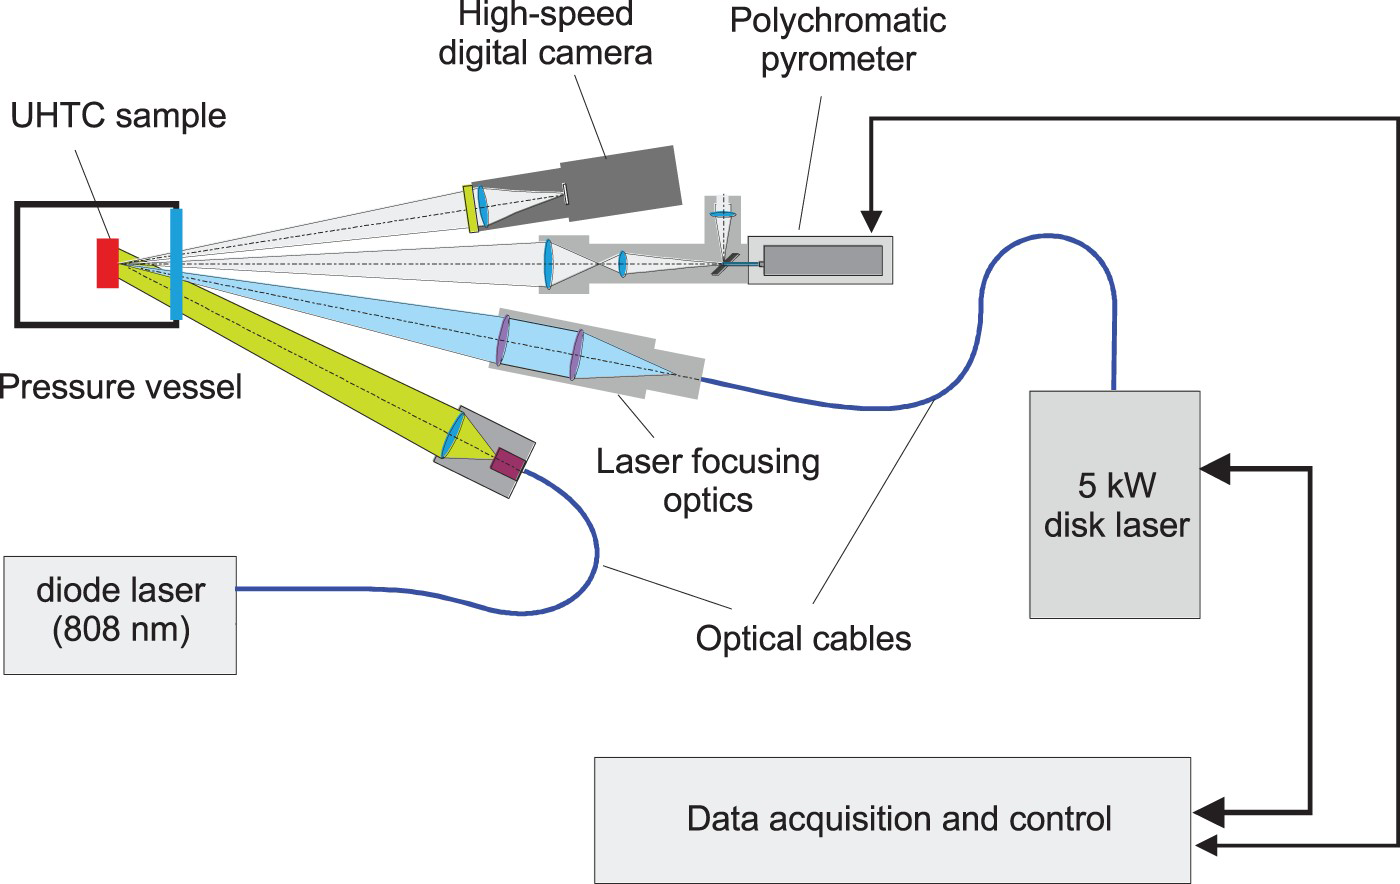
Identification of the solidus and liquidus transitions or the eutectic temperature (for compositions with x>1) were performed by the optical method; as mentioned above the use of only a thermogram for the study of incongruent melting was proven to be insufficient. Therefore, high-speed image acquisition of the surface was used (at a frame rate more than 1000 1/s). In order to get a clear image of the surface the heating spot was illuminated by a power diode laser (wavelength 808 nm). Thus, the sample's own thermal radiation was completely eliminated up to the temperatures significantly exceeding 4000 K. This high-speed image acquisition elicits appearance of traces of the surface melting, which corresponded to the solidus transition. As the temperature is increasing, the formation of a shiny mirror surface appearing when melting is completed, attributed to liquidus transition, is securely observed.
Particular attention was paid to the accurate temperature measurement. Here, the multichannel or polychromatic pyrometry was adopted for evaluation of a spectral emissivity in the course of the experiment and measurements of the true temperature. The basics of the method have been described elsewhere in [9,10] and the extended analysis of the numerical procedure by computer simulation of the ‘experimental’ spectrum was presented in [11]. Following recommendations of [11] an advanced ad-hoc polychromatic pyrometer is designed for measurement of spectrum within the range from 450 to 900 nm at up to 1000 spectra/s and it is characterised by the improved signal to noise ratio, linearity and stability. The sighting spot of the pyrometer is 0.25 mm, therefore, the spectrum of thermal radiation is measured from a quite isothermal area in the centre of the heating spot. The spectropyrometer is calibrated up to 3200 K against high-temperature blackbody; its temperature is controlled online by a precision reference pyrometer CHINO IR-RST-65H.
The true temperature and spectral emissivity are calculated by multiparameter non-linear fitting of spectral intensity I(λ,T), measured by the spectopyrometer in the course of laser heating. Spectral intensity can be represented by the product of the Planck function P (λ,T), which is uniquely determined by the temperature for the given values of λ, and the emissivity as I(λ,T)=ε(λ,T)·P(λ,T). The emissivity for each measured spectrum i can be described as a two-parameter function of the wavelength (for example, in the linear approximation as ε(λ,Ti) =ai+bi λ). There are two main reasons for description of the emissivity with two unknown parameters (a and b). Firstly, the number of parameters for the non-linear fitting should be kept as small as possible for the required high robustness of the analysis. Secondly, the two-parameter emissivity function itself must be set according to its expected physical behaviour. Usually, some a priori information about ε(λ) is available. For the studied carbides, we can rely on some values provided in the reference literature [12,13], although scanty and obtained by measurements not at that high temperature. In addition, we performed some measurements of spectral reflectivity at room temperature of the both sintered and resolidified samples in order to get more information about the wavelength dependence on the emissivity using the Kirchhoff law. It turned out, that both samples showed almost equal dependence on the wavelength, however, the absolute value of emissivity for the sintered sample was about 10–20% higher than for the melted sample. Based on the existing data one can easily come to the general conclusion that emissivity behaviour of the studied carbides is very similar to that of the refractory transitional metals. Therefore, first, the above-mentioned method of evaluation of the emissivity was checked using two well-studied metals: tungsten and tantalum. In the course of the first test, we evaluated the emissivity of the emitting surface of the standard reference tungsten band lamp. Using the linear function of the emissivity, which is the most reliable choice for this kind of materials in the pyrometer spectral range, an excellent agreement (within 1% at 2600 K) with the existing data on tungsten emissivity was obtained. The second test was a laser melting of tantalum made at nearly the same conditions as the laser melting of carbides. The results of the test are illustrated in Figure 2. The melting point is well pronounced as an extended plateau of crystallisation (Figure 2(a)). The freezing temperature 3300 ± 8 K revealed a rather good agreement (within 5 K) with the presently accepted data for the melting point of tantalum [14] whereas the emissivity data on solid tantalum at 2600 K stay within ±5% agreement with an existing literature data [15]. Since the spectral dependence of emissivity of the studied carbides is very similar to that of the refractory metals we believe that this kind of argumentation of the reliability of temperature measurements looks quite convincing.
Tantalum laser-melting test. (a) – thermogram, emissivity and the probe laser reflection vs. time, (b) – an example of evaluation of emissivity for a single spectrum below the melting point. A line of the probe laser at 808 nm indicates the diffuse reflection by a solid surface.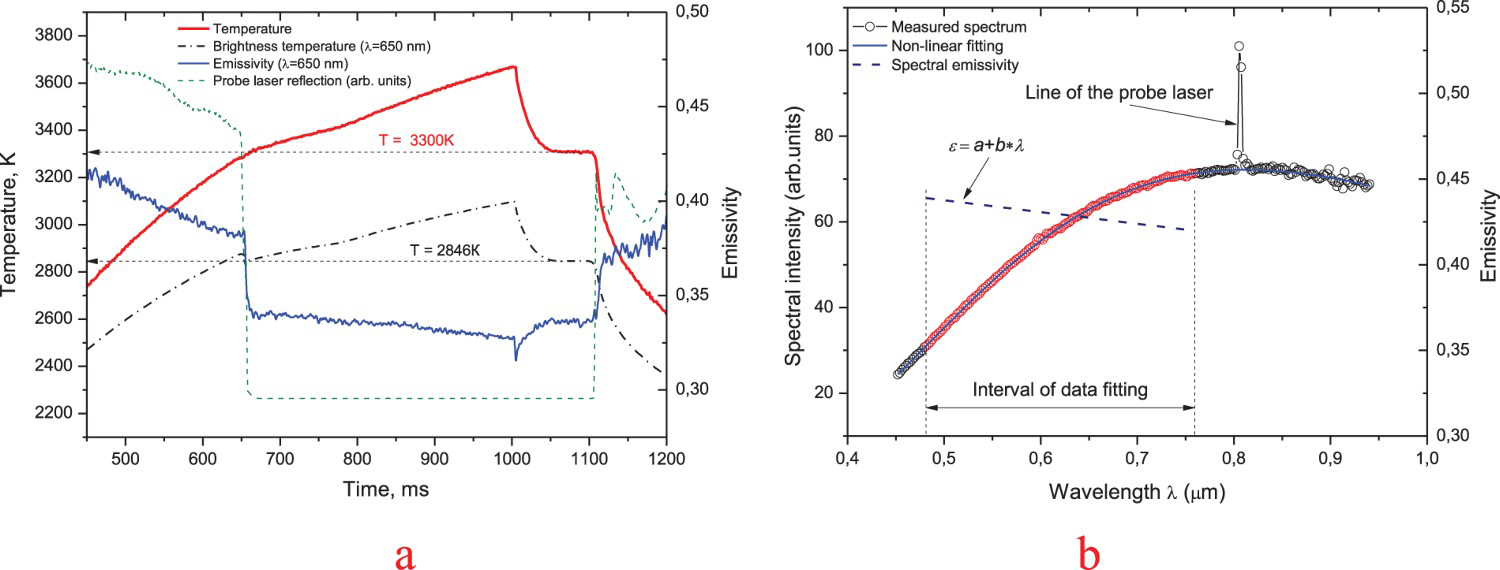
Results and discussion
The samples preparation
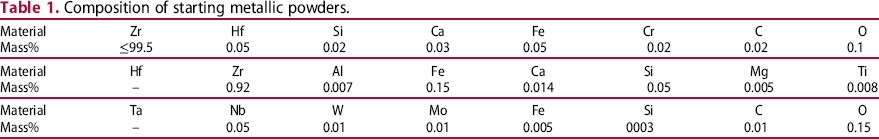
Composition of starting metallic powders.
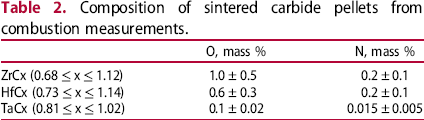
Composition of sintered carbide pellets from combustion measurements.
Melting experiments
During preliminary experiments for searching the best conditions for the solidus and liquidus detection, the test samples were exposed to the laser pulses of different duration and intensity. The latter resulted in reaching the different maximum temperatures during the laser pulse, the variable melting depth, etc. Finally, it became evident that liquidus transition can be clearly seen as a thermal arrest on the thermogram almost independently of a sample stoichiometry. This result was initially expected and it was well consistent with the computer code simulation [8] of the melting experiments. Since some other parameters than temperature were recorded during the laser pulse, like spectral emissivity, type of the surface reflection and the state of the laser heated surface (recorded by the fast camera), it was clearly detected that a very smooth mirror-like liquid surface was formed only when the temperature exceeded liquidus. In other words, the occurrence of the well-formed liquid layer at the ascending path of the thermogram indicated the liquidus transition but not the solidus one. From this point, the high reflective smooth liquid surface remained until the end of the freezing arrest at the temperature descending.
The solidus transition cannot be noticed as distinctly as liquidus but it emerges at the temperature rise as a kind of a noticeably appearing disturbance in the centre of the heating spot, which is clearly visible on the high-speed video recording. At the same moment, spectral emissivity (evaluated from the recorded spectra) starts to decrease indicating the incipient formation of the liquid phase. Of course, since the solidus transition is not as evident as the liquidus one the scatter in the solidus data is larger. It is especially relevant to the domains of a rather steep solidus line vs. temperature at the vicinity of the stoichiometric MeC and at the metal reach boundary of the solid solution.
An example of the recorded temperature and spectral emissivity during laser melting is presented in Figure 3(a) for the nearly congruently melted ZrC0.9 and in Figure 3(b) for the ZrC0.76 showing a well-pronounced solidus transition. Figure 3(a) also shows a diffused reflection of the probe diode laser detected by the polychromatic pyrometer. Here, the instant drop in the reflection corresponds to the formation of the well-formed liquid. As for the emissivity, at almost the same moment it decreases abruptly reaching a constant value at the instant of formation of the smooth liquid. This fast evolution of emissivity produces a certain disturbance on the true temperature thermogram, which does not have a clear physical ground but just a result of a limited time resolution of the polychromatic pyrometer against the instant appearance of liquid. The thermogram in Figure 3(b) illustrates a typical small decrease in emissivity for the melting of the ‘non-congruent’ sample, which outruns formation of the smooth liquid and serves as indication of the solidus transition.
ZrC thermogram, emissivity and the probe laser reflection vs. time; (a)- congruent melting of ZrC0.9, (b)-incongruent melting of ZrC0.76.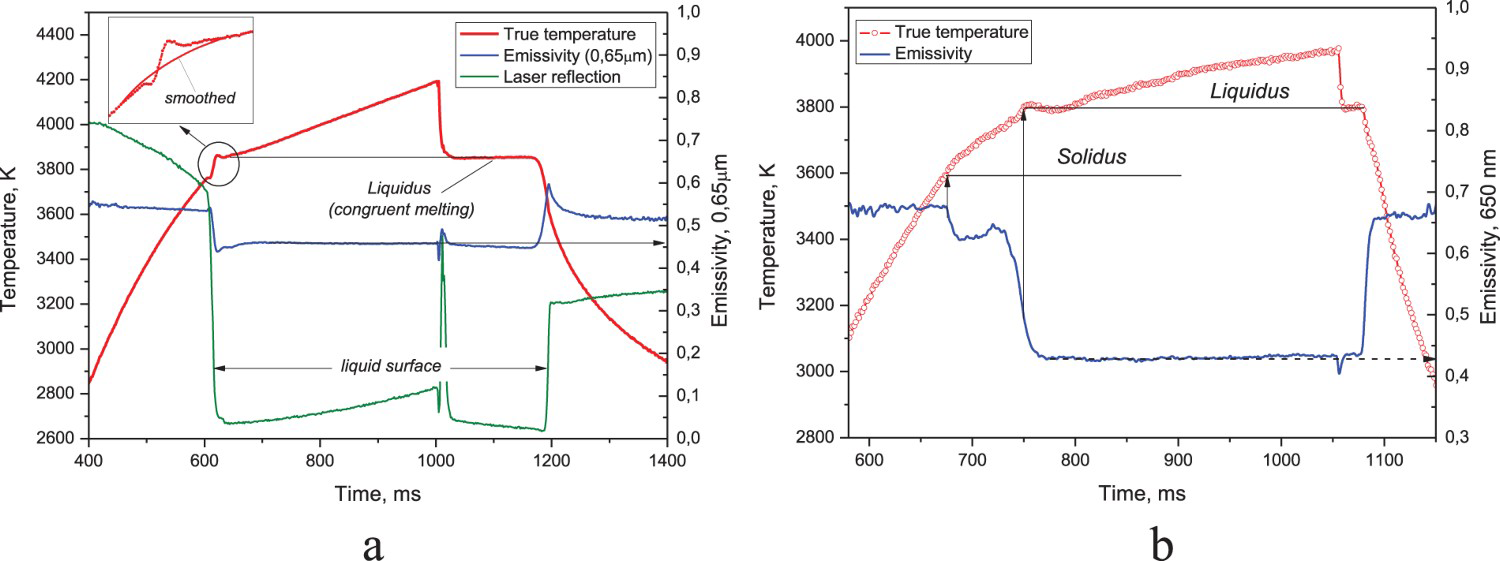
Melting data of a number of carbides is given below.
ZrCx
Most of the melting experiments were performed on the samples preliminary treated up to the temperature, just slightly exceeding liquidus for a given composition to form the dense pre-melted and solidified surface serving to increase reproducibility of the experiments. However, for the ZrC1+x sample, a few tests were made with the laser power gradually increasing from pulse to pulse so that the eutectic temperature could be measured also without formation of the complete surface melt. The evaluated solidus and liquidus temperatures are presented in Figure 4 together with one of the lately adopted phase diagrams of the Zr–C binary system [17]. It is evident, that the measured melting points comply with a modern view of the Zr–C phase diagram including one accessed in [6]. However, the measured melting temperature corresponding to the expected ‘congruent’ composition is much higher (by ca. 150 K) than recommended in [6]. It remains within the upper boundary of the results obtained previously by the conventional technique. Comparison with the recent laser-melting data [5] reveals a significant disagreement, well seen in Figure 4. Here, apart from the observable difference in temperature the trend of solidus temperatures in [5] looks very peculiar and in the expected domain of the congruent melting show almost 200 K difference with the liquidus points. As for the one measured composition – of 53 at % of carbon – lying within the domain of non-homogeneous ZrC–C mixture, the obtained eutectic temperature of 3160 ±10 K revealed an excellent agreement with a precise value 3155.0 ± 1.8 K of [12]. The latter result also confirms the functionality of the adopted method of true temperature measurements and evaluation of emissivity. Here, for example, it can be also noted that the emissivity of liquid ZrC remains almost constant within 300 K and more above the melting point, which can be seen in Figure 3(a,b).
Zr–C system, results of measurements in comparison with the most recent data.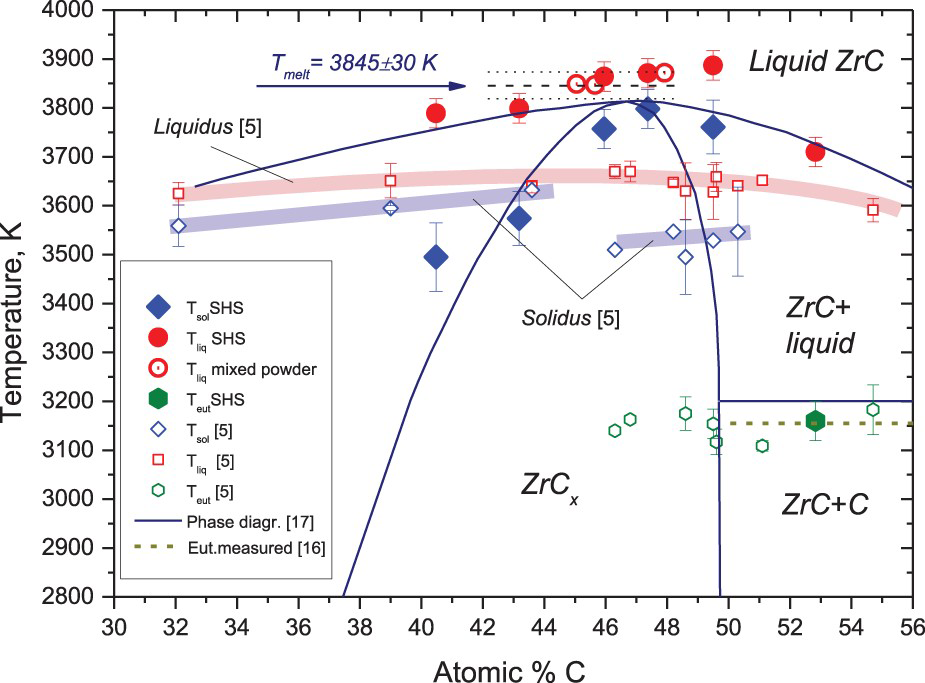
HfCx
Hafnium carbide behaviour at high temperatures has many similarities with zirconium carbide, however, its melting temperature is by far higher. The results of the present study are provided in Figure 5 in comparison with the Hf–C phase diagram according to Rudy (1965) [1]. The obtained melting temperature is equal to 4250 ± 20 K, which is well consisted with 4232 ± 84 K measured recently by laser melting [7] for the similar composition (C/Hf = 0.98). It should be noted that there is an appreciable difference between the measured solidus temperature and the solidus proposed in [1] for the metal-rich boundary of the solid solution domain. However, as it is admitted in [1] it is difficult to observe incipient melting in this region. Therefore, the reported discrepancy between our data and that obtained in the first half of the 1960s by visual observation of incipient melting should not be that discouraging. It is also important that as in the case with ZrC a very good agreement was found in the presently measured HfC–C eutectic temperature of 3466 ± 10 K and the value 3458.5 ± 2.5 K of [12].
Hf–C system, results of measurements in comparison with [1].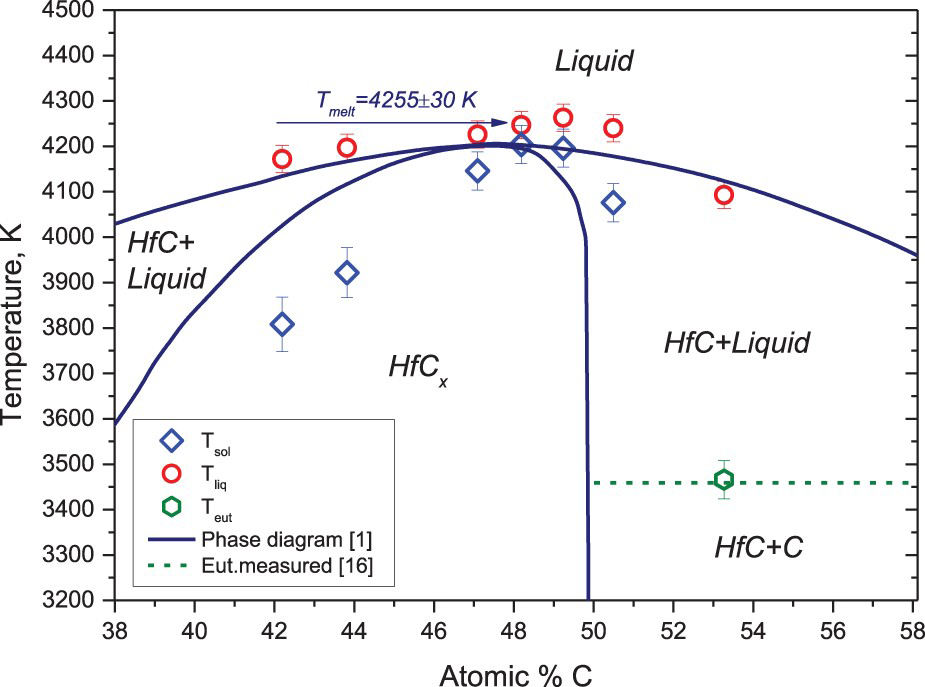
TaCx
Tantalum carbide melting temperature reveals a much larger discrepancy than of zirconium and hafnium carbides. In the most studies, for example in [1,2] its melting temperature turned out to be somewhat higher than of HfC. However, the value of 4041 ± 77 K reported in the above-cited laser melting study [7] for the stoichiometric composition is by almost 200 K less than observed earlier.
The present experimental results for the tantalum carbide are shown in Figure 6. Here, the solid lines correspond to the diagram suggested in [1] and the dashed lines represent their possible correction according to the present results. The value of congruent melting temperature of 4277 ± 12 K revealed to be in a good accordance with the most of measurements; however the corresponding composition is shifted towards the stoichiometric value.
Ta–C system, current data on a phase diagram [1].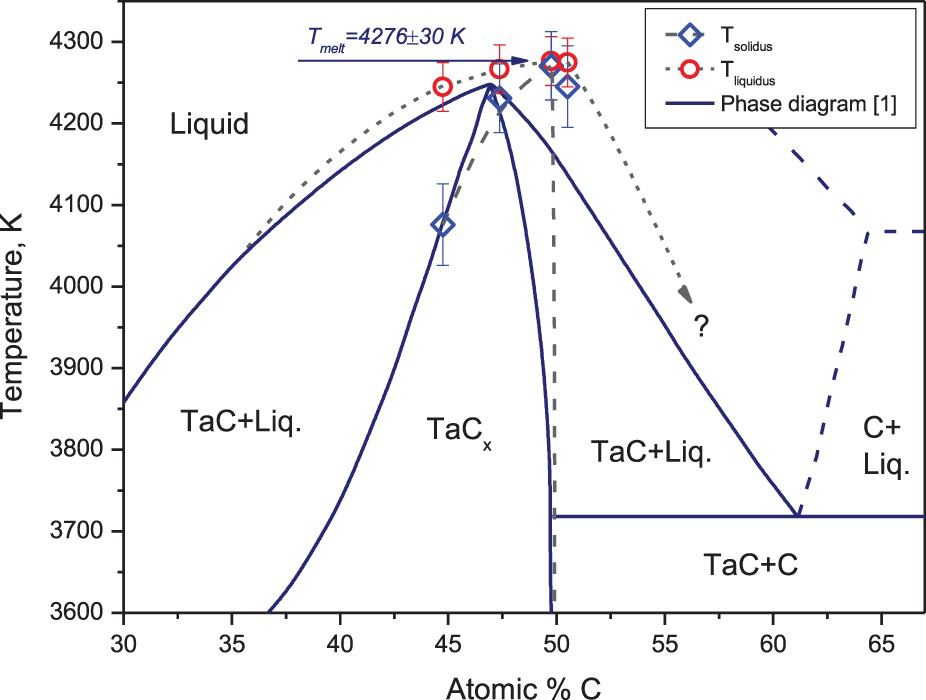
SEM image of the solidified surface of TaC0.95 sample and of the broken sample is shown, respectively, in Figure 7(a,b). In Figure 7(a) one can see a dense melted layer with a depth of about 200 μm with a well-formed dendrite structure. The surface remains rather flat (Figure 7(b)) even after several successive laser shots.
SEM images the solidified melted zone of TaC0.95 sample. (a) – cleaved solidified melt, (b) – sample surface after melting.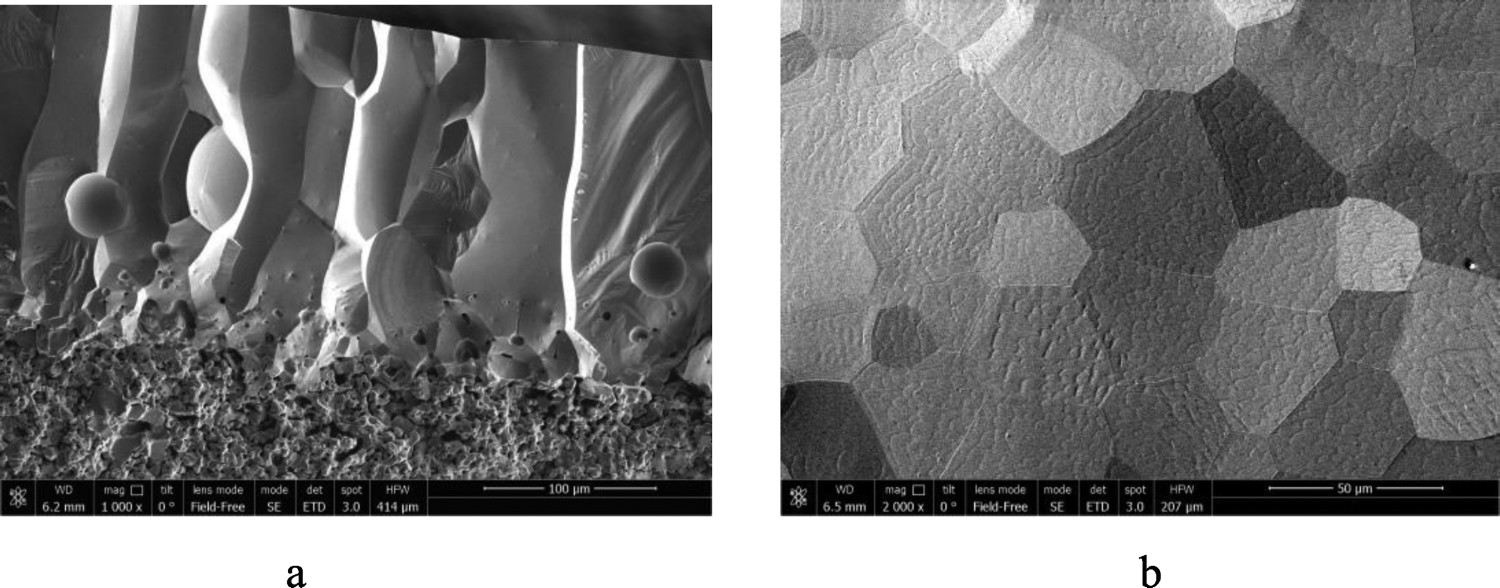
The cross-sections perpendicular to the surface of the TaCx specimens were examined by the SEM-EDAX analysis in order to detect if any difference in composition occurs upon melting between the original sample bulk and the solidified molten layer. The C/Ta ratio was measured at several zones in the sintered sample bulk beneath the molten surface and in various zones within the molten layer. No systematic difference in the composition was detected within the usual data scatter.
It must be mentioned that in the present study the TaCx sample's solidified zone was examined also by XRD. It turned out that variation of the lattice parameters with the composition was well consistent with the average literature data. This can additionally confirm the adequacy of the Me/C values to the measurements of solidus and liquidus for all three measured carbides despite the appreciable scatter of the literature data on the lattice parameter. However, since this dependence for TaCx is almost perfectly linear across the solid solution domain and looks to be more reliable than for the ZrC and HfC, we believe that the above-mentioned relation can be presently applied only for additional confirmation of the composition conformity between the starting TaCx and the solidified melt.
Concluding remarks
The work results confirm that the laser-melting technique could be successfully used for the investigations of the very high-temperature phase transitions in the UHTCs with the highest melting temperature. In most cases the obtained data are well consistent with the results of solidus and of eutectic temperature by conventional techniques (e.g. by Pirani method). However, in case of the laser-induced melting both solidus and liquidus phase transitions could be investigated simultaneously. One of the most sensitive aspects of this kind of measurements is a specimen composition (the Me/C ratio), which nowadays can be reliably controlled only by the chemical methods (for example, using a combustion technique) while the congruency of the compositions of the solidified melt with the starting material can be confirmed by the EDAX analyses.
Footnotes
Acknowledgement
This paper was originally presented at the Ultra-High Temperature Ceramics: Materials for Extreme Environments Applications IV Conference (Windsor, UK) and has subsequently been revised and extended before consideration by Advances in Applied Ceramics.
Disclosure statement
No potential conflict of interest was reported by the authors.