
Abstract
In this paper, we study the performance of a technique called time reversal for cooperative communication in a mobile wireless environment. To put the work in context, a brief introduction to time-reversal communication (TRC) in general and cooperative TRC in particular is presented. Performance of a proposed cooperative TRC scheme is evaluated numerically via a simulated indoor environment containing multiple wireless communication nodes. We characterize the behavior of the peak power received at a target node as a function of the number of cooperating transmitting nodes and as a function of the distance of the target from its predicted location within the simulated environment. The results demonstrate that the performance of cooperative TRC is less sensitive to uncertainty in the target position than might be expected from standard assumptions regarding the relationship between signal wavelength and spatial channel correlation in a complex multipath environment.
Introduction
In wireless networks, power constraints and the signal distortion caused by multipath propagation can severely restrict the capacity of the point-to-point links in the network. One approach to improving the capacity of the network is to employ cooperative communication techniques, in which multiple nodes in the network cooperate to transmit information to a desired receiver node. Recently, both cooperative relay strategies [1–6] and cooperative transmission strategies [7–10] have been extensively studied. In this paper, we consider a cooperative transmission strategy based on a technique called time-reversal communication (TRC), which can be regarded as generalization of beamforming. Various signal processing techniques based on time-reversal (TR) processing have been proposed and studied previously for many applications, including acoustical imaging [11], electromagnetic imaging [12], underwater acoustic communication [13], and wireless communication channels [14–16]. In two recent publications [17, 18], the application of TRC to cooperative communication in wireless networks has been introduced and studied by several of the authors.
In this paper, we extend our earlier work in order to study the performance of cooperative TRC in a mobile wireless environment. In particular, performance of a proposed cooperative TRC scheme is evaluated numerically in a simulated indoor environment containing multiple wireless communication nodes. We characterize the behavior of the peak power received at a target node as a function of the number of cooperating transmitting nodes and as a function of the distance of the target from its predicted location within the simulated environment. This corresponds to a scenario in which the target is mobile and has changed position since training information was exchanged with the transmitter nodes. The results demonstrate that the performance of cooperative TRC is less sensitive to uncertainty in target position than might be expected from standard assumptions regarding the relationship between signal wavelength and spatial channel correlation in a complex multipath environment.
The remainder of this paper is organized as follows. In Section 2, we present a brief discussion on the properties of TRC and the cooperative TRC strategy employed in our performance evaluation. Some details regarding the simulation are given in Section 3, and the simulation performance results are presented and discussed in Section 4. Our conclusions are summarized in Section 5.
Cooperative Time-Reversal Communication
The particular communication scenario we consider in this paper is illustrated in Fig. 1 below. We assume that a group of network nodes in relatively close proximity (Group A) wishes to transmit cooperatively to a distant receiver node. During a training phase, the receiver node transmits a short sequence of wide-band training pulses, which are received at all of the nodes in group A. We assume that each of the point-to-point paths on this channel is represented by an independent multipath channel with several resolvable paths, so that the received waveforms at all of the nodes in group A are distorted in a different fashion. During each training phase, the receiving nodes independently perform pulse estimation in order to estimate the exact arrival time, duration, and shape of the received pulse.
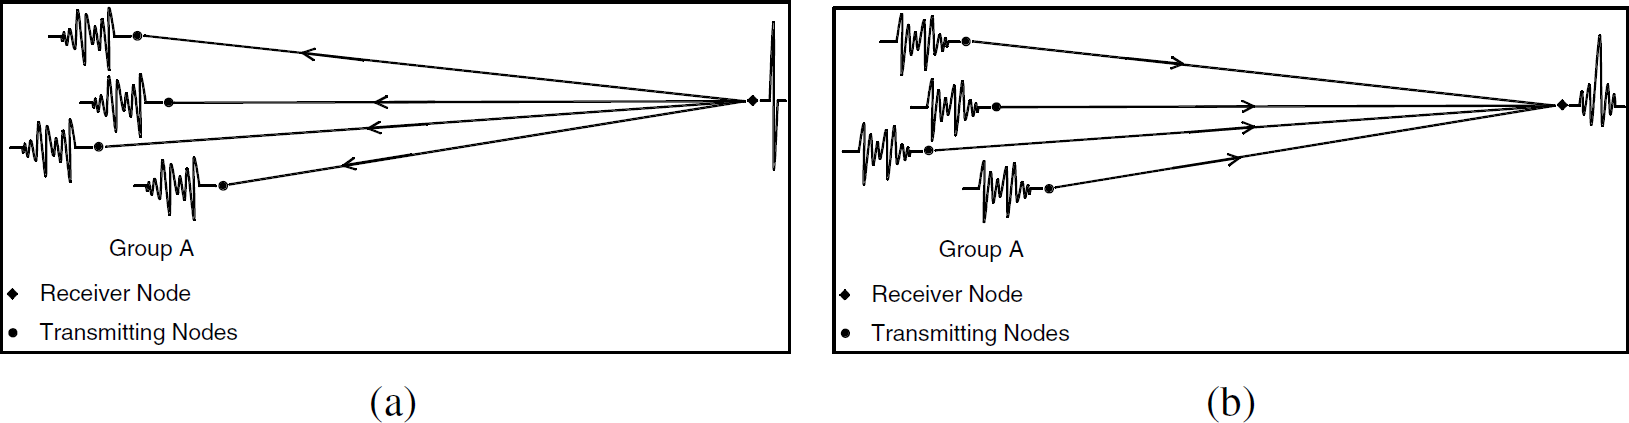
(a) Training for transmission from group A to receiver node, (b) Transmission from group A to receiver node.
After the completion of the training phase, information is transmitted from an arbitrary node in Group A to the receiver node using the following cooperative TR scheme. Whenever a node in group A wishes to transmit information to the receiver node, the source node first disseminates the information to all of the other nodes in group A. The ensemble of nodes in group A then cooperate to transmit the information to the receiver node by synchronously transmitting a stream of identical data symbols modulated onto the time-reverse of their respective estimated received waveforms.
The motivation for utilizing TR for communication is based primarily on the optimality property presented in the following lemma. Recall that a system satisfies the principle of reciprocity if the response of the system at a particular output location to a stimulation at a particular source location remains unchanged when the source and measurement locations are interchanged. In particular, if a communication channel satisfies the principle of reciprocity, then the impulse response of the forward channel (from transmitter to receiver) is identical to the impulse response of the reverse channel (from receiver to transmitter.) The node-to-node channels on a broadband wireless network will generally satisfy the principle of reciprocity, at least approximately, over time intervals corresponding to several hundred kilobits or more.
Suppose a linear, time-invariant channel that satisfies the principle of reciprocity exists
between two communication nodes. Let h(t) represent the impulse
response of the channel as measured at the receiver node relative to time t = 0 at
the transmitter node, and let

The proof of this lemma, which is quite straightforward, is given in [18] along with a discussion of the implications of the lemma; however, it should be clear that the lemma and the principle of superposition together imply that if perfect impulses are used in the training procedure, and if the resulting pulse estimation and synchronized time-reversed retransmission are performed perfectly, all of the transmitted waveforms from group A will converge at the receiver node to produce an impulsive waveform (equal to the sum of the autocorrelation functions of the various channel impulse responses) that maximizes the peak power output from the channel at the desired time. Hence, under perfect conditions, we expect to observe a waveform at the receiver node with maximum possible peak output power that increases with the number of transmitting nodes.
In practice, of course, neither the training pulse shape, the pulse estimation, nor the transmission synchronization will be perfect, and system performance will suffer as a result. In [18], the performance of cooperative TRC was studied as a function of the number of transmitting nodes under theoretically perfect conditions and in the presence of both pulse distortion and timing errors. In this paper, we summarize the earlier results and compare them with the performance degradation associated with movement of the receiver node from the position corresponding to transmission of the training information.
Numerical Simulation
Numerical experiments were carried out to study the performance of cooperative TRC in a virtual indoor laboratory environment. The signal propagation between nodes was simulated using the finite-difference time-domain (FDTD) method, which is capable of direct simulation of electromagnetic signal propagation in the time domain [19]. This technique can model signal propagation accurately even for extreme frequency-selective (i.e. dispersive) environments such as those often encountered on wireless communication channels. For this application, we performed simulations for a simple indoor environment comprising a single room with dimensions 3 meters by 2 meters by 2 meters. The dimensions were kept small to minimize the simulation time. The composition and electrical properties of the walls, ceiling, floor, and furnishings of the room are summarized in Table 1. No additional interfering sources were modeled in this particular experiment.
Composition and electrical properties of simulated environment

Composition and electrical properties of simulated environment
The geometry of the environment is illustrated in Fig. 2. The environment contains a chair, a desk, and a bookshelf arranged as illustrated in the figure. In addition to the furniture, the room contains 10 communication nodes equipped with wideband omnidirectional antennas arranged as illustrated in Fig. 2. The node identified as the receiver in Fig. 2 corresponds to the receiver node for the cooperative transmission performed by the remaining nodes in the environment, which are identified as transmitters. In fact, these roles are reversed during the training phase as the receiver node is the source of the original training pulse transmitted to the other nodes in the environment in order to estimate the distributed time-reversal waveforms transmitted cooperatively by the remaining nodes during the transmission phase. As illustrated in the figure, the receiver is located 1.8 meters above the floor, 5 of the transmitter nodes are located in a plane 1.5 meters above the floor, 3 more of the transmitter nodes are located in a plane 1.0 meters above the floor, and the single remaining transmitter node is located on the table at a height of 1.2 meters above the floor.

Geometry of simulated environment: (a) Overview with table and chair (blue) and bookshelf (red), (b) Cross-section at 1.8 meters with receiver node, (c) Cross-section at 1.0 meters with 3 transmitter nodes, (d) Cross-section at 1.5 meters with 5 transmitter nodes.
The transmitted training signal used for the simulations is illustrated in Fig. 3. The signal is highly impulsive with a center frequency of about 1.5 GHz and a two-sided 10 dB bandwidth of approximately 800 MHz. Examples of the noise-free waveforms received at two different transmitter nodes corresponding to transmission of this training pulse from the identified receiver position are illustrated in Fig. 4. As this figure indicates, the modeled environment is very dispersive, and the channel response varied noticeably from node to node within the environment.

Transmitted training signal: (a) Time-domain waveform (sample interval ≍16.7 picoseconds), (b) Energy spectrum.
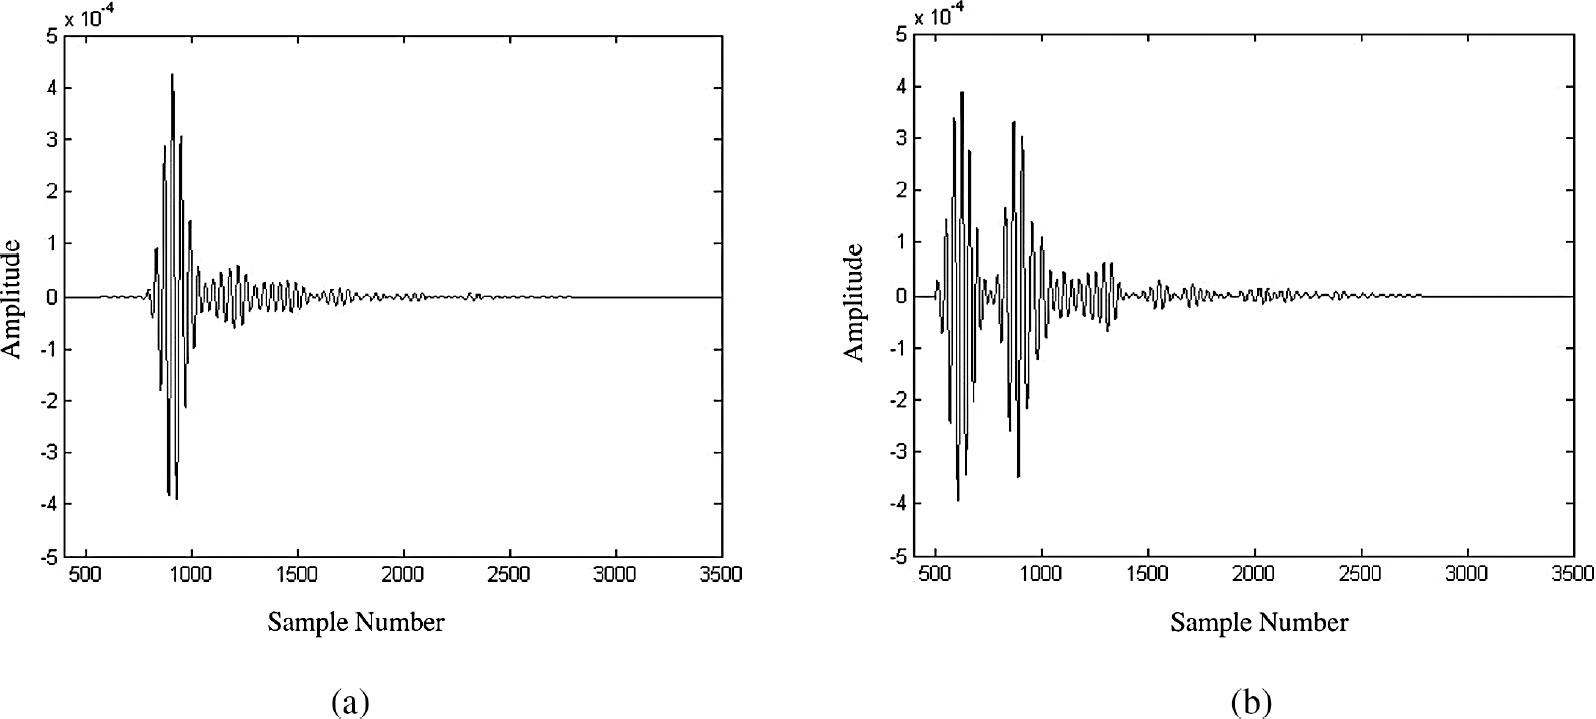
Received training waveforms at two different sensors: (a) Sensor 3, (b) Sensor 8.
In this study, we assume that the movement of the receiver is less than 40 centimeters between the training and receiving phases. Consequently, a 40-centimeter by 40-centimeter region centered at the identified receiver location and confined to the same horizontal plane as the receiver was used to study the effects of receiver movement on cooperative TRC performance. The selected region was sampled at an equally spaced grid of 3 by 3 points, and the transmission of the training signals was simulated from each of the points on the grid. The FDTD method was used to simulate propagation of the 9 transmitted training signals to all 9 transmitter node locations, and the resultant received signals were recorded. Using these simulation results, transfer functions were obtained for all 81 of the different point-to-point channels identified within the environment.
The effect of the receiver movement on the performance of cooperative TRC was investigated by recursively identifying each of the 9 grid points as the original receiver location during the training phase. In each case, the pre-computed channel transfer functions based on the FDTD simulation were then used to generate the corresponding matched time-reversal waveform for each of the transmitter nodes and to simulate propagation of these time-reversed waveforms from each transmitter to each of the 9 grid points in the sampled region. The cumulative peak power output at each of the grid points was then computed and recorded corresponding to the cooperative transmission of signals from all possible subsets of size 3, 5, and 9 transmitter nodes. Hence, for each of the 9 sampled locations corresponding to the receiver position during the training phase, we obtained peak power output for cooperative transmission from 3, 5, and 9 transmitters at 9 different sampled locations corresponding to the receiver location during the transmission phase. Based on the regular sampling of the original 40-centimeter by 40-centimeter region, there were 6 possible values for the distance of the receiver movement between training and transmission: 0, 20, 28.2, 40, 44.6, and 56.6 centimeters.
The results of the performance evaluation are summarized in Fig. 5. The curves shown in Fig. 5 illustrate the decrease in average peak power output at the receiver as a result of the receiver movement between training and transmission phase. The results are illustrated for 3, 5, and 9 cooperating transmitter nodes and for all sampled distances corresponding to the receiver movement. The average peak output power at each sampled distance was computed by averaging over the outputs corresponding to all relevant combinations of original receiver location, final receiver location, and cooperating transmitter subset membership.
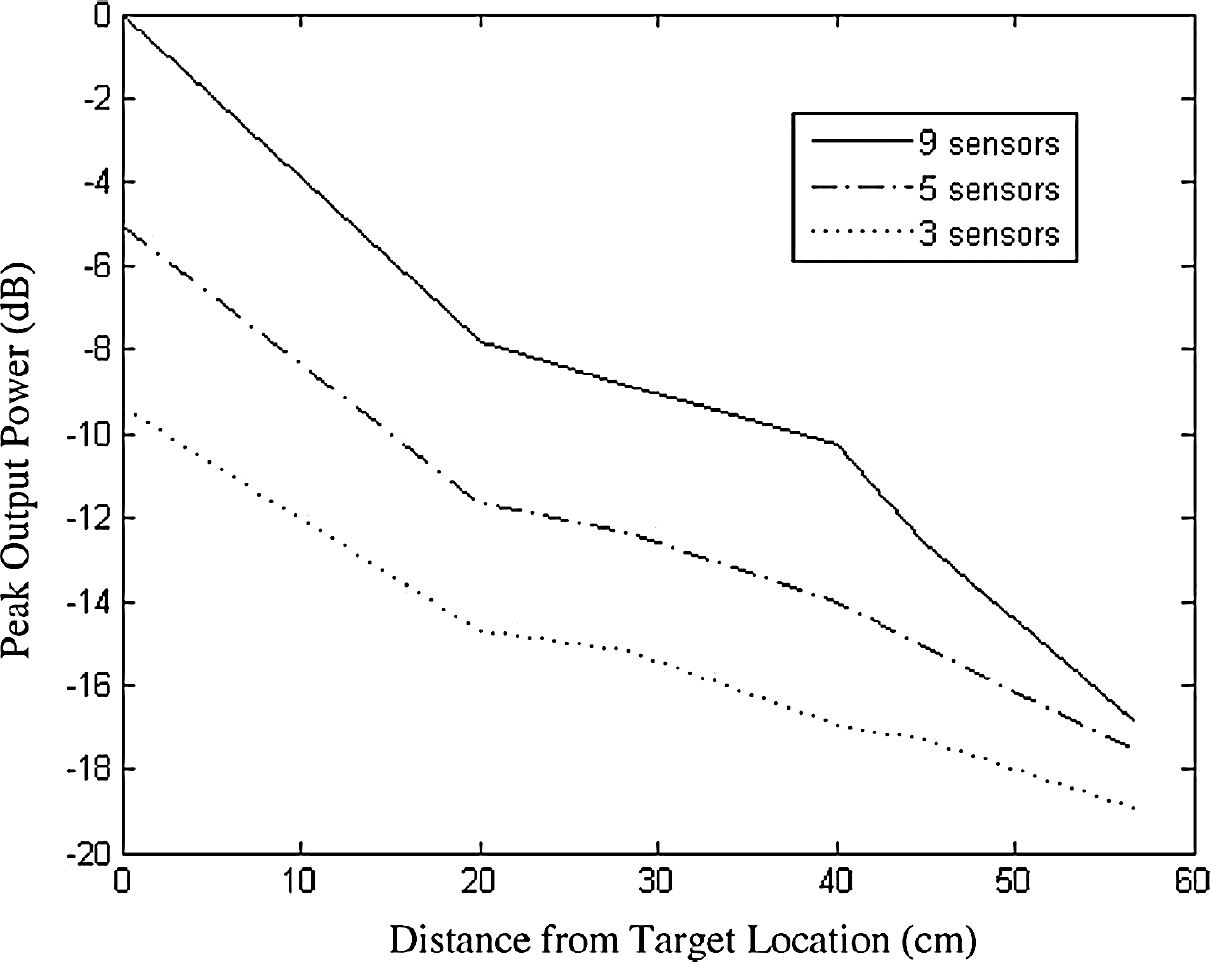
Decrease in peak output power at receiver corresponding to receiver movement between training and transmission phase.
For comparison, some results from an earlier performance study [18] using the same simulated environment are presented in Fig. 6. This figure illustrates the effects of progressive random de-correlation between the training and transmission channels on the received peak power at the original receiver location. To simulate channel de-correlation, noise was added to the time-reversed waveforms prior to retransmission. The additive noise at each transmitter node was zero-mean, white, Gaussian, and independent from sensor to sensor. The results are parameterized by signal-to-distortion ratio (SDR), which is calculated as the ratio of the energy in the noise-free training waveform received at each node divided by the variance of the i.i.d. noise samples added to distort the waveform. Prior to retransmission, the distorted waveform at each node was normalized to have unit energy. The curves plotted in Fig. 6 show the average peak power output from the channel at the original receiver location for an ensemble of 100 independent transmissions from each transmitting node. SDR values above 40 dB correspond to nearly perfect correlation between the training and transmission channels while SDR values below approximately 0 dB correspond to nearly complete de-correlation.

Cumulative average peak output power as a function of simulated channel de-correlation for 1–9 transmitting sensors. (The 9 distinct curves in the plot correspond to transmission by 1 through 9 sensors, respectively. The bottom curve represents the power output from one transmitting sensor and the top curve represents the power output from 9 transmitting sensors.)
A comparison of the results presented in Fig. 5 and 6 is quite revealing. Note first that the rate of growth in peak output power illustrated in Fig. 5 at the original receiver location as a function of the number of cooperating transmitter nodes agrees with the rate of growth illustrated in Fig. 6 corresponding to perfect channel correlation. This should indeed be the case, and in both situations the rate of growth is approximately quadratic in the number of transmitting sensors, which agrees with theoretical predictions.
Similarly, the rate of growth in peak output power in Fig. 5 at distances greater than 44 cm from the original receiver location is similar to the rate of growth in Fig. 6 corresponding to complete channel de-correlation. This is consistent with the conclusion that the channels in the simulated indoor environment de-correlate over distances greater than 44 cm. Again, this is to be expected, since the environment has a complex multipath structure, and a distance of 44 cm between receiver locations is greater than 1.6 wavelengths of the lowest frequency components of the transmitted waveform.
Surprisingly though, the rate of growth in peak output power in Fig. 5 at distances between 20 and 40 cm from the original receiver location is considerably greater than the rate of growth in Fig. 6 for de-correlated channels. In fact, at a distance of 20 cm, a comparison of the results in Figs. 5 and 6 indicates that the channels in the simulated environment are still very strongly correlated. This is surprising because 20 cm is still greater than one-half wavelength of the lowest frequency components of the transmitted waveform, and a standard assumption for fading (i.e., complex multipath) environments is that the channels de-correlate over distances greater than about half of a wavelength. This has both good and bad implications, as we discuss below.
In this paper, we have conducted a simulation study of the performance of a cooperative communication technique which we call cooperative time-reversal communication in an indoor wireless environment under the assumption that the receiver is mobile. Rather than using approximate analytical models for the point-to-point channels in this environment, we have carefully simulated all electromagnetic propagation numerically using the FDTD approach and computed the transfer functions of all point-to-point channels directly from the simulation results. This approach is time consuming but much more accurate than analytical modeling for any particular environment.
The results of this study indicate that, as expected, channels in a typical indoor wireless environment de-correlate over relatively short distances. This means that spatial diversity in the environment can be successfully exploited to improve system performance using either multi-antenna MIMO techniques or cooperative communication techniques, such as the one studied here. Of course, this also implies that the task of estimating the channels within the environment is complicated considerably by just small amounts of mobility. Surprisingly however, the rate of channel de-correlation as a function of receiver separation or movement is considerably slower than might be expected from the standard rule-of-thumb generally applied to fading environments. This implies that channel estimation may be somewhat easier than anticipated in indoor environments subject to mobility but that the full benefits of spatial diversity may be more difficult to achieve.