
Abstract
ABSTRACT
Flash butt welding is a resistance welding process that offers great advantages due to its high thermal efficiency, simplicity and high speed, makes it ideal for welding mooring chains. Despite its advantages, numerous corrosion problems are still being found in practice, both in the heat-affected zone and the weld line. Literature is scarce about it, limiting mostly to state the problem. The majority of the studies attribute this preferential corrosion to local changes in the microstructure that induce a galvanic coupling effect.
Mooring chain R3 grade steel with preferential corrosion along the weld line has been studied from both metallographic examinations and electrochemical methods. Small differences were found in the microstructure of the heat-affected zone and base material (mainly composed of tempered martensite) but nevertheless, significant with respect to its corrosion behaviour. The corrosion mechanisms are discussed with particular attention to the electrochemical differences around the welding line.
Introduction
Since the early 40s, the floating production storage and offloading (FPSO) of oil and gas offshore platforms started to increase significantly. Until that time, drilling systems were mounted on wooden piers, limiting the operation range to distances close to the coast [1]. Since then, offshore technology has made considerable progress to reach far away distances and deeper waters [2] as well as increase the number of operative platforms [3]. To ensure the proper functioning of the floating system it is crucial that the mooring systems are in optimal conditions, safeguarding performance, safety and environment. Its relevance is reported in the ‘Climate, energy and mobility’ of the EU Horizon Europe, which specifies the need to ‘test and validate the potential benefits of new circular materials in offshore floating PV and/or ocean energy substructures, foundations and if relevant mooring and anchoring systems while ensuring structural integrity and durability considering very high wind (speed >25 m s–1), current (>1.2 m s–1) and wave loads (height >14 m) and corrosion and biofouling on all elements of the ocean energy systems’ [4].
Mooring systems based on steel chains have been used for a long time due to their high mechanical properties and relatively low cost. There are several standards and regulations to ensure safe operations in offshore systems under extreme environmental conditions. The DNV-OS-E302 standard [5] sets out the essential criteria for the offshore moorings. It specifies up to six grade steel chains (R3, R3S, R4, R4S, R5 and R6) differing in both chemical composition and mechanical properties. In the same way, the API Spec 2F [6] specifies the main mechanical requirements for the steel flash-welded chain. However, none of the two standards explicitly refers to corrosion properties of the steels.
Chain corrosion is one of the leading causes of offshore mooring failure since sea water in general and oceans, in particular, constitute a harsh environment for metallic alloys. Chloride concentration, water temperature, biological activity, erosion/wear and mechanical stresses caused by the ocean currents and tides, make an extreme working environment for mooring chains triggering corrosion damage in all their forms (uniform, localised, galvanic) [7,8]. Wang [9] concluded that corrosion was the primary failure cause in the Floating Production, Storage and Offloading (FPSO) units operating in West Africa. Ma et al. [10] presented a review of 21 incidents that had occurred in permanent mooring systems illustrating the relevance of corrosion. Gordon et al. [11] presented a brief overview of the main corrosion problems which had appeared in different locations highlighting the importance of improving the mooring integrity management.
Despite progress in the development of new steels and manufacturing processes, inspection is still the main tool for preventing mooring incidents caused by corrosion phenomena [12]. Melchers [13] had a very interesting approach for accurate estimation of the corrosion rate for steel chains taking into consideration several variables. Fontaine et al. [14], after analysing severely-corroded chains from West Africa, concluded that pitting found on the steel was due to Microbiologically Influenced Corrosion (MIC), nevertheless this aspect is still controversial. Recently Melchers [15] demonstrated that MIC is not the main factor responsible for corrosion of mooring steel chains in deep, cold and low oxygen sea waters. In addition to corrosion, the existence of mechanical effects (stress, wear) that might lead to mechanically assisted corrosion phenomena has to be considered as one of the most dangerous forms of corrosion damage. A complete overview of different corrosion problems affecting the integrity of mooring chains can be found in [16]. Nonetheless, despite the large volume of literature on corrosion, there are few papers related to selective corrosion in welds and heat-affected zones (HAZ) of mooring chains [17,18].
The present paper studies the ‘W-shaped’ preferential corrosion attack developed in an R3 grade steel link immersed in the North Sea for 19 years.
Materials and methods
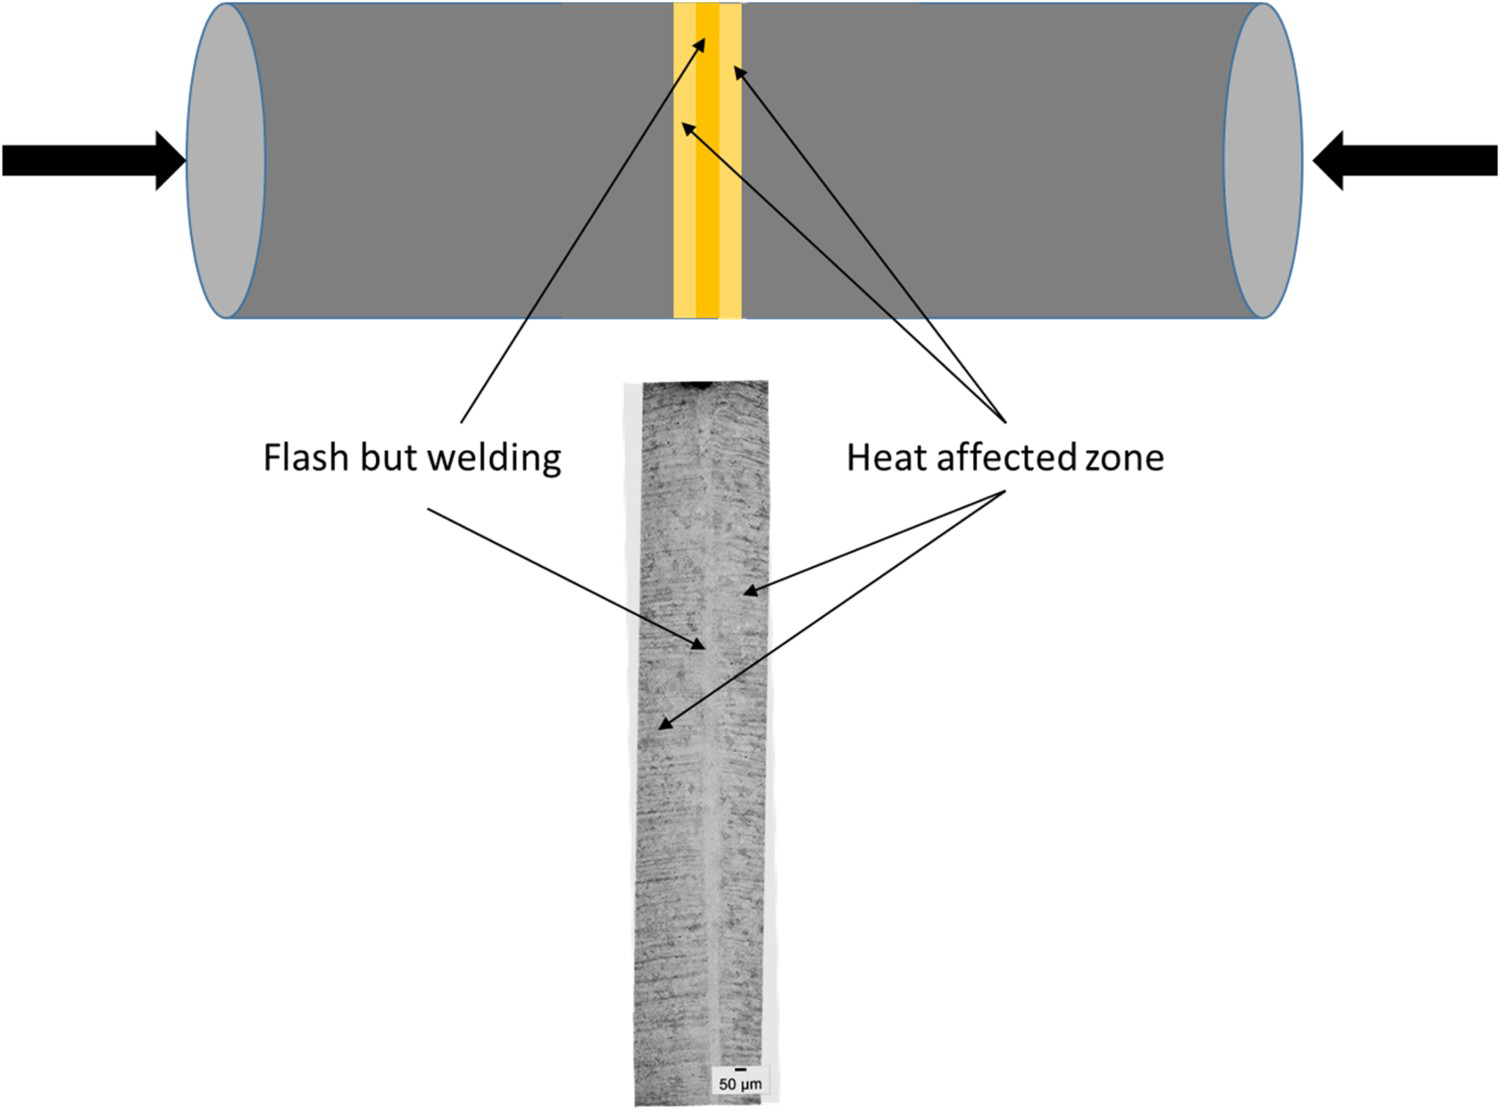
The composition is consistent with an R3 Grade steel. It contains ∼0.20% of carbon alloyed with manganese and small amounts of Ni, Cr and Mo. This steel belongs to the family of low-alloy carbon steels with high tensile strength and toughness at low temperature, well suited for mooring chain applications. The corrosion resistance of the R3 Grade steel is low in medium and high aggressive media. The link provided by VICINAY has been exposed for 19 years in the North Sea. Figure 1 shows the general view of the link and the cross-section of the area exhibiting ‘W-shaped’ preferential corrosion attack, running parallel to the welding line. The 137 mm chain was manufactured through Flash Butt Welding process and followed by quenching and tempering. As a result of this welding process, a straight narrow welding line of 450-600 μm width is formed (Figure 2).
(Left) General view of the chain link immediately after its service withdraw; (Right) Detail of the developed attack on the link. Scheme of the flash butt welding and the corresponding microstructure generated in which the tests were done.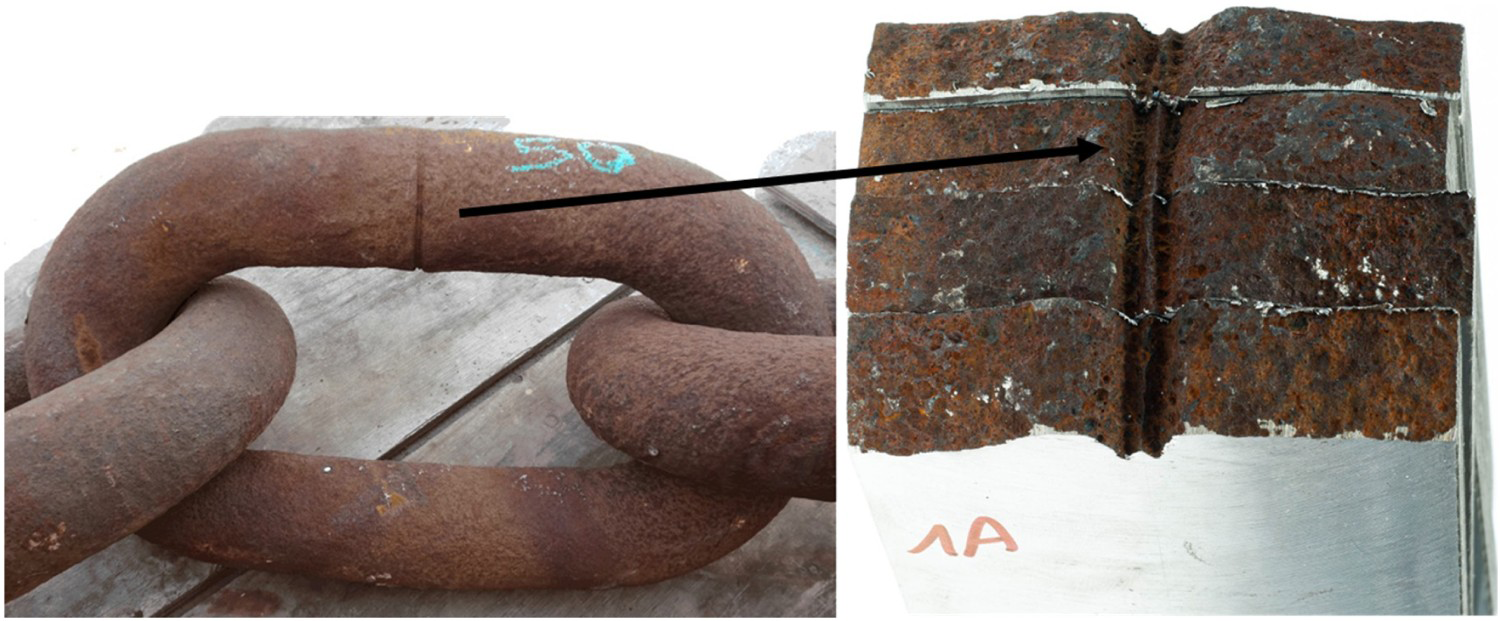
The microstructure of the link at the welding line, the heat-affected zone (HAZ) and the base metal were evaluated by Optical Microscopy (OM) and Scanning Electron Microscopy (SEM). The OM was carried out using an Olympus GX 51 Optical Microscope on etched samples in Nital 2% for 4 s. SEM analysis was made using a field emission gun scanning electron microscope (FEG-SEM), Hitachi S 4800 J equipped with Energy Dispersive X-ray (EDX) detector.
In addition, X-ray diffraction measurements of the corrosion products present on the steel surface were performed with a Bruker AXS D8 X-ray diffractometer with a Co X-ray tube working at 40 kV and 30 mA in parallel-beam geometry and equipped with a LynxEye Linear Position Sensitive Detector. Conventional diffraction patterns were collected over a 2θ range from 10 to 80° with a step size of 0.01°. The obtained XRD profiles were analysed for phase quantification using the 4.2 version of Rietveld analysis program TOPAS (Bruker AXS) and the crystallographic information of the phases present.
Carbon and alloying elements content in both the heat-affected zone and the welding line was measured by means of a JEOL SUPERPROBE JXA-8900M WDS (EPMA, Electron Probe Micro Analyzer).
Vickers Hardness of the HAZ and base metal was measured under constant loading conditions using a load of 1 kg for a holding time of 10 s.
Corrosion behaviour was evaluated by potentiodynamic polarisation curves using a Gamry Reference 600 potentiostat. Electrochemical measurements were done using a three-electrode microcell inspired by the work by Bohni et al. [19] (Figure 3). The working electrode was the sample from the chain, using a Pt wire as a counter electrode and an Ag/AgCl, 3M KCl as a reference electrode. The electrolyte was a 0.6 M NaCl solution and the tests were performed at room temperature. The open-circuit potential, OCP, was recorded for 1 h. Potentiodynamic curves were performed as follows. First, the OCP was monitored for 900 s. Then, the potential sweep started from –300 mV versus OCP up to a current density of 1 mA cm–² at a scan rate of 0.167 mV s–1.
The three-electrode microcell set up used for corrosion measurement of the base material, heat affected zone and welding line.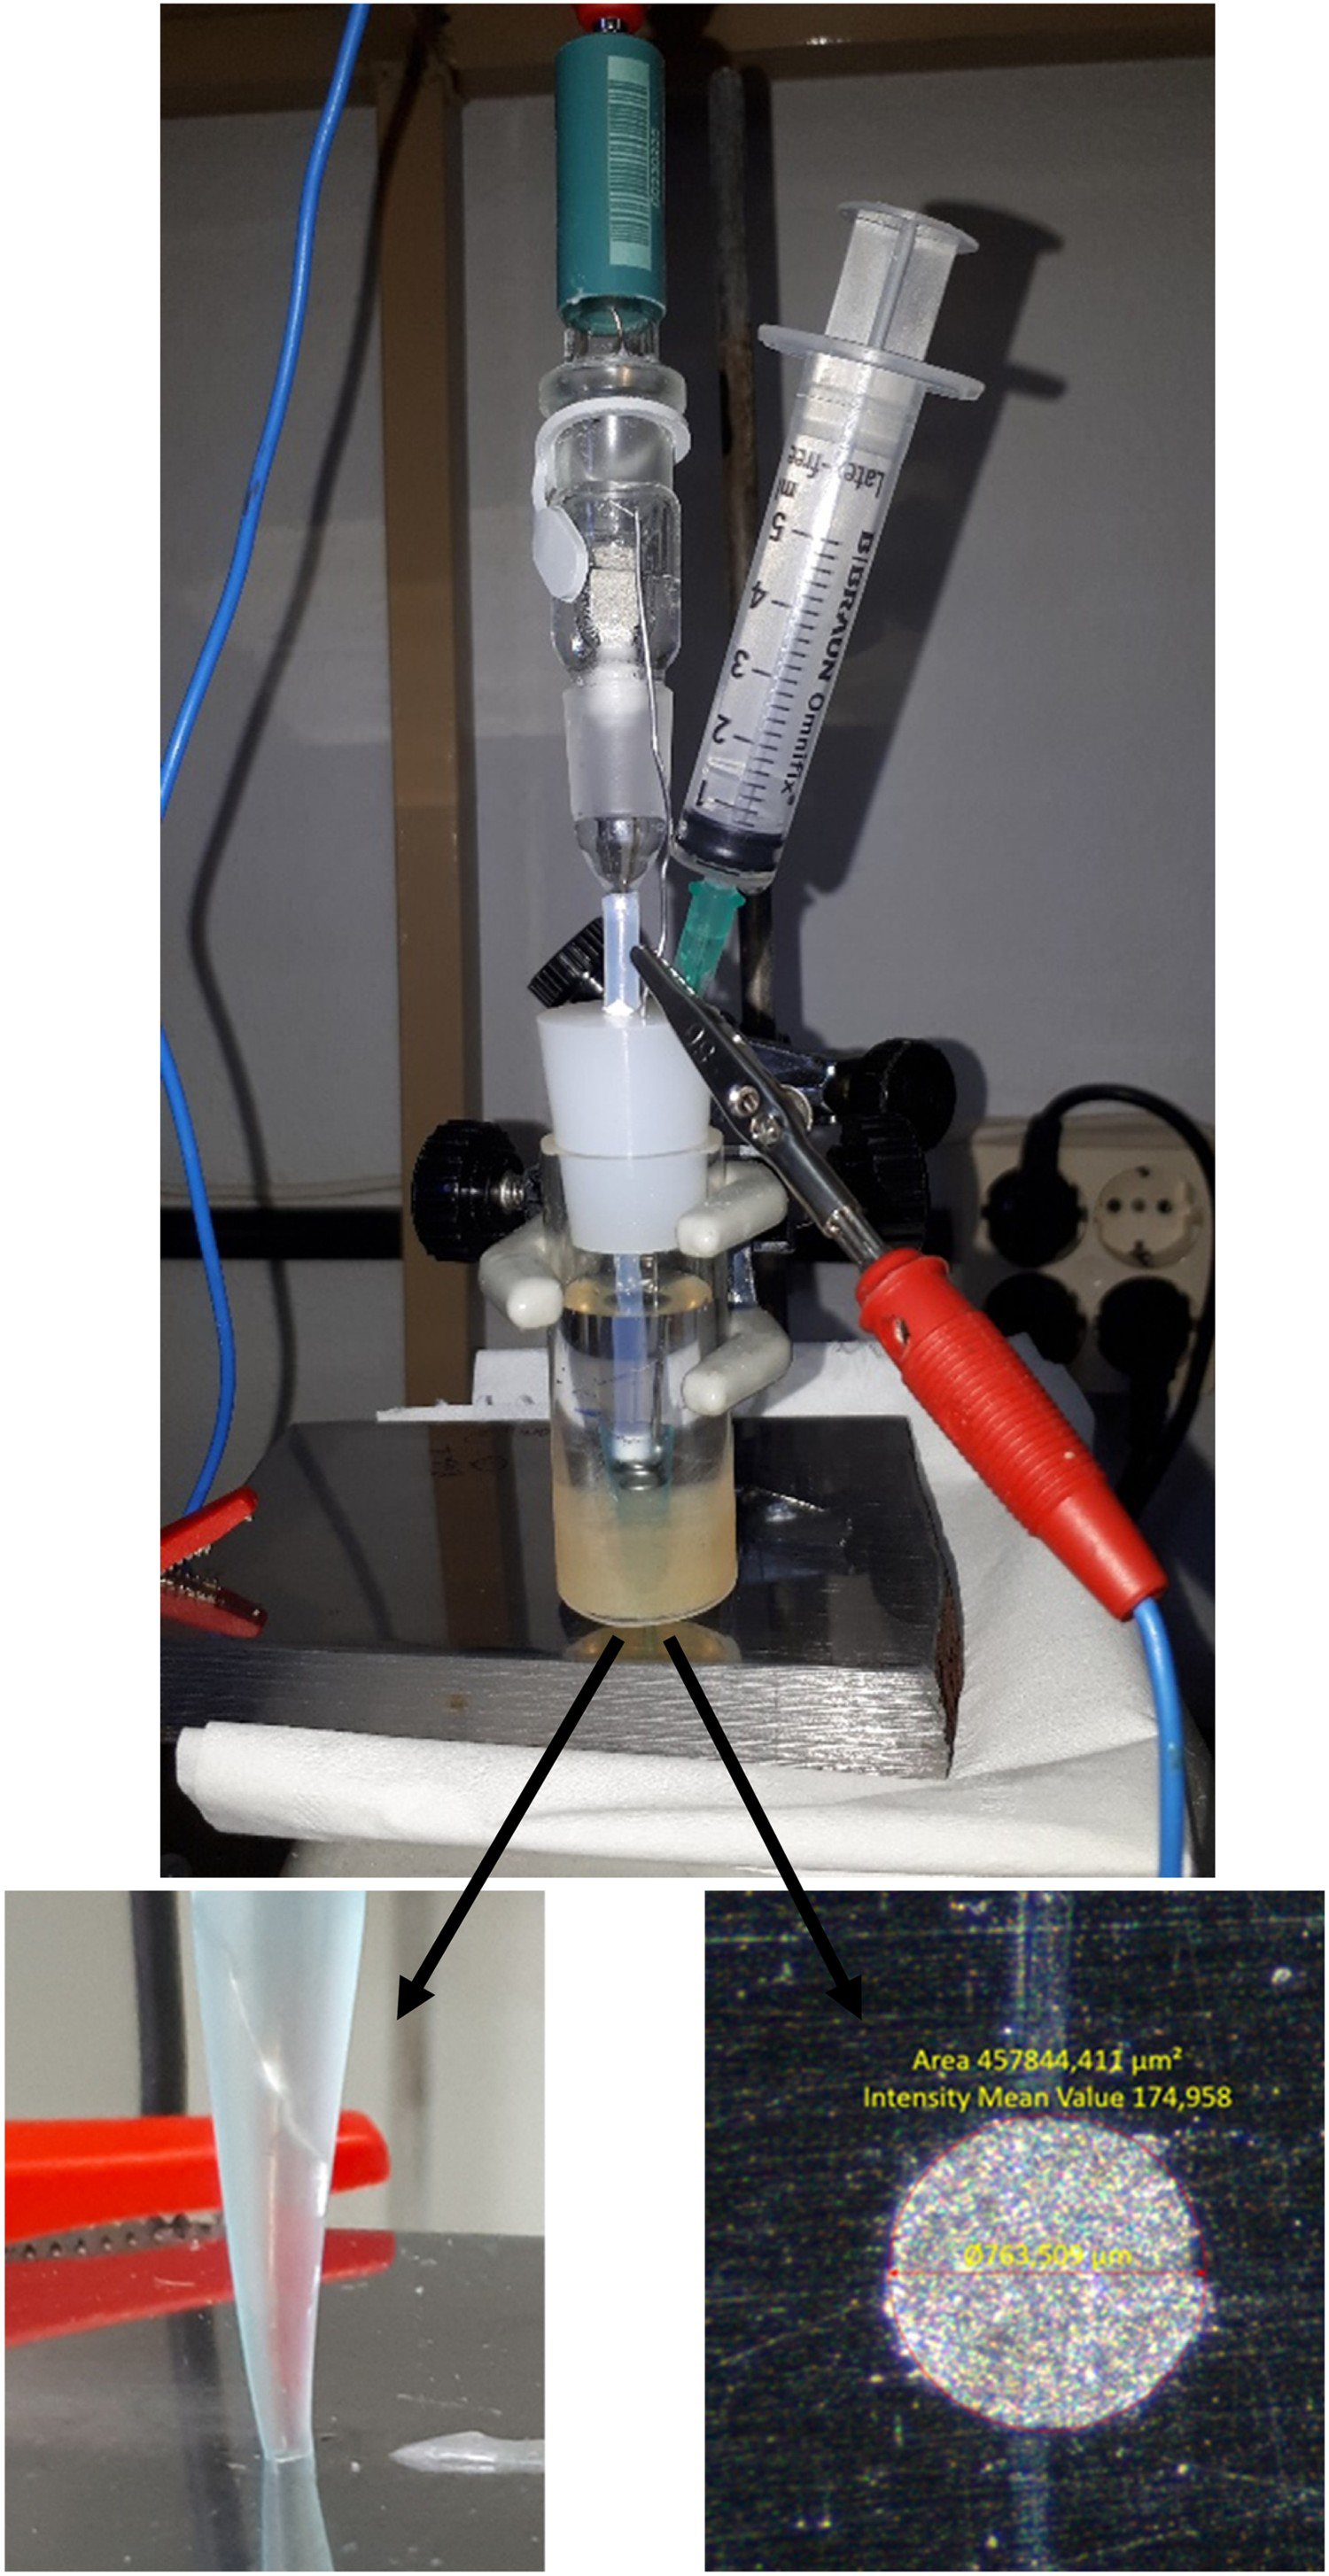
Different micropipettes with tip diameters ranging from 450 to 750 μm were used to test the welding line, HAZ and base metal. The positioning of the tip on the right place of the surface to be monitored was the most critical part of the measurement process. Several tests (n = 10) were carried out on each place to prevent scattered results.
To prepare the different areas to be measured, a piece of 10 mm × 20 mm link was mounted in a thermosetting resin, and subsequently polished until mirror finishing. Finally, for the correct selection of the area to be tested the samples were slightly etched with Nital 2% to reveal the position of the welding line and HAZ. The electrical contact of the sample was made with a copper wire. Additional electrochemical tests were also carried out on 1 cm2 testing area using a conventional electrochemical cell to evaluate the behaviour of the R3 grade steel.
Statistical analysis of the electrochemical parameters was performed using analysis of variance (ANOVA) to determine whether the differences between the mean values of the base metal, HAZ and welding line were statistically significant (α = 0.05). Multiple pairwise comparisons of means were performed by Tukey's post-hoc test using Origin 2020b software.
Results
Compositional and microstructural characterisation
Figure 4 shows the microstructure of base metal. It is mainly composed of tempered martensite with retained austenite and carbides between the laths. Tempering after flash butt welding, performed at 660°C, transforms the martensitic structure into a ferrite-carbide mixture preserving the martensitic microstructure.
Microstructure of base steel, mainly composed of tempered martensite with retained austenite and carbides between the laths.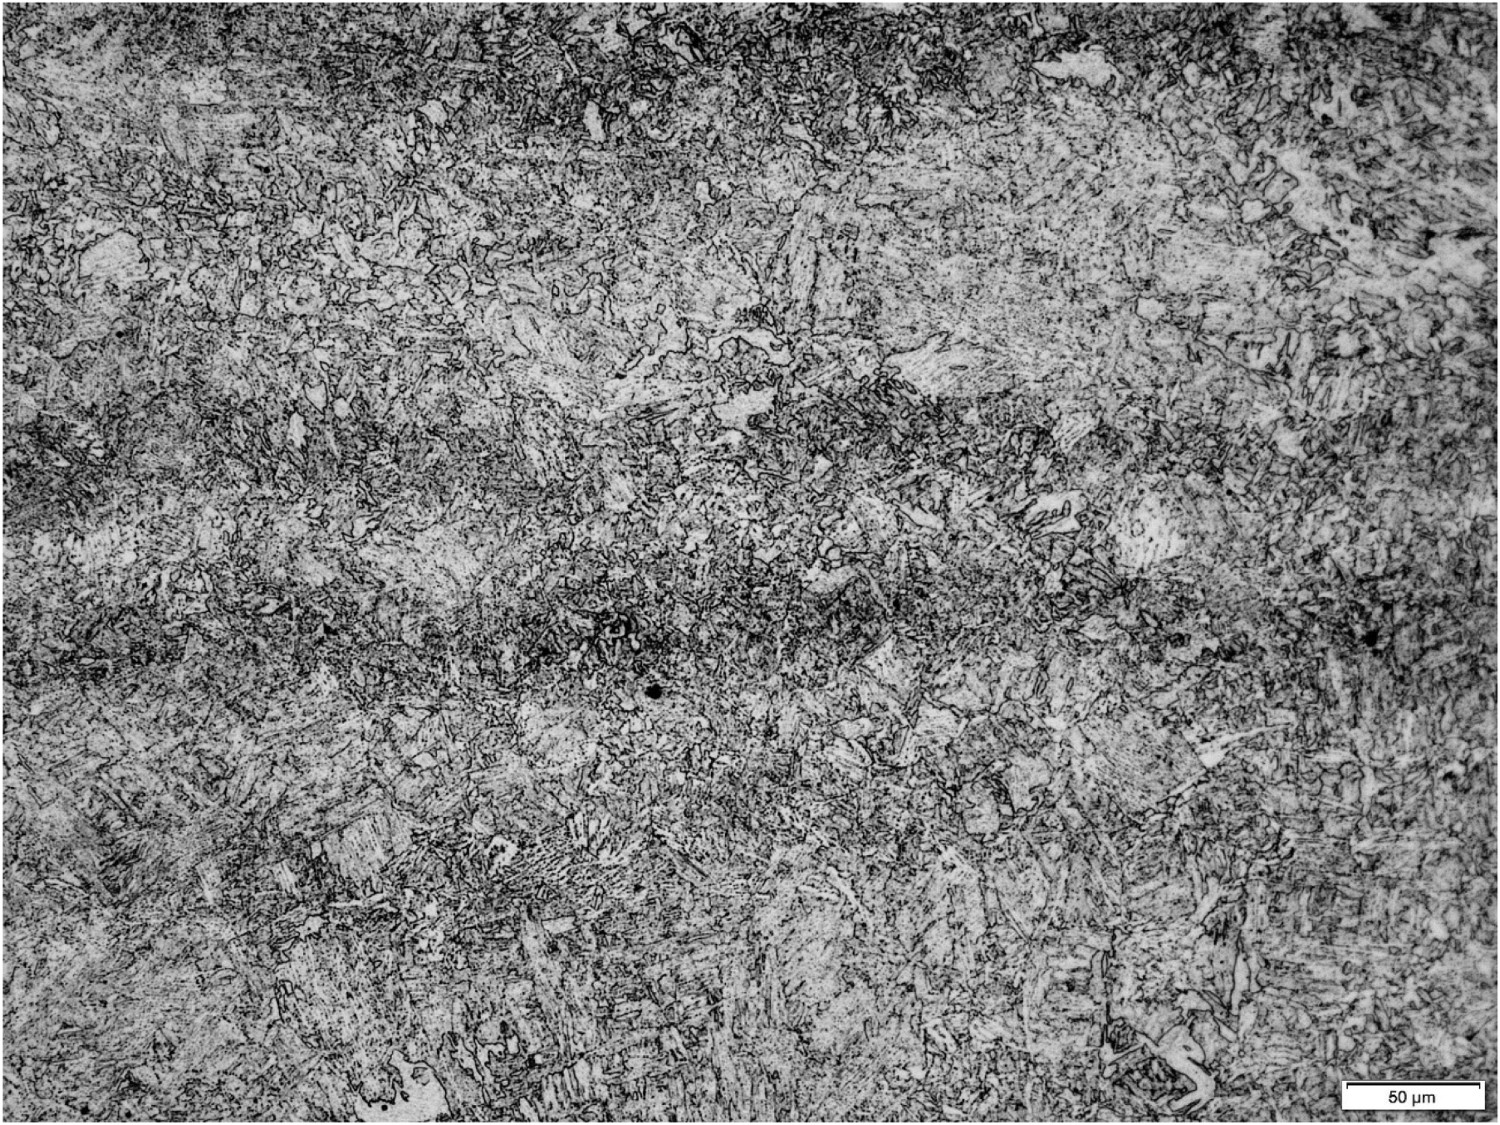
Figure 5 compares the microstructure in the middle of the welding line and the HAZ. Unlike the base metal, the welding line exhibits higher proportion of polygonal ferrite (Figure 5a). The microstructure of the heat affected zone is similar to the base metal but with a higher concentration of carbides and acicular ferrite (Figure 5b).
Microstructure in the middle of the welding line and the HAZ: (a) higher proportion of polygonal ferrite in the weldment and (b) higher content of carbides and acicular ferrite in the HAZ.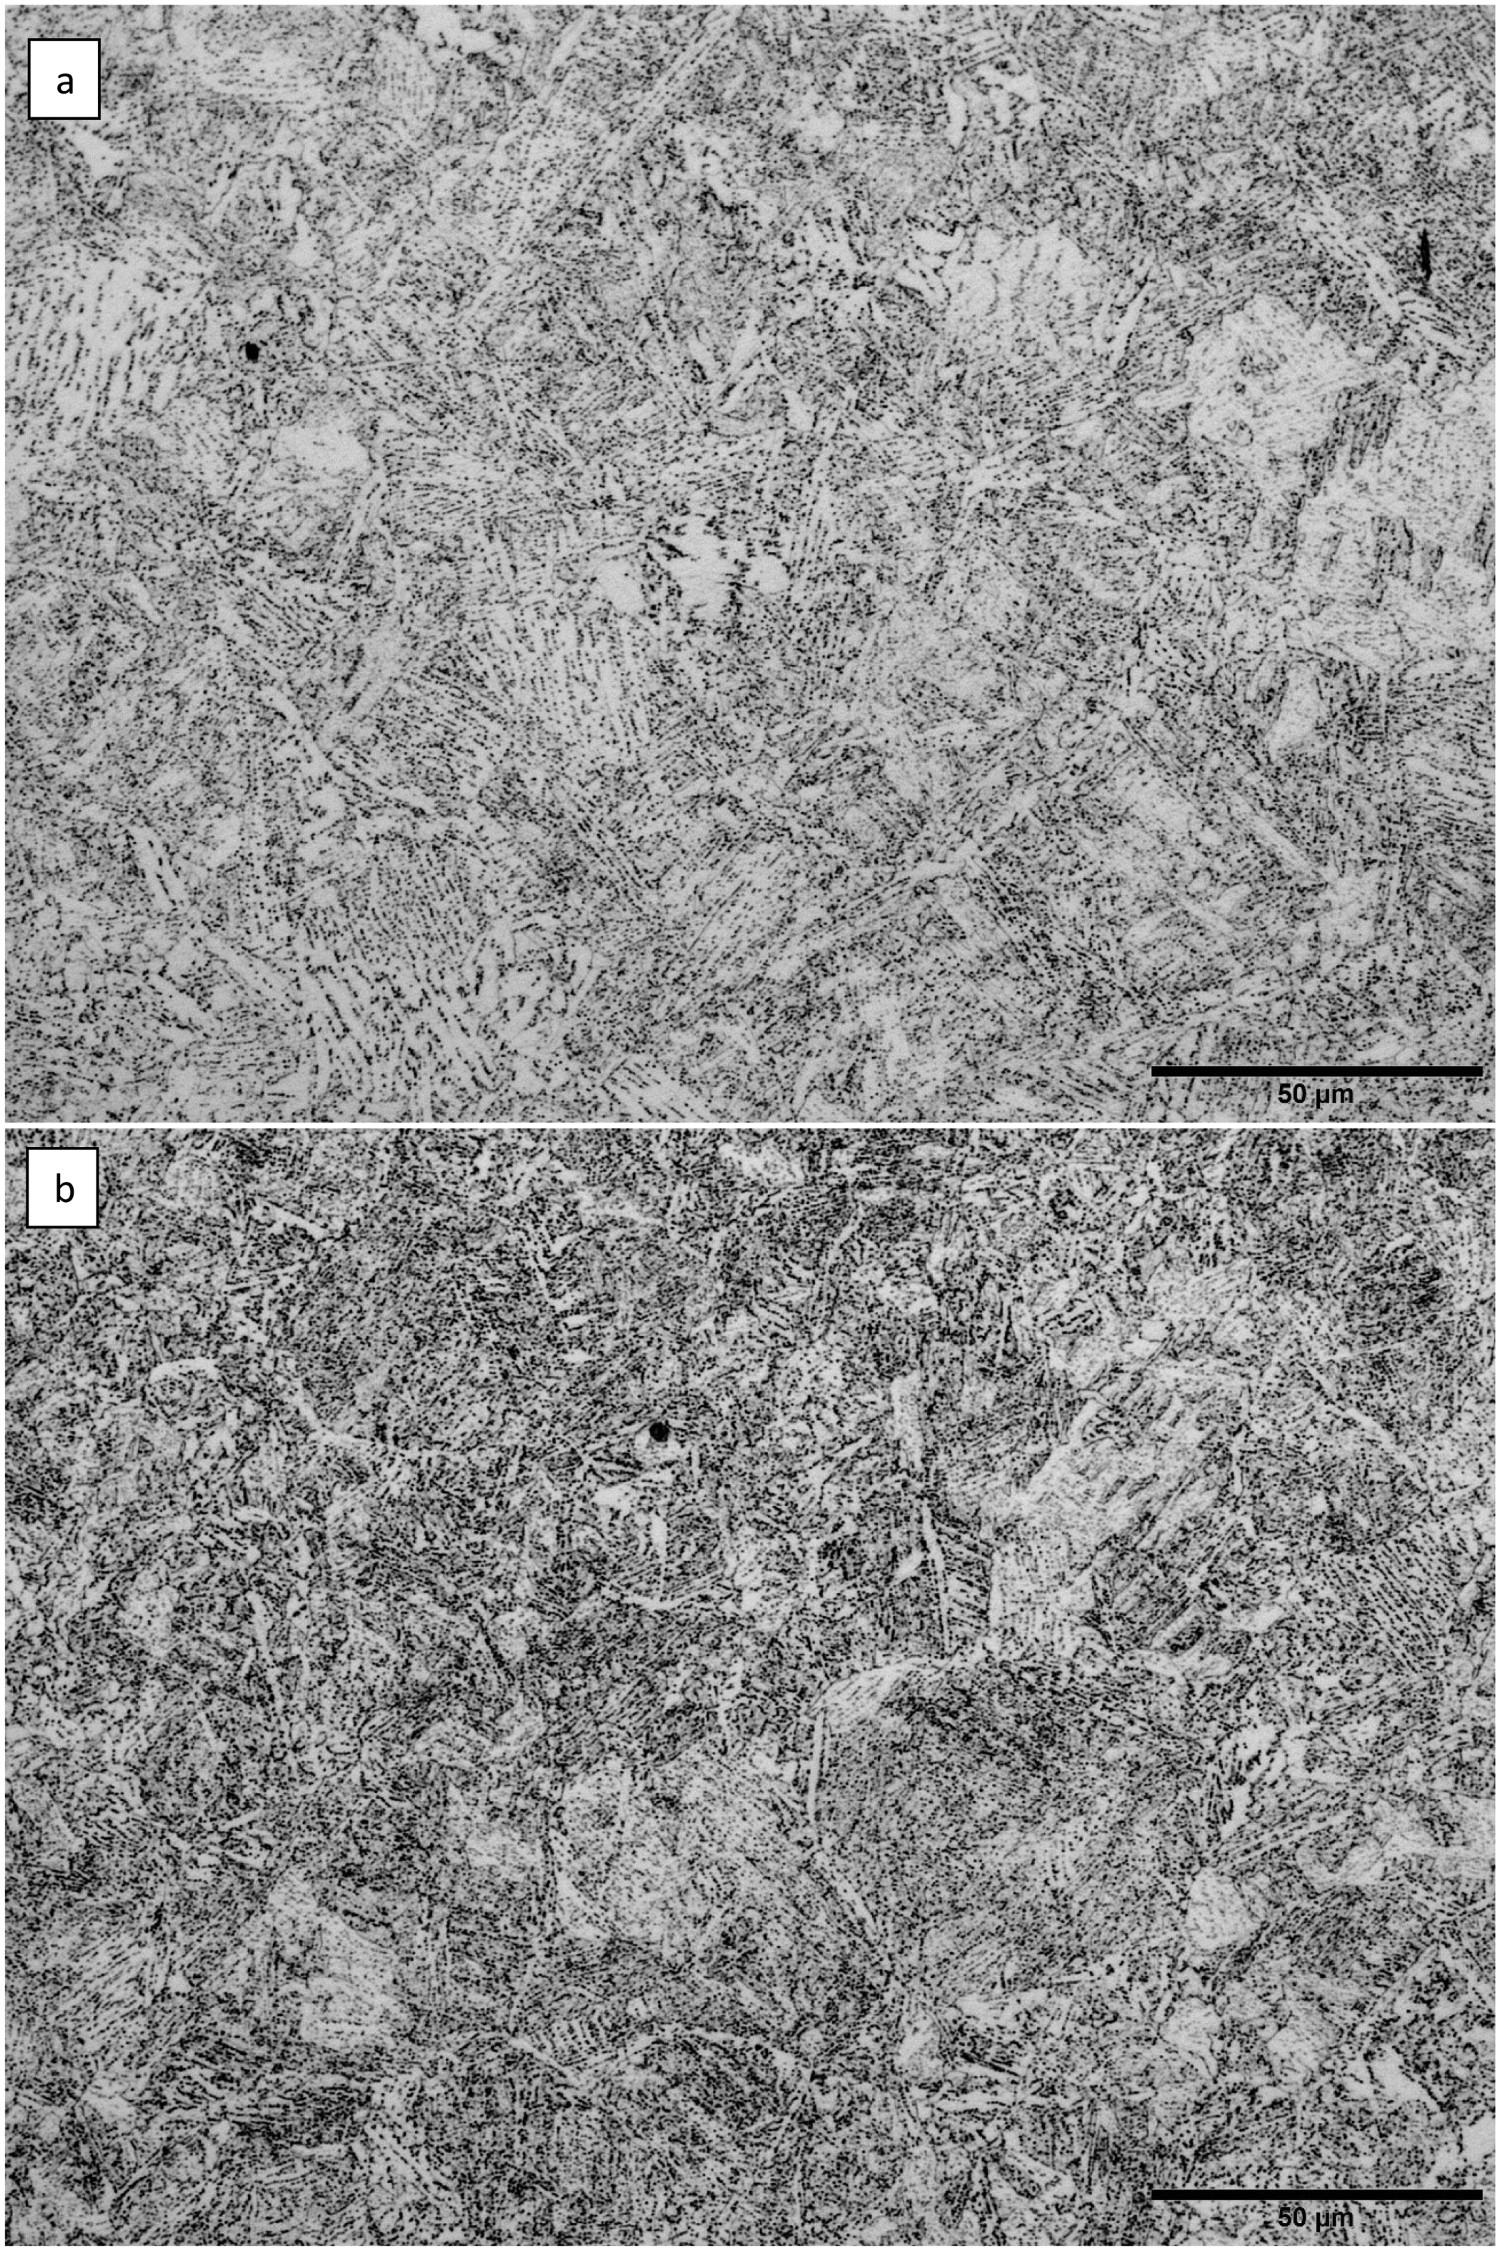
SEM micrographs, Figure 6, show the carbide distribution in the different areas. At higher magnifications, a gradient distribution of carbides from the base metal to the welding line is observed. The analysis performed by means of ImageJ software estimated some differences in the carbide content at the different sites. The results revealed that in representative areas of the HAZ and the welding line the percentage of carbides was 10% and 6% respectively. This finding is in agreement with that reported by Zhang [20]. The authors state that the decrease of carbide contents is due to a partial decarburisation of the welding line.
SEM micrographs showing the carbide distribution in the tested areas.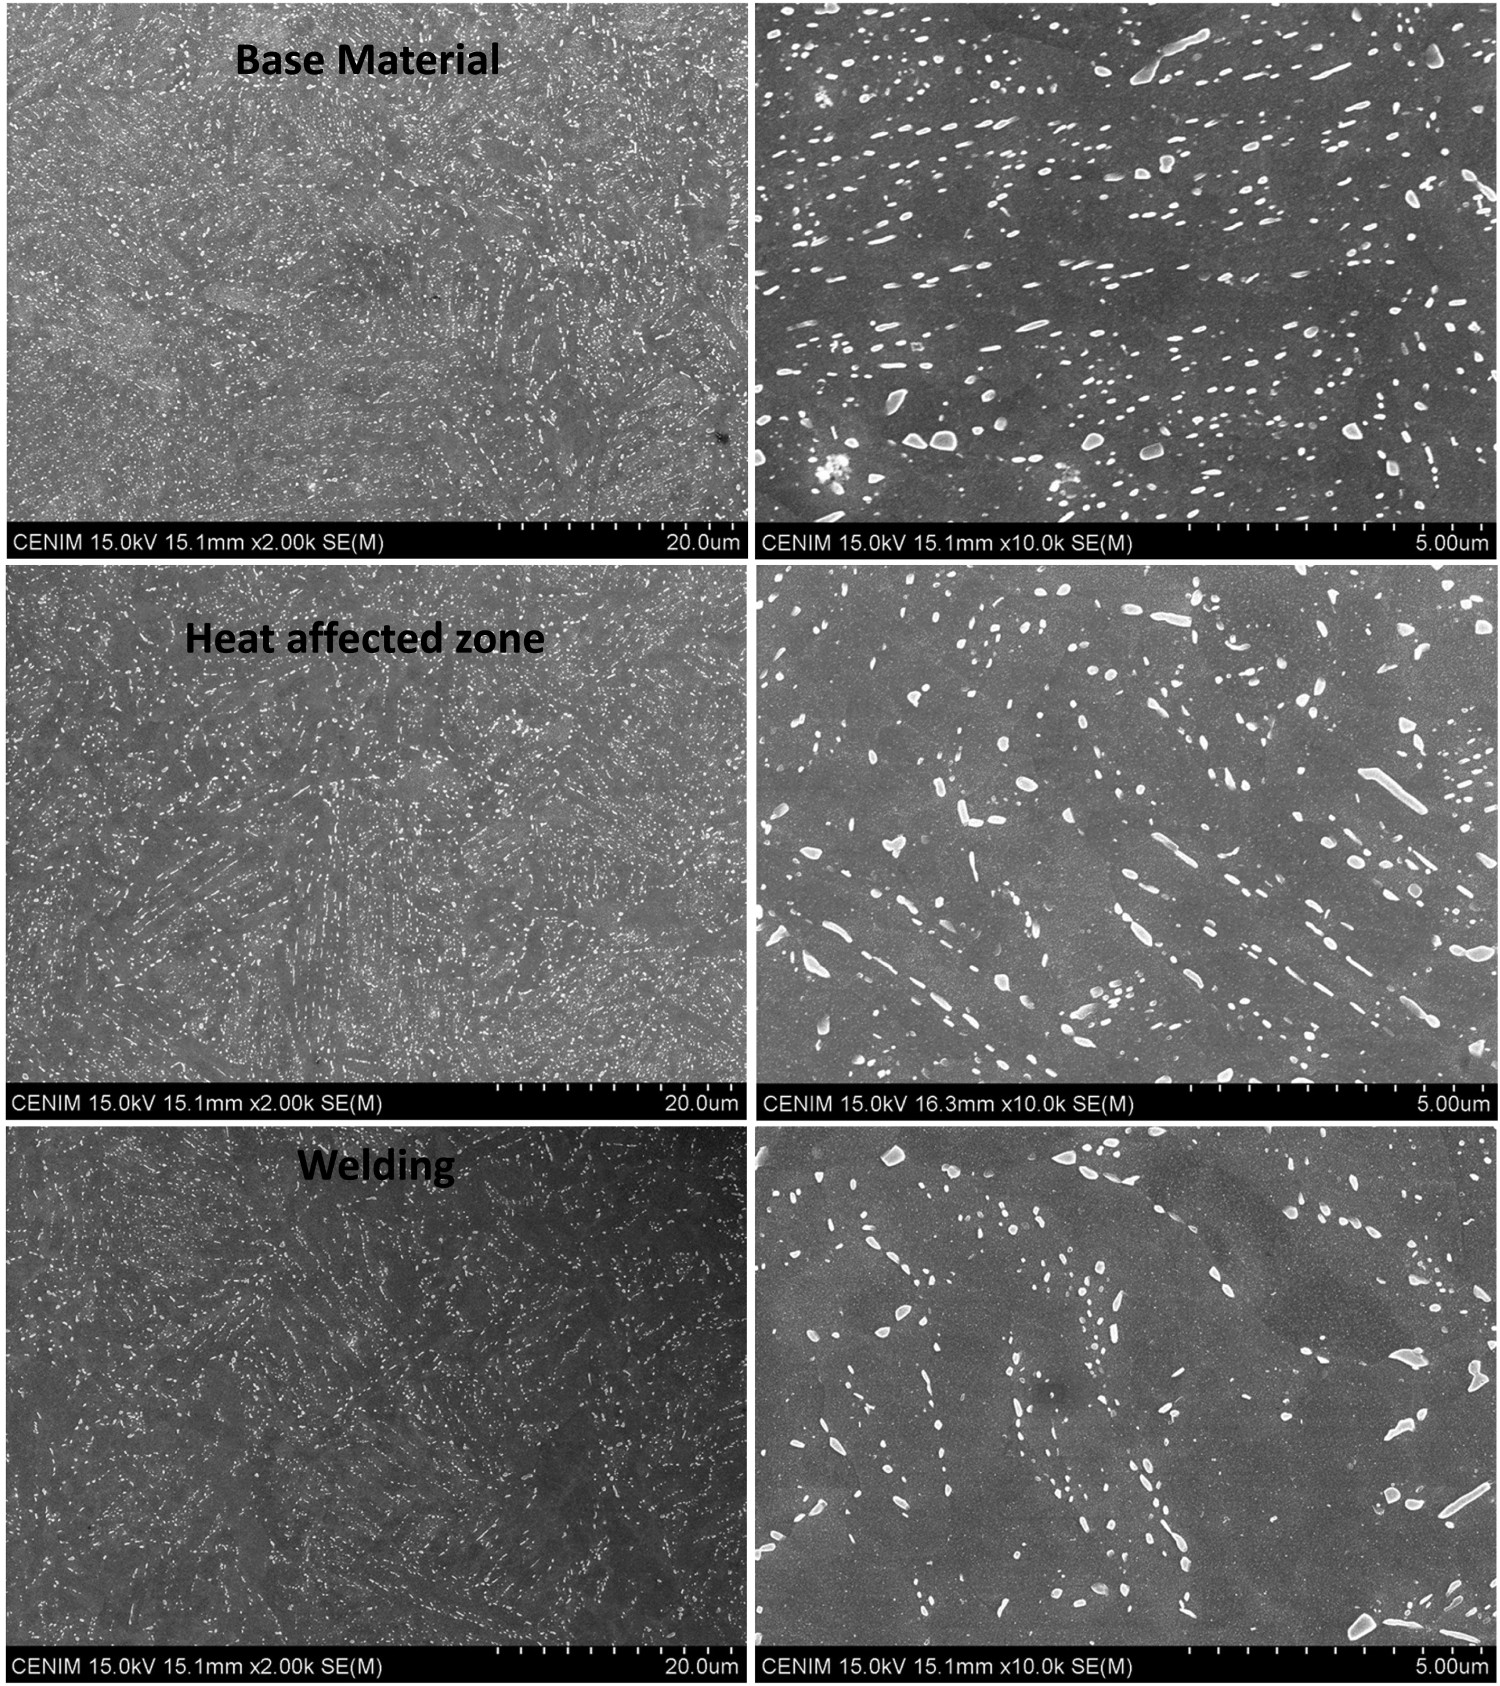
In the present work further, analysis was performed by a microprobe to analyse the carbon content and other alloying elements in the different studied areas. This technique performs spot analysis on polished surfaces down to 1 micrometre in diameter. Figure 7 shows the average carbon composition of the HAZ and welding line. The results confirm the decrease in carbon content as well as in other alloying elements in the welding line regarding the HAZ.
Electron probe microanalysis (EPMA) on the HAZ and welding line showing the average carbon content in each zone.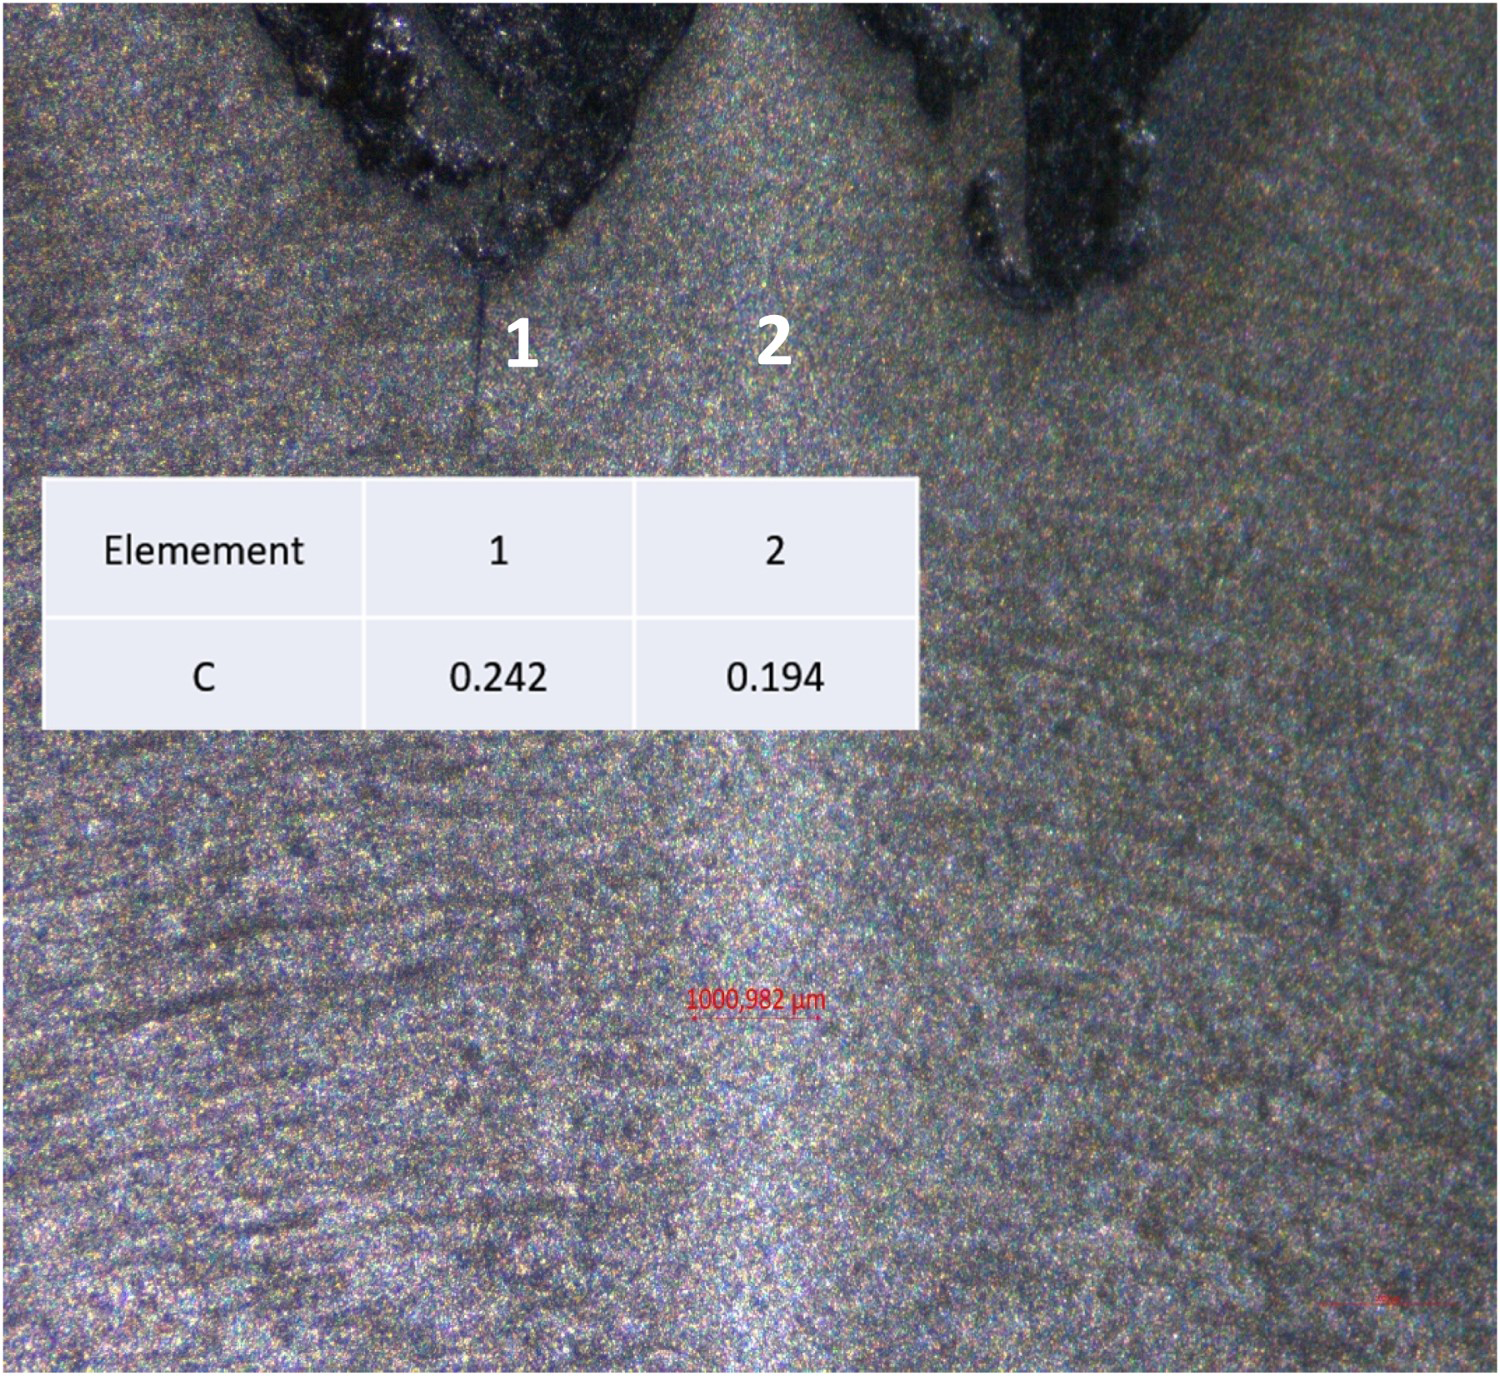
Local compositional and microstructural changes induce also local variations in hardness (Figure 8). As it can be seen there is a gradient of hardness increasing from the welding line to the base metal. As it can be seen, the hardness decreases significantly as approaching to the welding line. This aspect has been broadly studied in the literature and therefore not worth discussing it here.
Hardness profile through the welding.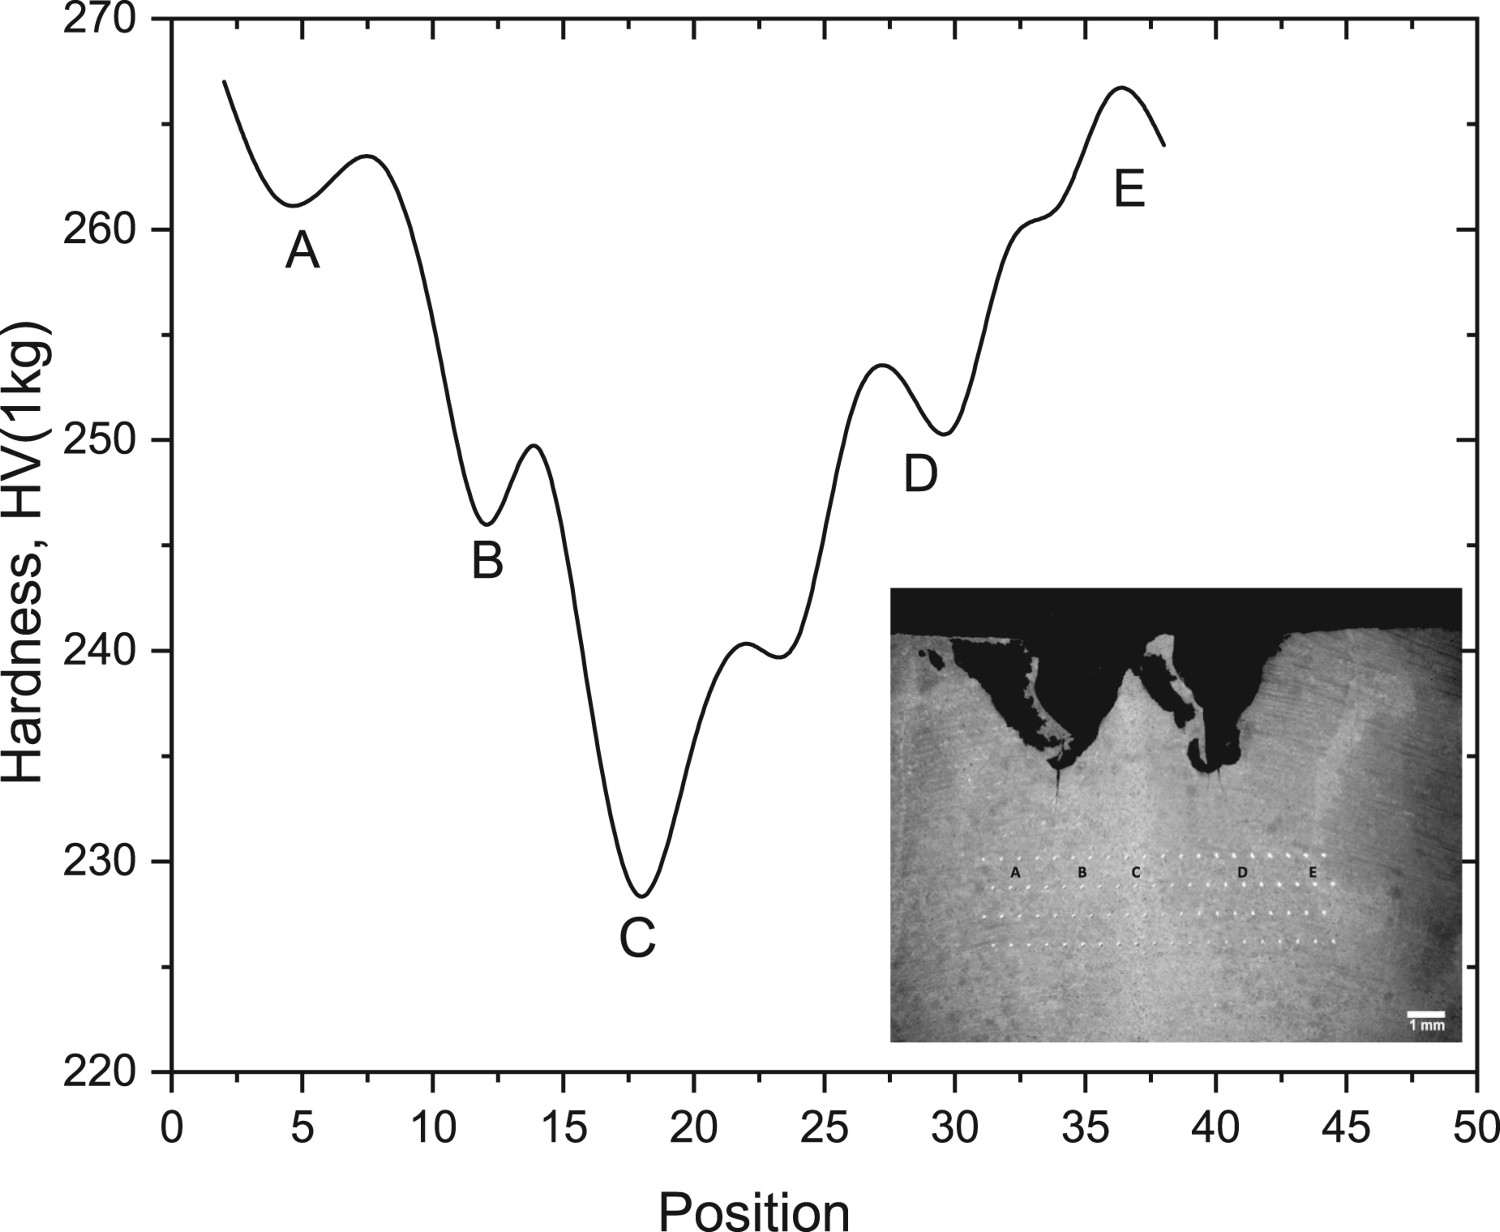
Corrosion evaluation
Corrosion products on the steel surface of the link were analysed by X-ray diffraction (Figure 9). The Rietveld analysis showed akagaenite (β-FeOOH), lepidocrocite (-FeOOH) and goethite (α-FeOOH) as the major components (36%, 23% and 21% respectively) and magnetite (Fe3O4) and calcite (6% and 4%, respectively). The presence of some iron chloride compounds is also common in carbon steels exposed in marine environments [21].
X-ray diffractogram of the corrosion products developed on steel surface of link.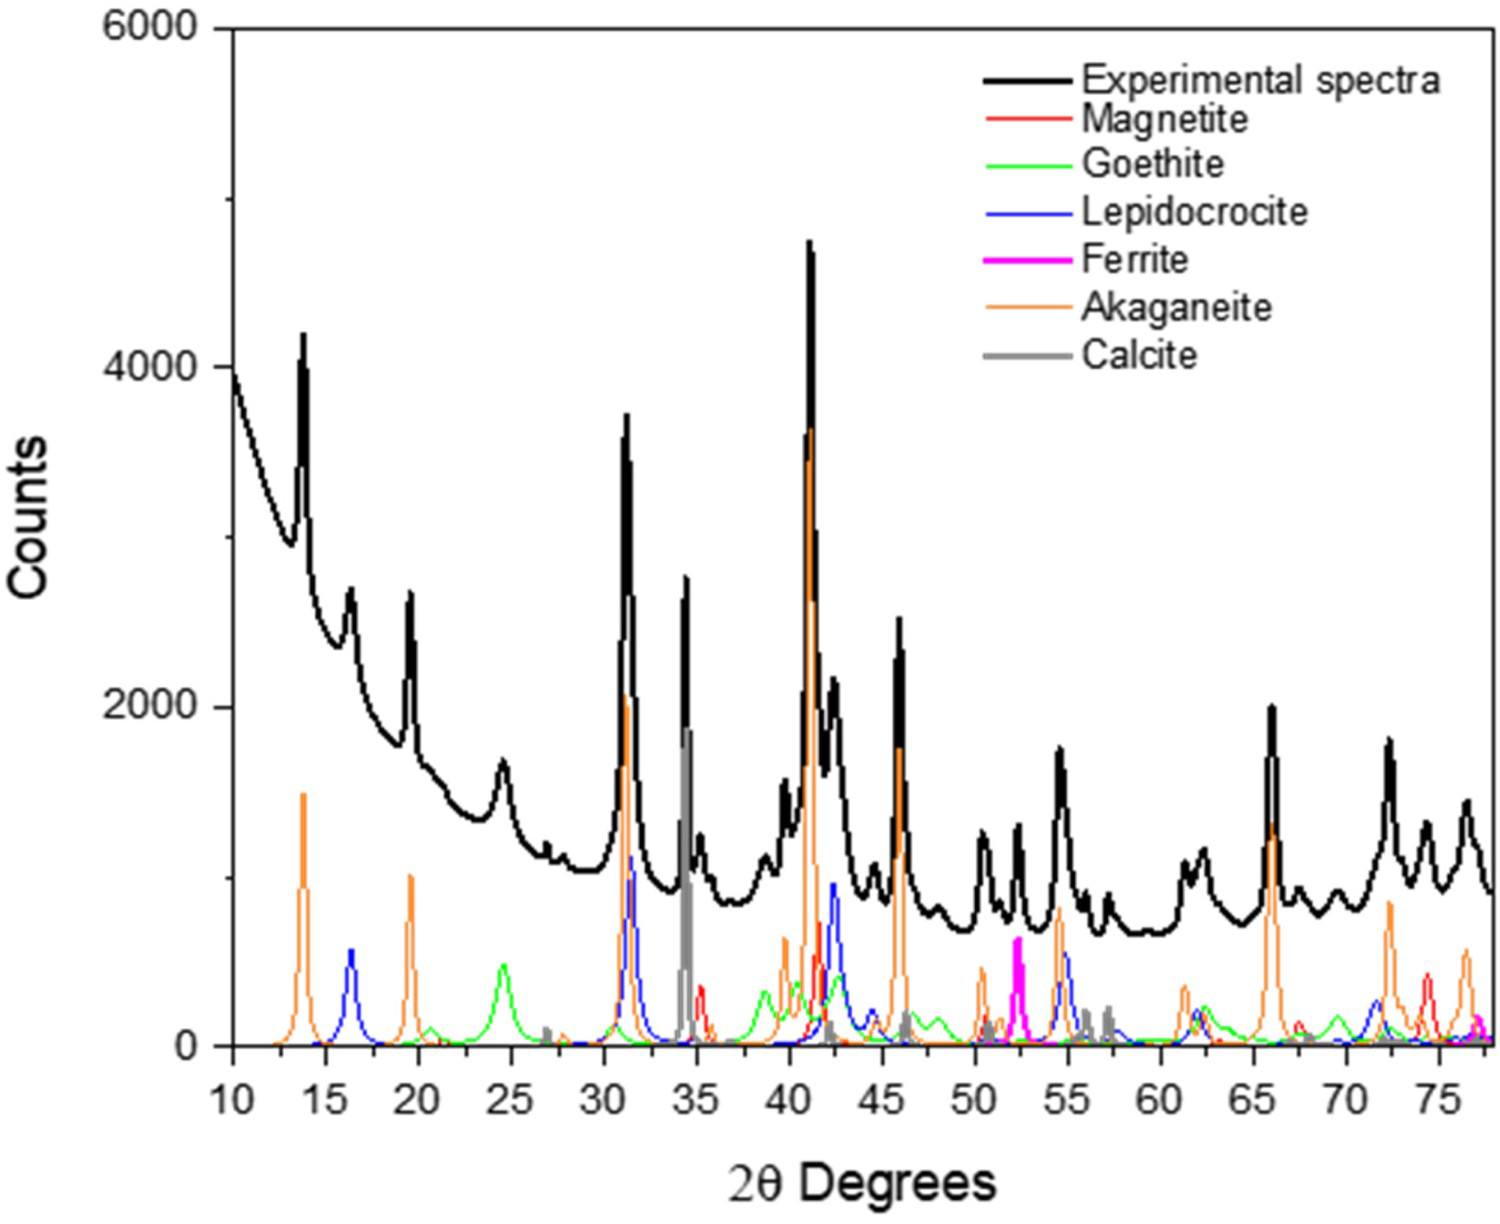
In the ‘W-shaped’ preferential corrosion attack shown in Figure 1, one pit of 4 mm in depth on both sides of the welding line is observed. A close view at the bottom of both pits revealed the presence of transgranular cracks up to 1000 µm in depth (Figure 10). The morphology of these cracks suggests they might be the result of an environmentally induced cracking phenomenon. This is also supported by the fact that the stress varies along the section of the links. In this case, the stress is higher at the inner part of the link and, consequently, the preferential corrosion is more pronounced in this area (Figure 1).
Transgranular cracks found on the bottom of the pits.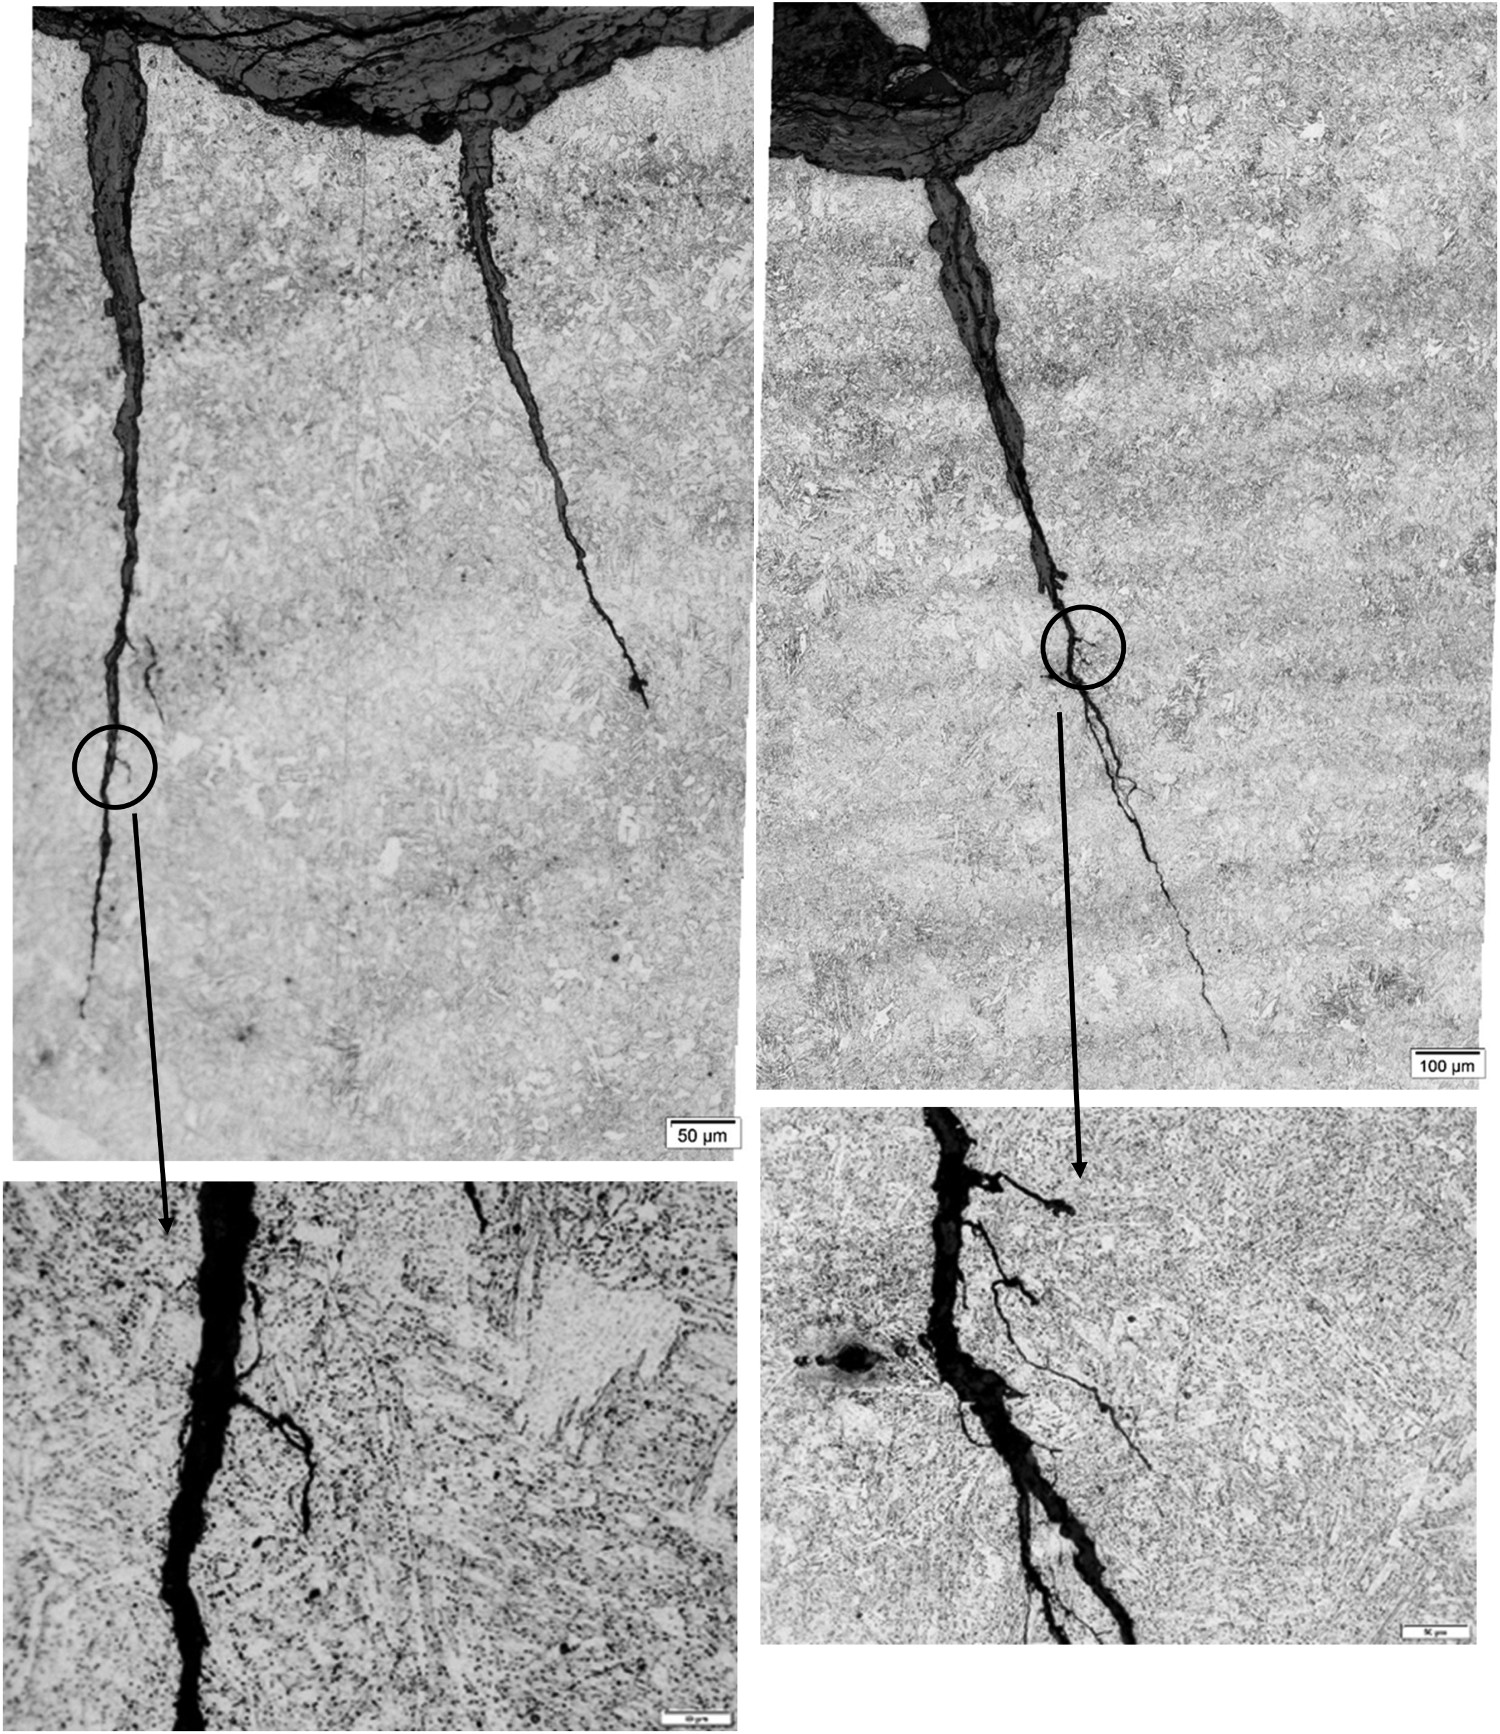
The estimated corrosion rate from the depth of the pits in Figure 1 is about 210 µm per year. It should be noted that the pitting depth is obtained from actual surface which has been also corroded during the service life. According to the fourth edition of API RP 2SK [22], the allowance values for corrosion rate depend on the position of the mooring line either at the splash zone (up to 1 mm per year) or anywhere else (from 100 to 400 μm per year). Moreover, literature reported [23] that the growth of the pitting depth can be up to 1.5-10 times higher than the uniform corrosion rate. So, the corrosion rate obtained from pitting would suggest that the kinetics of the uniform corrosion process experienced by the link occurred at a lower rate. Nevertheless, these kinetics considerations always depend on the operating place as well as the location within the mooring system.
It is widely assumed that the main cause for the W-shaped corrosion attack of the link is due to microstructural changes across the flash weld, with preferential corrosion of the heat-affected zones [20]. The flash butt welding is a resistance welding process requiring lower thermal input but still ensuring a perfect joint and adequate mechanical properties of the system. This welding method generates minimal distortion although a subsequent heat treatment is needed to recover the required structural homogeneity. Despite this, the welding line and heat-affected zones (HAZ) on links are still defined. In the early 2000, Naria da Cruz [24] attempted to study these areas and the base metal by means of electrochemical methods. In this work, the evaluated areas were 11 mm in diameter. Then, the base metal, HAZ and welding line formed part of the tested area at the same time. Notwithstanding this important limitation, the work reported the anodic behaviour of the heat-affected zone with respect to the welding line.
However, by using micro electrochemical cells the behaviour of each area can be studied separately. In the present case, the electrochemical behaviour of these different areas was studied using tips of 450-750 μm diameter. Figure 11 presents the evolution of the open circuit potential measured using a tip of 750 μm in diameter on different sites of samples previously etched with Nital 2%. As it can be seen there is a difference of ±50 mV among each zone, being the HAZ slightly more active than the base metal and welding line.
Evolution of the corrosion potential in three zones.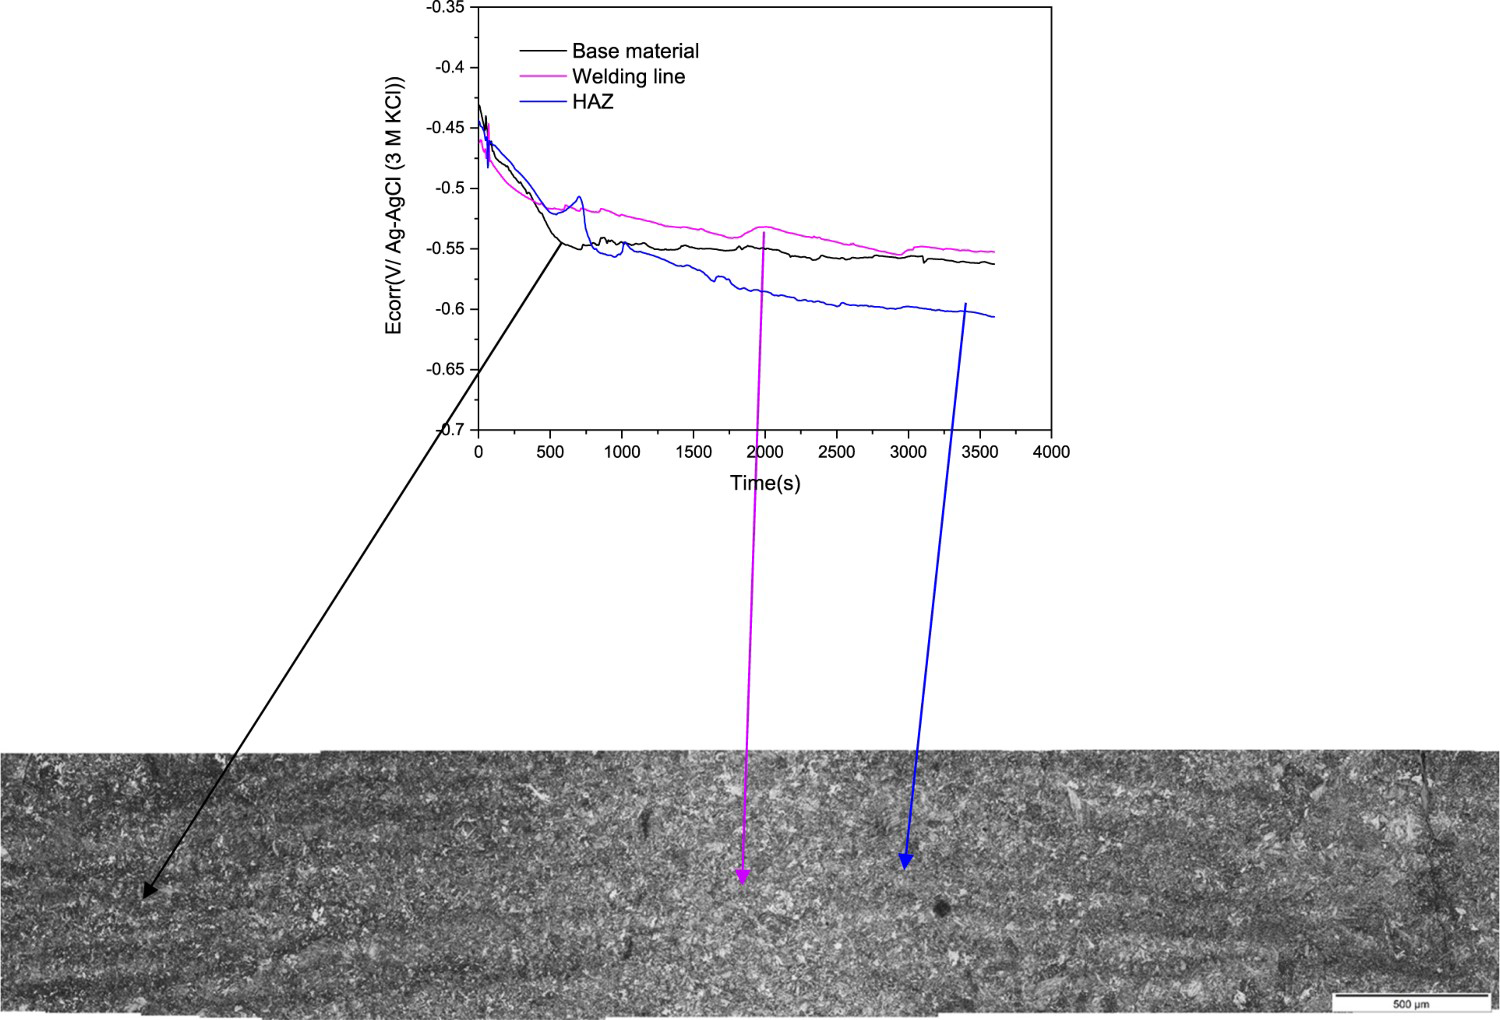
Therefore, the slight differences in composition and microstructure appear to induce changes in the electrochemical nature of the different sites of the welding, as it is revealed by OCP values.
Figure 12 shows the polarisation curve corresponding to base metal (tested area, 1cm2). As it can be seen the corrosion mechanism is under cathodic control, with a corrosion current density of 1.94·× 10−5 A cm−2, and a very active anodic branch. The corrosion potential –E corr, −0.352 V vs. Ref – is close to the pitting potential. As it can be seen, the Ecorr showed on the polarisation curve differs in part with the values recorded in Figure 11. This is due to manner in which the polarisation curves are made, applying a cathodic step of −300 mV and starting the sweep in the anodic sense.
Polarisation curve corresponding to base metal (1 cm2).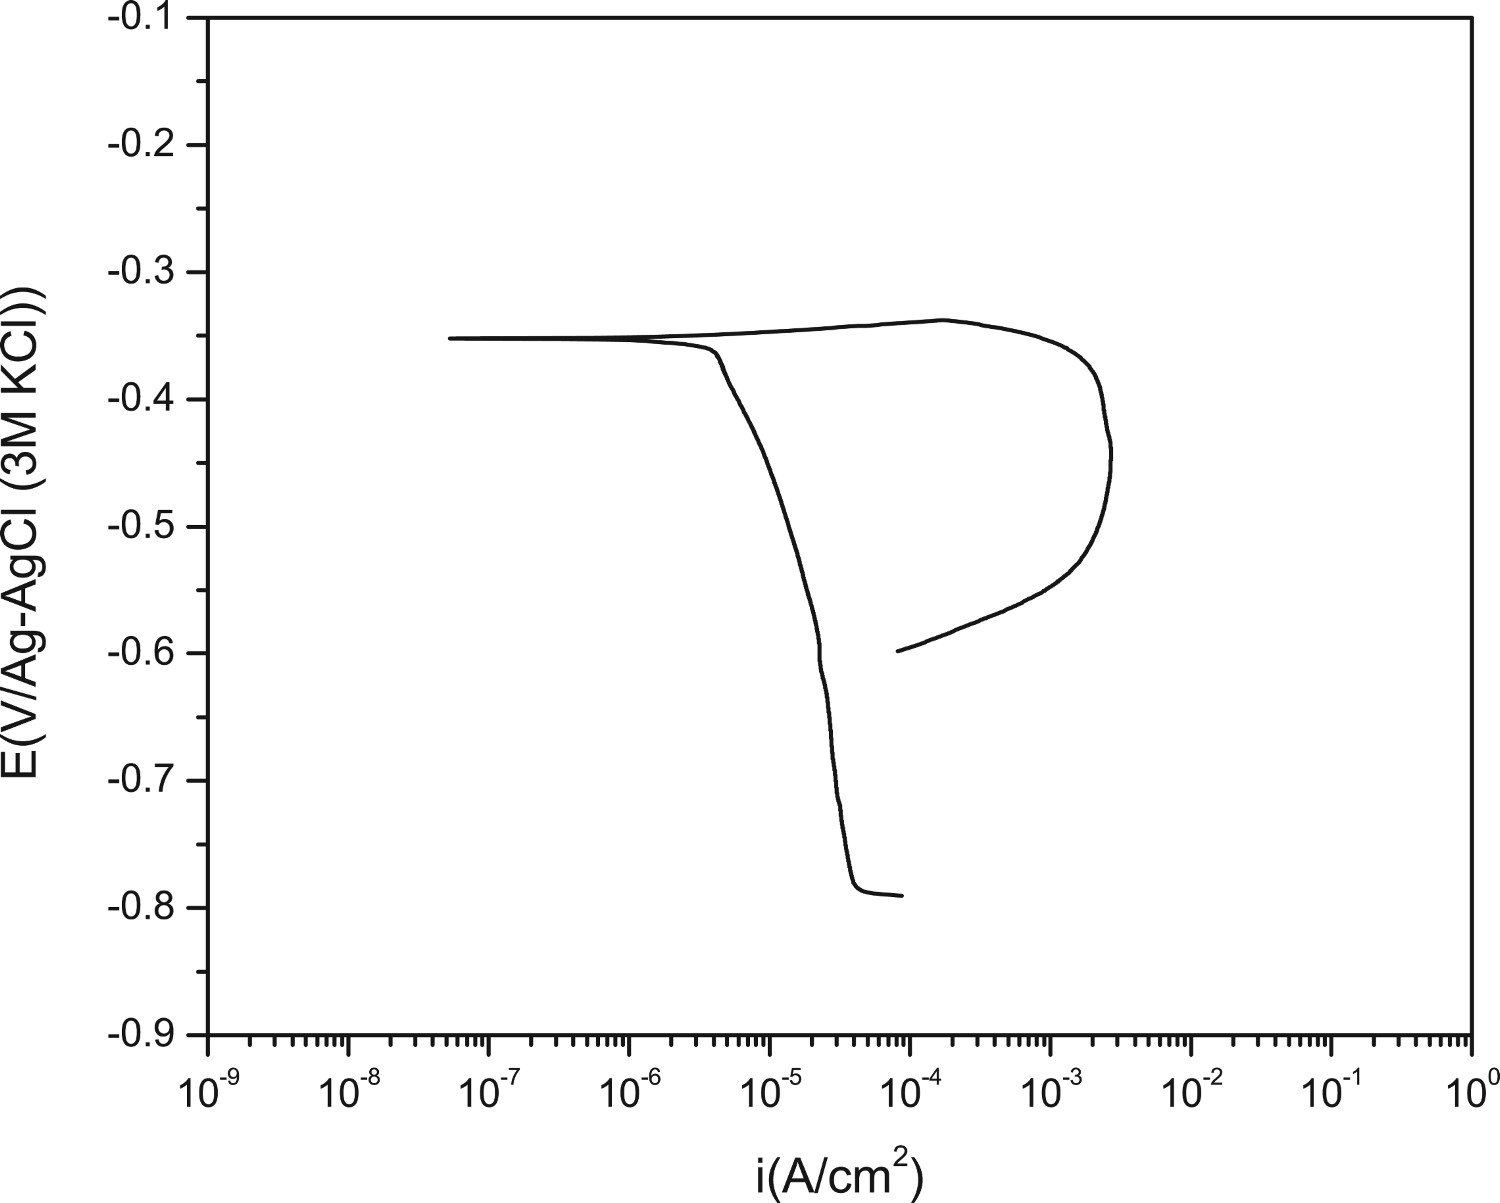
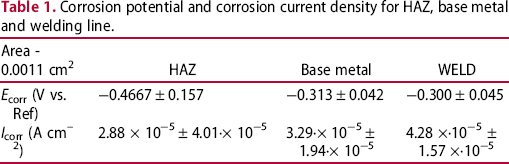
Assuming a homogeneous corrosion attack, the mass-loss rate estimated from the polarisation curve is about 104 µm per year, fulfilling the standards. Figure 13 compares the representative polarisation curves of the different zones: base metal, HAZ and welding line, performed by using a tip of 450 µm of diameter (area = 1.59·× 10−3 cm2). The curve corresponding to the HAZ shows a corrosion current density one order of magnitude higher than those obtained for the welding line and base metal, so the corrosion rate is higher for HAZ compared to base metal and welding line (Table 1).
Polarisation curves of the different zones: base metal, HAZ and welding line, performed by using a tip of 450 µm of diameter (area = 1.59·10−3 cm2). Corrosion potential and corrosion current density for HAZ, base metal and welding line.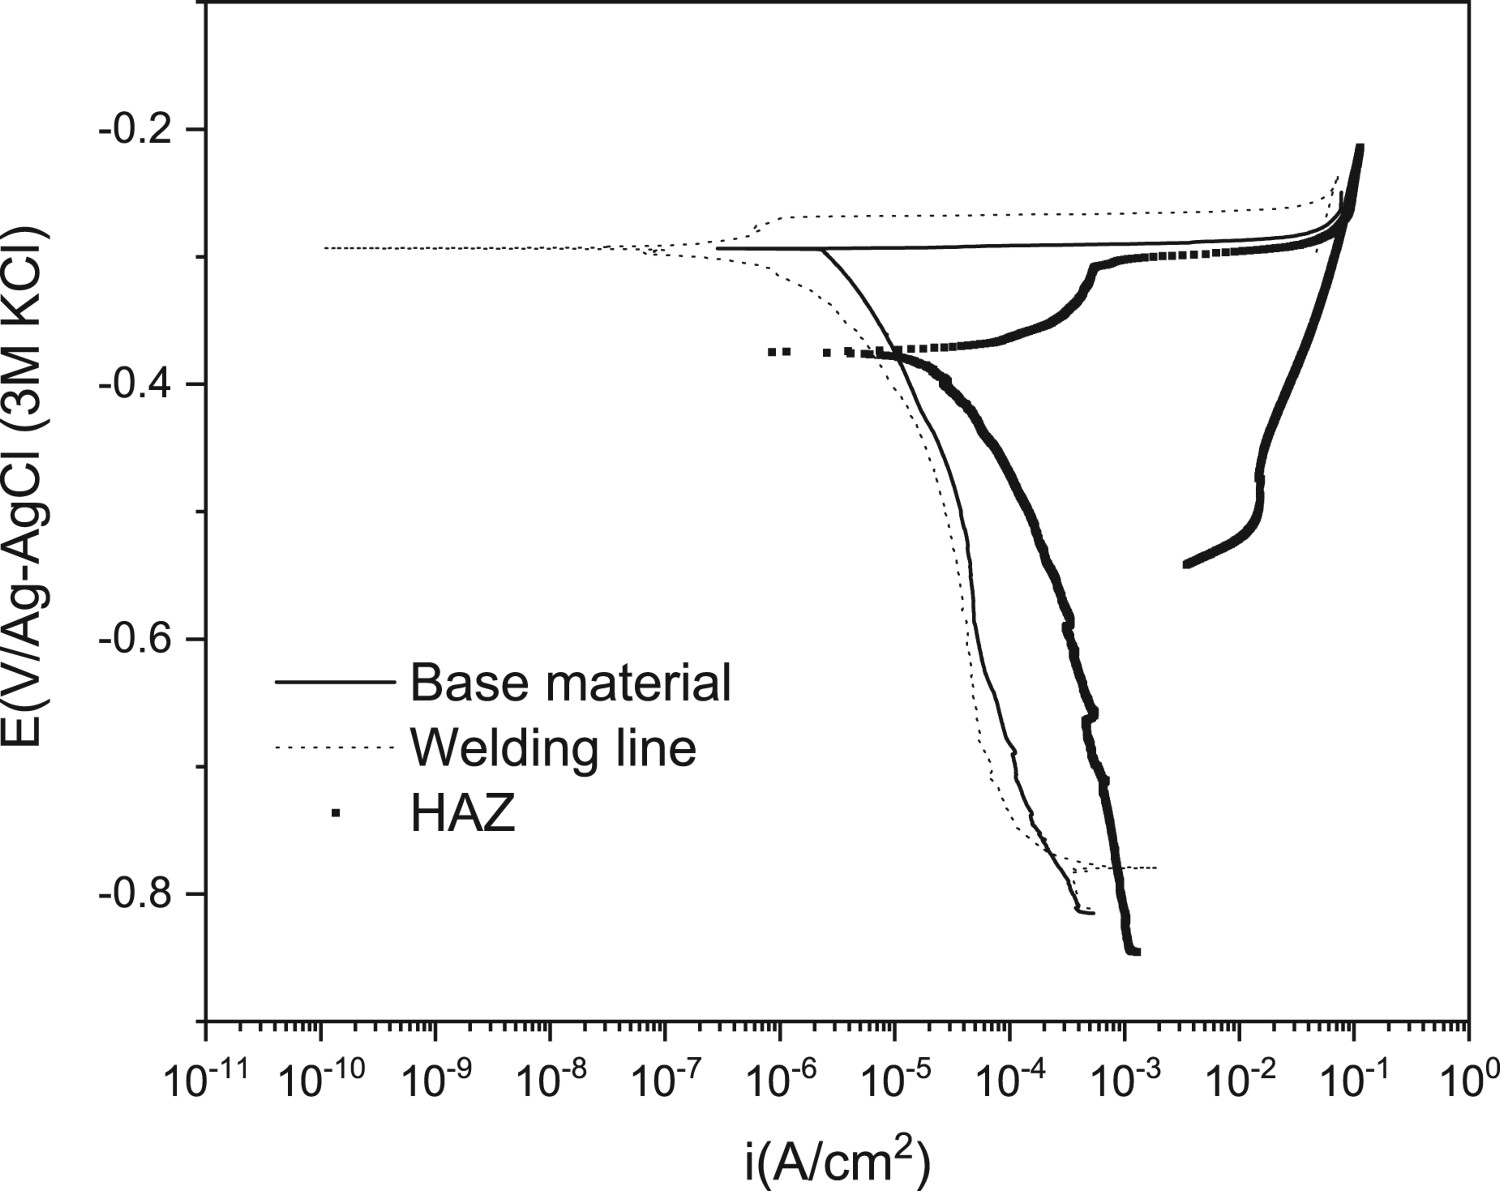
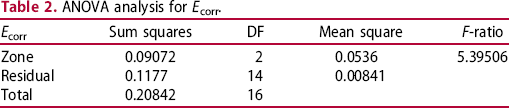
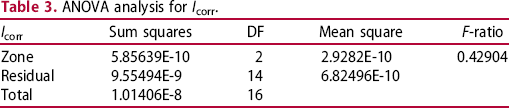
After obtaining the E corr and I corr, one-way analysis of variance (ANOVA) combined with Turkey's honest significant difference (Turkey's HSD) test was performed to analyse the influence of the microstructure on both parameters (Tables 2 and 3), respectively. As it can be seen F-ratio values report statistically significant differences just for the E corr. Turkey 95% simultaneous Confidence Intervals gathered in Figure 14 show all pairwise comparison among base metal, welding line and HAZ. As it can be seen there are significant differences in the E corr mean values between the Welding line and HAZ and also between HAZ and base metal. However, these differences are not significant for the I corr.
Turkey 95% Simultaneous Confidence Intervals. All pairwise comparison among levels for the (a) E corr and (b) I corr. ANOVA analysis for E corr. ANOVA analysis for I corr.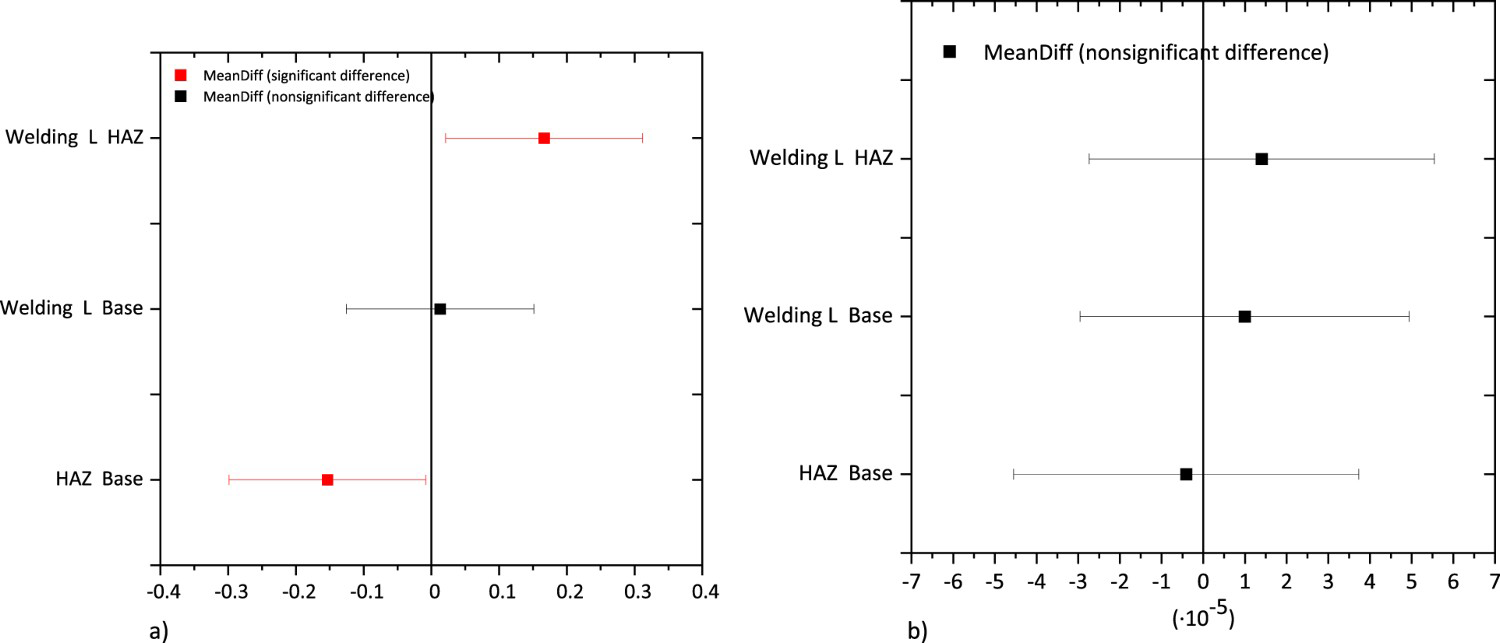
Therefore, both the small differences in Ecorr and the higher corrosion kinetics of the HAZ induced by the slight microstructural changes appear to be responsible for the W-shaped attack developed. Literature reports many examples of preferential corrosion in heat-affected zone/welding line interfaces but mainly related to pipelines with different welding processes and in sour conditions [25]. For this particular R3 grade steel, literature points out that the welding line behaves cathodically with respect to the HAZ. Leis and Nestleroth [26] presented an extensive report on flash weld failures, ascribing the selective corrosion to different mechanisms such as galvanic coupling between the welding line and the base metal.
Considerable research and development works have been carried out in this line for the oil and gas industry, rather than mooring chains. Eckert [27] reviewed the steel degradation problems in the oil and gas production industry, pointing out that one of the internal corrosion threats is the preferential corrosion of the weld caused by the presence of CO2, but such situation is very different from those analysed in the present study.
The results obtained in this work reveal a different electrochemical nature of the HAZ resulting from the redistribution of the alloying elements. The HAZ is a more active site able to trigger the onset of new corrosion cells leading to preferential dissolution of the anodic sites. Moreover, it is important to highlight that the small differences in E corr between the HAZ-welding line or HAZ- Base metal, although statistically significant, are not enough to speed up the corrosion kinetics of the anodic site- HAZ. Therefore, the W-shaped preferential dissolution observed can't be the result of galvanic coupling between the HAZ – welding line or the HAZ – base metal but, the preferential dissolution of the HAZ at its corrosion rate.
Furthermore, any factor that influences and controls corrosion reactions on metal may have an effect on the corrosion rate. Therefore, changes in sea water flow rates, temperature and concentration have a relevant influence on corrosion mechanisms and kinetics [28]. Melchers [29] stated that the North Sea chains can lose 50% more than other places. Therefore, mooring chains immersed during long periods of exposure and under changing exposure conditions could experience enhanced corrosion rates on preferential sites.
Conclusion
A link manufactured of R3 grade steel was removed from a sea water environment after 19 years of exposure, showing a preferential W-shaped corrosion damage around the welding line. The slight compositional and microstructural changes observed in the tempered martensitic steel induce differences in the electrochemical behaviour. The welding line showed nobler corrosion potential and lower corrosion current density with respect to the heat-affected zone. Therefore, under service conditions the HAZ of the R3 grade steel showing lower corrosion potential is more prone to develop corrosion attack, leading to preferential dissolution of these sites resulting in the W-shaped corrosion damage.
Footnotes
Acknowledgements
The authors acknowledge the financial support from VICINAY MARINE INNOVACIÓN A.I.E.
Disclosure statement
No potential conflict of interest was reported by the author(s).