
Abstract
In the present research work, the extruded nickel aluminium bronze (NAB) alloy is friction surfaced over cast NAB alloy as a repairing technique for the deteriorated marine components. The friction surfaced specimens were tested for their corrosion properties. The corrosion tests such as salt fog test, erosion–corrosion test and pitting corrosion test were conducted to investigate the corrosion behaviour of the friction surfaced NAB alloy. It is found that the accumulation of corrosion occurred due to the presence of a continuous network of the ΚIII-phase. The lower corrosion rate is achieved in friction surfaced NAB alloy compared to the base NAB alloy which is contributed by the corrosion resistant contents such as Al and Cu and also by the fine grain microstructure obtained during the friction surfacing process.
This paper is part of a supplementary issue from the 17th Asia-Pacific Corrosion Control Conference (APCCC-17).
Introduction
Friction surfacing (FS) is a relatively recent surface engineering technology that can be applied to many metals including aluminium, magnesium, iron, copper, titanium and nickel-based alloys [1]. Cast nickel aluminium bronze (NAB) alloys are widely used in marine applications and hence earned the nickname of ‘propeller bronze’. They exhibit a unique combination of properties including moderate strength and toughness, excellent fatigue strength, corrosion, cavitation and erosion resistance, which make them an outstanding choice of material for use as naval propellers. These bronzes are copper-based alloys with addition of nickel 3.5 wt-%, aluminium 10 wt-% and other alloying elements [2,3]. Furthermore, it was shown that the achieved homogeneity and the fine-grained microstructure produce good mechanical properties to this bronze alloy. Also, the small voids and casting defects in these alloys near the surface can be closed [4,5]. For larger casting defects as well as worn-out or damaged surfaces, new material has to be added by employing advanced coating processes. Standard fusion welding methods have now been employed for repairing components, if at all possible. Adequate mechanical properties can be achieved by subsequent heat treatments which are followed by non-destructive testing to detect welding defects if necessary [6,7]. For such cases, FS could be a useful alternative, since it allows depositing material which can produce a favourable microstructure.
In FS process, a consumable rod (mechtrode) is rotated, under constant axial force, against a flat substrate, which is firmly clamped to an anvil. Friction between the mechtrode and the substrate results in intense localised heating, causing significant softening and plastic deformation of the mechtrode material. As the substrate is made to move, hot plasticised metal from the mechtrode gets deposited on to the substrate, resulting in a metallurgical bonded coating along the line of traverse [1,6,7].
Most of the published literature on FS deals with coating aluminium with stainless steel, because of their strong industrial relevance and corrosion resistance. Reported investigations have focused on studying various process variables [8–12], material flow behaviour [1,13] and temperature distributions [14,15] to obtain a sound deposit. Though the metallurgical characteristics and mechanical properties of friction surfaced coatings were investigated in detail by many researchers [16–22], the performance aspects of friction surfaced coatings have received a very little attention to date. The published information available on the corrosion performance of friction surfaced coatings in NAB alloy is sparse. Therefore, in this current work, the corrosion behaviour of NAB alloy deposits obtained through FS process was evaluated using erosion corrosion, pitting corrosion and salt fog tests.
Materials and experimental methods
Specimen preparation
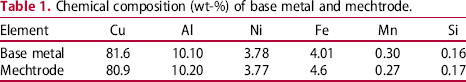
Chemical composition (wt-%) of base metal and mechtrode.
The substrate was prepared for surfacing by grinding with 120-grit abrasive paper and degreasing with acetone. A full computer numerical controlled friction stir welding machine was used to perform the surfacing. Based on the trial experiments optimum FS parameters were identified and they are 200 mm min−1 traverse speed, 60 mm min−1 plunge rate and 2500 rev min−1 rotational speed of the studs yielded defect-free coating with higher bonding strength. Single layer surfacing was performed.
Metallography examination
The specimens were mounted in epoxy resin and then the testing face was ground sequentially to 2500 grit SiC papers for a fine polished surface. Then it was polished with a 1 µm diamond polisher. The specimens for micrographic examination were polished by above-mentioned procedure and etched chemically in a solution of 5 g FeCl3 + 2 mL HCl + 95 mL C2H5OH for 3 s, and then rinsed with acetone and water and dried for metallographic observation [23].
Corrosion test
Salt Spray test
Specimens were first cut to the size as specified by ASTM B117M (Salt Spray fog test). Holes were drilled at the top of each specimen so that they could be held steadily. The weight of the individual specimens was recorded before exposing the specimens into a salt fog. Salt spray test parameters are as follows: temperature of the test: 33°C, the concentration of the salt solution: 1.0 M, air pressure: 2.0 Kg cm−2 and pH of the solution 7.0. 3.5% NaCl solution was sprayed in the form of fine droplets similar to fog and the specimens were exposed for 72 h. After 24 h of exposures, one parent metal and one friction surfaced specimen was taken out and the weight loss was measured. This was repeated after 48 and 72 h of exposures. Following which the specimen was carefully washed with distilled water and concentrated HCl in the ratio of 2:1. After the residues were dissolved the specimens were once again weighed. The difference in weight before and after the test was calculated. The corrosion rate was calculated from the following formula [24]:

The corrosion rate is measured in mm per year (mm y−1). Where, K = Constant (8.76 × 10⁴), T = Time of exposure in hours (1 h), A = Area in cm2, W = Mass loss in grams and D = Density in g cm−3 (8.94 g cm−3).
Erosion–corrosion test
Slurry erosion test was conducted in a specially designed test rig and it is shown in Figure 1.
Schematic of erosion–corrosion test rig.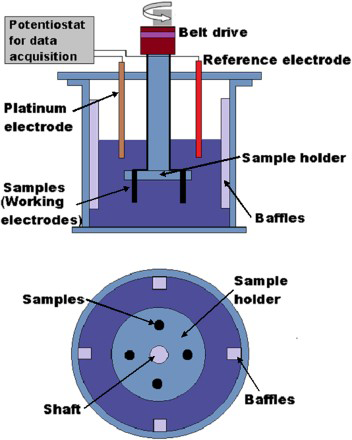
This test rig facilitates testing at different sets of parameters. It has built-in flexibility through which impact velocity (v), the angle of impingement (h), mass flux rate (m), particle size (S), distribution (d) and standoff distance between the nozzle outlet and target surface could be individually controlled.
The rig is based on a design known as the non-recirculation type which simulates the actual working environment of the fluid machinery especially turbines and pumps. Slurry erosion testing was conducted in accordance with the procedure given in ASTM G-73. Specimens were cut into the dimension of 10 mm diameter, 10 mm thick by wire cut EDM. Samples were polished with 2500 grit emery papers over the roughly finished surface. The samples prepared for slurry erosion corrosion for substrate and friction surfaced samples are shown in Figure 2.
Erosion–corrosion test specimen (a) parent metal and (b) coated metal.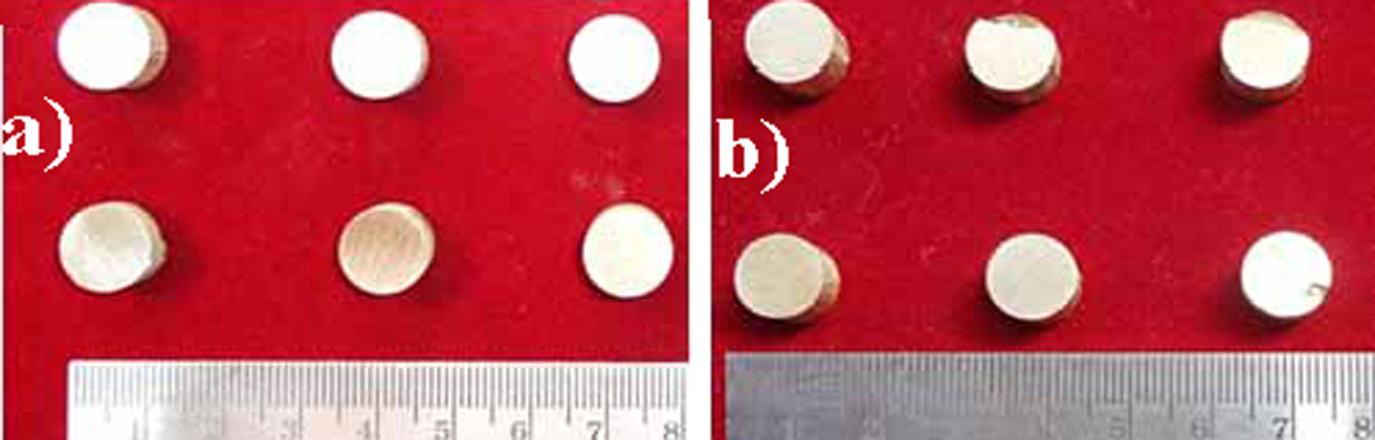
Before testing all the samples, coated as well as uncoated were ground using emery papers down to 1500 grit size. Thereafter, they were polished using 1 µm alumina slurry paste on disc polishing machine. Mass loss measurements were performed using a precision weighing balance with an accuracy of 0.0001 mg. After the test, initially, there was an increase in weight due to the addition of corrosion products. So, in order to remove the products, the specimens samples were washed with water combined with concentrated HCl acid solution in the ratio of 2:1 and dried in air before weight measurements. Natural silica sand sieved to a nominal size range of 50-344 µm was used as an erodent. The average silica sand before the test is in a size range of 220-500 µm. It is noted that the size of the sand particles gets reduced from the nominal size range of 344-177 µm. The corrosion rate for this erosion–corrosion test was calculated from the Equation (1) same as for the salt spray equation.
Results
Corrosion rate under salt fog conditions
The uncoated parent metal and deposited metal were exposed to a salt spray for a period of 24, 48 and 72 h. The corrosion rate for the uncoated and deposited metal was recorded for different salt spray period and presented in Figure 3. The corrosion rate for both deposited and uncoated metal increases with increase in salt spray exposure period. However, the uncoated metal shows lower corrosion rate than the deposited metal.
Effect of spraying time on corrosion rate of coated metal and base metal.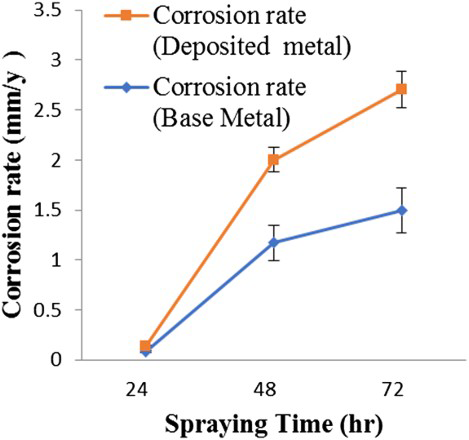
Corrosion rate under erosion and corrosion conditions
The weight loss that incurred in the uncoated base metal and the deposits were measured as a function of the impact angle in the presence of the slurry. It was observed that when the impact angle increased from 30 to 90° the weight loss decreased. Erosion rate was calculated using the weight loss method, whereas the corrosion rate was calculated from the formula (Equation (1)). Erosion and corrosion rate of base metal and friction surfaced NAB alloy is given in Figure 4. From Figure 4, it is observed that the erosion rate and corrosion rate decreases at 90° compared with 30°. In base metal corrosion and erosion rate is higher than deposits.
Effect of impact angle on erosion–corrosion rate of coated metal and base metal.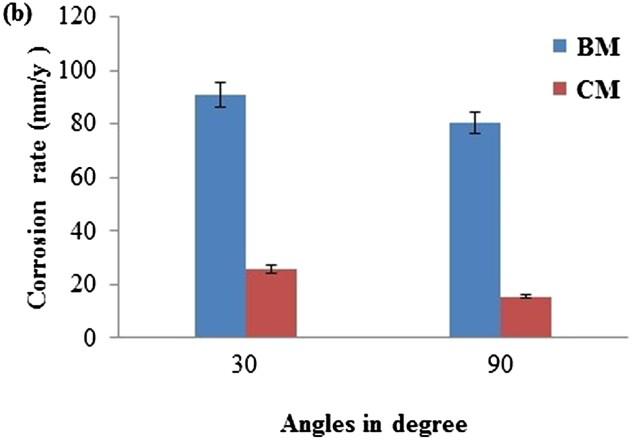
Microstructural characterisation
Figure 5(a–d) shows the optical micrographs of the substrate (cast NAB alloy), mechtrode (extruded NAB) and friction surfaced zone.
Optical micrograph of substrate, tool and friction surfaced interfaces (a) Base material-cast NAB alloy, (b) mechtrode-extruded NAB alloy, (c) interface – FS and substrate and (d) unmixed FS.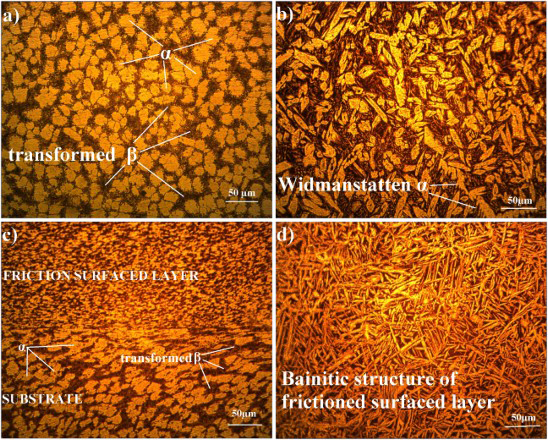
The cast NAB alloy has (Figure 5(a)) (i) α phase, (ii) β′ phase formed during solidification alter to the FCC primary α phase, (iii) globular kappa κii (Fe3Al) (medium grey), (iv) fine κiv precipitates which are also nominally Fe3Al and (iv) eutectoid mixture of β transformed →α+κiii phase of proeutectoid κiii (NiAl) globular morphology (dark grey) [25]. The XRD pattern for the NAB alloy is shown in Figure 6. XRD using cobalt as a target at a working voltage of 35 kV with a test current of 25 mA. Scanning range from 30 to 90° with a step size of 0.06° (2θ) was used during the study.
XRD pattern of NAB alloy.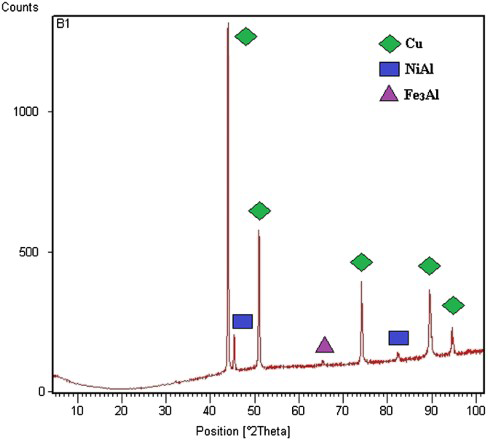
Tool (mechtrode) material shows a Widmanstätten pattern of the microstructure (Figure 5(b)) [26]. The microstructure consists lamellar/few globular α grains in addition to some flakes of α grain, surrounded by quenched β phase. Owing to high stress induced during FS process, a bainitic structure is attained by the friction surface layer which is shown in Figure 5(d) [27]. Close to the surface of the layer, the phase is of lamellar shape. In Figures 5(c), the friction surfaced interface microstructures reveal the good bonding of these layers. Figure 5(c) shows elongated α grains mix together with dark etching β transformed products. This is due to the severe plastic deformation of stir zone and experiencing higher temperature than 800°C leading to the eutectoid reversion into the β structure. In the unmixed friction surfaced region (Figure 5(d)), microstructure clearly unveils the existence of alpha grains (white needles) are smaller than in the as-cast condition, which is really very fine (0.86 µm) as compared to figure 5(b) which are having an average grain size of around 1.89 µm. This fine microstructure is due to hot forging nature of FS process. In interface location on the weld surface, the microstructure comprises elongated α grains and β grains, but the size of α grains is greater while the volume fraction of β transformation products is less as observed in Figure 5(e). But in the other location (Figure 5(f)), both α grains and β transformation products are visible, but α grains are highly deformed as compared to Figure 5(e).
Morphology of corroded surfaces
After the erosion–corrosion test, the damaged surfaces of the specimens were examined by optical microscopy as shown in Figure 7(a–d).
Optical micrograph of erosion corrosion (a) base metal at 30°, (b) base metals at 90°, (c) friction surfaced at 30° and (d) friction surfaced at 90°.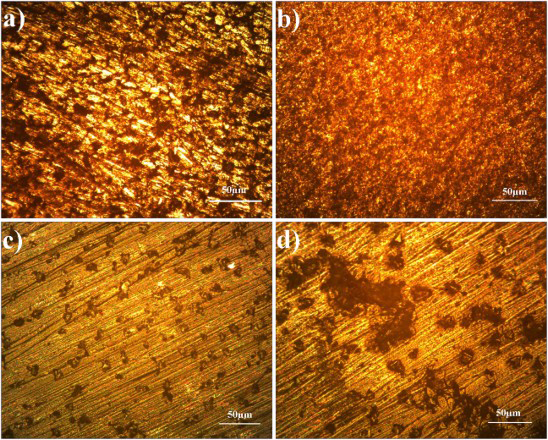
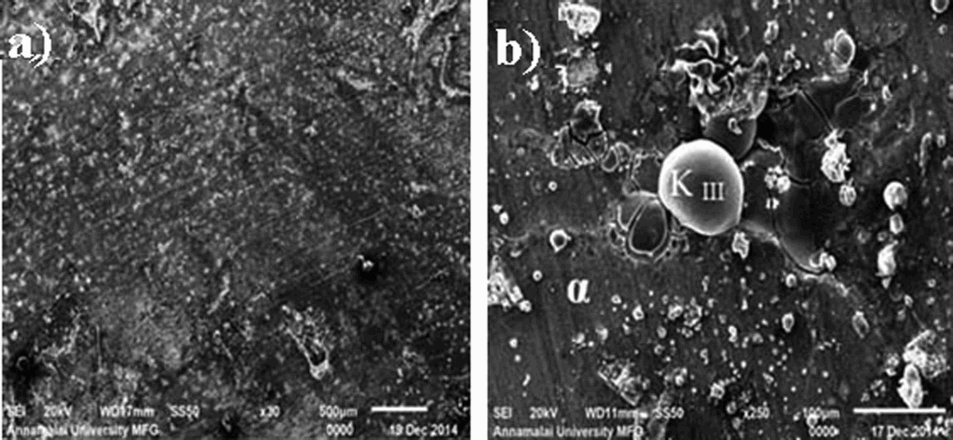
It is noted that due to the continuous impact of slurry on the samples there was the presence of corrosion pits on the surface of the samples. It is observed that corrosion pits are more on the substrate than the deposit in both 30° (Figure 7(a,b)) and 90° (Figure 7(c,d)). Numbers of corrosion pits are directly proportional to the weight loss. This is the main reason behind the weight loss of the samples after the test. Using a scanning electron microscope, silica sand before and after the erosion–corrosion test was scanned on the surfaces at 250 × magnifications and micrographs are shown in Figures 8, whereas the coated and uncoated metals at 30° were scanned and shown in Figure 9. The base metal is heavily eroded (Figure 9(a)) when compared with the coated metal (Figure 9(b)). The corrosion products are formed all over the surface of the base material, whereas in coated sample corrosion products are formed in selected areas only.
Scanning electron micrograph of silica sand. (a) Before erosion corrosion and (b) after erosion–corrosion test. Effect of impact angle on erosion–corrosion morphology. (a) Base metals in 30° and (b) coated metal in 30°.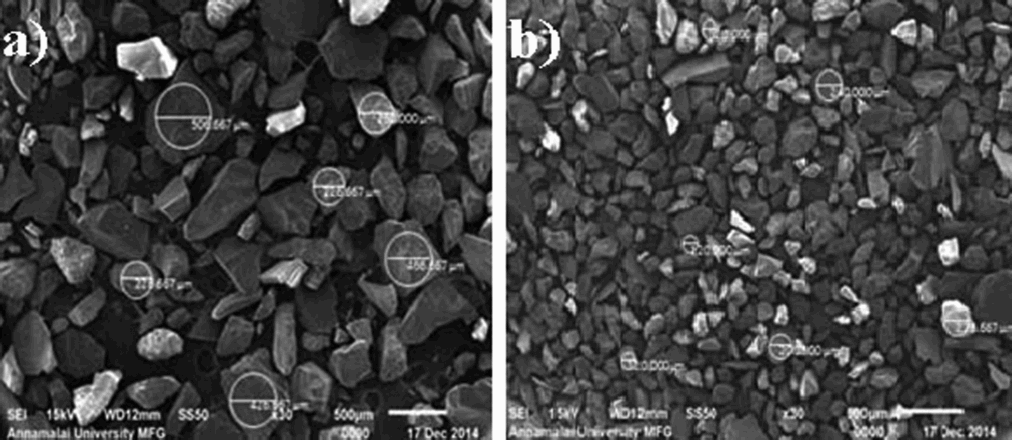
Discussion
Since the friction surfaced metal has finer grains (Figure 5(c)), its strength is expected to be higher than that of the parent metal. First, the coarse microstructure of the NAB alloy (Figure 5(a)) had a lower corrosion resistance than the finer counterpart. Turnbull and Ryan reported that the depth of attack in the cast NAB alloy was strongly influenced by the size and distribution of microconstituents, and the coarser microstructures resulted in a deeper attack [28].
The coarse microstructure resulted in the segregation of elements especially in the grain boundaries and this could provide the corrosion path for the solution of preferentially corroded phases. FS resulted in the breakup/decomposition of the coarse phases and the homogenisation of elements. This greatly eliminated the corrosion path, thereby enhancing the corrosion resistance [29]. On the one hand, these regions showed much lower corrosion resistance than the densified regions. On the other hand, the porosities increased the area between the sample and the corrosion solution and this further accelerated the corrosion process [30,31]. The corrosion rate increased with the increase in spraying time. The increase in spraying time enhanced the tendency to form the corrosion products, which accumulated over the surface of the samples. This is attributed to the corrosion occurring over an increasing fraction of the surface, which is the soluble corrosion product. The soluble corrosion product on the surface of the alloy could increase the corrosion rate. The friction surfaced deposit has a high level of residual stress and so the strain. This causes high uniform corrosion rate (Figure 3). However, the friction surfaced deposit is expected to have high hardness. Hence, it resists erosion–corrosion, as for erosion–corrosion hardness as well as corrosion resistance of the metal are important. Therefore, the friction surfaced deposit shows better erosion–corrosion resistance than NAB alloy (Figure 4).
The types of erosion mode shown by the friction surfaced coatings were identified by the values of impact angle. A material shows low erosion rates at high impingement angle (90°) fall impact mode of erosion materials. If the maximum erosion rate is shown at 30°, then the material belongs to the category of shear mode materials [32]. At a low impact angle, i.e. 30°, shear stress is dominant, at 90°, the impact stress becomes dominant [33]. From the erosion–corrosion test results, it is inferred that NAB, showing the shear mode of erosion. From the optical micrographs, it is understood that as-cast microstructure of substrate contains coarse grains, whereas in deposits contain fine homogeneous microstructure. It is mainly due to grain refinement by FS. This fine microstructure in deposits can be achieved by stirring action of mechatrode with the substrate [34–36].
NAB alloy surface corrosion was initially confined to the eutectoid regions with a slight attack of the copper-rich α-phase within the α+KIII eutectoid. While the eutectoid α-phase was preferentially attacked, the α-grains show very little attack; this is a form of selective phase corrosion [37,38]. The accumulation of Cu2O deposits at these locations will limit the diffusion (mass transport of species including copper-ions, chloride and dissolved oxygen) towards and away from the NAB surface, thus there is the potential for a microenvironment to develop beneath the deposit. From the erosion–corrosion plot, it can be observed that the corrosion rate increased with the decrease in impact angle (Figure 4) i.e. low erosion rate act at high angle (90°), high erosion rate act at a low angle (30°).
Conclusion
The friction surfaced NAB alloy exhibits inferior corrosion resistance in the salt fog spray condition compared to the parent metal. The weight loss rate of both the substrate and deposits increased as the angle of impact decreased from 90 to 30°. The friction surfaced extruded NAB alloy showed a much lower corrosion rate in the erosion–corrosion condition than the cast NAB alloy due to the fine grain microstructure and annihilation of casting porosities during FS. Also from the microstructural evaluations, the corrosive phases influence the weight loss and it directly leads to the increased corrosion rate which is higher in base metal compared to the friction surfaced material.
Footnotes
Disclosure statement
No potential conflict of interest was reported by the authors.