
Abstract
Stress corrosion cracking is one of the aging phenomena for the major structure components in nuclear power plant. During the operation of a power plant, stress corrosion cracks are initiated and grown especially in dissimilar weldment of primary loop components. Among the three factors (susceptible material, residual stress, and corrosive environment) which make the SCC, the residual stress becomes a critical factor for stress corrosion crack when it is difficult to improve the material of the components and their environment under operating conditions. In this study, stress corrosion cracks were artificially produced on STS (stainless steel) 304 pipe itself by control of welding residual stress. The instrumented indentation technique and 3D finite element method (FEM) analysis (using ANSYS 12) were used to evaluate the residual stress values in the GTAW area. As the result of both FEM analysis and experiment, the stress corrosion crack was quickly generated and could be reproduced, and controlled by welding residual stress. Also non-destructive evaluation signals by Acoustic Emission will be discussed for the initiation and growth of SCC.
This paper is part of a supplementary issue from the 17th Asia-Pacific Corrosion Control Conference (APCCC-17).
Introduction
Environmentally assisted crack, such as stress corrosion cracking (SCC) of the NPP structural materials, has been one of the causes for the shutdown of the power plant resulting in a significant loss, incapacitating the production electric power. The resultant repair and replacement of components in light water reactors (LWR) remains as one of the limiting factors for the safe and economic operation of LWRs, especially in the plant life extension period. Stress corrosion cracking usually occurs when the following three factors exist at the same time: susceptible material, corrosive environment, and tensile stress (including residual stress). Among these factors, the residual stress becomes a critical problem for stress corrosion cracking when it is difficult to improve the material corrosivity of the components and their environment under operating conditions [1,2]. Generally, the residual stresses are induced by the welding process. The welding is mostly used for manufacturing of the structure materials such as nuclear power plant (NPP) and vehicle. Weld residual stresses have a large influence on the behaviour of cracking that could possibly occur under normal operation of components. Tani et al. reported that chloride-induced SCC of the austenitic stainless steel occurred independently of the tensile residual stress value. They have performed the SCC test on the austenitic SS using loading device and showed that the specimen of type 304 L SS was fractured even when the applied stress was below 200 MPa which was less than 0.2% proof stress of type 304 L SS [3]. Most of the studies have used the slow-strain-rate test (SSRT), which is not useful for studying the effect of stress level [4]. Since the research of Mazille and Rothea, it is well known that Ni-based alloy and stainless steel are susceptible to stress corrosion cracking (SCC) in deaerated pure water at high temperature, but the test was performed in an autoclave where is possible to contain a specimen [5,6]. The conventional method of manufacturing artificial stress corrosion cracks is difficult to imitate in environmental conditions of the NPP because the resulting cracks are not obtained by using a pipe actually used for equipment of NPPs but by using a simulation specimen.
In this study, the stress corrosion crack was artificially produced on the materials of the NPP by using the custom-made device. The device provided a real environment of NPP and the semi-automatic gas tungsten arc welding (GTAW) process was used for giving the residual stress in the inner of the pipe. The fracture time, which is defined by the pressure drop in a SCC test, of the STS 304 pipe was used to confirm the residual stress effect by welding heat input. Also, 3D finite element method (FEM) analysis model is designed for the STS 304 pipe and heat transfer analysis and residual stress analysis performed. On the other hand, although many studies were carried out on corrosion and cracking, their exact characteristics are not revealed clearly. Moreover, because the previous studies were performed on SSRT or compact tension specimens, rather than on real tubes used in NPPs, it is difficult to make certain correlations between AE (acoustic emission) signals and SCC in a real tube [7–10]. Therefore, it is necessary to conduct the test with a tube in similar SCC environments and analyse the AE signal, which transients during the SCC process.
Experimental
SCC forming equipment
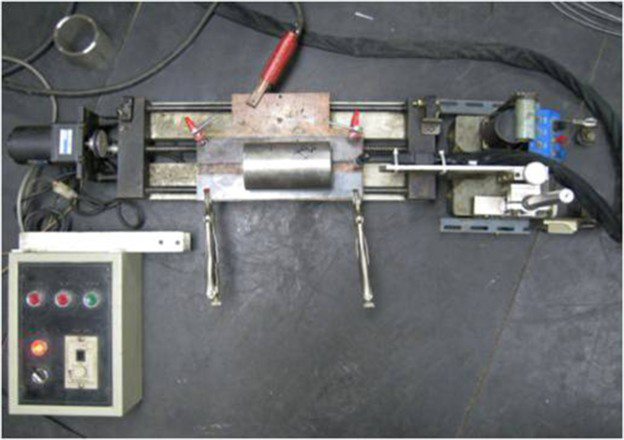
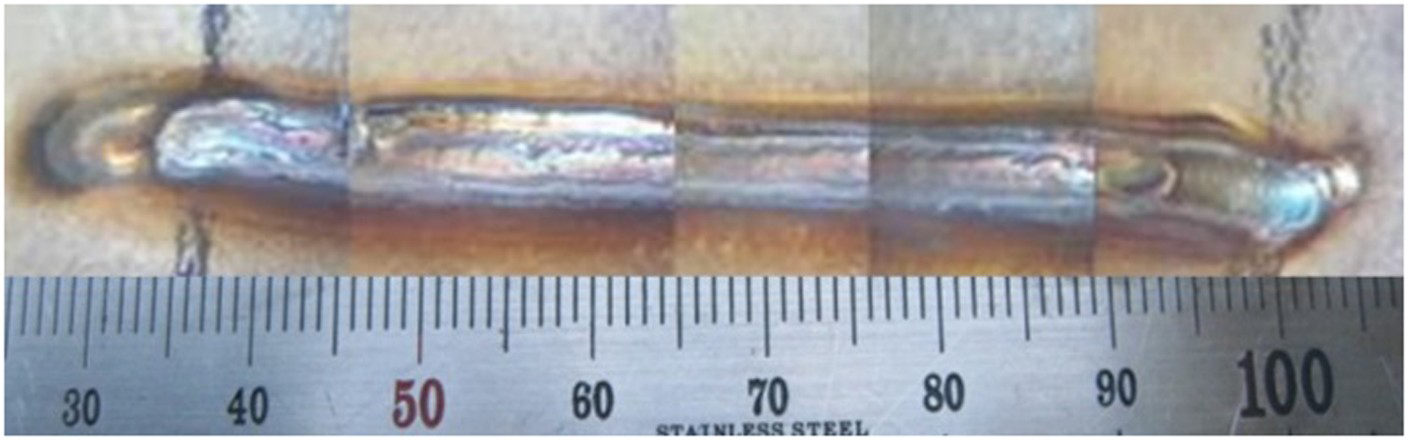
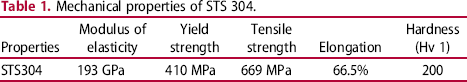
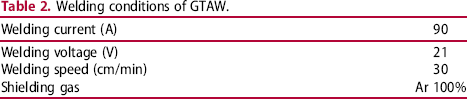
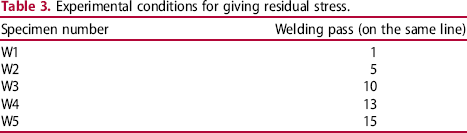
The test material was austenitic STS 304, which is used as pipelines in the Reactor Coolant System of NPPs (O.D. = 89 mm, t = 7.7 mm). The stress corrosion crack forming equipment is shown in Figure 1. The equipment for forming stress corrosion cracks consisted of a heater, pressure sensor, AE sensor, load cell, and DAQ (data acquisition) system, and so forth. Generally, an autoclave is used to simulate the environment condition of high pressure and high temperature for making a SCC analysis. But, in this study, the autoclave was not used. The heating coils were directly imposed on the surface of the pipe to generate high steam pressure and temperature of the inner pipe, and the inside of pipe specimen was filled with corrosive solutions. The test was performed using the stainless steel 304 pipe in 2M Na2SO4 and 1M NaOH solutions. The length of the specimen is 150 mm. Table 1 shows mechanical properties of the STS 304. The yield stress of the STS 304 material is 139 MPa and vapour pressure of the specimen according to the ideal gas equation is 165 bar at 350°C. In this case, hoop stress was 124 MPa caused by vapour pressure. The GTAW process was used for the residual stresses in the custom-made system. Figure 2 shows the semi-automatic GTA welding system for extracting the residual stress. And Table 2 is the welding conditions for GTAW. Figure 3 shows BOP (bead on plate) bead inner of the pipe (in the bottom, at the 270° position) using the GTAW process. Table 3 shows welding pass conditions for giving the different residual stress. We welded an inner pipe using the same condition on the same line.
Diagram of SCC forming equipment and cross section of tube specimen. The semi-automatic GTA welding system for giving the residual stress. BOP bead inner STS 304 pipe. Mechanical properties of STS 304. Welding conditions of GTAW. Experimental conditions for giving residual stress.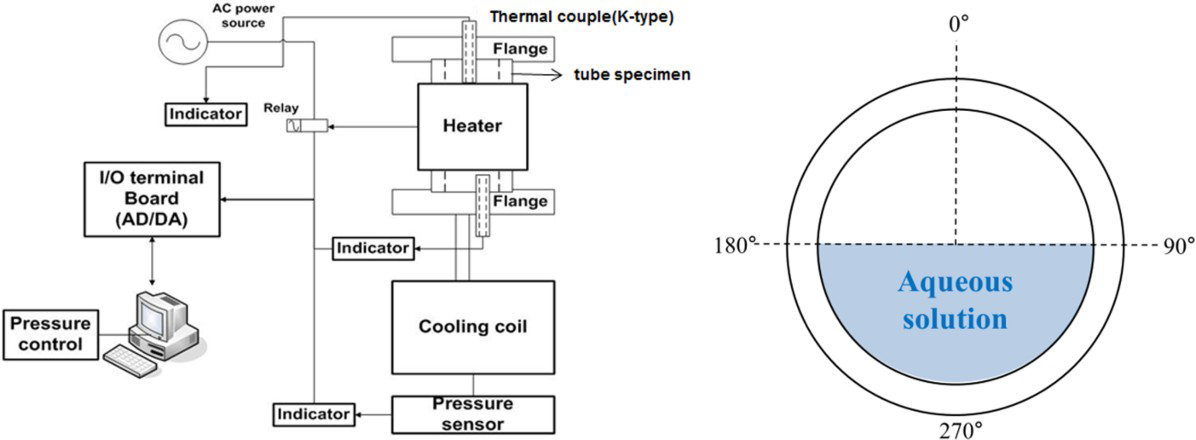
FEM analysis and residual stress evaluation
For the heat transfer analysis, we had divided a step of heating and cooling analysis for each pass by using the thermal physical properties of STS 304 according to temperature and typically melting point of steel. For the FEM stress analysis, we predicted a variation of the welding residual stress using the thermal physical properties and boundary conditions, which is a temperature variation by heat transfer analysis [11]. The commercial code ANSYS 12 was used for the nonlinear heat transfer analysis and stress analysis. Figure 4 shows 3D FEM meshed model of piping. Element type was selected for 70, 3D thermal solid model and 45, 3D structural solid model. The number of the node was 14904, and the number of elements was 12558.
Meshed model of piping.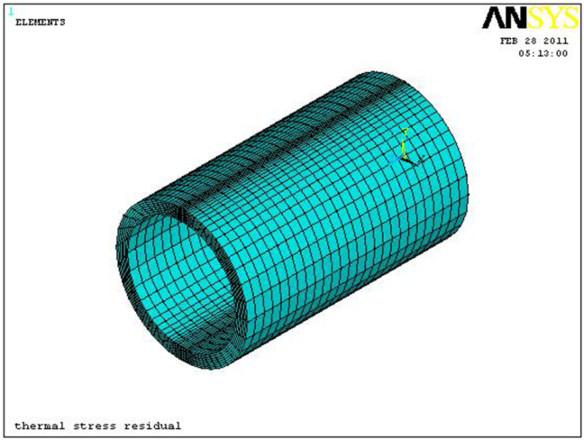
The instrumented indentation technique was used to evaluate the residual stress values in the GTAW area (see Figure 5). The measuring positions of residual stress, as seen in Figure 5, are 5, 10, and 30 mm spot from the welding centre line.
Evaluation of residual stress using the instrumented indentation technique.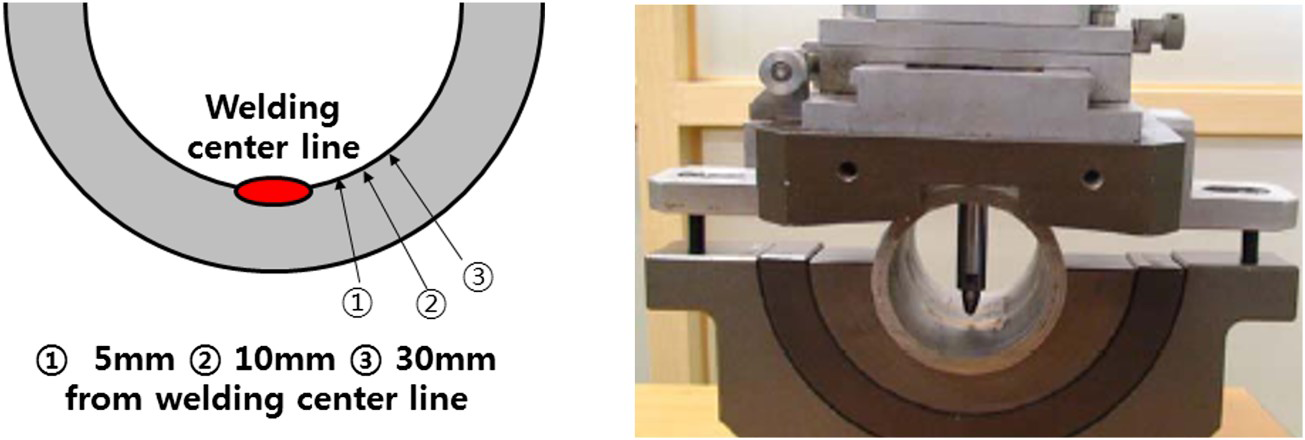
AE setup
The system for recording and analysing the AE signals included a four-channel data-acquisition instrument, storage media, sensor, and amplifier. The data-acquisition instrument was designed and manufactured by Physical Acoustics Corporation (PAC). The sensor was also manufactured by PAC. The sensor has a 400-kHz resonance frequency for the high-temperature purpose, with a maximum operation temperature of 500°C. The sensor output was amplified by a gain of 40 dB using a 1,222-charge preamplifier. A threshold level of 40-45 dB was set as a float type that can control the sensitivity of detection by keeping the voltage threshold of detection above the average background noise to minimise noise.
A high-temperature sensor was installed on each side of the flange. Once the signal had been detected by the sensors, the data were sent to the acquisition instrument and then stored immediately in the specific storage. The AE data from the specimen were filtered from electrical and environmental noise based on parameter characteristics, which have lower amplitude values than environmental noise. To distinguish the AE signals from the mechanical noise, the noise signal was characterised by recording the signals generated during the heating test without inserting solutions in the tube.
Results and discussion
SCC fabrication
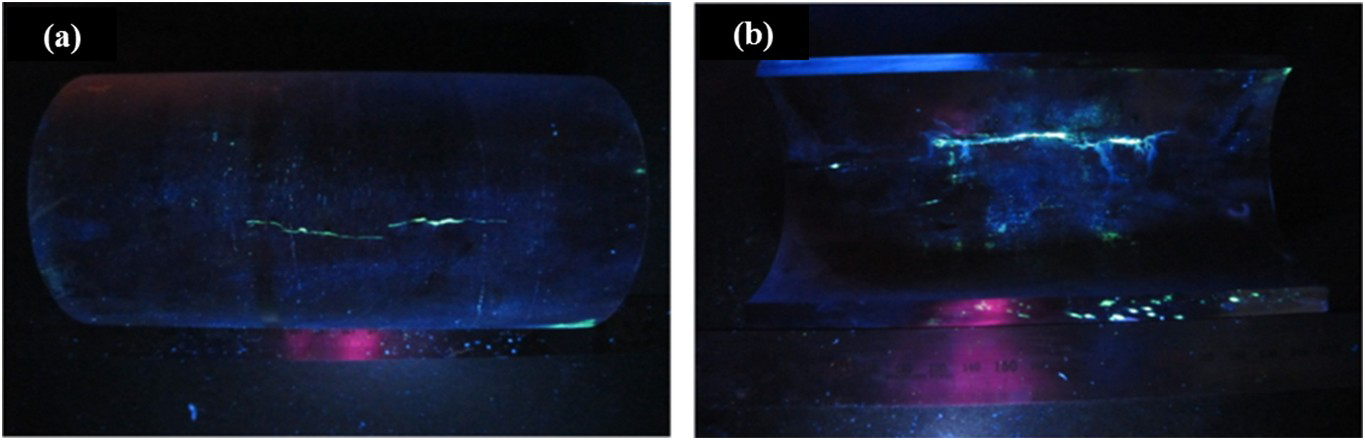
The stress corrosion crack was fabricated using the custom-made manufacturing system. Figure 6 shows the temperature and pressure variation of W5 specimen during the test. The maximum temperature and pressure (358°C and 157 bar) were similar to environmental conditions of the NPP. To see the cracks, a fluorescent penetrant test (Figure 7) was conducted on the outer and inner surfaces. Longitudinal cracks were confirmed on the surface in contact with the aqueous solution (90°). It was shown that the new forming equipment could simulate the environmental conditions of the NPP. The vapour pressure was decreased after about 5 hours. This means that the crack was already initiated before leaking. In a closed pipe such as our specimen, the force applied to the cylindrical pipe wall by a rising inner pressure will ultimately induce hoop stress. During the test, maximum vapour pressure was 157 bar; that is, hoop stress of the inner surface was more than 87% of yield stress.
Temperature and pressure in STS 304 pipe (W5 specimen). The fluorescent penetrant testing result (a) outer surface (b) inner surface of longitudinal cracks (90°).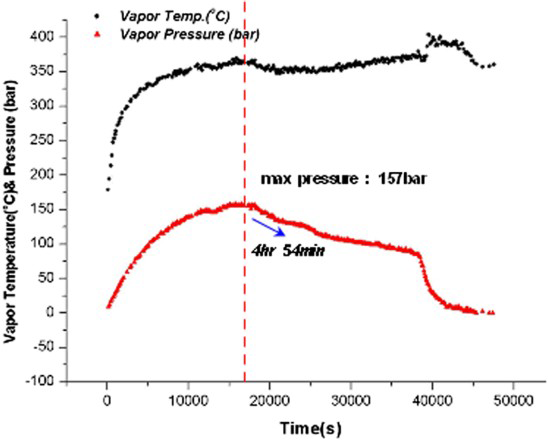
It is estimated that stress corrosion crack was accelerated by additional hoop stress as well as susceptible material, corrosive environment, and including residual stress. Many cracks in the inner surface (a top and bottom view) of the pipe were observed by the visual test. Figure 8 shows the outer shape of the specimen and cross section (×12.5) of the inner surface pipe at the cutting 1. Figure 8 also presents the optical micrograph of points (a), (b), (c), and (d) at section indicated as cutting 1. It is confirmed that the cracks were propagated along the grain inner and boundary. The intergranular and transgranular stress corrosion cracks were clearly revealed with many small branches.
Photograph of the specimen (a), cross-section (b), and fractographs (c).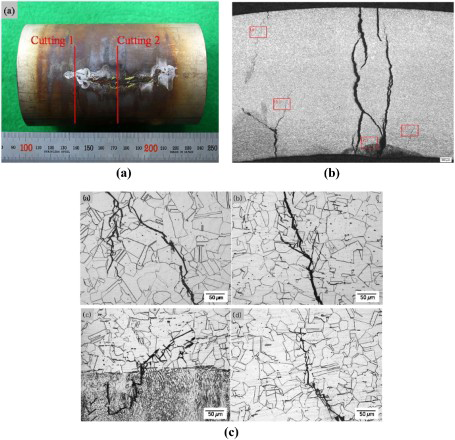
Analysis of residual stress
Because the melting point of STS 304was about 1400°C, the bead temperature of the first welding pass was decided as 1400°C and it was assumed that the temperature would be increased by additional welding pass. The heating time was the same as welding time. The cooling time was decided as 10 min in the FEM analysis because the experimental cooling time was 10 min. The heat input of the pipe (volume energy per hour) was modified by a temperature of the heat affected zone. The temperature variation calculated by thermal transfer analysis was used as boundary condition for analysis of the residual stress in the pipe. Figure 9 shows a temperature gradient of the specimen after first welding pass. The analysis was bilinear kinematic hardening method using Von Mises or hill plasticity [12]. Figure 10 shows the results of circumferential (hoop) maximum tensile residual stress on the inner surface of the pipe. The residual stress is the highest at 90-100 degree position which well corresponded to the position of crack appearance. The tensile residual stress of the FEM analysis confirmed that the number W1 specimen is the lowest, and the others are of similar level. So, we selected and evaluated an instrumented indentation test for the specimens of number W1 and numberW3.
Temperature gradient of the specimen after first welding pass. Hoop residual stress distribution.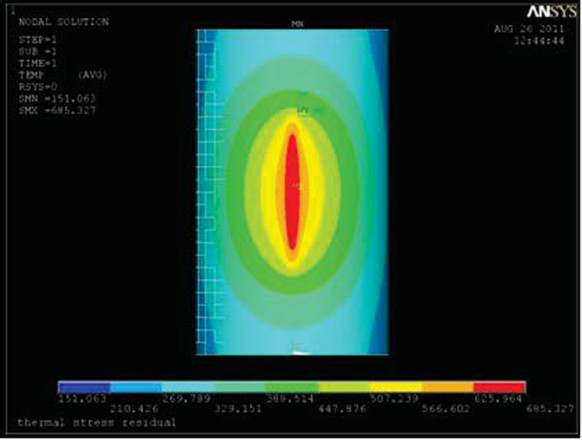
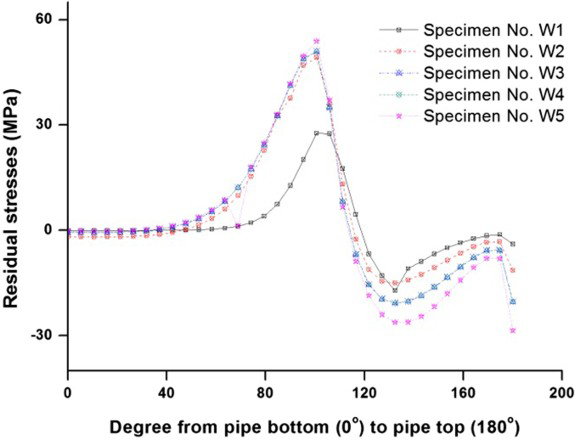
Figure 11 shows the result of residual stress for W1 and W3. The maximum position of the residual stress is about 15 mm from welding centre line. The residual stress value of W3 was about 20 MPa higher than that of W1. This means that increasing of welding pass has made a residual stress higher than the first welding pass. Table 4 shows the relationship between a number of welding pass and the fracture time of pipe. All the experimental conditions such as corrosion environment, heating temperature, and welding condition are the same.
Residual stress graph on the inner surface of STS304 pipe. The fracture time of the STS 304 pipe.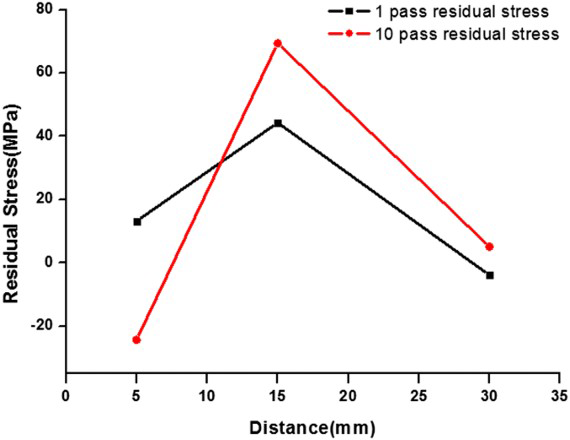
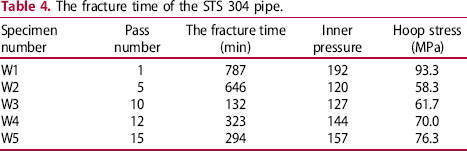
So it can be concluded that difference of through-wall fracture time is effects of residual stress. The fracture time of the specimen W5 that was welded by 15 pass was relatively shorter than other conditions. And it well corresponds to the highest tensile residual stress at the 90-100 degree position in Figure 10. Figure 12 shows a shape and position of artificial stress corrosion crack using the SCC forming device. Even though the SCC was initiated at a random position, it was confirmed that SCC was affected by a residual stress in the same environment.
Artificial SCC shape and position according to experimental conditions.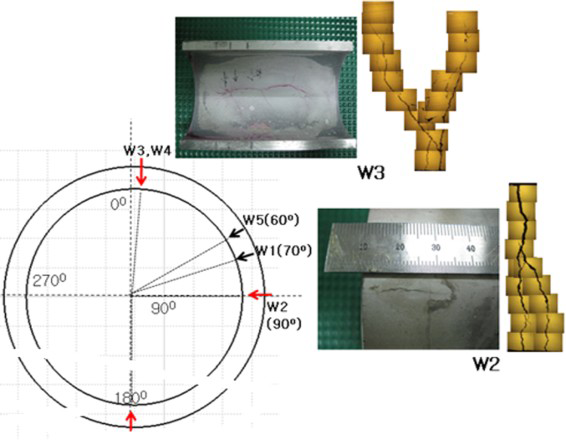
AE characteristics
To see the waveform pattern during SCC development, AE technique was applied. Figure 13 shows the AE counts with time, and temperature vs. vapour pressure variation. The cumulative counts increased smoothly until about 2,000 seconds (region A), and the rate of increase of cumulative counts was gradually reduced (region B). After about 2,800 seconds, the cumulative counts increased rapidly until the test was over (regions C and D). Figure 14 shows that the AE signals (rise time, amplitude, and energy) were intensively generated from region C, and the value of energy and amplitude was higher in region C than in other regions. As shown in Figure 13, the vapour pressure indicates a sudden drop at about 53 minutes (3,200 seconds) after the test began. After region C, the energy and amplitude decreased except for the rise time in region D, which corresponds to the tube rupture. The variation of AE counts can be divided into four stages. The first stage is a start of the test, during which homogenisation and chemical stabilisation occur in the corrosive solution. The second stage is SCC initiation and propagation. During the third stage, a number of processes occurred such as the rupture of the passive film, dissolution of exposed bare material, re-passivation of the bare metal subsequent to its dissolution, plastic deformation. Finally, pure crack propagation affects the AE signal generation.
(a) Temperature vs. vapour pressure variation, and (b) AE counts with time. Energy, amplitude, and rise time distribution with time during SCC.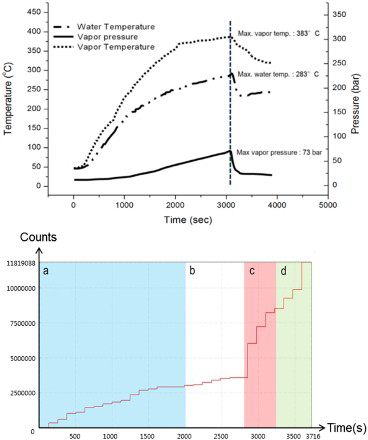
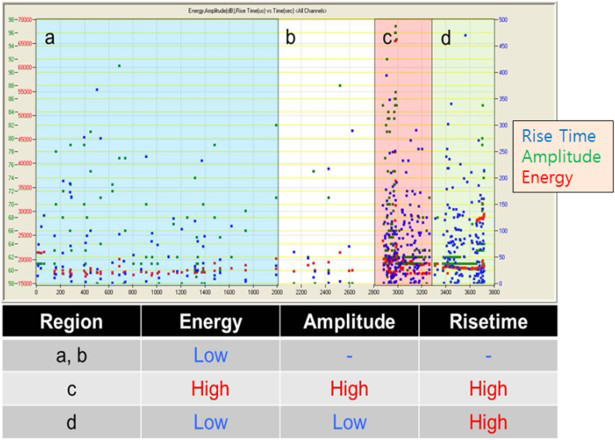
Figure 15 shows four specific waveforms detected during the SCC process. Waveform (A), detected at the heating time, looks like continuous emission. When temperature and pressure were almost saturated, waveform (B) was generated. Waveform (B) shows that the peak amplitude takes precedence and the value of amplitude falls off. Near the maximum temperature and pressure, waveform (C) was sprinkled with the former AE signal-generating pattern. The characteristic feature of the waveform (C) is the time delay, which exists until the peak amplitude is detected. Waveform (D), with an irregular waveform pattern, occurred when leakage occurred. A specific waveform pattern was observed during SCC development. It is suggested that AE can be used to detect and monitor SCC initiation and propagation in actual tubes.
Specific waveforms during stress corrosion crack development process. (a) Heating section, (b) Saturated section, (c) Maximum temperature and pressure section, (d) Leaking section.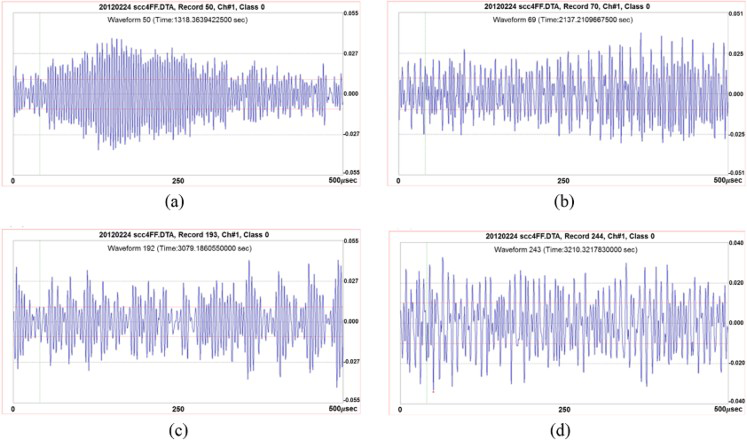
Conclusions
A custom-made device was used, which simulated an environment conditions of NPP, for fabricating the stress corrosion crack in the inner pipe wall. And stress corrosion crack was artificially produced on STS 304 pipe by a welding residual stress. The residual stress was increased by increasing welding pass. The fracture time of the pipe by stress corrosion cracking was decreased by increasing residual stress according to welding heat input. Even though the SCC was initiated at a random position, it was confirmed that SCC was affected by a residual stress under the same environment. A new system was developed for manufacturing stress corrosion crack in the inner surface of the pipe specimen. And it is possible to manufacture mass SCC production of real size pipes in our system. During the SCC development process, specific AE waveforms were generated, which can distinguish the SCC stages by heating, saturation, maximum temperature and pressure, and leakage. This could be used to distinguish SCC damage signals from normal signals and help the supervisor to repair the damage before a deep crack forms.
Footnotes
Disclosure statement
No potential conflict of interest was reported by the authors.