
Abstract
The present work investigated the effect of fibre's presence on the densification of rotomoulding-grade polyethylene. Nevertheless, the presence of fibres during densification directly impacts the current understanding of how densification works during heating. The present work focuses fibre-reinforced polymer densification to study the effect of fibre addition on bubble formation during this process. A densification test was developed to observe and measure fibre addition's effect on polymer densification and bubble disappearance. The test focused on measuring the cross-section area corresponding to bubbles appearing in the melt and comparing results to clarify whether fibre addition alters this process. Results showed that, although heating parameters and particle size affect bubble morphology and disappearance, fibres’ presence does not substantially affect the bubbles. Finally, results showed that polymer-fibre characterisation plays a crucial role in sintering and densification, and work is continuing to present conclusions about how sintering and densification affect the full-scale manufacturing process.
Introduction
Rotational moulding (RM) is a process for manufacturing hollow plastic products. Although there is competition from blow moulding, thermoforming and injection moulding to manufacture such products, RM has particular advantages in terms of relatively low levels of residual stresses and relatively low-cost moulds [1]. Among all the polymers used in RM, polyethylene (PE) is the primary material used due to its low cost, low melting point and excellent thermal stability. Although PE's tensile strength and stiffness are below other materials, it stands out in terms of impact strength. Around ∼90% of the rotomoulded parts produced worldwide are made from PE [2, 3]. Nevertheless, there are still some challenges in terms of strength improvements as some parts manufactured for the industry require to be reinforced to maintain or improve their mechanical properties [3]. The classical rotomoulding cycle starts with the loading of the polymer in powder form to a mould. The mould undergoes a heating process (heating temperatures of 150–350°C), in which it is rotated so that the polymer powder can fully cover the inner mould surface [1]. After the material has fully formed a molten polymer film, the rotating mould is subsequently moved to a cooling chamber, in which the temperature decreases to solidify the part. Once the part is fully solid, the product can be de-moulded.
Part creation in RM is fundamental to understanding how the material comes together while forming a part, and it is critical to grasp how part strength comes into place. The classical RM cycle comprises four stages: charging, heating, cooling and de-moulding. However, during heating, the polymer particles tumble and soften, assisted by the rotation, to stick together to form a continuous film. The process is often called sintering and densification in the literature and constitutes the fundamental mechanisms by which parts are formed in RM [4-6]. This stage constricts the materials’ suitability as the candidates need to comply with specific conditions (such as thermal stability) to form the part successfully [7, 8]. Therefore, in order to strengthen parts in RM, it is necessary to study these phenomena. Although research is available on using more materials, the prospects of mechanical performance improvements by using the so-called ‘composite’ materials cannot be ignored. Although the use of these ‘composite’ materials has been proven to be successful in other processes, there is a significant lack of literature and research on the use and optimisation of composite materials in RM [9-11].
Heating is probably the most critical step in the RM process. Whereas in most other processes, the polymer material transforms during heating with a certain level of uniformity, RM is characterised by two well-differentiated phases [4, 5, 12]. While part of the material is being softened and might have started to fuse, other parts are still in powder form and continue tumbling around the mould. The process requires the material to be layered up slowly and uniformly distributed. However, it also means a more significant temperature gradient exists between colder (interior polymer surface) and hotter (polymer surface in contact with the mould). The polymer material undergoes two processes called sintering and densification to fully form a film of polymer over the interior surface of the mould wall [4, 12]. The problem is that, while part of the material is densifying, more material is sintering over the top, and that has dramatic consequences when trying to rotomould fibre-reinforced polymers in RM. When a fibrous reinforcement is added to the system, granular convection naturally occurs due to the difference between the aspect ratio of the reinforcing fibres and the polymer particles. Granular convection, sometimes described as the ‘Brazil nut effect’, is a phenomenon where granular material under motion exhibits circulation patterns similar to types of fluid convection [13], provoking large particles (or fibres) to rise to the top of the mass. If the fibre-polymer mixture suffers the Brazil nut effect and segregates, most of the polymer will end up in the bottom of the mould, whereas most of the fibres will end up loose over the top [13]. As the temperature will be hotter over the said surface, most of the polymer will sinter and densify, and there will be little material left for the fibres to attach to. Therefore, it is vital to study and understand precisely how sintering and densification happen and how moulders can aid the polymer to stick to the fibre bundle.
Once the sintering phase is complete, the result is a continuous mass of the melted polymer. This mass is composed mainly of the resin used and the air trapped inside [14, 15]. The process by which air trapped in bubbles within the melt begins to diffuse into the polymer is commonly known as densification [5, 16]. It causes a reduction in the size of the bubbles present in the plastic and an increase in the density of the mixture. Although sintering and densification are usually studied separately, it is a phenomenon that usually takes place simultaneously. While the upper layers of plastic begin to sinter, the lower layers closest to the mould will have already sintered and undergone a densification process. The study presented below seeks to investigate how fibres present in the melt can alter densification, affecting the appearance and disappearance of air bubbles present in the melt (Figure 1).
Densification system set-up.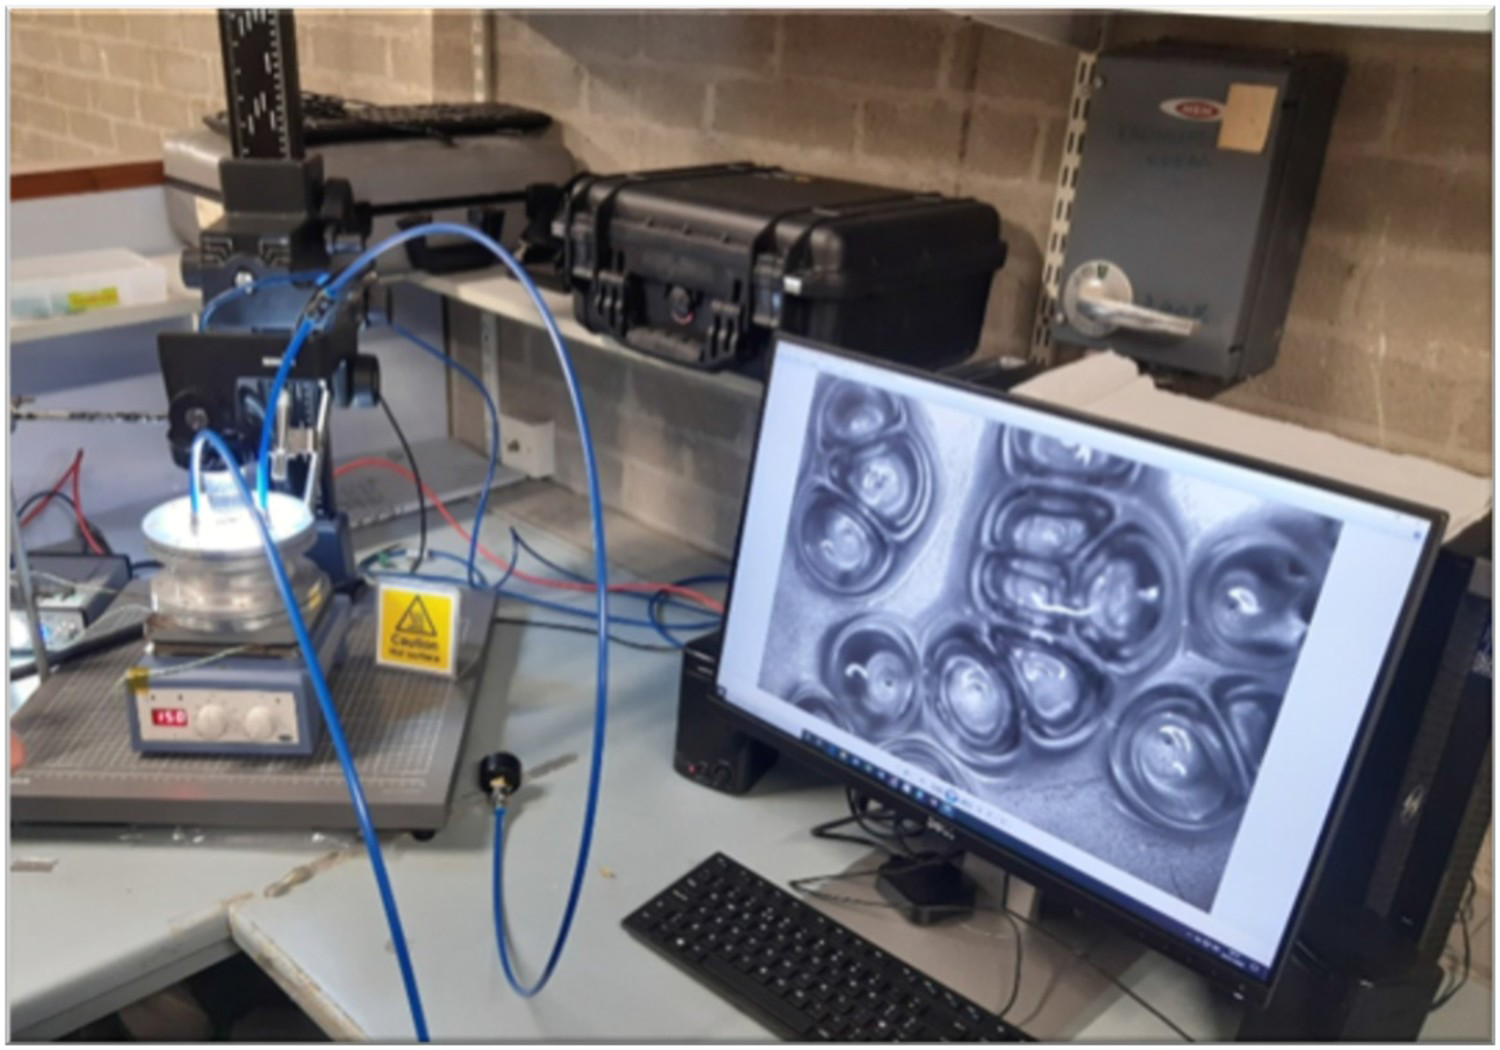
Method
A visual system was developed to study and observe the bubbles that appear and disappear in the melt during the densification phase. This system consists of the Stuart® Hotplate Stirrer US152D heating plate, the Blackfly® S high-resolution camera with a Computar® MLM-3XMP lens, SCHOTT LED CV-LS light source with A08635 Midi Ring-light and finally, the KAISER RS1 adjustable frame. The Hotplate was placed at the frame's base, and the camera was mounted on the movable vertical rail. The lens was attached to the camera by the C-mount, and the light ring was mounted to the lens by the built-in set screws. The camera and the light source were connected to an external PC so that the cameras and light could be controlled simultaneously from the same computer. An experimental plan was devised that compared tests with and without the presence of fibre to study the densification of fibre-reinforced parts in RM. The first part of this study consisted of densification tests without any type of reinforcing fibre present. In these tests, the plate temperature and particle size were varied to measure these parameters’ effect on the number and area of bubbles created during densification. Subsequently, tests were carried out with fibres present in the melt, where it was observed how the bubble area and density varied concerning the type of resin and fibre content of the samples. Each test was conducted one time, and 120 images were taken from each test. These images were treated using an algorithm developed for an image processing software called MIPAR. The algorithm was successfully capable of detecting the cross area related to the bubbles, which variation was plotted against time to form a graph (Figure 2).
Densification experimental plan.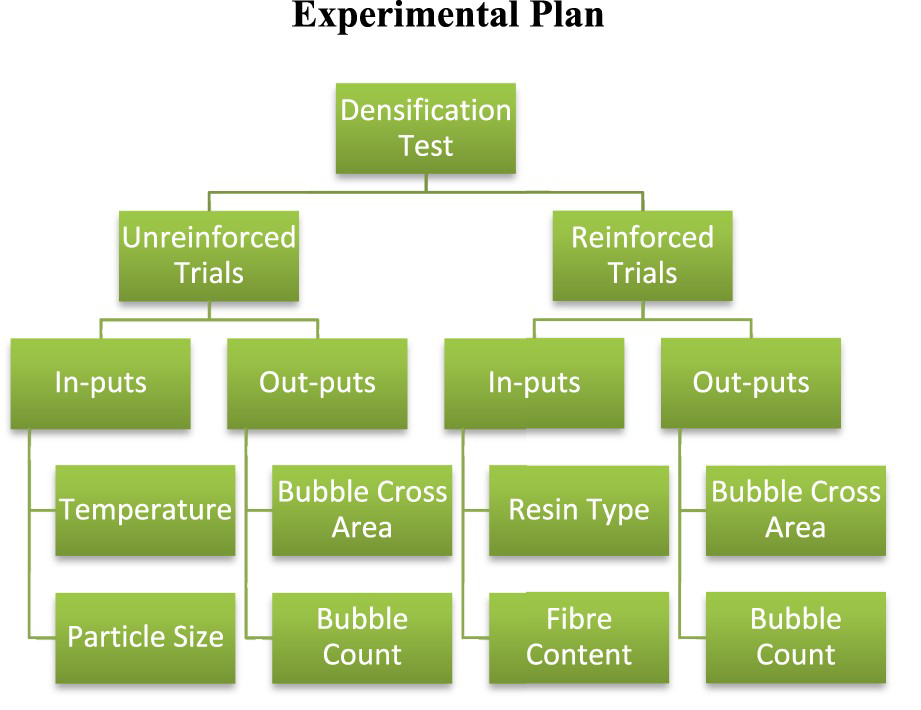
Experimental plan
Materials
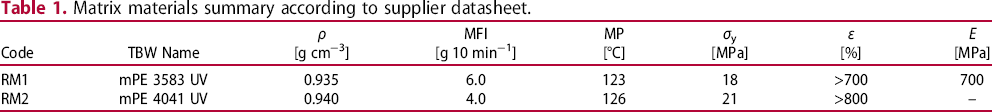
Matrix materials summary according to supplier datasheet.
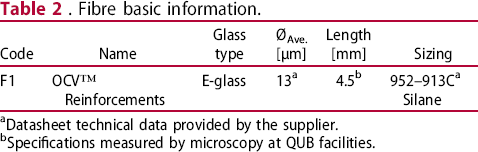
. Fibre basic information.
Datasheet technical data provided by the supplier.
Specifications measured by microscopy at QUB facilities.
Testing procedure
The procedure for the densification tests consisted of a series of simple steps. The densification test begins by preparing the materials on a Ø70 mm. disposable aluminium plate. With the help of a precision balance, 4.0 ± 0.1 g (corresponding to a solidified sample of approximately 2–3 mm thick) of the resin mixture to be tested is placed on the aluminium plate. Fibre-reinforced samples were prepared by dry-blending the material based on the mixture's proportions (%w/w). The hot plate is then preheated to the test temperature, and in the meantime, the camera and lighting are set up for image capture. When the hot plate is at the test temperature, the program is configured to capture images at a rate of 5 s/img. The region captured by the camera corresponds to a surface of approximately 6 × 4 mm, adequate to the bubble size to detect. Once the image capture program is running, the aluminium plate is carefully placed on the hot plate with the help of carbon tweezers (Figure 3). During the test development, the plastic powder is sintered and densified, while the software captures images of this process. When the densification process has finished, the sample is removed to be cooled, and imaging is stopped. Next, the MIPAR software (https://www.mipar.us/) is used to process the images based on a simple algorithm developed for this task.
Aluminium plate containing unreinforced powder sample being placed under the camera.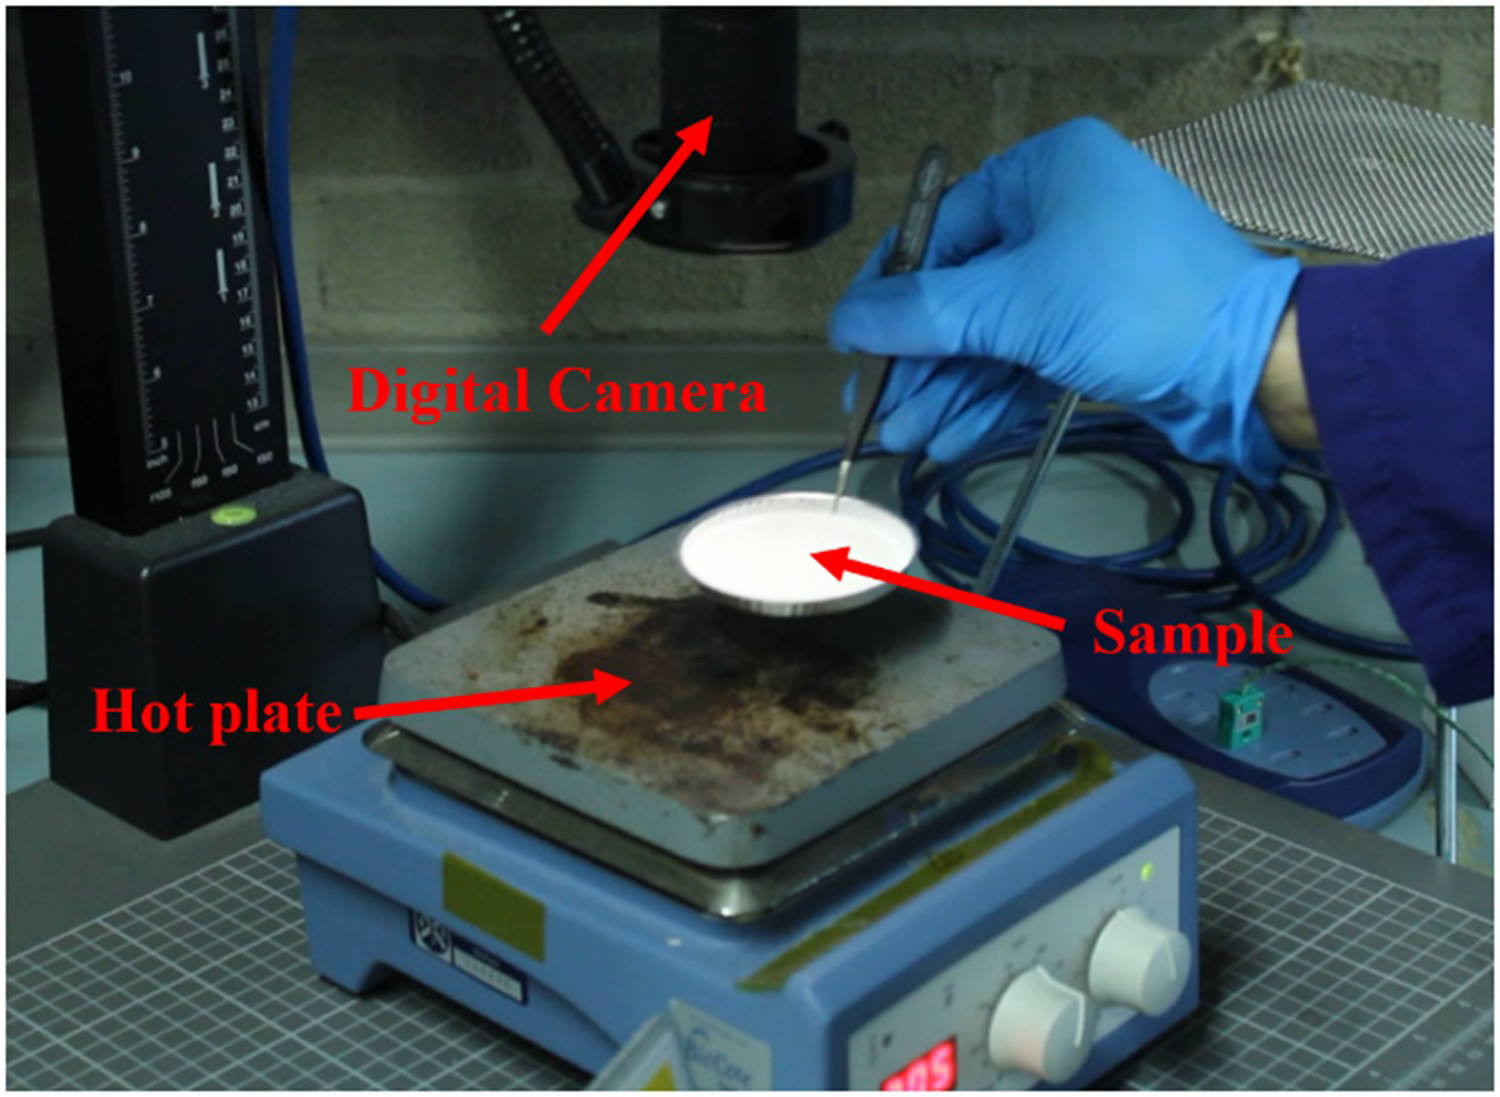
Algorithm developed
The images produced by the system clearly showed bubbles present within the melt. It was possible to observe the bubbles through the plastic thanks to its transparency while in a molten state. The measurement of these bubbles could have been carried out using manual measurement software such as ImageJ. However, the image processing time is drastically reduced when this task is automated. A bubble in the melt is a defined geometric figure, which allows identifying characteristics to segregate these elements from the rest of the image. Therefore, for the treatment of the images of the densification test, the batch processing tool of the MIPAR software was used. This tool allowed a batch of images and a recipe for the algorithm used to process the images. Developing the algorithm itself is a complex task, but in summary, it consists of three parts. The first part consists of a pre-treatment, which is responsible for preparing the image by modifying them to be segmented in the second part. Thresholding techniques are then used to create a binary image that selects pixels within a specific intensity threshold. Finally, the segmentation is cleaned up by rejecting or accepting those characteristics desired in the selection.
The final area corresponding to the set of pixels segmented from the image is defined as the region of interest (ROI). This region corresponds to the area result of quantifying the number of pixels detected in the image by systematically applying the steps of the algorithm developed. This region is separated into units called features, which correspond to the bubbles present in the sample. The power and precision of image segmentation algorithms allow reducing the difference between the measures of features and the real number of bubbles present in the sample. A pixel-length calibration is carried out by taking a picture to a standardised scale and used to establish a calibration file. The calibration file is finally used to convert px 2 measurements to mm2 measurements to be plotted in a graph. An example of the efficiency of the algorithm detecting bubbles can be seen in Figure 4.
Example of the algorithm efficiency detecting bubbles in the melt.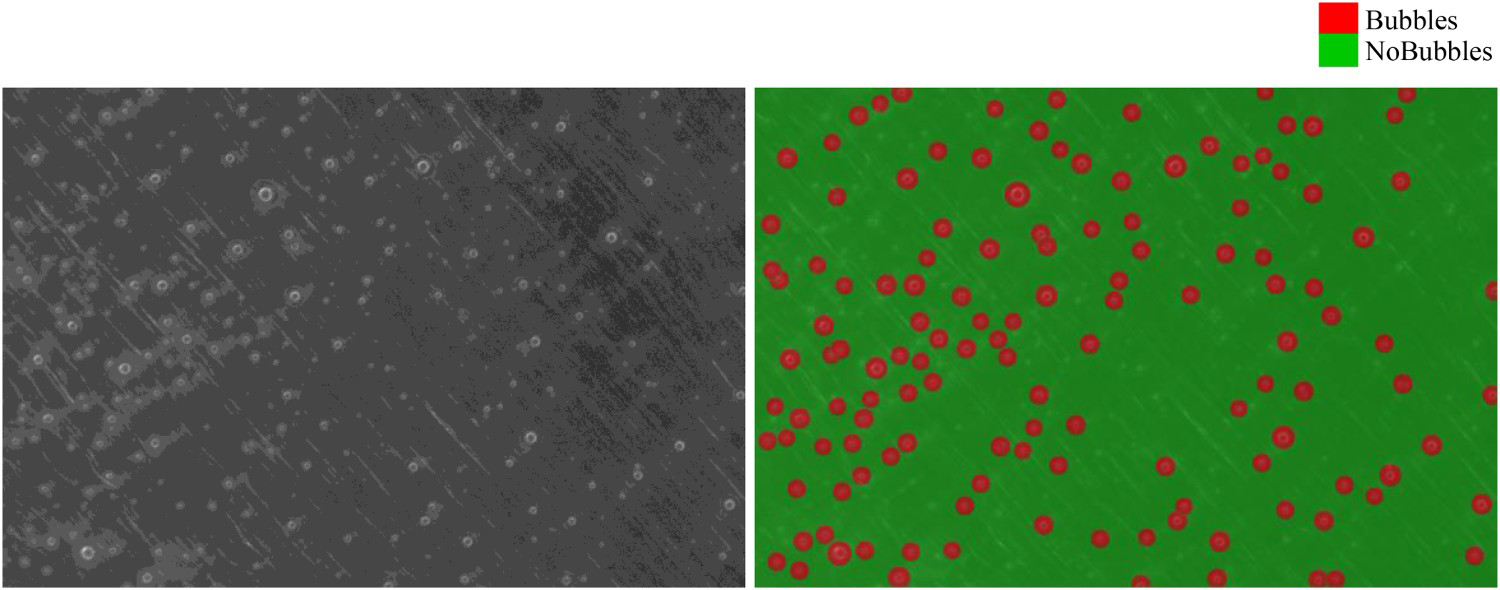
Results
Densification process
Figure 5 shows the natural sintering and densification sequence as observed under the camera lens. As soon as the aluminium plate contacts the hot plate surface, heat is transferred to the sample mainly by heat conduction. This energy supplied increases the temperature of the sample, changing its physical properties until the material reaches its phase change temperature. At that point (around minute 1:00), the powder starts to soften and stick to each other in a process called sintering. Most of the air present within the melt between each polymer particle is heated and escapes the sample upwards towards the lens. However, an amount of this air is trapped by the polymer and stabilises as a round bubble during heating. As the phase change takes place, the material's opacity changes, allowing light to pass through the material, becoming more transparent. This permits the digital camera to observe all the bubbles present in the sample, regardless of depth or size. However, overlapping bubbles are not possible to be distinguished from each other, limiting the system's capabilities of properly measuring the total amount of bubbles present in the melt.
Evolution of the polymer powder becoming a polymeric film during the densification process.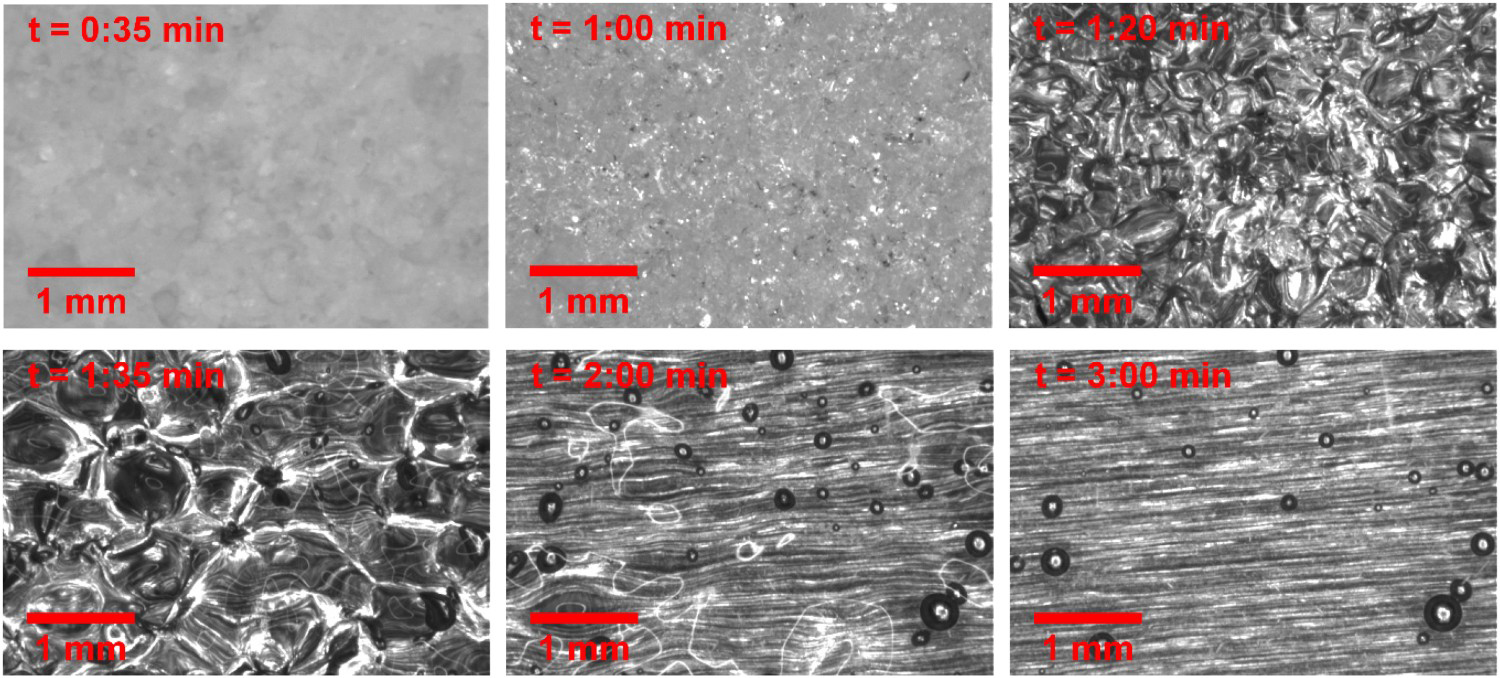
Unreinforced polymer densification
The first part of the Densification study has combined an RM-grade PE resin (RM1) at different hot plate temperatures (200°C, 250°C and 300°C) with different particle sizes (90–105 and 500–600 μm) to determine the optimum densification parameters for use in combination with fibres. Results are shown in Figures 8–13, which illustrate the variation in the number of bubbles counted during processing time. The two most significant variables that were observed to affect polymer densification were hot plate temperature and particle size. Figure 6 illustrates the bubble reduction and disappearance when varying the hot plate temperature. The results verified observations made by previous researchers according to the literature. Results show that by using a high hot plate temperature (300°C), the bubble density of parts can be dramatically reduced by 50%.
Visualisation of densification test. The effect of low (A – 200°C) and high (B – 300°C) hot plate temperature is shown.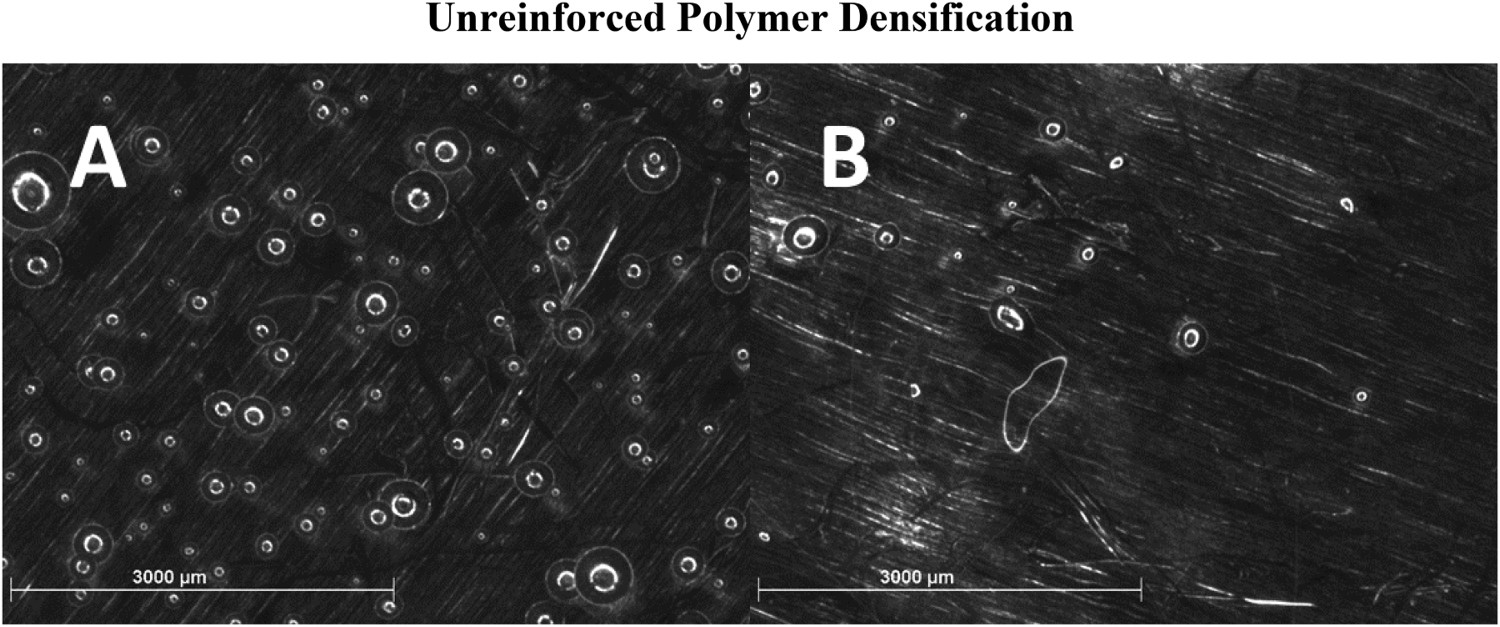
Similarly, Figure 7 shows the effect of using different particle sizes, as it has been reported to directly impact the amount and size of bubbles present in the material. The use of fine particles (90–105 μm) produces a dramatic increase in the bubble density (by 500% when compared to coarse particles) as well as a decrease in the average bubble size (more than 50% on average). When using coarse particles (500–600 μm), bubble density remains constant or decreases slightly. Nevertheless, it can be observed that bubble size increases significantly, as illustrated in Figure 7(b).
Visualisation of densification test. Effect of fine (A – 90–105 μm) and coarse particle size (B – 500–600 μm).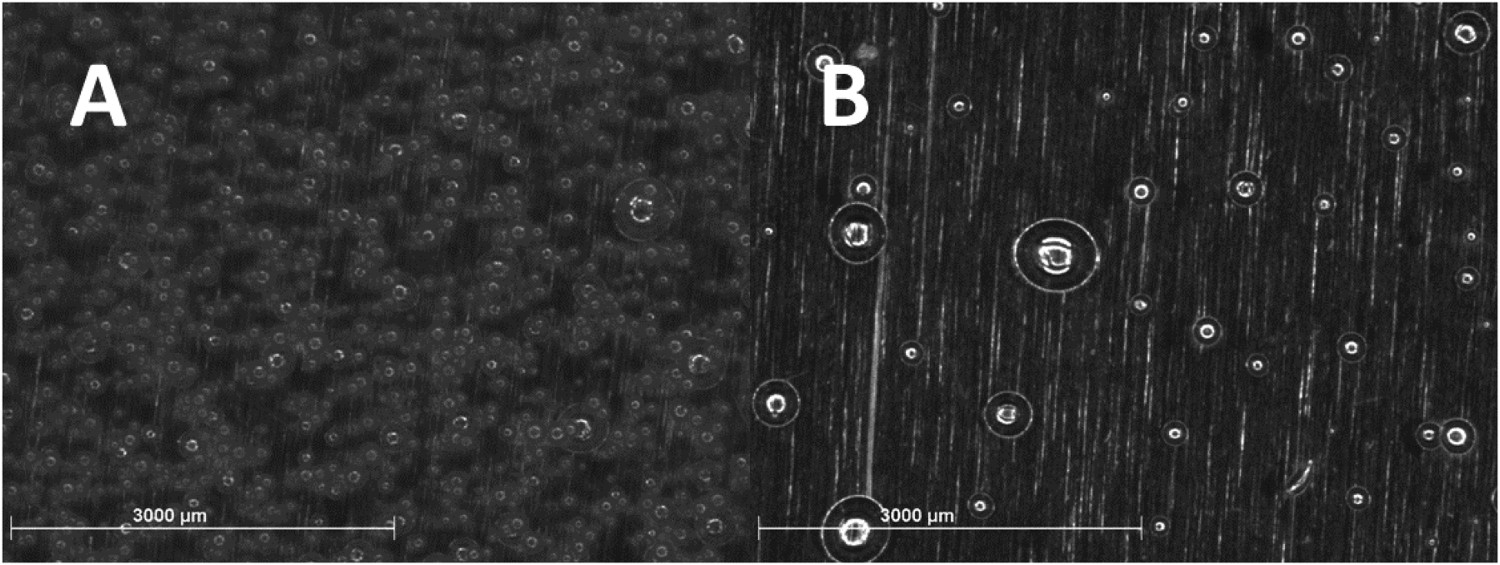
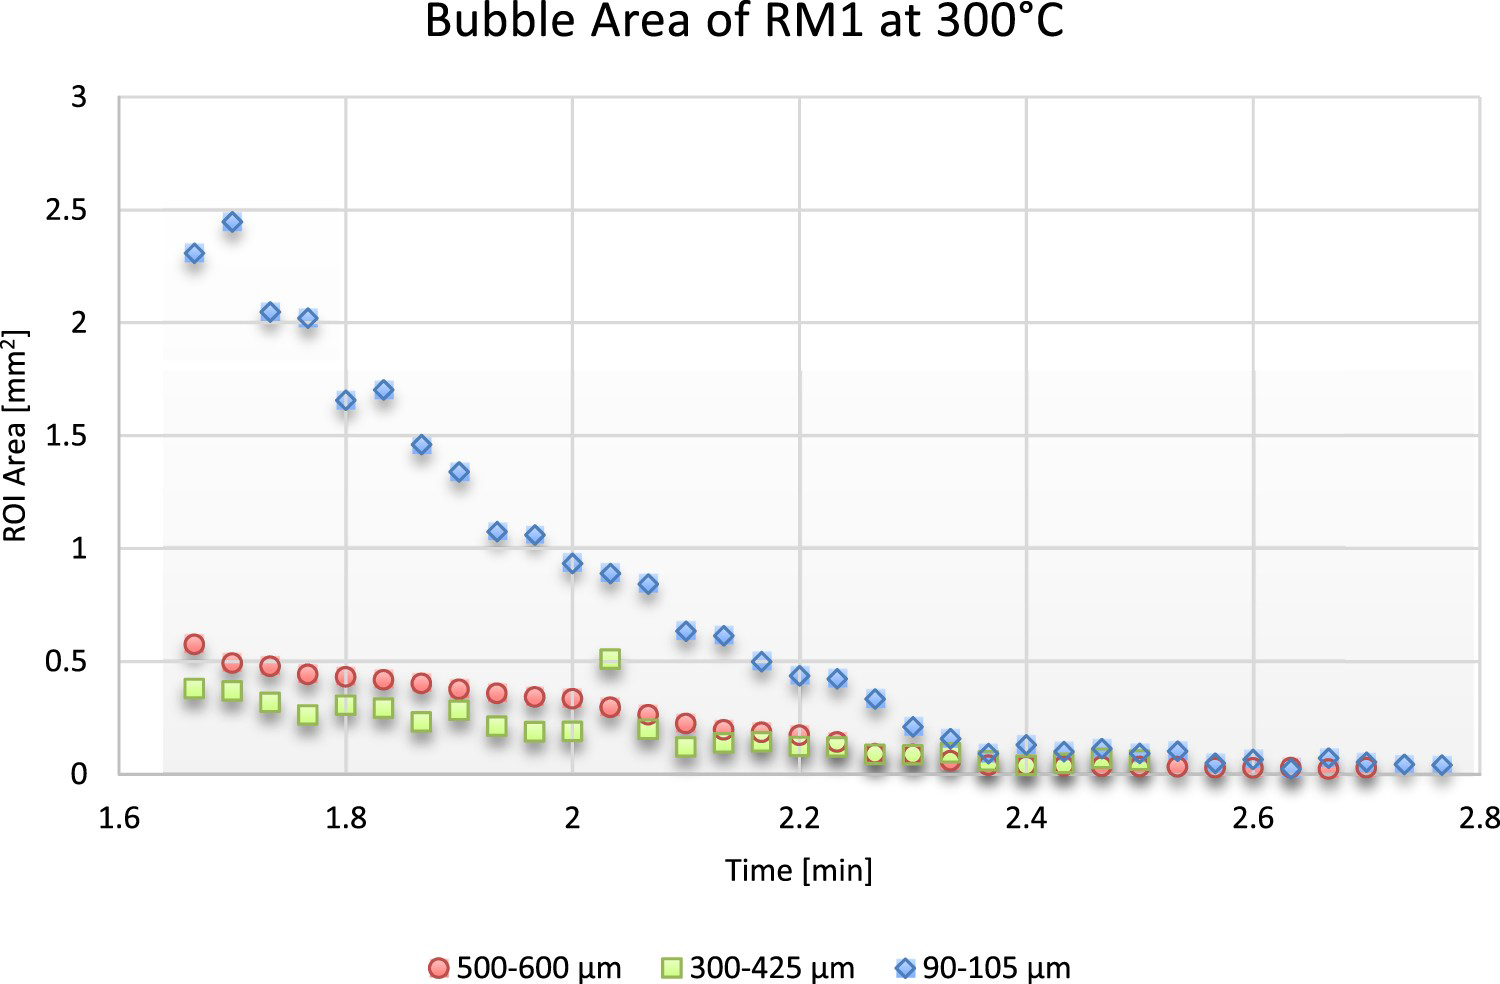
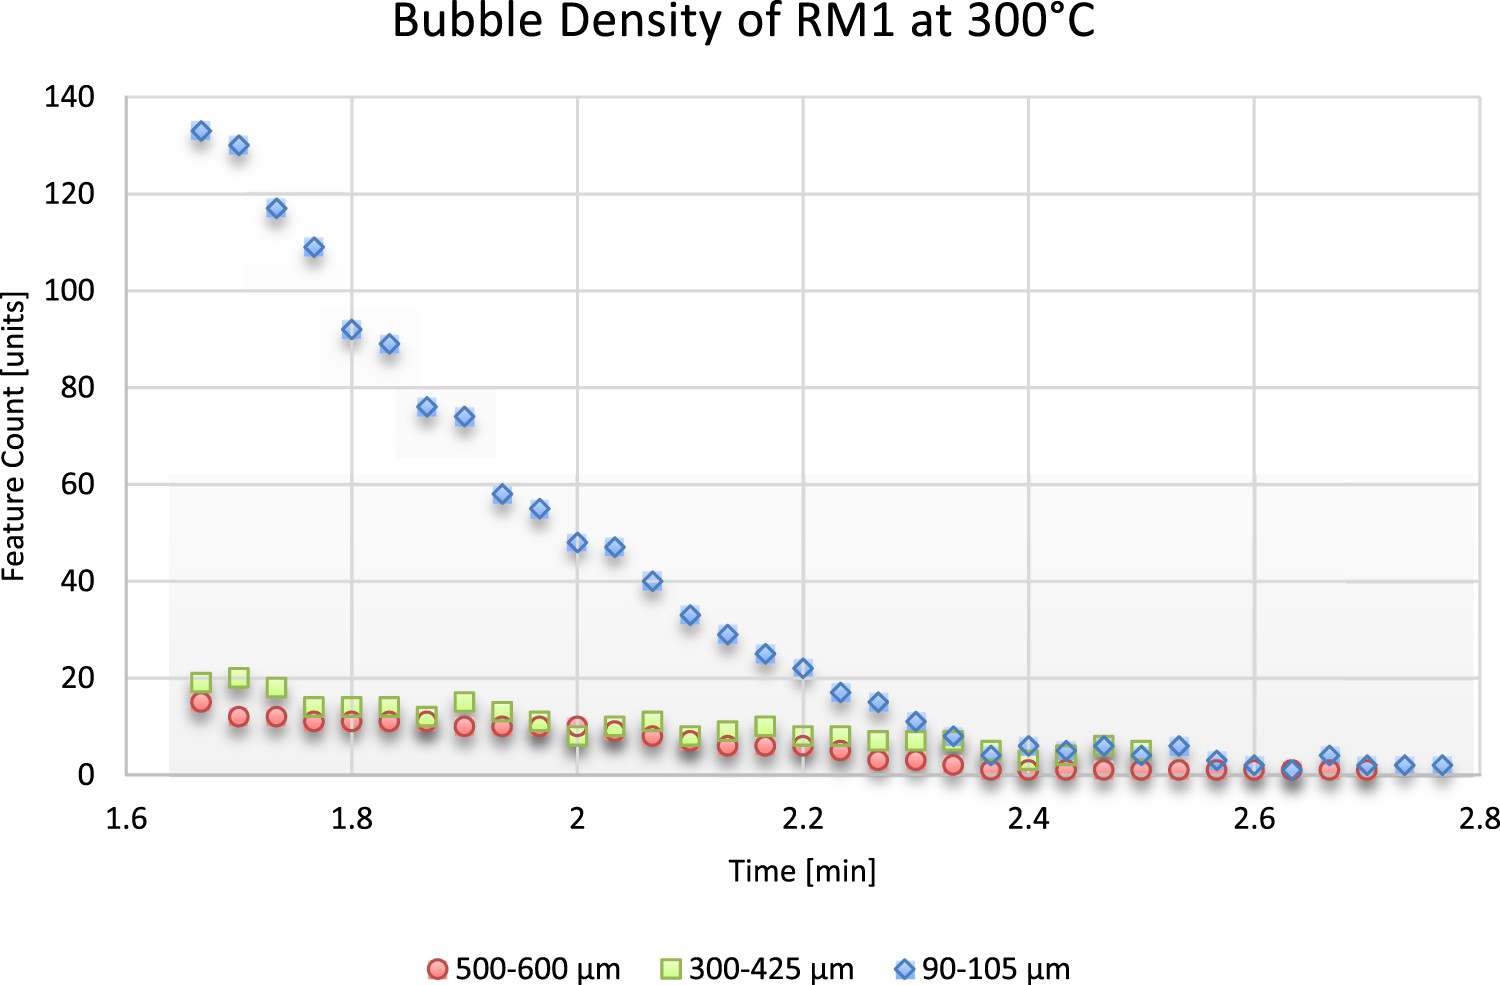
After analysing the images using the MIPAR image processing software, the densification curves observed from Figures 8–13 were obtained. Figures 8, 10, and 12 correspond to the variation in time of the area total ROI segmented by the algorithm. Figures 9, 11, and 13 correspond to the number of elements detected by the software. As can be seen, the tests carried out at higher temperatures (Figures 12 and 13) densified faster than those at lower temperatures, so the curves present reduced data.
Densification curve showing the ROI (Bubble) area of RM1 at 200°C. Densification curve showing the feature (Bubble) count of RM1 at 200°C. Densification curve showing the ROI (Bubble) area of RM1 at 250°C. Densification curve showing the feature (Bubble) count of RM1 at 250°C Densification curve showing the ROI (Bubble) area of RM1 at 300°C. Densification curve showing the feature (Bubble) count of RM1 at 250°C.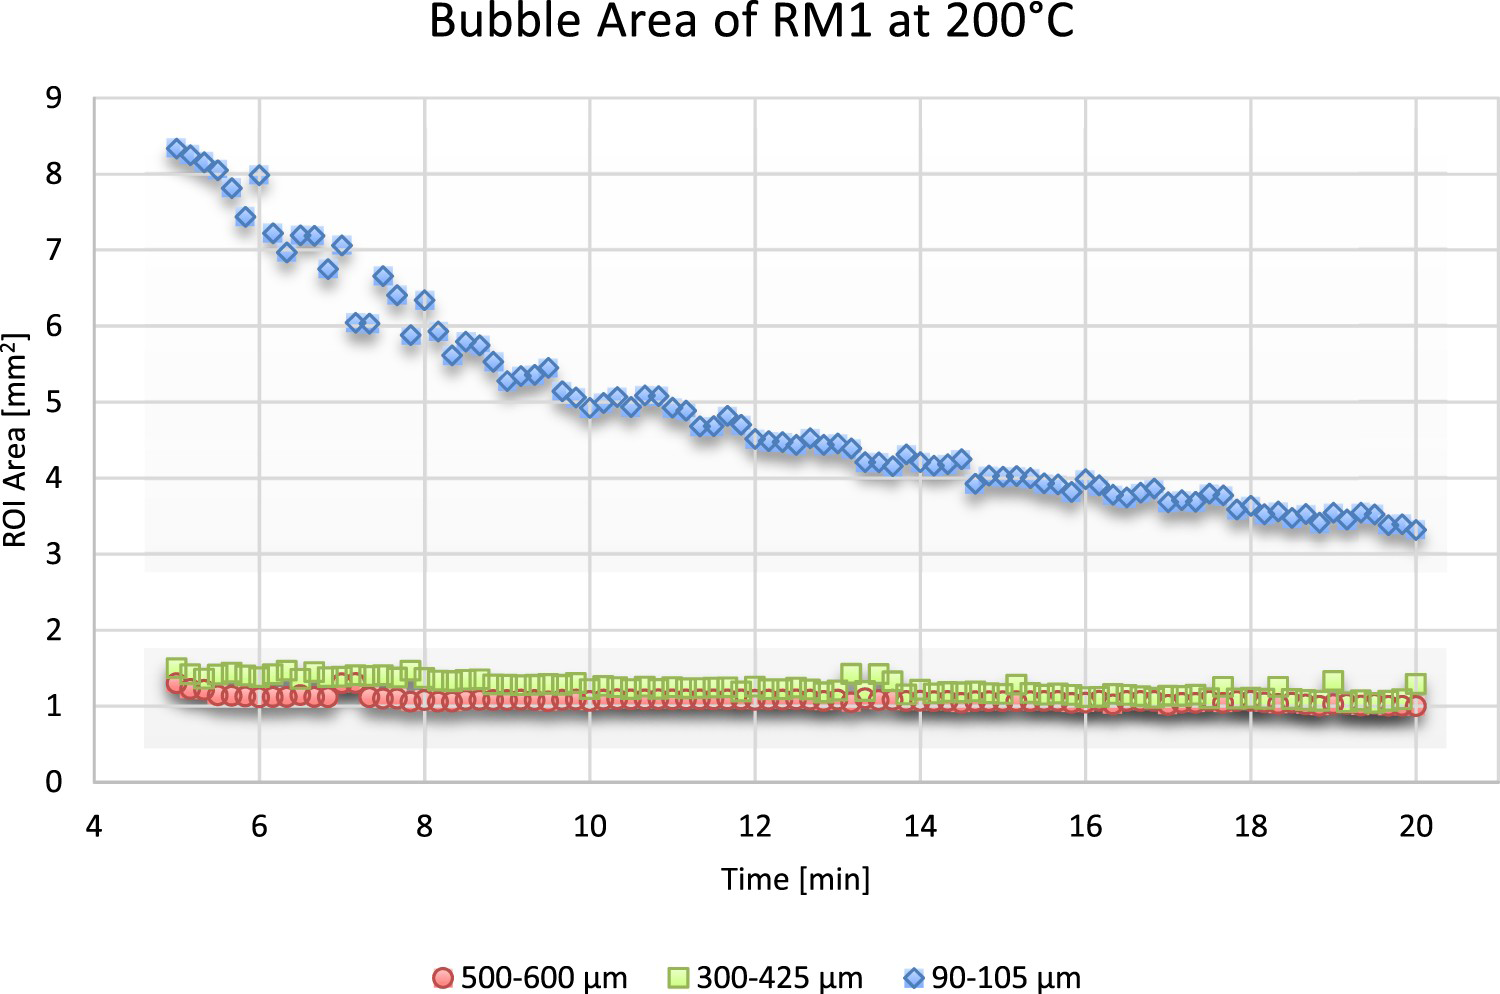
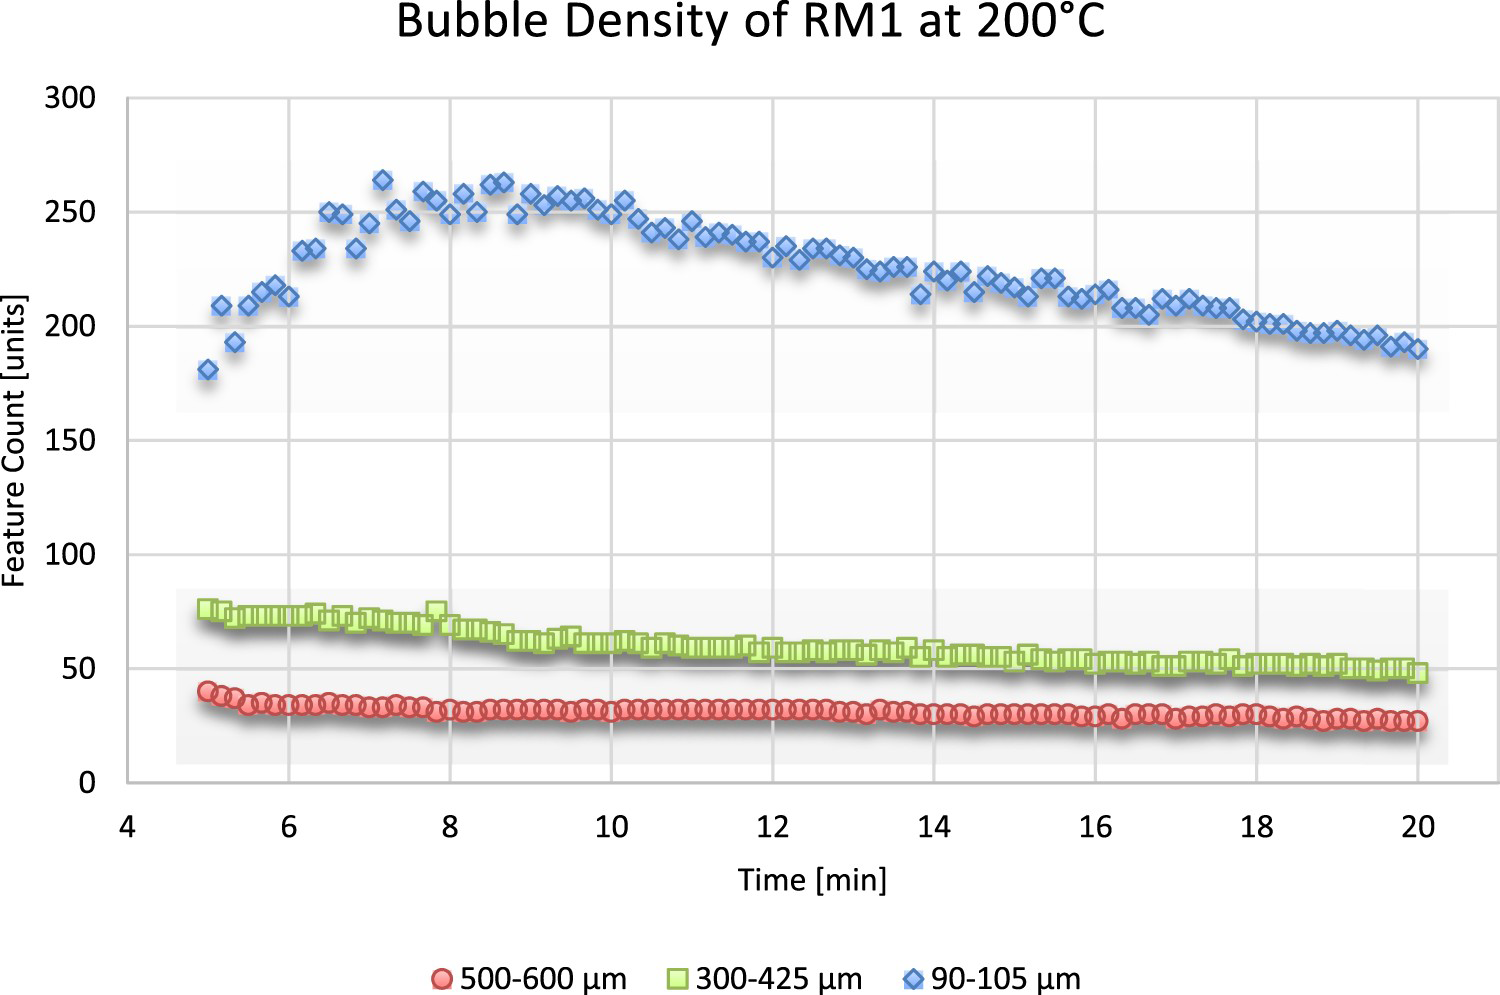
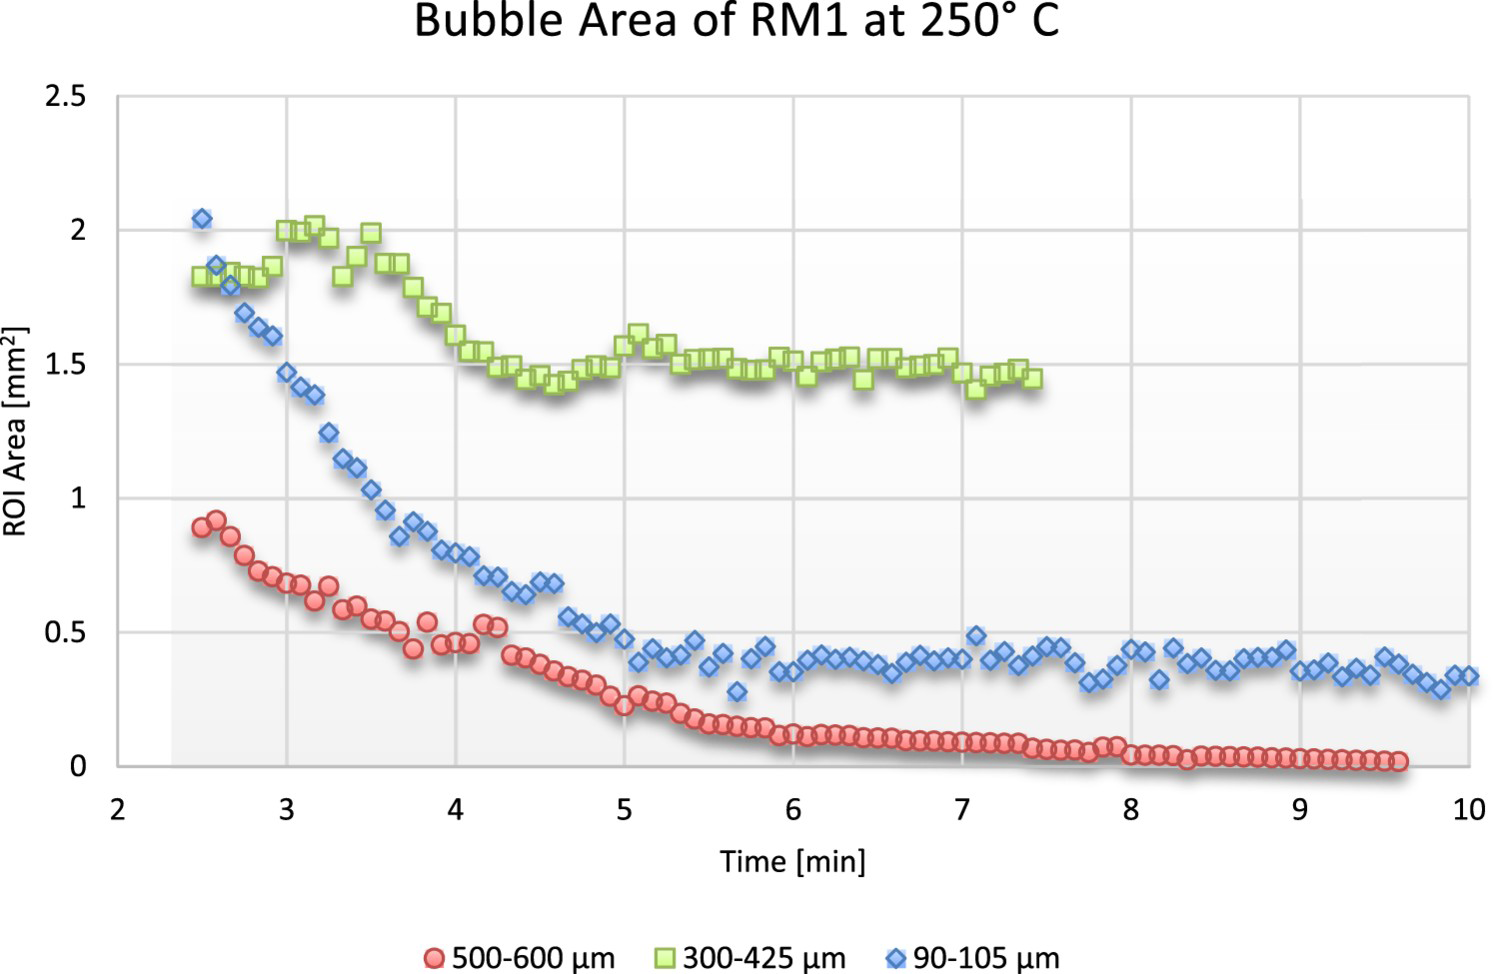
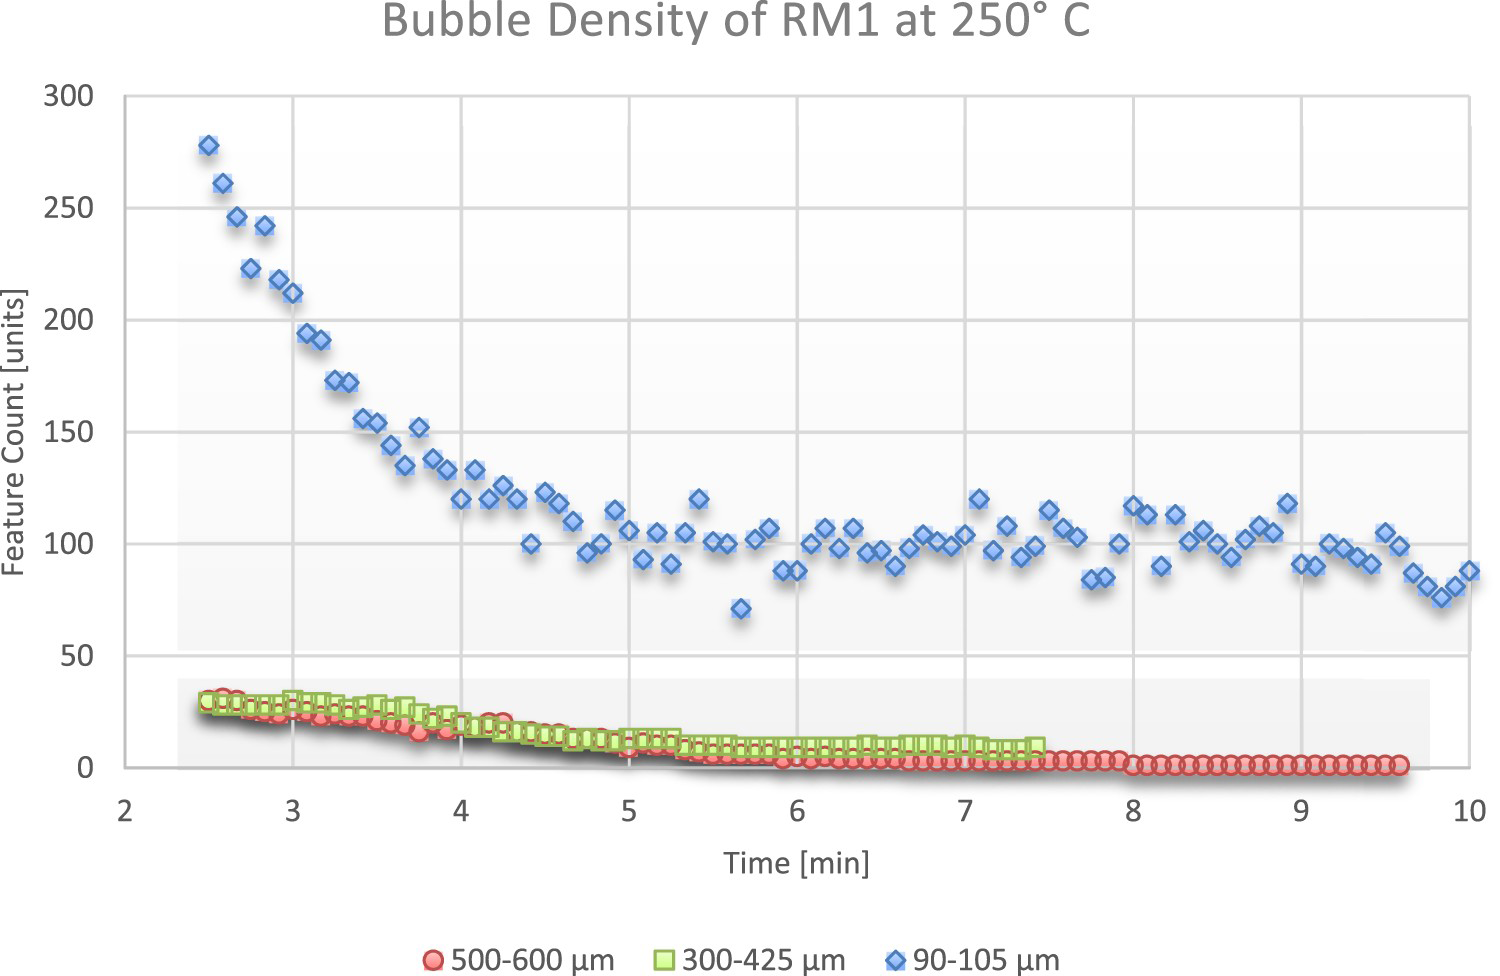
As shown in Figures 8 and 12, the smaller the particle size, the greater the area detected by the system. It is because smaller particles produce a higher level of compaction, which prevents trapped air from escaping the plastic. However, the trapped air is more distributed since the number of particles is much higher for the same mass of material. As the air is distributed more, many more bubbles of smaller size and much more distributed are formed. It is evident when looking at Figures 8 and 9, where a much higher bubble density is observed. However, this is not fulfilled in Figure 10, where bubble sizes between 300 and 425 µm showed to maintain an area considerably higher than the sizes 90–105 µm and 500–600 µm. However, in Figure 11, the 90–105 µm particle size has a high density, indicating that the bubble is still tiny.
Concerning temperature, it is observed how the bubble area grows with increasing temperature. As observed in Figures 8, 10, and 12, the detected area is reduced from 8 mm2 in the first data of Figure 8 to 2 mm2 in Figure 13. It means the densification samples at higher temperatures show to have fewer but smaller bubbles (Figure 14).
Illustration of the ROI area for bubbles detected by the algorithm.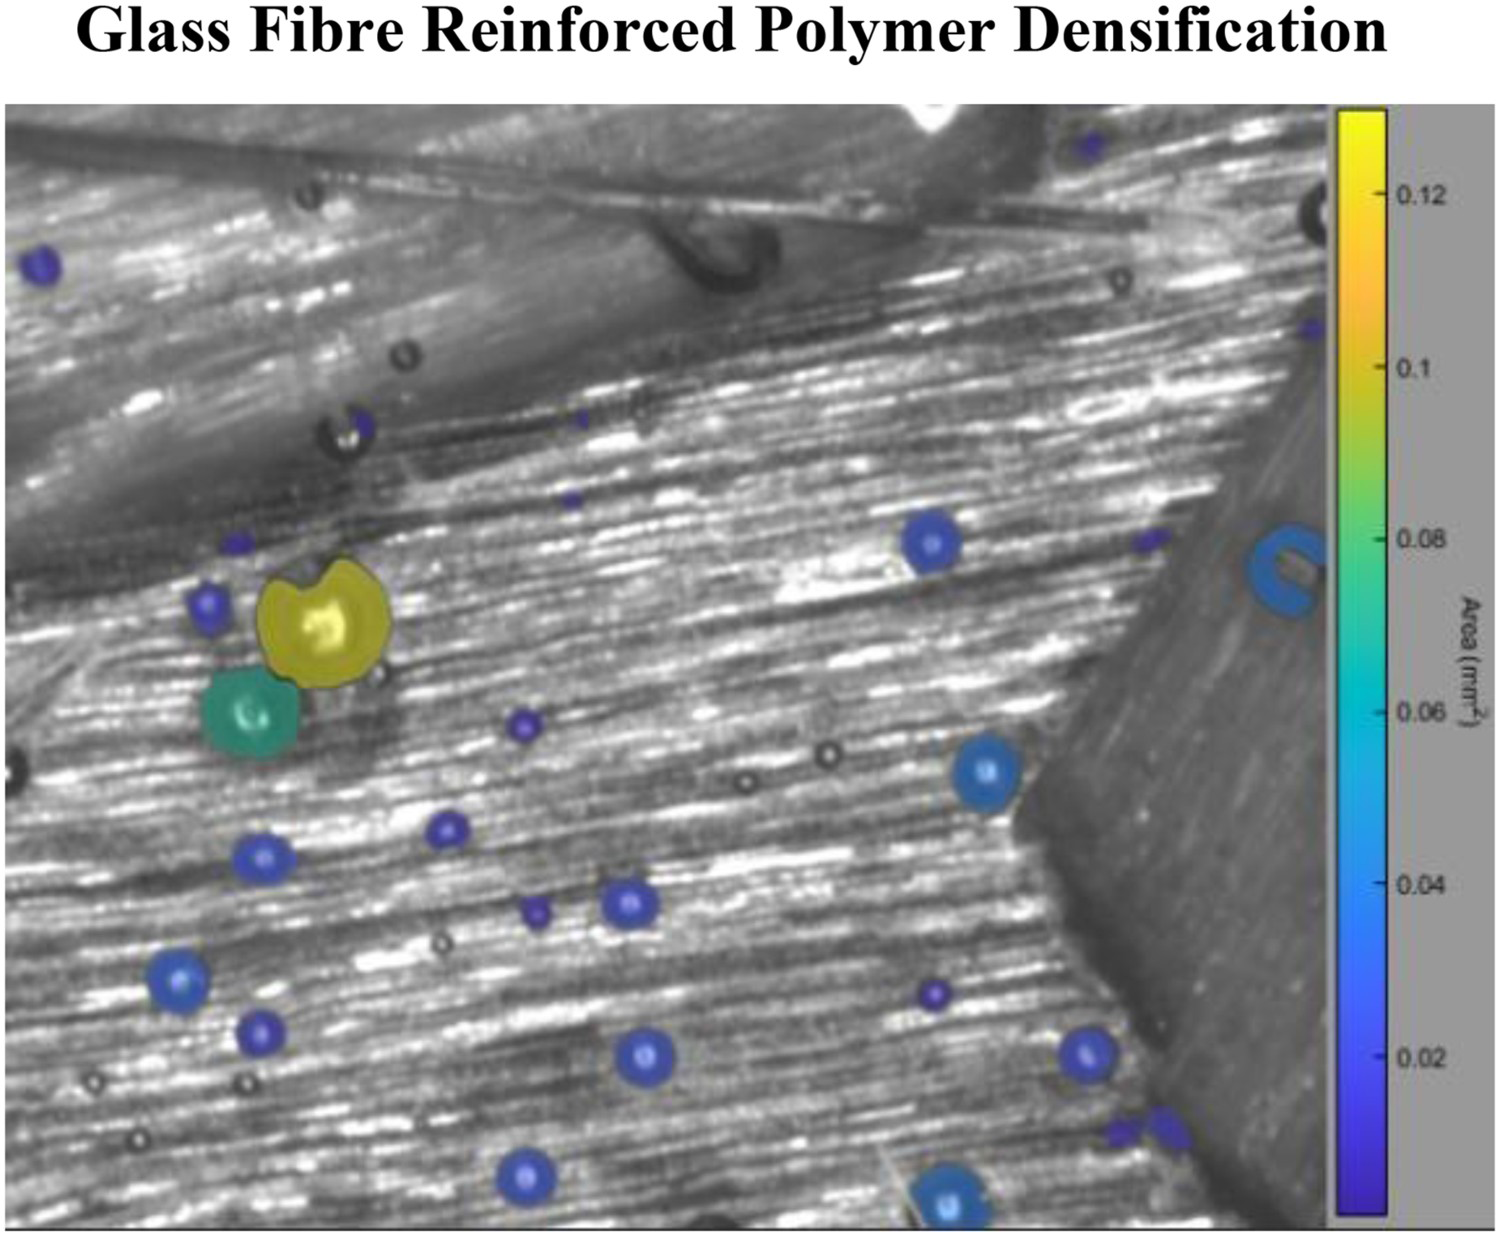
Glass fibre-reinforced polymer densification
The second part of the densification study focused on comparing tests varying the fibre content and resin type. The study of the densification of resins in RM has been studied extensively in the past. During the densification of a piece made only of resin, the air trapped in the plastic becomes bubbles, which diffuse into the melt, decreasing in size until they disappear. By adding fibre to the mix, they could alter the way the air diffuses into the melt. In this part of the densification study, two RM-grade PE resins were tested, and samples were tested varying the content of F1 fibres. The fibre content of the samples was increased from 10% to 30% to check if the presence of fibres altered the appearance and disappearance of the bubbles. These tests were carried out at a temperature of 250°C, and tests were also carried out for the RM1 resin at a temperature of 300°C.
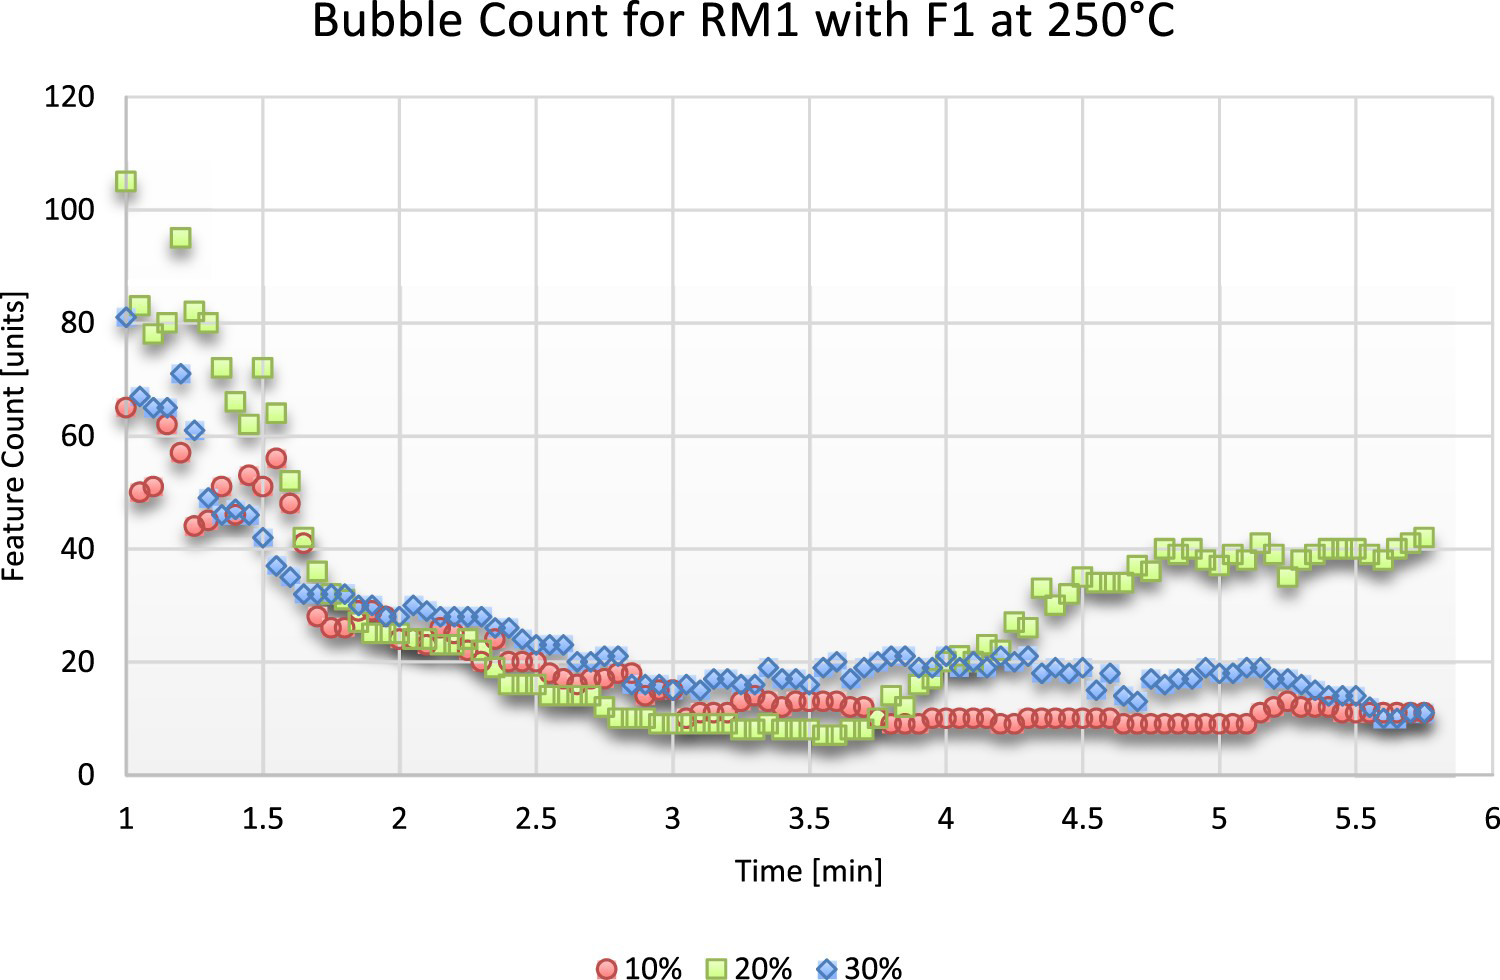
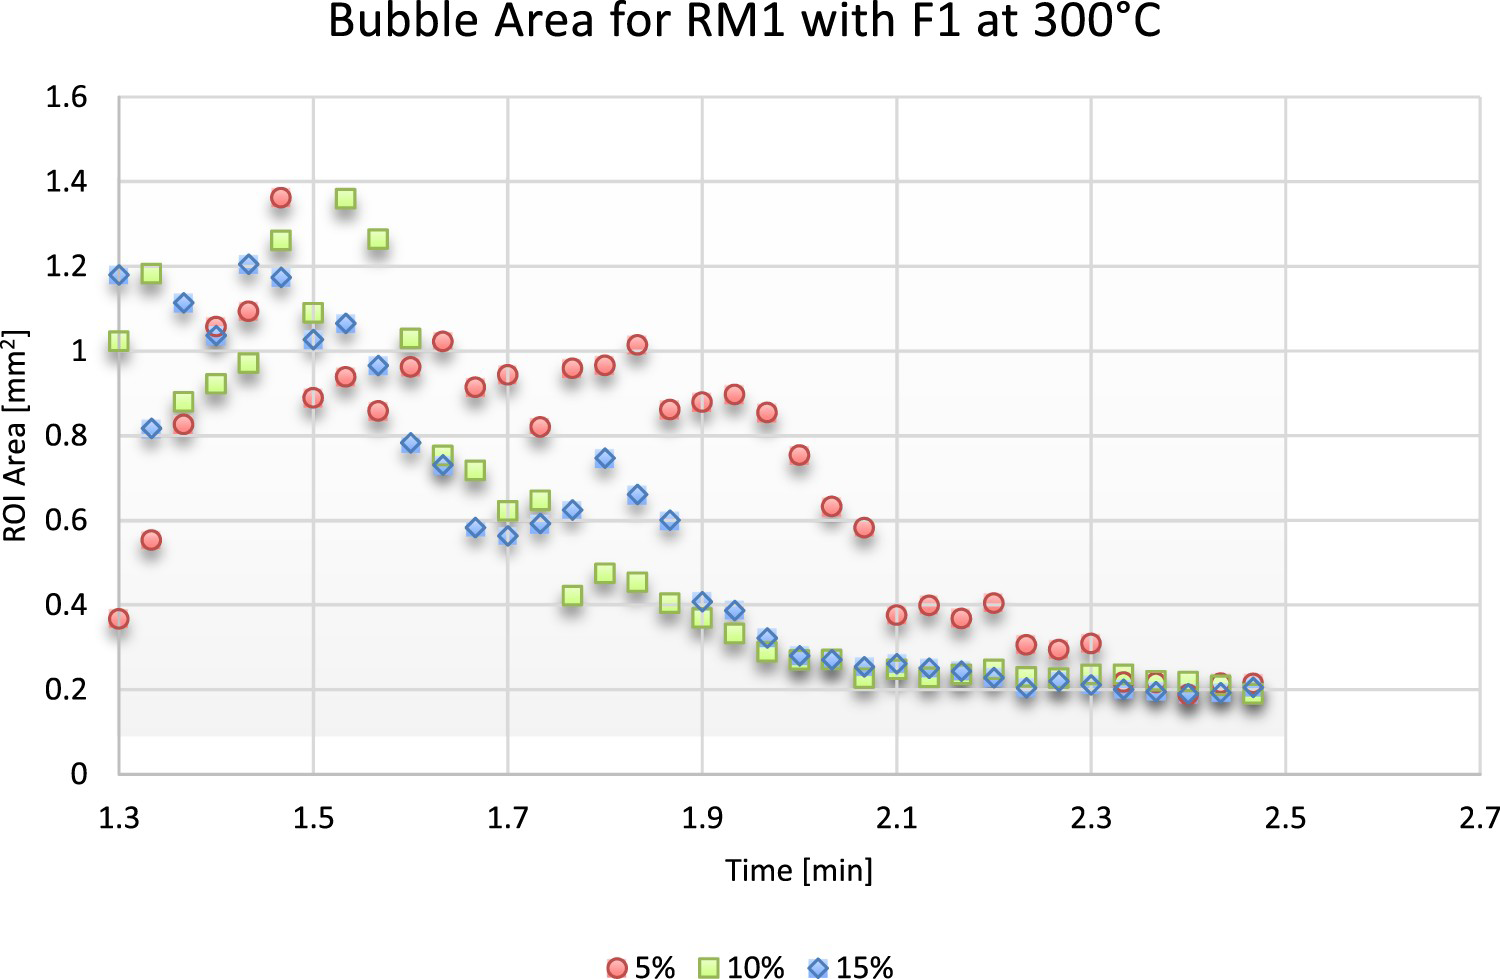
The results are shown in Figures 15–20. Figures 15 and 16 show the curves corresponding to the analysis of the sintering images of the RM1 resin in the presence of the F1 fibre. Given the results, it can be seen that the area detected by the algorithm at the beginning of the test is high, and, as the process passes, it decreases over time until it becomes approximately constant, around 3.5 min. It should be noted that the sample reinforced with 20% fibre shows an increase in the detected area after minute four, where the detected area practically doubles around minute 5. This phenomenon is mainly due to erroneous detection by the algorithm of parts of the image background. To counteract this flaw, a better refinement of the algorithm is necessary for future studies. It is also interesting to note that the samples with 20 and 30% fibre show a detected area of approximately half of the sample with 10% fibre content. These results suggest that an increase in fibre could prevent the appearance of bubbles present in the material.
Fibre-reinforced sample densification curve showing the ROI (Bubble) area of F1-RM1 at 250°C. Densification curve showing the feature (Bubble) count of F1-RM1 at 250°C. Fibre-reinforced sample densification curve showing the ROI (Bubble) area of F1-RM2 at 250°C. Densification curve showing the feature (Bubble) count of F1-RM2 at 250°C. Fibre-reinforced sample densification curve showing the ROI (Bubble) area of F1-RM1 at 300°C. Densification curve showing the feature (Bubble) count of F1-RM1 at 300°C.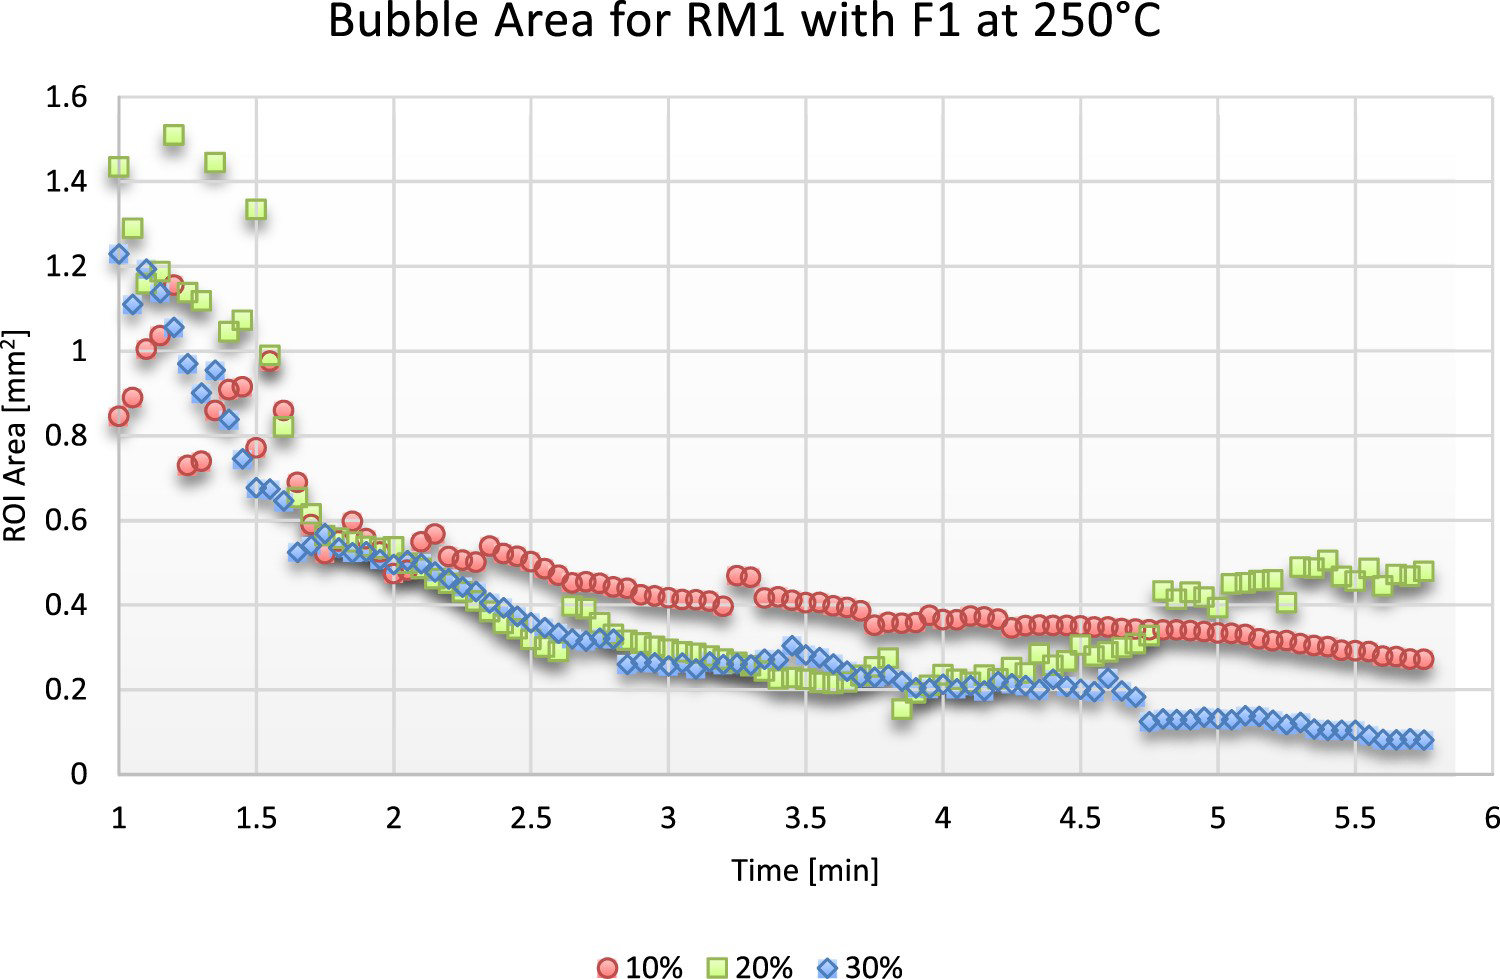
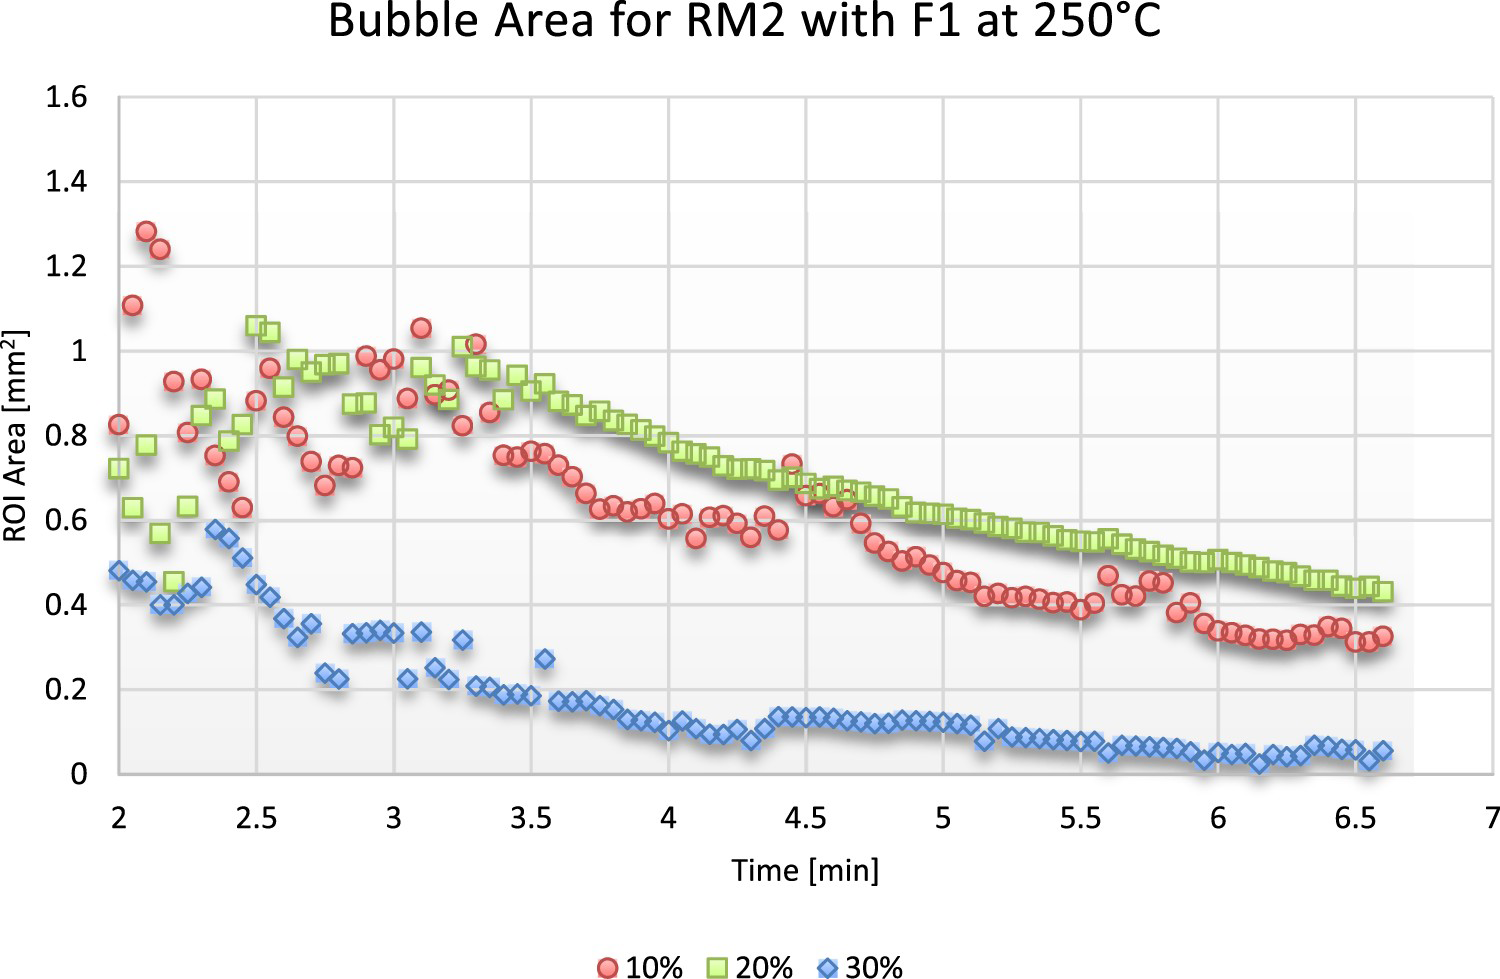
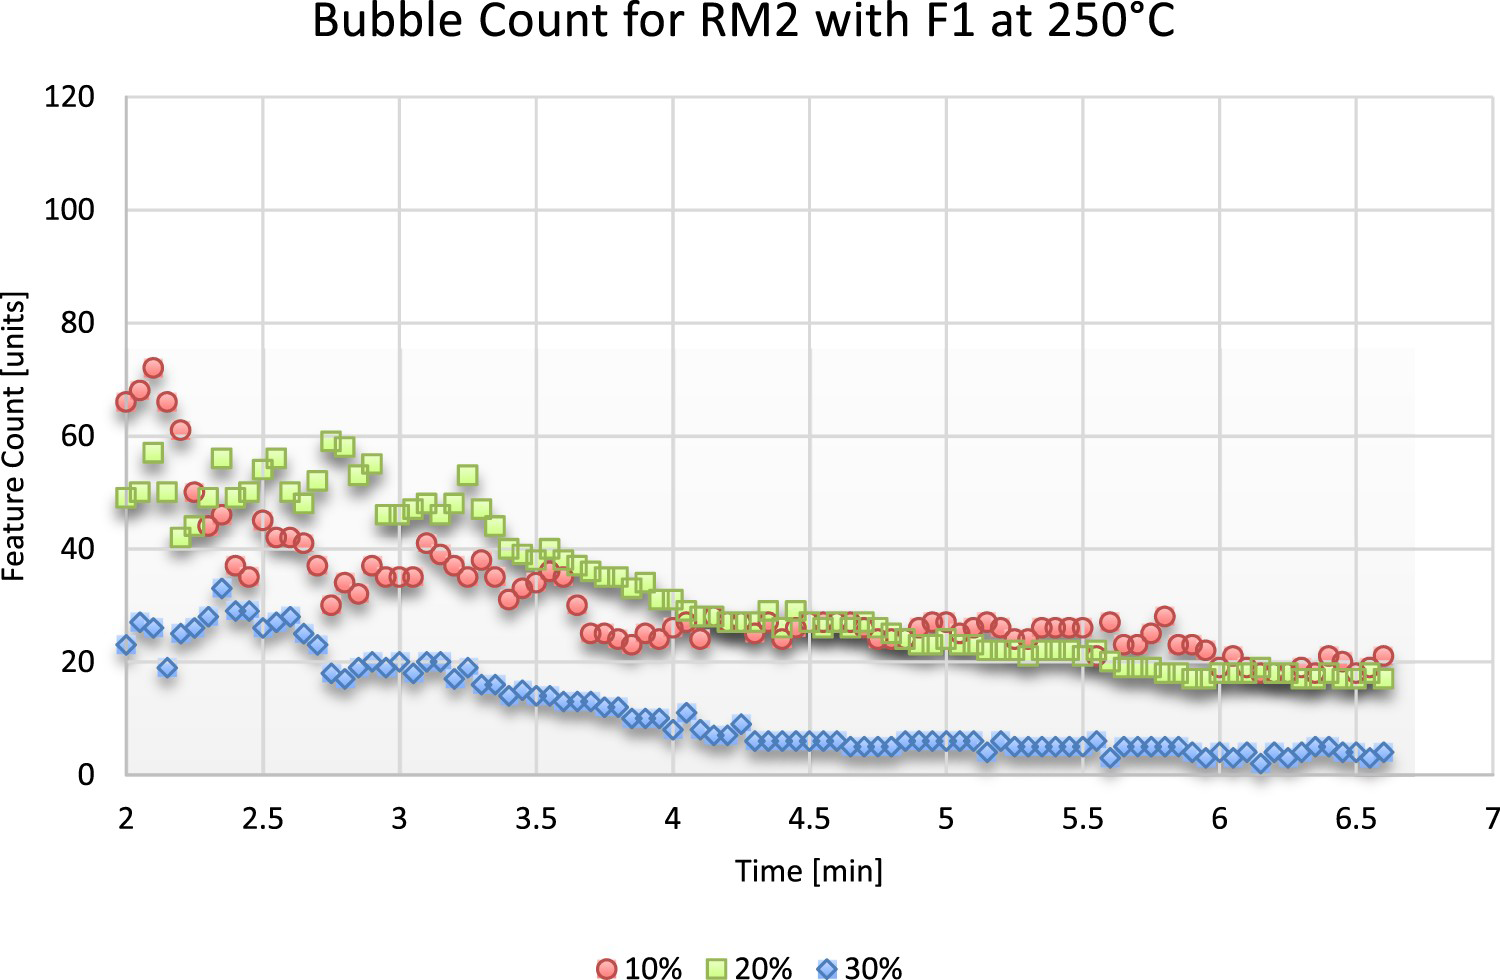
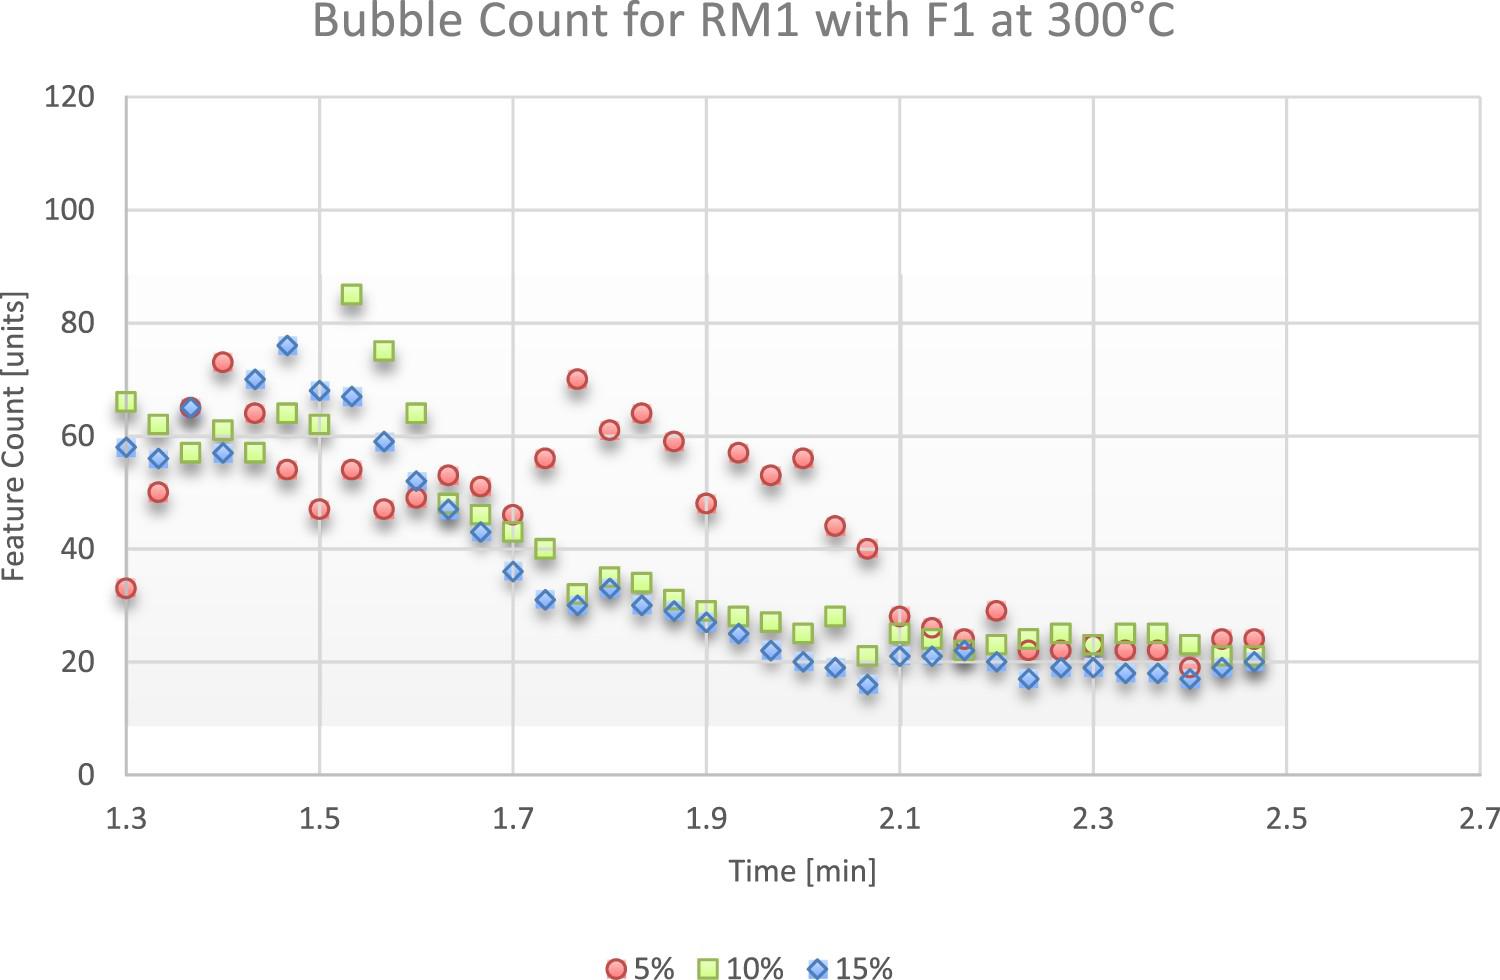
Figures 17 and 18 present the results for the RM2 resin reinforced with F1. Unlike RM1 resin, RM2 resin shows a more extensive detected network than RM1 resin. In the same way, it is worth highlighting the curve corresponding to 30%, which shows a relatively low area. These data could suggest that increasing fibre content may cause bubbles in the plastic to diffuse into the air contained between the fibres, thus showing a smaller area. As with the RM1 resin, Figure 18 shows that the detected bubble density shows a specific correlation with the area detected in Figure 17. Finally, Figures 19 and 20 show the results of the RM1 resin with the presence of the fibre F1 at a temperature of 300°C. Increasing the temperature accelerated the densification process as with the unreinforced resins. The curves can identify this since around minute 2, almost all of the material has densified. On the other hand, the area and number of elements detected are slightly more significant than expected. However, densification takes place in approximately one minute, as in the results of the unreinforced samples (Figure 21).
Comparison between unreinforced and fibre-reinforced polymer sample.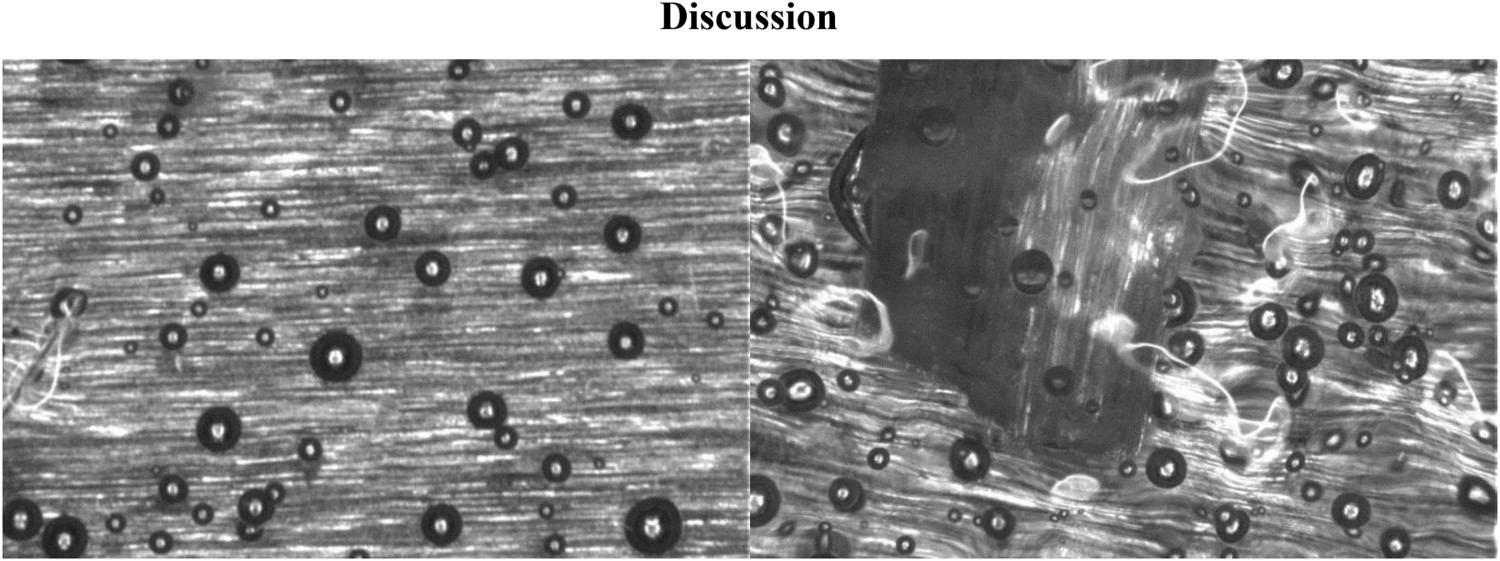
Discussion
The unreinforced sample results showed that temperature and particle size are the most influential parameters in bubble size. These results are comparable with those obtained by authors such as Spence, Vlachopoulos, Kontopoulou and Emami, who also concluded that the particles’ thermal, rheological and geometric properties are the most influential parameters in the densification of the polymer during heating [12, 16, 17]. The results show that by using a high hot plate temperature (21% increase from 473 to 573 K), the bubble density of the parts can be drastically reduced by 50%. This result relates to Kontopoulou, who showed a reduction of approximately 50% (from ∼45 s to ∼ 20 s) by increasing sample pressure by 20% [18]. The relations established by the authors in that paper suggest that thermodynamical parameters related to Boyle's law would govern the phenomenon fundamentally. A more detailed study of the size and distribution of the bubbles showed that using different particle sizes directly impacts the amount and size of the bubbles present in the material. Specifically, the results indicate that the use of fine particles (90–105 μm) produces a dramatic increase in the number of bubbles (by 500% compared to coarse particles) of small size (a decrease in the mean bubble size of 50% on average). On the other hand, using coarse particles (500–600 μm), the number of bubbles is slightly lower, but their size is significantly larger. However, the most significant data provided by the unreinforced powder tests was that increasing the temperature of the dish drastically reduces the number and size of the bubbles, making them disappear in most cases.
Similarly, fibre-reinforced results also compare with the previously available research [12, 16-18]. The presence of fibres in the mixture alters the way the air diffuses into the melt. The sample's fibre content was increased from 10% to 30% to check if the presence of fibres altered the appearance and disappearance of the bubbles. Similarly, the heating parameters also varied between 200°C and 300°C. The results showed densification very similar to that observed in the unreinforced powder samples. However, the results align with the unreinforced trials and with Spence, Vlachopoulos, Emami and Kontopoulou's conclusions regarding the diffusion of gases through the melt [12, 16-18]. Although the results show detection errors by the algorithm of part of the image's background, the results provided important information. In the case of the RM1 resin with the F1 fibre, the samples with 20% and 30% showed a detected area of approximately half that with 10% of the fibre content. In the same way, the tests with the RM2 resin and the F1 fibre showed a similar effect, where a relatively low area was detected in the sample of 30%. These data suggest that increased fibre content facilitates bubble nucleation points where air diffuses. In this way, the air present in the fibres and bubbles close to it would be very difficult or impossible to detect with the algorithm. In any case, when studying the densification of fibre-reinforced powders at plate temperatures of 300°C, the same dramatic reduction in the number and density of bubbles was observed as a result. Nevertheless, unlike unreinforced tests, the detected area did not wholly disappear.
Conclusions
In summary, the presented work focused on the study of the densification of polymeric resins with the presence of reinforcing fibres. Previous studies have shown that the way in which the polymer densifies prior to sintering produces the presence of bubbles in the structure [5, 16]. The literature has already shown that the properties of the resin, as well as other parameters such as the size and geometry of the particle, directly determine the quantity and size of the bubbles present in the structure [12, 17, 18]. However, this work focused on elucidating to what extent the addition of fibres to the mix could affect the generation of bubbles in the product. The results showed that temperature and particle size are the most critical parameters for producing optimal densification. However, the results suggest that fibres in the mixture promote air diffusion from the bubbles to the air present in the fibres. In any case, the most determining parameter in the reduction and disappearance of bubbles is the temperature. Therefore, observations indicate that precise control of heating parameters (e.g. using electrically heated tools) could dramatically improve the quality of rotomoulded composites.
Footnotes
Disclosure statement
No potential conflict of interest was reported by the author(s).