
Abstract
Residual stresses created from welding have a direct influence on fracture mechanisms of cracks and flaws in and around welded regions. Excessive residual stress can lead to unexpected failures and an important property in fitness-for-service calculations. In this work, an experimental database of the residual stress of low heat input austenitic girth welds is analysed for statistical correlation. The combined measurement profiles indicate normality throughout the weld thickness. Two-sample tests of grouped datasets were additionally carried out to examine potential relationships within the data. Presented measurements were characterised by location from weld centre, and similarly, by pipe aspect ratio. Results indicate a moderate influence of dimension ratio on residual stress in piping components suggesting potential for additional consideration in fitness-for-service procedures.
Introduction
Unavoidable weld residual stresses play a significant role in fracture and influence the safe operation of many engineering systems. Excessive residual stresses can lead to unexpected failures and influence design and manufacturing processes and impact fracture mechanisms in structural integrity assessments. In a tensile region of residual stress, driving forces for fracture are increased resulting in the increased likelihood of failure. Compressive stresses, however, promote crack closure and are typically regarded as beneficial in terms of structural integrity. Both tensile and compressive stress regions exist simultaneously within welded components, while influencing integrity calculations in opposite ways.
Circumferential (‘girth’) welds, frequently used in on- and off-shore piping, pressure vessel components among others, are inherently vulnerable to tensile residual stress (transverse to the weld run direction, see Figure 1). This is because during fabrication flaws are more likely to be oriented parallel to the weld, and therefore affected by stresses perpendicular to the weld. As a preventative measure, post-weld-heat-treatment (PWHT) can be utilised to reduce harmful regions of transverse residual stress. PWHT, applied post manufacturing, however, adds additional cost and time consideration to carry out. Therefore, a large proportion of pipe girth welds in the industry remain in the as-welded condition throughout their service life [1,2].
Pipe girth weld schematic defining the direction of tensile/transverse (to the weld) residual stress  , wall thickness B, position from inner wall surface z, maximum weld width W and pipe outer radius R.
When a flaw is detected in or around the weld region, it is important to assess the part's structural integrity using accurate stress (both applied and residual) and its associated material properties. Measurement of weld residual stress, however, is notoriously difficult and costly to perform due to its internal, locked-in state [3,4]. Some established destructive measurement techniques include Incremental Centre Hole Drilling (ICHD), Deep Hole Drilling (DHD) and Contour Method (CM) which are classified as destructive techniques. Destructive methods, as described, systematically break specimens to measure external geometrical changes caused during the release of residual stress. Non-destructive methods such as Neutron Diffraction (ND) and synchrotron X-ray Diffraction (XRD) [5] have been developed to determine residual stress, with accuracy, in components noninvasively. Non-destructive methods are, however, much more restricted by a number of available locations, associated costs, additional transportation, and specimen size. In general, both destructive and non-destructive measurement methods are limited by the amount of residual stress information that can be extracted from within a sample. Residual stress is highly susceptible to variation due to deviations of conditions weld-to-weld and also within the same weld. This includes variation of weld heat input, welding speed along the run, geometrical considerations, and overall number of passes. This can lead to conservative, and in some cases excessive estimates of weld residual stress in fitness-for-service calculations.
Computational methods using Finite Element Analysis (FEA) use knowledge of material behaviour and interaction of welding processes to predict residual stress formation. Although scientific understanding has improved over the years regarding weld modelling, uncertainties are present with these methods, in addition to requiring expert judgement to ensure reliable results [6]. FEA is, overall, useful for understanding how underlying welding processes influence residual stress, however, is not recommended for isolated use in integrity assessments of engineering components [7,8].
Residual stress in fracture assessment
Structural integrity assessment procedures, including R6 [7], BS 7910 [8] and API 579 [9], use knowledge from both experimental and numerical analyses to provide advice regarding the treatment of residual stress in fracture calculations. These can vary in complexity depending on the context of the assessment in addition to weld and material parameters of the pipe component. In R6 [7] and BS 7910:2019 [8], weld heat input (defined as weld heat input or weld arc energy normalised by the pipe thickness) and parent material type (austenitic or ferritic steel) is required to determine the appropriate non-linear upper bound assumption of residual stress (see Figure 2). Where a value of 1 on the x-axis denotes the pipe outer surface (0 being the pipe inner surface) and a value of 1 on the y-axis represents residual stress equal to the parent material yield strength. The most complex and involved analysis of the Level 3 approach requires experimental measurement (using either destructive or non-destructive methods) of residual stress using a manufactured weld mock-up. FEA may also be used to back up the experimental results of a Level 3 analysis.
Upper bound transverse residual stress distributions for pipe butt welds adapted from BS 7910 Annex Q [8].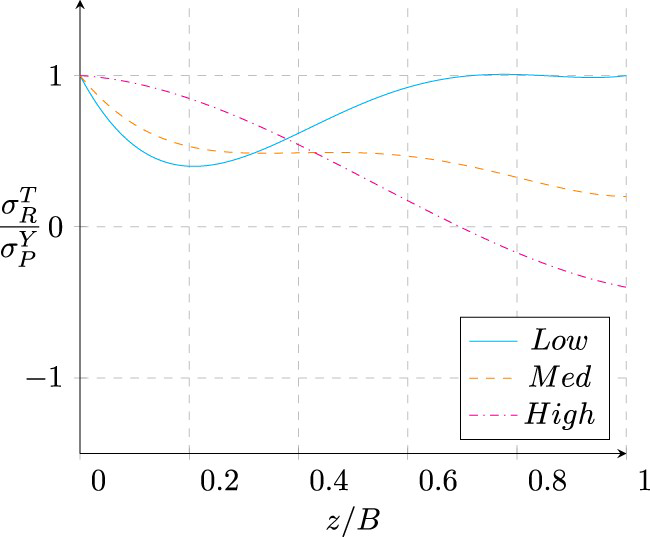
A Level 3 assumption provides the most accurate approximation of weld residual stress of a given component. However, performing a Level 3 analysis (i.e. direct measurement), as described, requires additional costs and resources. Therefore a more conservative assumption of the residual stress is likely to be used, accounting for worst case stress. This consists of a Level 1 or Level 2 interpretation (definition according to BS 7910). Applying a Level 1 interpretation denotes residual stress equal to the parent material yield strength uniform throughout the component thickness and naturally the most conservative assumption that can be applied. A level 2 interpretation consists of non-linear upper bounds (shown in Figure 2) and is dependent on the weld heat input (or arc energy) normalised by the component section thickness (B), giving a slightly less conservative assumption than Level 1. These upper bounds can be applied to many girth welded components without the requirement of direct measurement. Therefore, the conservative estimates of Level 1 and Level 2 are likely to be used in integrity assessments of industrial piping components.
Considering low heat input welds ( for ferritic steel and
  for austenitic steel), a much larger heat input range, and therefore potential data, is available for austenitic girth welds compared with those from ferritic pipes. A database of measurements can help provide separate profile recommendations for austenitic pipes, providing more realistic assumptions in fracture assessment. Furthermore, it can measure the variability of measurements (in general) and also investigate parameter influence by partitioning datasets and testing for potential correlation.
Statistical analysis of pipe girth welds has been carried out in previous studies [10–12] by combining the results of different pipes. This method involves normalising the measurement position relative to the internal surface of the pipe (z) by the section thickness (B) and the magnitude of residual stress  by the material yield strength
  . This is identical to approaches currently in use by BS 7910 [8] and R6 [7] to apply the appropriate Level 2 profile of transverse stress.
Analytical and computational methods suggest that parameters other than weld heat input and material type can influence residual stress profiles. This has been discussed in detail by Song et al. and Dong et al. [13–15]. These studies suggest the influence of pipe aspect ratio (the ratio of pipe outer radius to wall thickness, also referred to as standard dimension ratio) can be considered for more tailored profiles for use in integrity assessments. The pipe thicknesses (B) in the highlighted studies range from 1/4 inch (6.35 mm) to 10 inch (254 mm) and describe a transitioning regime between self-equilibrating at lower aspect ratios to local bending stress at higher aspect ratios. For reference, BS 7910 defines the limits of as residual stress distributions between thicknesses 16 mm and 110 mm for austenitic girth welds. Computational models are useful in these types of analyses as specific parameter influence can be tested as other parameters (such as thickness or heat input) remain constant. Although these works outline a detailed parametric analysis of profile estimation of transverse residual stresses, the results have not yet been validated using physical specimens.
In summary, no substantial changes have been made to Level 2 residual stress profiles for pipe girth welds over a relatively long period of time despite new data, measurement techniques and advancements in computational methods becoming available. In this work, we survey published residual stress data for pipe girth welds to assist validation of current treatment advice using experimental data. In particular, we focus on differences between austenitic and ferritic steel welds, pipe aspect ratio and of the measurement position.
Database of transverse residual stress measurements
The residual stress data used in the following analysis consists entirely of experimental results gathered from past literature (provided in references in Figure 3 caption). The database inclusion criteria consist of: 1. Low heat input (or arc energy) welds normalised by the component section thickness alongside 2. Parent material yield strength  parameter. Figure 3 illustrates the scope of data available in the literature under this criteria. Measurement techniques used within the proposed database include a combination of DHD, ND and CM (discussed in greater detail in other reports [16,17]).
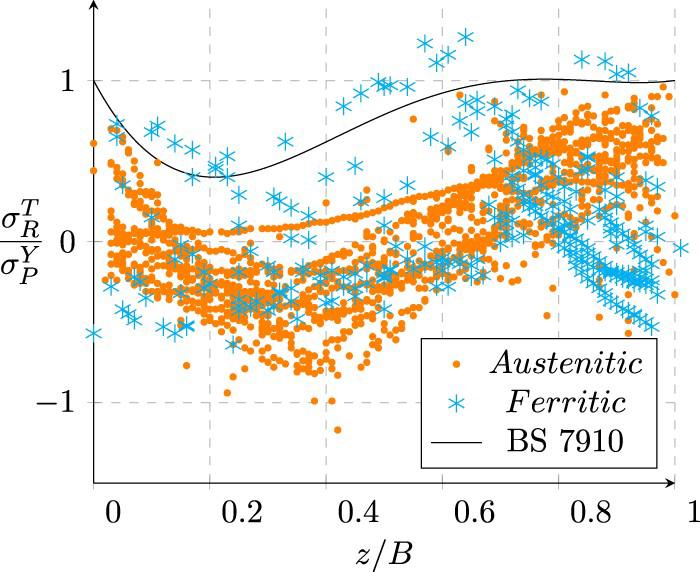
The large disparity between the quantity of data fulfilling the inclusion criteria between austenitic and ferritic welds can be seen in Figure 3. From the presented data, it is reasonable to suggest that austenitic measurements are more suited for the examination of statistical properties including through thickness depth variability and investigation of additional parameter influence.
Representation of residual stress data
Residual stress data from a range of pipe parameters are combined and presented following advice from BS 7910. This involves normalising the measurement position relative to the internal surface of the pipe (z) by pipe wall thickness (B) and the magnitude of residual stress  by the material yield strength
  . As proposed, austenitic measurements present a larger pool of data for characterising trends in variability and testing pipe parameter influence.
Comparison of through-thickness profiles
Combining the results from numerous sources, using a range of measurement techniques, will inevitably create scattering of position across normalised through thickness (see Figure 3). This creates difficulties for comparison of residual stress at specific locations through thickness between experiments. The method presented here fits polynomial curves to each individual profile measurement (in normalised units) between the inner and outermost points. This adjusts position scattering and allows for direct comparison of measurements (see Figure 4).
Combined austenitic data. Each through thickness measurement is represented by a polynomial between the inner and outermost measurement depths (Figure 3).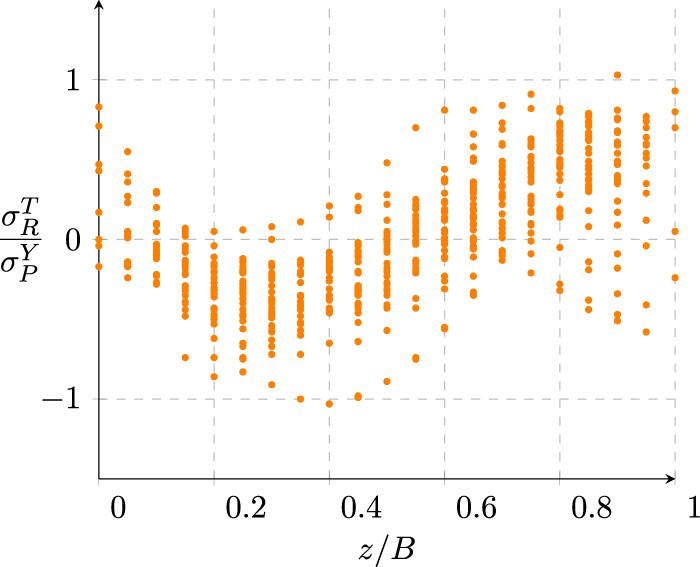
The interpolated representation of residual stress measurements (Figure 4) allows for direct comparison between residual stress datasets with different spatial resolutions. A variety of normality tests were carried out consisting of Shapiro–Wilk (S-W) (see Equation 1 in the supplementary document and Tables S1 and S2) [18], Anderson–Darling (A-D) (see Equations 3 and 4 and Table S4 in the supplementary document) [19] and D'Agostino–Pearson (D-P) tests (see Equations 5–13 and Table S5 in the supplementary document) [20]. Each of the tests uses the null hypothesis that the provided data sample is normally distributed within a defined significance level (corresponding to a minimum correlation value, p-value). Example normality test calculations are also provided using data at 0.5 normalised through thickness depth (Table S3). Further information regarding each normality test is outlined in the supplementary document and [25].
To eliminate the influence of profile shape through thickness on results, a number of normality tests are carried out at specified through thickness depths. A significance value of 95% was chosen to reflect potential real-world implications regarding safety and while maintaining reasonable confidence in the statistical results. Normality test results at the inner and outer surfaces (at 0 and 1 normalised through thickness depth, Figure 4) were omitted due to insufficient sample sizes.
Two-sample hypothesis testing
Two-sample hypothesis testing is a statistical method to measure the degree of correlation between two data populations. For normally distributed data this consists of a correlation of mean and standard deviation of samples. The degree of overlap between distributions reflects correlation and is determined using the p-value statistic. The chosen tests consist of Welch's t-test (W-T-T) (see Equations 14-15 and Table S6 in the supplementary document) [21] and Two-sample A-D Test (see Equations 16–19 and Tables S8 and S9 in the supplementary document) [22]. The significance level was similarly chosen at 95% (0.05) for both tests. Example two-sample test calculations are also provided using WCL and HAZ data at 0.5 normalised through thickness depth (Table S7). Further information regarding each two-sample hypothesis test is outlined in the supplementary document.
The experimental database was partitioned into subcategories for investigation of parameter influence on through-thickness residual stress profiles. The following analyses are conducted to test the applicability of advice given in BS 7910 regarding Level 2 residual stress profiles (shown in Figure 2) consisting of treatment advice at weld-centre-line (WCL) and heat-affected-zone (HAZ) locations and potential influence of pipe aspect ratio.
WCL & HAZ data
The presented database of austenitic residual stress profiles has similar-sized datasets of WCL and HAZ data (45% for WCL and 55% for HAZ). BS 7910 currently advises identical treatment of these regions within one weld width, W, (see Figure 1) from the edge of the Last Capping Pass (LCP). All recorded HAZ measurements in the database are within this boundary with the vast majority carried out at the edge of the LCP. Both groups were individually tested for normality and correlation (two-sample testing) across 0.1 (every 10%) incremental depths through the wall thickness.
Pipe aspect ratio data
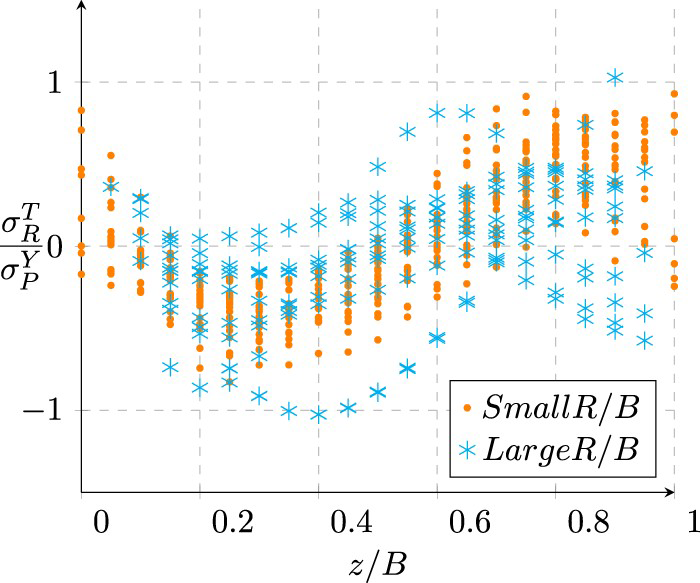
Figures 5 and 6 present the austenitic database partitioned according to pipe aspect ratio. The majority of pipe aspect ratios are of smaller proportions, reflecting steam piping components, while larger aspect ratios likely stem from research involving pressure vessel components. Due to an absence of data at intermediate values of pipe aspect ratios, two groups have been proposed to test correlation while maintaining appropriate sample sizes.
Histogram illustrating the range of pipe aspect ratio R/B of austenitic pipe girth welds in the dataset. Normalised measured residual stress distributions for austenitic welds partitioned by pipe aspect ratio.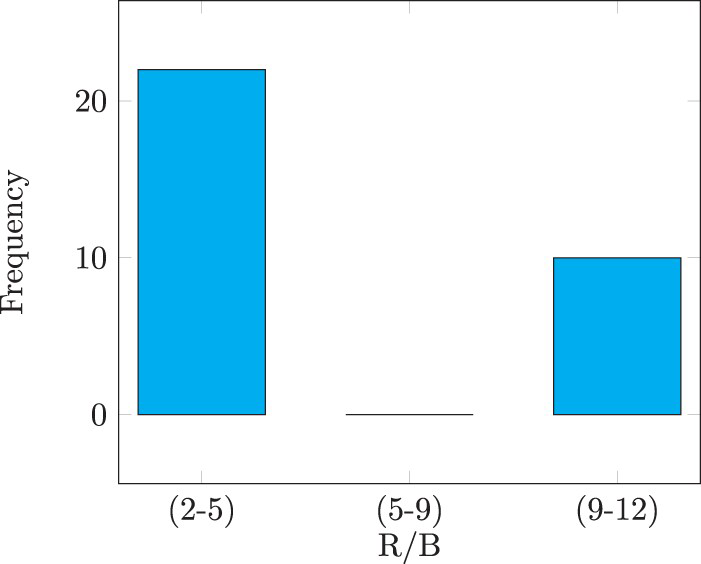
Normalised residual stress measurements of austenitic steel girth welds gathered from literature were examined to investigate trends within the data. The database is organised in the following results initially by the combined austenitic database, and two further subcategories of the database, consisting of WCL and HAZ measurements and pipe aspect ratio. Normality tests were carried out across all categories while two-sample tests were only carried out on the prescribed subcategories.
Austenitic database measurements
The data gathered from studies can be found in the references provided in Figure 3. These consist of residual stress measurements including supplementary data regarding parent material yield strength among other parameters. Parent yield strength is used in normalising the data when comparing measurements from different pipes. This requirement is applied to reduce error when using assumed yield strength magnitudes based on handbook data (highlighted in previous research [10]).
The requirement for parent material yield strength information eliminates many older measurements from the analysis. Austenitic measurements are, in general, well characterised and tend to represent the majority of up-to-date residual stress measurement data. This is likely due to growing interest in pressure piping and vessel components used in nuclear applications which typically use austenitic steels.
Normality test results
The following results consist of Shapiro – Wilk (S-W) [18], Anderson – Darling (A-D) [19] and D'Agostino – Pearson (D-P) [20] normality tests. A range of tests has been chosen to capture and compare multiple aspects of normality which may be present in the data. The S-W test is designed to detect departure from normality. Typically, the A-D test gives more weight to deviations of data towards the tails of the distribution compared to a S-W test. The D-P test is unique in that it utilises skewness and kurtosis properties of the data to determine normality. The D-P test refers to the symmetry of the distribution of the data which is tested against a normal distribution.
Residual stress measurements of austenitic girth welded components can be seen to follow a normal distribution for the majority of through thickness segments, consistent with the results of previous research [10]. Highest p-values were recorded towards inner surface measurements and remain reasonably consistent across each segment. Individual groups were also tested and shown to be normally distributed. Overall, the data do not significantly deviate from normality, especially close to the pipe inner surface.
Two-sample test results
Results from previous normality testing indicate a normal distribution of measurements both overall and in the proposed testing groups allowing for further two-sample testing between data groups using tests which assume normality. Indication of correlation between populations, suggests similar treatment in fracture assessment guidance regarding girth weld residual stress. The proposed groups consist of WCL and HAZ measurement locations and low and high pipe aspect ratios. The applied two sample tests consist of W-T-T [21] and two-sample A-D tests [22], both of which are capable of comparing data with differing sample sizes. Similar to normality tests, the reliability of two-sample testing is dependent on sample size and requires consideration when interpreting results. W-T-T and two-sample A-D tests are derived from Student's two-sample t-test and empirically more powerful than K-S tests [23,24]. A combination of both tests provides a wider perspective regarding data correlation and interpretation of results compared with using a single testing model.
WCL & HAZ two-sample test results
P-value results of two-sample Anderson Darling and Welch's t-test between WCL and HAZ and low and high pipe aspect ratio data at each through thickness depth.
P-value results of two-sample Anderson Darling and Welch's t-test between WCL and HAZ and low and high pipe aspect ratio data at each through thickness depth.
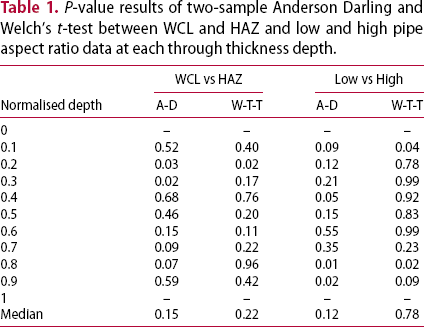
The two-sample test results between low and high pipe aspect ratio datasets (see Figure 5) are presented in Table 1. A clear difference between the median results of A-D and W-T-T indicates a larger disparity of data towards the outer tails of the distribution (i.e. the spread of data) compared with (on average) the sample means.
Overview of results
In this paper, several assumptions regarding treatment advice of transverse residual stresses in low heat input girth welds have been investigated. This has been carried out using experimental data gathered from literature. Within the research literature, we identified reliable datasets and eliminated many older datasets containing partial information of pipe geometry, measurement of tensile properties, and welding conditions. Within these criteria, it was shown that austenitic girth welds are better represented and correlate both in profile shape and variability. Ferritic girth weld data, on the other hand, is severely scattered showing no signs of obvious agreement or trends in data.
The variability of measurements of the combined austenitic data alongside both WCL and HAZ regions show strong evidence of normality. Two-sample testing was carried out on the WCL and HAZ measurements indicating that these regions are likely to originate from the same data population (i.e. can be considered the same). This has implications for treatment in integrity assessment procedures, confirming current treatment advice on residual stress at the WCL and HAZ using experimental data.
Currently, BS 7910 and R6 do not advise pipe aspect ratio (the ratio of pipe outer radius to thickness) as a determining factor in the selection of Level 2 weld residual stress profiles. This implies that similar (and often excessive) residual stress distributions are expected to occur in a large range of geometrically different pipes. The experimental database examined here reflects two distinct aspect ratio groups of austenitic welds, a smaller pipe typically used for steam piping ( ≈ 3) and larger (thinner-walled) pressure vessel or pipeline (
 ≈ 10) component. Results from two-sample testing on pipe aspect ratio groups indicate a correlation of the population mean. However, the groups have shown to typically differ regarding their distribution. This implies that variability is a larger concern for thinner-walled pipes (a result consistent with the findings of other authors, [26]); however, more data are required to present alternative treatment of different geometries confidently. It is suggested that less conservative treatment can be used in fracture assessment using the presented results. This could be used to help update treatment advice of austenitic steam piping components, for example, in power generation applications.
Conclusions
Overall, residual stresses in ferritic steel pipe welds have not been experimentally characterised as extensively as those in austenitic steel pipe welds. This implies a strong incentive for separate treatment in fracture assessment. Experimentally measured residual stress data for a range of austenitic girth welds appear normally distributed. This could simplify the application of probabilistic models for the residual stress state of un-measured welds. The proposed analysis supports the assumption that the through-thickness residual stress profiles in pipe welds are similar at the weld-centre line and at the edge of last capping pass. This work supports current BS 7910 and R6 procedures for selecting Level 2 assumed residual stress profiles, in that pipe aspect ratio does not have a significant influence on weld residual stress in austenitic pipe welds.
Footnotes
Disclosure statement
No potential conflict of interest was reported by the author(s).