
Abstract
The review describes recent progress on understanding and quantification of the various phenomena that take place during plasma electrolytic oxidation, which is in increasing industrial use for production of protective coatings and other surface treatment purposes. A general overview of the process and some information about usage of these coatings are provided in the first part of the review. The focus is then on the dielectric breakdown that repeatedly occurs over the surface of the work-piece. These discharges are central to the process, since it is largely via the associated plasmas that oxidation of the substrate takes place and the coating is created. The details are complex, since the discharge characteristics are affected by a number of processing variables. The inter-relationships between electrical conditions, electrolyte composition, coating microstructure and rates of growth, which are linked via the characteristics of the discharges, have become clearer over recent years and these improvements in understanding are summarised here. There is considerable scope for more effective process control, with specific objectives in terms of coating performance and energy efficiency, and an attempt is made to identify key points that are likely to assist this.
Background to PEO processing
Historical development and range of metallic substrates
Introduction
Plasma electrolytic oxidation (PEO) processing allows the creation of durable, thick, uniform and strongly adherent coatings on metallic components of complex shape (including deep re-entrant features), without subjecting the substrate as a whole to elevated temperature and without requiring highly complex equipment. It also allows the creation of surfaces with a wide range of natural colours and textures. It thus has strong attractions for many applications. Industrial usage of PEO continues to increase and its study over recent years has become extensive. This can be seen from the publication statistics presented in Figure 1, which gives the number of papers published, and the citation levels for them, over the past 15 years. Furthermore, industrial and commercial exploitation of the process continues to expand. The current market leader, in terms of supply of PEO technology, is probably Keronite (UK), although activity is global, with available products including those from Ceratronic (France), Kepla-Coat/Magoxid-Coat (Germany) and Tagnite (U.S.A.). It seems likely that there will be major developments in the area over the next decade or two. Publication data for PEO papers up to the end of 2017. Publication and citation data refer to the same papers, giving rise to the low citation numbers for very recent years. (These data are from the Web of Science, concerning papers containing the term ‘Plasma Electrolytic Oxidation’ or ‘Micro-Arc Oxidation’.)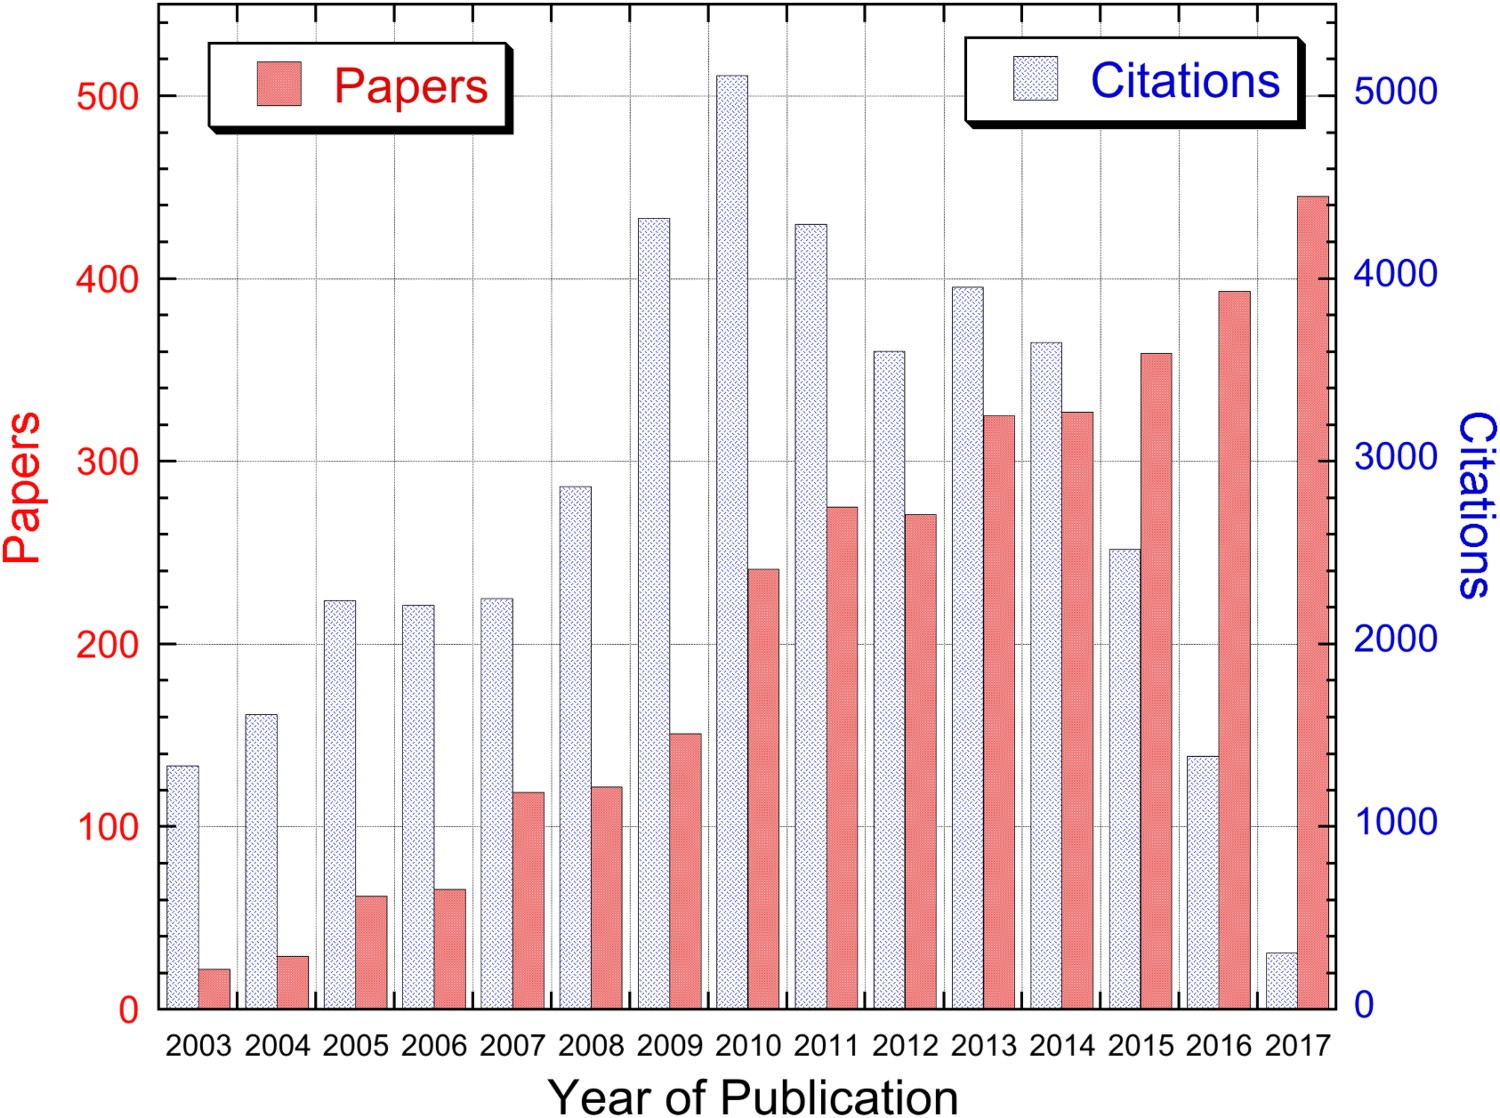
Nevertheless, understanding of the fundamentals of the process remains far from complete. It originated from anodisation, in which the work-piece is placed in an electrolytic bath and a voltage (∼10–80 V) is applied between it and an inert cathode. With certain metals, notably Al, Mg and Ti, an oxide film forms on the surface, often having a highly porous, fine columnar morphology (although other structures are possible [1,2]) and a fine-grained, and sometimes at least partially amorphous, atomic structure. The main features of anodising have been known for some time, with recent interest in the potential for its use to produce tailored nano-scale microstructures. Reviews and recent updates are available [3–6] covering the details of the process, including the variant of ‘hard-anodising’ [7,8] (in highly acidic electrolytes, sometimes with pulsing of the current).
In PEO processing (sometimes termed Micro-Arc Oxidation), higher voltages are employed (∼250–750 V), usually in conjunction with an AC electrical supply, such that repeated dielectric breakdown occurs through the thickness of the growing oxide layer (during the anodic half-cycle), in the form of a large number of (micro)-discharges that are distributed over the surface of the work-piece. While the set-up and procedure appear nominally similar to anodisation, oxidation now takes place, not via continuous transport of ions through the electrolyte and within a thin oxide layer, but by a combination of metal and oxygen atoms or ions within the discharge plasma as it cools (the metal having entered the arc initially by evaporation from the substrate). This mechanism facilitates the production of thicker oxide layers and often results in a harder and more crystalline structure, mainly because discharges release large quantities of heat, tending to promote crystallisation in surrounding oxide material. In fact, PEO coatings do contain relatively high levels of porosity, with a complex architecture, but they tend to be more wear-resistant than anodised coatings, and they can in general also be grown to a greater thickness. This is limited only by the maximum thickness through which stable discharges can be generated, although it is well established that the voltage necessary for this does not rise in line with the macroscopic coating thickness and it is now clear that the actual dielectric breakdown occurs across a relatively thin oxide layer at the base of a deep pore in the coating.
It is clear that the PEO process is considerably more complex than anodising, and indeed than virtually all other coating procedures. One reason for this is that a PEO coating is being continually reconstructed throughout its thickness by the discharge formation that occurs while it is growing. Also, there is considerable scope for controlling the electrical and chemical conditions so as to modify the coating microstructure (via changes in the discharge characteristics and in the way that the oxidation and subsequent coating creation is taking place). Most of the control of this type that has been exercised in industrial practice has been carried out on a largely empirical basis. However, recent advances in understanding of the inter-relationships between processing conditions, discharge characteristics and resultant coating microstructure have the potential for allowing more systematic control in the future. This review is focused on that objective, in the context of conventional PEO processing in aqueous electrolytes, although this first section largely presents fairly routine information that may be useful as background.
PEO (and, indeed, anodising) is mainly focused on aluminium and magnesium alloys, for which it works well. It can, however, be applied to several other metals and there has in particular been a lot of work with titanium and its alloys. This has been largely because there is considerable interest in (highly porous) TiO2 surfaces for certain types of application – mainly biomedical and photo-catalytic. In fact, it is difficult to produce thick (>∼10–20 µm) PEO coatings on Ti and they often contain relatively coarse pores. There are other metals, making a total of about 7 or 8 (often collectively known as the ‘valve metals’ – see Section ‘The “valve metals” and charge transfer during anodising and PEO’ for an explanation of this terminology), for which PEO processing is regarded as routinely viable. These include Zr alloys, which have important applications in the nuclear industry and have been examined systematically in terms of suitability for PEO processing [9–12]. All of the valve metals have, as might be expected, highly stable oxides. However, while it is evident that this is not the only relevant characteristic, there is little clarity in the literature about the specific set of properties that render a metal more or less suitable for PEO processing. The issue is addressed in some detail in the current review (Section ‘Factors affecting the ease of discharge formation’).
In addition to the features of a metallic element and its oxide(s) that affect the ease of PEO processing, there is interest in the role of alloying additions and the effect of the presence of second phase in alloy microstructures. In general, solute elements may become incorporated into the coating: (a) within the main oxide (i.e. it may become a mixed oxide), (b) as a separate oxide or (c) as some other kind of inclusion. Alternatively, these elements may end up in the electrolyte, either in solution or as solid suspensions. Some of these outcomes may have little or no effect on the progression of the PEO process, but others may start to cause problems in the form of an accumulation of species that inhibits the process in some way. For example, it is well established [13–15] that PEO of Al–Si (eutectic) alloys becomes inhibited after a while by accretion of the Si platelets, particularly in hyper-eutectic alloys [16]. On the other hand, metal matrix composites have been successfully PEO processed, with the ceramic reinforcement becoming incorporated in the coating. Examples include both magnesium [17] and aluminium [18] alloys containing SiC particulate.
It may be noted at this point that there is also the option, for metals unsuited to PEO processing (including steels and alloys of Ni, Cu, Sn, etc. – see Section ‘Thermodynamics of oxidation during PEO’), of first plating them with a layer of a metal (such as Al) that is suitable and then producing the PEO coating (possibly consuming all of the plated metal). This has been explored in some detail, mostly for Al layers on steels [19–22]. It is in principle a viable and attractive option, but in practice there are problems. One is that, while electroplating is the most convenient option for production of such layers, this is inherently difficult for the metals that are most suitable for PEO (although it can be done). The main problem, however, is that there is a tendency to leave a residual (incompletely oxidised) aluminium layer and/or a poorly bonded interface between substrate and coating. This is unfortunate, since one of the inherent attractions of PEO is normally that there is very good substrate-coating adhesion. Nevertheless, the concept of a prior plating process remains an interesting one, with scope for a number of variants to be explored.
Processing conditions
Electrical conditions
A wide range of electrical conditions can be employed during PEO processing. While DC operation is possible, it has been repeatedly found that the process runs more effectively and the coatings are of higher quality when AC power supplies are used. These can be sinusoidal voltage supplies at 50 or 60 Hz (commonly used in laboratory and small-scale industrial settings), although square waveforms and higher frequencies are being increasingly exploited in research and in commercial use. Furthermore, a range of different electrical engineering control conditions can be used. It is common to set the current level (in both anodic and cathodic parts of the cycle), with the voltage adjusting to whatever is required to deliver these. However, there are other options, involving control over the capacitance in the system or over the applied voltage. These conditions naturally affect the characteristics of the discharges, and hence of the coatings. Effects of this type are described at various points in Section ‘Discharge characteristics’, but this review does not encompass detailed consideration of exactly how the electrical power supply can be controlled during PEO processing. Information of this type is available in the literature [23–26].
Electrolyte composition and additives
There is considerable scope for influencing the nature of the discharges, and of the resultant coating, by selection of the composition of the electrolyte. Sometimes the details of the compositions used are regarded as commercially sensitive, but in general PEO electrolytes are alkaline, commonly containing species such as KOH and Na2SiO3, and with pH values typically ranging up to about 13. It is not always entirely clear why a high pH is usually optimal for PEO, particularly since anodising is often carried out in acidic electrolytes. Furthermore, it is possible to perform PEO in acidic electrolytes, particularly for Ti [27–30]. It is certainly worth noting that (in both cases) the main mechanism of transport of oxygen towards the metal involves the movement of OH− ions through the electrolyte, under the influence of an electric field. During anodising, however, there is just steady flow of ions along stable electrolyte channels, whereas in PEO the process is much more dynamic and transient. The electrolyte conductivity is also significant, since it affects current flow [31] and voltage drops across columns of electrolyte in pores within the coating, and can thus have an influence on the ignition of discharge plasmas [32,33]. This is examined in a little more detail in Section ‘Electrolyte composition’. Conductivity values are commonly in the range 5–100 mS cm−1.
It should be recognised, however, that a huge range of electrolyte compositions is in use, and that the potential influence extends beyond effects related to pH and conductivity. In particular, species in the electrolyte are likely to enter the discharge plasma, where they may influence the reactions that take place, and hence the nature of the substrate oxidation. It is also possible that species in the electrolyte could become incorporated into the coating via the plasma. This can be done, for example, to control the colour of the coating – see Section ‘Thermal and optical properties’. Many other effects have also been reported [28,34–38] concerning coating characteristics being influenced by additions to the electrolyte, although in the vast majority of cases these are simply empirical observations. It has also been noted [39] that ‘aging’ of electrolytes can influence the PEO process. This is, however, unsurprising, since there is considerable scope both for chemical changes to take place over time in unused electrolyte and, during use, for species from the substrate to enter the electrolyte in some form, with potential for contamination effects. It is common practice to use freshly prepared electrolytes where practicable, although clearly this can be difficult in an industrial environment.
Finally, it may be noted that there have been various attempts to incorporate additions such as fine particulate into PEO coatings, by adding them to the electrolyte. A review is available [40] concerning this type of measure. Depending on a number of factors (chemical, physical and electrical), particles may simply become physically entrapped in the coating as it grows or may undergo reactive incorporation. Some success has been reported [41–46] for such measures, although there will commonly be a danger that such dispersions are damaged or removed during the restructuring associated with repeated discharge formation. Nevertheless, it is clear that even very fine particulate can in some cases be successfully introduced into PEO coatings in this way. An example is provided in Section ‘Photo-catalytic usage of Ti-based PEO coatings’.
Basic features of PEO discharges
Spectral analysis of PEO plasmas
There has been extensive study of the nature of the plasma created within PEO discharges, although their highly transient nature has made this a fairly complex undertaking. Plasma temperatures have been estimated [47–52] via optical spectroscopy to range from about 4000 to 12,000 K, with some indications of a higher temperature core and a lower temperature surrounding region. Corresponding electron densities typically range from ∼1015 to 1018 cm−3.
It is also clear that PEO plasmas commonly contain many species, originating from the substrate, the existing coating and the electrolyte [50,53–56]. Of course, detailed results concerning the species present in the plasma, and their concentrations, depend on the compositions of substrate and electrolyte, and also on electrical conditions affecting the creation and nature of the plasma. It is certainly clear that relatively high concentrations of the substrate metal tend to be created in the plasma and it seems evident that the main oxide of the coating is formed in the plasma as it cools. This then condenses to a liquid, which becomes rapidly redistributed within the structure of the coating – see Section ‘Redistribution of oxide after plasma collapse’.
‘Micro-discharge’ characteristics
Typical discharges are now known [50,57–61] to occur in prolonged sequences (‘cascades’) at particular locations, and to have lifetimes of the order of a few tens to a few hundreds of microseconds, with ‘incubation’ periods between them of around a few hundred µs to a ms or two. The lifetime of a cascade can apparently be very long (perhaps of the order of a second or more [62]), although in practice during AC processing the discharges normally form only during the anodic part of the cycle, when the voltage is above a certain level, which limits the duration of a continuous sequence to something less than the half-cycle period – i.e. to several ms for a 50 Hz supply.
Discharge currents are typically several tens of mA, discharge energies a few mJ and diameters of core discharge channels a few tens of µm. Some correlations have been established [24,63–65] between external conditions, discharge characteristics and features of resultant coatings, including the coating growth rate, and progress has also been made [60,61,66] on correlating the energetics of individual discharges with that of the process as a whole (with the ultimate aim of reducing the – often relatively high – rate of energy consumption). Of course, the above figures are very approximate and the parameter values concerned are far from uniform during a given treatment and can also be quite sensitive to the processing conditions. Furthermore, the factors that control these parameters are not fully understood. Nevertheless, there have been important advances in understanding over the past decade or so and details of these are summarised later in this review.
Coating microstructure
Redistribution of oxide after plasma collapse
It is clear that at least most of the new oxide created during each discharge is formed within the plasma as it cools and collapses. This condenses as liquid, which is then injected into surrounding cavities under high local pressures, with some reaching the free surface, where it tends to erupt into ‘volcanic craters’, before solidification finally occurs. These features, examples of which are shown [67] in Figure 2, are characteristic of PEO coatings, although their size and distribution can vary substantially (typically becoming larger and more dispersed as the coating thickness increases). It is certainly evident from the appearance of these features that they are the result of liquid flow. Some authors have in the past suggested that the flow was initially of liquid metal, which subsequently oxidised, but in fact it is now clear that it was already an oxide when it was flowing. Evidence for this includes the point that oxidation of metal would certainly change its appearance, so that it would no longer look like a ‘frozen’ liquid, and the fact that residual metal is never detected within a PEO coating. In any event, now that the sequence of events during PEO is better understood (see below), it is clear that the oxidation takes place before the structure of the coating has become established (during the cycle of individual discharges). SEM micrographs [67] of typical free surfaces of PEO coatings (on Al), for coating thicknesses of (a) 5 µm and (b) 60 µm.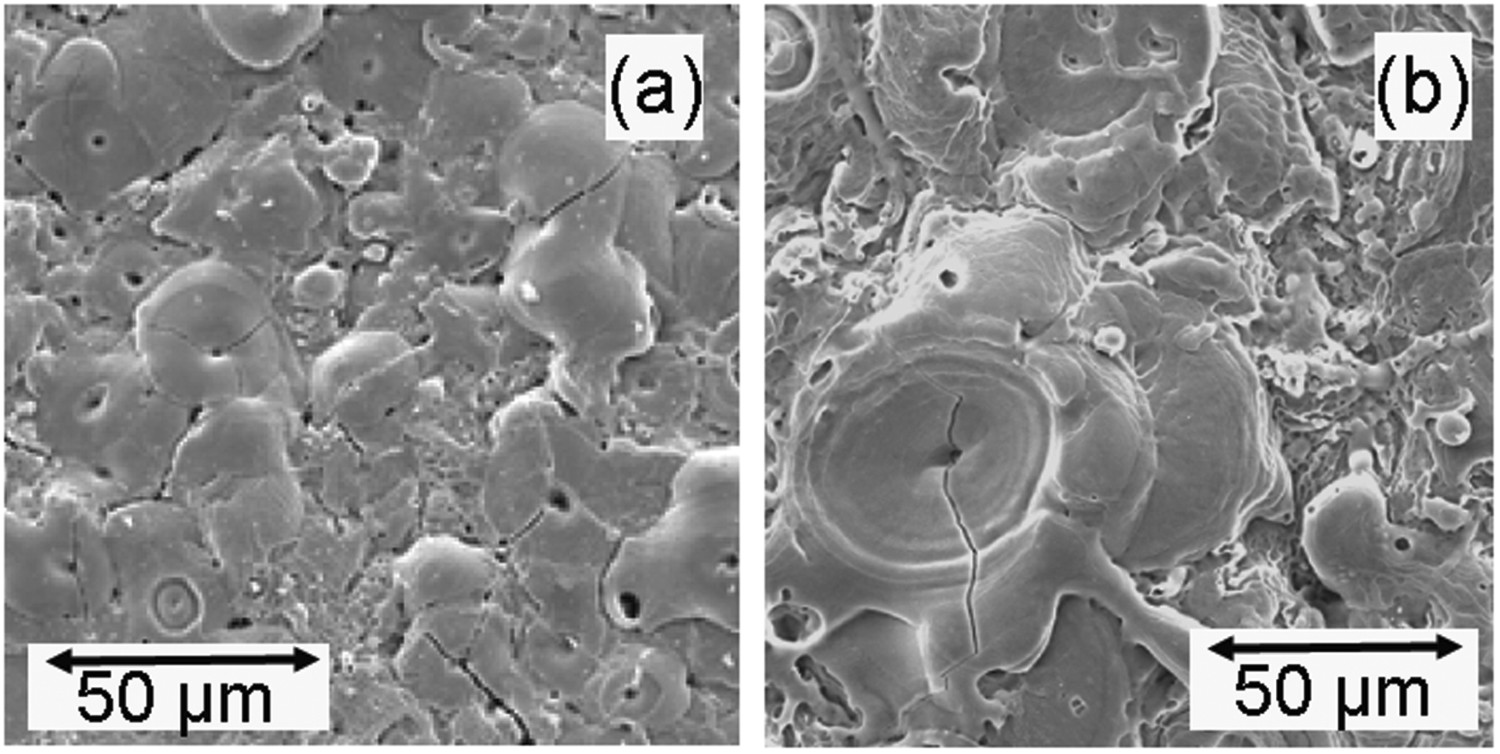
The microstructure of PEO coatings tends to be relatively complex. Local regions will have undergone very rapid solidification (quenched by the electrolyte after the most recent discharges), although regions in the immediate vicinity of those discharges may have effectively been heat treated (raised to fairly high temperature and then allowed to cool). In general, however, several features are observed that are characteristic of rapid solidification. These include a very fine grain structure (possibly close to, or actually, amorphous) and the presence of metastable phases. For Al, γ, η and ε, phases are sometimes present (although they are not easy to differentiate in XRD spectra), in addition to the stable α phase [68–70], while Ti PEO usually contains both anatase and rutile [71,72]. In both cases, amorphous material is often also present. Processing of the most common Ti alloy (Ti–6Al–4V) can generate [73,74] significant quantities of the mixed oxide Al2O3·TiO2 (aluminium titanate). It is perhaps worth noting at this point that, in general, it is difficult to heat treat PEO coatings so as to modify these structures, since the range of temperature needed to effect significant change for such oxides would commonly be above, or at least close to, the melting temperature of the metallic substrate.
Porosity
Most PEO coatings are quite highly porous, with typical overall levels usually ∼10–20% for all substrates, having a complex architecture and covering a wide range of scales [75–77]. Almost all of the porosity is normally surface-connected. The reasons for the level and nature of this porosity are now clear, and are related to the way that the discharges form – see Section ‘Discharge cascades and microstructural development’. Nevertheless, there are ongoing efforts to reduce these levels, or at least to make the porosity finer and more uniform [35,78,79]. Of course, it is true that coarse pores are likely to be deleterious. However, it should be appreciated that, on balance, the presence of the porosity in a PEO coating is beneficial in many cases. This is clear in the case of applications where a large specific surface area is required, such as for many biomedical and photo-catalytic purposes – see Sections ‘Biomedical usage of PEO coatings’ and ‘Photo-catalytic usage of Ti-based PEO coatings’. Furthermore, PEO treatment is quite commonly employed in order to create a good keying surface for further surface treatment, such as painting. This is particularly the case for aluminium alloys and a recent review covers the issues in this area [80].
Slightly less obvious, but very important, are the mechanical stability benefits that arise from the effects of porosity (including microcracks) in a PEO coating in reducing its stiffness. This reduction is considerable, a typical change in Young’s modulus compared with fully dense material being from ∼400 GPa to something of the order of 30–50 GPa in the case of PEO alumina [67,81]. This reduction strongly enhances the strain tolerance of the coating – for example, it reduces the stresses that arise if the component becomes deformed and also those due to differential thermal contraction with the substrate during thermal cycling. It may be noted at this point that it is the global stiffness of the coating that determines the macroscopic stresses generated in this way: the local stiffness, as obtained, for example, by nanoindentation, will be much higher and might, depending on the indent size and the nearby distribution of pores, be close to the fully dense value.
Duplex, composite and graded PEO structures
Considerable effort has been devoted to the creation of PEO coatings with some kind of composite or graded structure. Clearly, there is scope for the creation of benefits. At a simple level, sealing of the surface in some way – for example, by the introduction of water glass via a sol–gel route – may lead to improved resistance to the entry of corrosive fluids (while retaining the mechanical benefits of interior porosity outlined in Section ‘Phase constitution and grain structure’). Unfortunately, it is not easy to produce durable surface seals via a post-treatment of this type and there has been an extensive investigation into approaches to controlling the PEO process so as to create graded, duplex or hybrid structures within the coating. These have included gradients of phase constitution [82,83], incorporation of polymeric layers [84] and various kinds of composite coatings [85,86], as well as macroscopic structures such as metal-cored ceramic fibre networks [87]. In general, while these are all interesting possibilities, none have so far entered into mainstream usage.
Mechanical properties
Tribological characteristics
PEO coatings are attractive for many applications requiring resistance to sliding or abrasive wear. One reason for this is that they are highly resistant to spallation (partly because they adhere strongly to the substrate and partly because of their relatively low stiffness – see Section ‘Phase constitution and grain structure’), so that the driving forces (strain energy release rates) for spallation tend to be low. Also important is the fact that, despite this low stiffness, they tend to be relatively hard – usually harder, for example, that anodised coatings, which often have a rather friable, columnar structure and contain a lot of amorphous material.
There has been a lot of work on optimisation of the wear resistance of PEO coatings [88–95], focusing on many different control variables, although the majority of such studies present empirical outcomes, rather than identifying the key microstructural features and the mechanisms by which they are being manipulated. Of course, wear is a complex phenomenon, and PEO is a complex process, so this is unsurprising.
Resistance to fatigue loading
In many cases, resistance to fatigue loading is dominated by the nucleation of cracks and the very early stages of crack growth. This usually occurs at the surface, so there is always interest in whether surface treatments or coatings are likely to enhance or impair the resistance to this type of damage development. Of course, corrosion may interact with mechanical fatigue processes. There has not been a huge amount of work in this area for PEO coatings, but concerns are often expressed about possible impairment of fatigue resistance. A possible mechanism for this is the removal (during PEO processing) of a surface layer of the metal that initially contained residual (compressive) stress – for example, from a shot peening operation. There are residual stresses in PEO coatings (see Section ‘Residual stress levels’), and they are usually compressive, but they are relatively low (as would be expected of a porous layer that is being continually reconstructed), so this loss of compressive stresses in the original surface layer of the metal could cause degradation. Of course, this relates to fatigue testing without a pre-crack – i.e. it concerns the initiation of cracks, rather than their propagation. This is of direct industrial relevance and of course a coating is not expected to influence fatigue crack propagation in the bulk.
There are certainly reports [96–100] of significant impairment of fatigue life, for both Al and Mg alloys. There have been very few indications of any improvement, although it has been reported [101] that no change occurs with the Ti–6Al–4V alloy. It is thus certainly an area of concern. Possible explanations are not always forthcoming, but they usually focus either on residual stresses or on factors such as cracking in the coating, a roughened interface, or one where corrosion has occurred. It is certainly true that there can often be residual electrolyte left in a PEO coating. If this is not thoroughly flushed out with water (subsequently evaporated), then residues could be left that promote corrosion (particularly in moist atmospheres). Of course, such effects will be highly specific to the chemistry of the electrolyte and the corrosion conditions. The whole area of the fatigue resistance of samples with PEO coatings is one requiring further work.
Residual stress levels
An interesting point about PEO processing is that, since the coating is being continuously restructured by the discharges, it would be expected that any residual stresses created during the oxidation would tend to become repeatedly relaxed during this reconstruction. The relatively low stiffness of PEO coatings (Section ‘Phase constitution and grain structure’) will also tend to inhibit the generation of high stresses. Estimates based on information such as the volume change during oxidation (Pilling–Bedworth ratio), using handbook stiffness data, are therefore unlikely to be reliable.
In fact, there have been several reports [102–106] of high measured residual stress levels (>∼400 MPa) in PEO coatings, although there are also very wide variations in the results. However, these were all obtained using measured shifts of X-ray diffraction peaks. This is not an easy technique to apply to PEO structures, which tend to have very fine grains, several different phases present and the potential for significant variations in composition. A macroscopic, global technique is likely to be preferable and indeed it has been shown via curvature measurements [81] that typical (compressive) stress levels in PEO coatings are around 50 MPa for Al and 150 MPa in Mg. Of course, all techniques for measurement of residual stresses are subject to some error, and the complex nature of PEO coatings tends to make these errors larger than in many other systems. Nevertheless, the broad experience is certainly that PEO coatings are strongly resistant to spallation and this is consistent with residual stress levels in them being low. Improved measurement and understanding of residual stresses in these coatings is an objective that merits further attention.
Environmental performance
Corrosion resistance
PEO coatings are commonly employed for the corrosion protection that they offer and there are many reports [45,107–109] of considerable enhancement. This is particularly true for Mg alloys [110–114], which are often very vulnerable to corrosive degradation without surface treatment. PEO coatings tend to adhere strongly, which is not the case for all coatings, perhaps particularly for an ‘active’ surface such as Mg. There are many examples of improved corrosion resistance being obtained via tailoring of electrolyte composition, so as to incorporate particular species in the coating, although such scenarios tend to be specific to the corrosive environment. Of course, it may also be beneficial to ensure that fluids cannot readily penetrate into the coating and various kinds of surface sealing operation are routinely employed.
Thermal and optical properties
There is considerable interest in controlling PEO so as to obtain modified thermal and optical properties. In particular, while materials like alumina are excellent thermal conductors as fully dense single crystals, the PEO structure (with very fine grains and extensive porosity) tends to confer a low conductivity (of the order of 1 W m−1 K−1). Since they can be quite thick (up to hundreds of microns in some cases), they therefore have potential as thermal barriers [115–117]. There have also been studies [118] of the thermal shock resistance of PEO coatings.
The optical properties that are most commonly of interest are those relating to absorption in the visible part of the spectrum, mainly since they determine the colour. It is well known that the PEO process is well suited to tailoring of conditions so as to control the colour of the coating. There are reports of conditions that generate colours of yellow [119], green [120], grey [121], red [122], blue [123] and black [124–126], among many others. There has also been work [127] on the reflection characteristics of PEO coatings in the IR part of the spectrum.
Functional characteristics
Extensive investigations have been carried out into the potential of PEO for generation of coatings with functional applications. The basis for much of this work has been exploitation of the high specific surface area of PEO coatings (due to their high porosity levels), primarily for Ti-based coatings. This is mainly because TiO2 is known to be both highly bio-compatible (for bone ingrowth) and an effective photo-catalyst.
Biomedical usage of PEO coatings
Titanium is known to be a highly bio-compatible material, which means, of course, that it is titania that is biologically benign, since all titanium metal has a native oxide on the surface (normally one of the forms of TiO2). In particular, bone cells have a high affinity with titania, and tend to grow into porous regions of it – or at least to adhere well to them and proliferate effectively on them. This is, of course, relevant to the production of strong bonding between (Ti alloy) implants and surrounding bone tissue. The idea that raising the specific surface area of the TiO2 is likely to allow stronger bonding to the bone, by promoting a (porous) PEO layer on the surface, was first proposed some time ago. Moreover, the fact that some of the pores in PEO Ti are relatively coarse is actually beneficial in this situation, since bone cells have dimensions of the order of tens of microns and tend not to respond so well to very fine (sub-micron) porosity.
It has been shown in a number of studies [128–132] that these effects are significant, and that PEO surfaces do offer some promise in terms of biocompatibility. There are, of course, other options and alternative treatments, such as plasma spraying of hydroxyapatite onto Ti implants or surface patterning using mechanical or thermal methods, are currently more common in commercial practice.
There is also strong interest in Mg as a biomedical material [133]. Magnesium ions are in fact necessary for many biological processes in living cells, so that, in general, corrosion products are not inherently harmful. Additionally, the mechanical properties (particularly the density and Young’s modulus) of Mg alloys are a closer match to bone than Ti alloys. However, corrosion of Mg alloys can be very fast, generating excessive hydrogen and causing harmful local changes in pH. PEO coatings can be used to improve corrosion resistance, and can enhance biocompatibility by incorporating calcium and phosphorus from the electrolyte [134–138].
Photo-catalytic usage of Ti-based PEO coatings
Titania is known to be a very effective photo-catalyst – i.e. a surface on which oxidation of various organic pollutants and pathogens can take place readily under the action of suitable radiation [139]. It is common to use UV radiation, but certain measures, such as the introduction of Ag nanoparticles into the surface [140], allow longer wavelength (visible) radiation to be effective, raising the possibility of using sunlight as the radiation source. As with bioactivity, this has been known for a long time and the possibility of a Ti PEO surface being attractive (in view of its high specific surface area, and its potential for the creation of robust membrane structures) was proposed some time ago. There have been many investigations [141–147], with the potential now well established. Among relevant features is that the anatase phase is more effective than rutile [148] and there have been studies [149] in which efforts have been made to raise the anatase content of PEO coatings, with this effect in mind.
As with bio-compatible coatings, there are alternative ways of creating suitable surfaces and the PEO process is not yet in extensive commercial use for this purpose, although this may happen in due course. The objective of a high specific surface area is particularly important, although a pore architecture is required that facilitates fluid flow giving extensive exposure to the catalytic surface. For a membrane, this requires it to have a high permeability, which in turn is difficult to create if the pore structure is very fine. Furthermore, this must be combined with good penetration of the radiation to these surfaces. Such a combination is most easily achieved with a fine suspension of (TiO2) nanoparticles in the fluid (commonly water), and indeed much research has been based on this approach. Unfortunately, it leaves the serious problem of how to remove this suspension after the treatment. Incorporation of a large number of such nanoparticles into the (relatively open) structure of a PEO coating is thus an attractive concept and it can be seen from Figure 3 that such material can be created. SEM micrograph (secondary electron image) of the free surface of a PEO coating produced on a Ti substrate, using a square-wave 50 Hz supply, anodic and cathodic voltages of 600 and 250 V and an electrolyte of 0.04 M sodium phosphate. The recess left of centre in this micrograph contains TiO2 (anatase) nanoparticles, about 50–100 nm in diameter, which originated as a suspension in the electrolyte. (Image courtesy of Dr Mike Coto, of Keronite International and the Materials Science Department in Cambridge University.)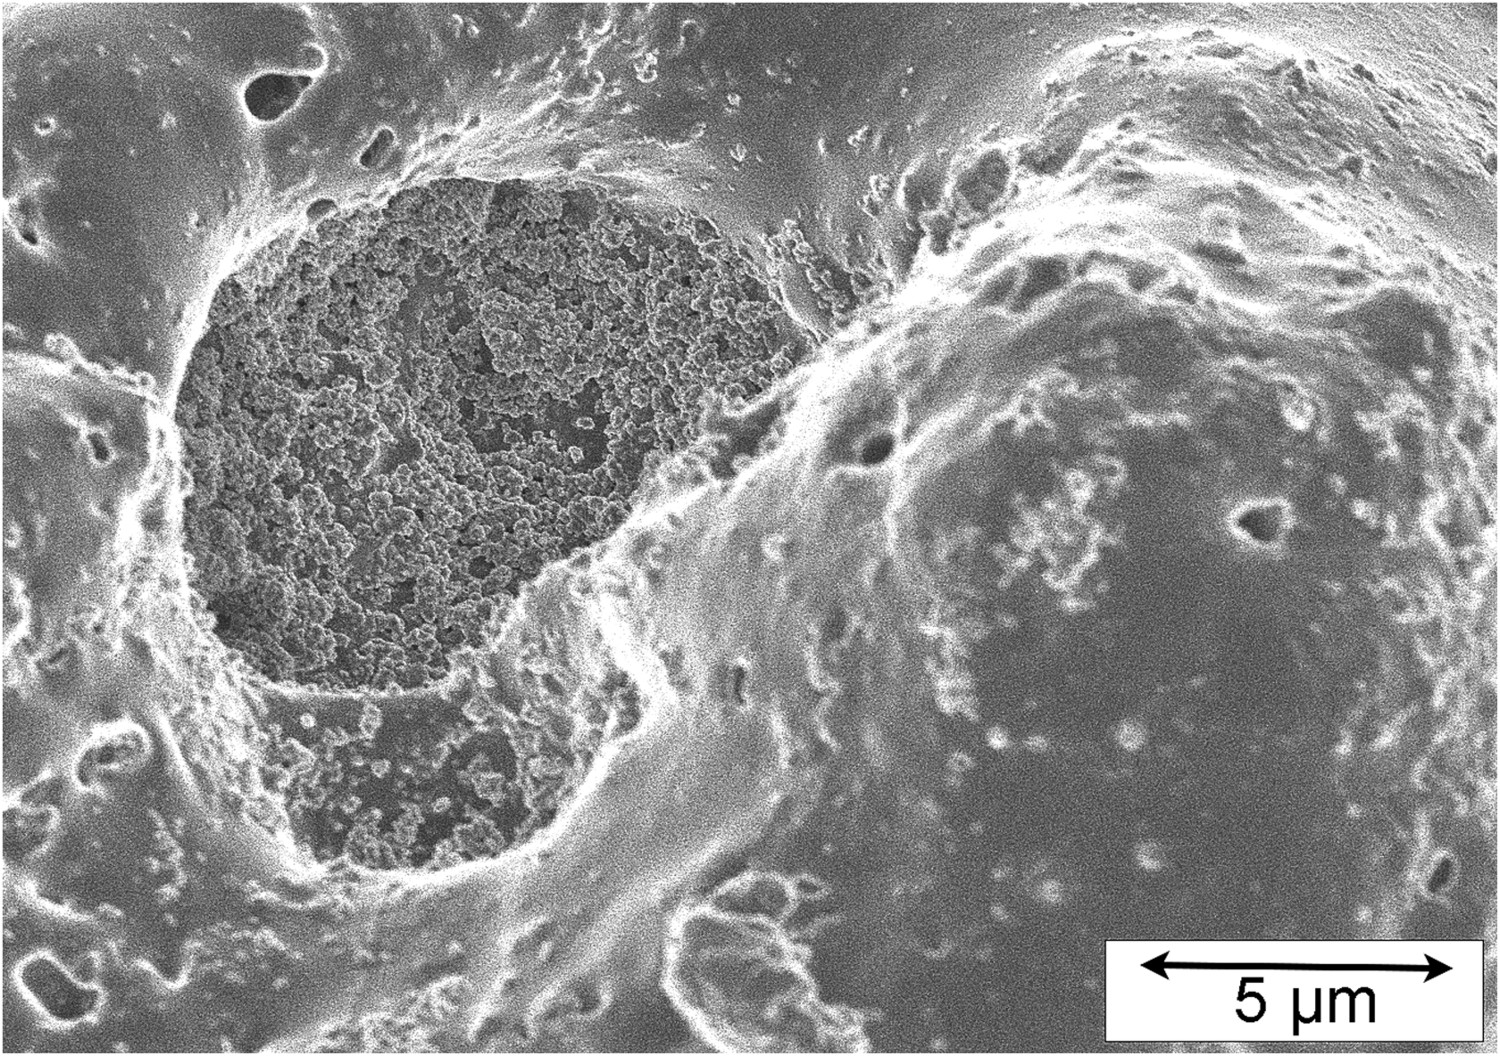
Thermodynamics of oxidation during PEO
Clearly, the magnitude of the free energy change associated with a metal being converted to its oxide is relevant to PEO. This change is negative at ambient temperature for all metals (except gold), so oxidation is energetically favourable (at least at temperatures such that the metal is solid or liquid) in virtually all cases. However, as the plasma created during PEO collapses and cools, there may be competing oxidation reactions 1 for which the driving force is higher. In particular, the plasma is likely to contain hydrogen, so oxidation of metal ions (present as a result of volatilisation from the substrate) is only expected to take place to a significant extent if it is energetically more favoured than oxidation of hydrogen to form water.
Information of this type is provided by the Ellingham diagram for oxidation [150,151]. Some such data are shown in Figure 4, covering most of the metals of potential interest for PEO (excluding rare metals and others of limited interest, such as those that react strongly with water and very high atomic number elements). This graph actually shows only the enthalpy change (i.e. the free energy change at 0 K) associated with oxidation (per mole of oxygen). However, this is sufficient for (approximate) ranking purposes, since the rate of decrease of the magnitude of this energy change with increasing temperature is similar in most cases (reflecting the fact that much the same change in entropy occurs in each case, mainly due to a reduction in the number of moles of gas as the oxygen is consumed). It can be seen that, for metals with low energy changes (Cu, Ni, Fe, Sn, Mo and W), the driving force for oxidation is similar to, or lower than, that of hydrogen being converted to water. These metals are therefore unlikely to oxidise as a PEO plasma collapses and cools, particularly since the hydrogen concentration there is likely to be relatively high. It is worth noting at this point that there are thus some very common types of metal (copper alloys, steels and Ni-based superalloys) that are expected to be unsuitable for PEO processing. In general, this is also what is found experimentally. There have been reports [152,153] of successful PEO processing to produce coatings on steels, but in such cases, it is probable that much of the oxide formation took place via deposition from the electrolyte, leading to friable and poorly bonded coatings. There is then a second group of metals (including Cr, Nb, Ta and V) for which the oxidation energy is higher than that for hydrogen, although not dramatically so. Finally, there is a third group (including Ti, Al, Mg, Be, Hf, Zr, Y and Sc) with very high values, such that there will clearly be a very strong thermodynamic driving force for oxidation.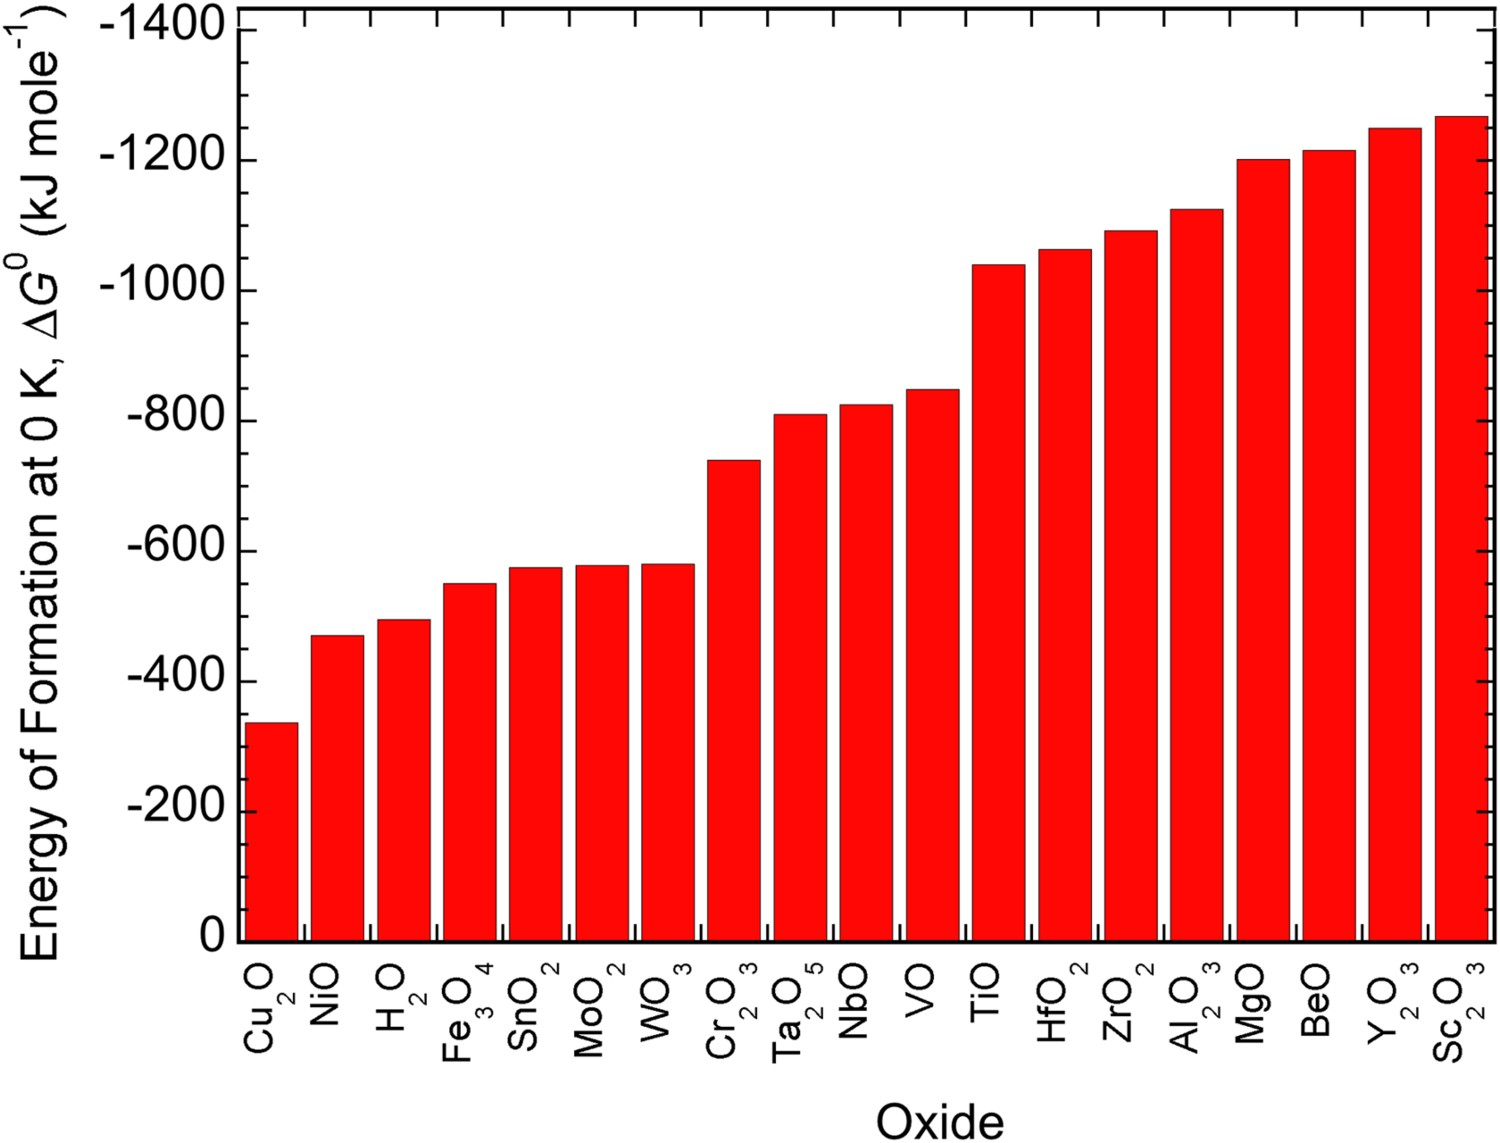
Of course, this is a crude classification, and it must be borne in mind that the active oxidising agent in a PEO plasma as it cools is unlikely to be molecular oxygen, plus of course the temperature at which oxidation takes place is unknown (but will be relatively high) and the concentration of metal ions in it is also unknown (but will be relatively low). Data for the free energy changes under these conditions are simply not available. It should also be emphasised again that oxidation is not favoured for any metal at the temperatures typical of these plasmas [154] and it is only towards the end of their collapse and cooling that combination with oxygen can occur. Nevertheless, it is relevant to observe that this last group contains the three metals (Al, Mg and Ti) that are most commonly (and successfully) subjected to PEO treatment. It might be noted that there is a common perception that Ti is not as easy to PEO process as the other two. Also, the oxide formed is invariably TiO2, despite the fact that, according to the thermodynamic data, TiO is more stable (although there is some uncertainty about this issue, and more than one phase [155] with the approximate stoichiometry of TiO). Of the others in this group, there have been several reports [156–158] that Zr can be PEO processed. There appear to be no reports about PEO of Hf, Sc or Y, and very few [159] concerning Be, although it is sometimes included [160] in listings of metals that are suitable. (Of course, Be must be processed under highly controlled conditions, in view of toxicity problems.)
As mentioned above, it is fairly clear that metals such as Ni, Fe, Cu, Sn, Mo and W cannot normally be processed by PEO. Of course, it may be possible with heavily alloyed versions, such as NiTi shape memory alloy [161]. Also, the PEO conditions may have an influence and it has been shown [54] that Mo can be processed in an electrolyte of borax, water and ethylene glycol. (As mentioned in Section ‘Introduction’, this review is focused primarily on conventional PEO processing in aqueous electrolytes.) However, the metals put here into the central group (Cr, Nb, Ta and V) are of interest. Information about PEO of them is limited, although there have been reports of successful processing for both Nb [162–167] and Ta [29,168]. (Some further information about PEO of Ta is provided in Section ‘PEO discharge characteristics for various metals’.) In any event, it is clear that, from a thermodynamic point of view, growth of the oxides of these metals should be possible, perhaps depending on their concentration, and that of hydrogen, in the plasma. This is certainly true for Ti, despite the fact that, as noted above, the perception is that, in practice, it is less suitable than Al and Mg. It therefore seems clear that there must be other factors affecting the ease of PEO processing.
It is sometimes stated that PEO processing (and anodising) is applicable only to the ‘valve metals’ [169]. This terminology is not very well defined, but the concept is usually taken to mean that electrical current can only flow in one direction in the metal–oxide–electrolyte system [170]. The understanding is that electrons can flow through the oxide layer only when the metal is cathodic (i.e. in the direction metal to electrolyte). In the anodic half of the cycle, it is assumed that electrons cannot flow through the oxide, so the field across it builds up as the applied voltage is raised, and it may reach the breakdown level (dielectric strength) for the oxide, at which point a discharge occurs. This rectification effect is presumed to arise at the metal/oxide junction, across which electron flow can occur only from metal to oxide.
In fact, while there is a measure of agreement about the set that constitutes the valve metals – a list such as Al, Mg, Ti, Ta, Nb, Zr and Be is commonly quoted, it is quite certain that these could not have been identified from a knowledge of the rectification characteristics of the metal/metal oxide junctions concerned. Of course, depending on their band gap (see Section ‘The band gap of the oxide’), many oxides can be regarded as semiconductors and such rectification (Schottky barriers) is exploited in various devices containing metal–semiconductor junctions. The sense of the rectification (i.e. whether electron flow can take place in the metal-to-semiconductor direction or in the reverse direction) is determined by the relative positions of the Fermi levels in the two constituents (and hence by the nature and level of the doping in the semiconductor). However, this approach evidently cannot be used to identify (or rationalise) the set of valve metals. Actually, most of the valve metal oxides have large band gaps (see Section ‘The band gap of the oxide’) and so cannot really be treated as semiconductors – and certainly not as (deliberately) doped semiconductors. This (increasingly outdated) approach to classifying metals as being suitable for PEO (or for anodising) is clearly flawed, although it does still get quoted on occasion.
On the other hand, there is certainly asymmetry, in the sense that PEO discharges usually (but not invariably – see Section ‘Cathodic discharges and the effect of supply frequency’) occur only during the anodic part of the cycle, and also that conventional anodising (oxidation) takes place only when the metal is made the anode. However, a more plausible explanation for this is that it arises because of asymmetry in what is taking place within the electrolyte with the two different polarities (and thus has at least some sensitivity to the electrolyte composition). This is illustrated in Figure 5, which gives a schematic depiction of the key steps during both anodising
2
and PEO (both polarities). For anodising, oxidation is expected to take place only when the metal is the anode, since OH− ions will then reach it (through the electrolyte) and this is a source of the necessary oxygen. In fact, it is possible for anodisation to be carried out in acidic electrolytes (low OH− concentration) and there may in such cases be some breakdown of water molecules to release more oxygen. It is, of course, possible to predict the potential at which this will occur, for a given pH. Schematic depictions of the transport phenomena taking place during (a) anodising, (b) PEO with anodic polarity and (c) PEO with cathodic polarity.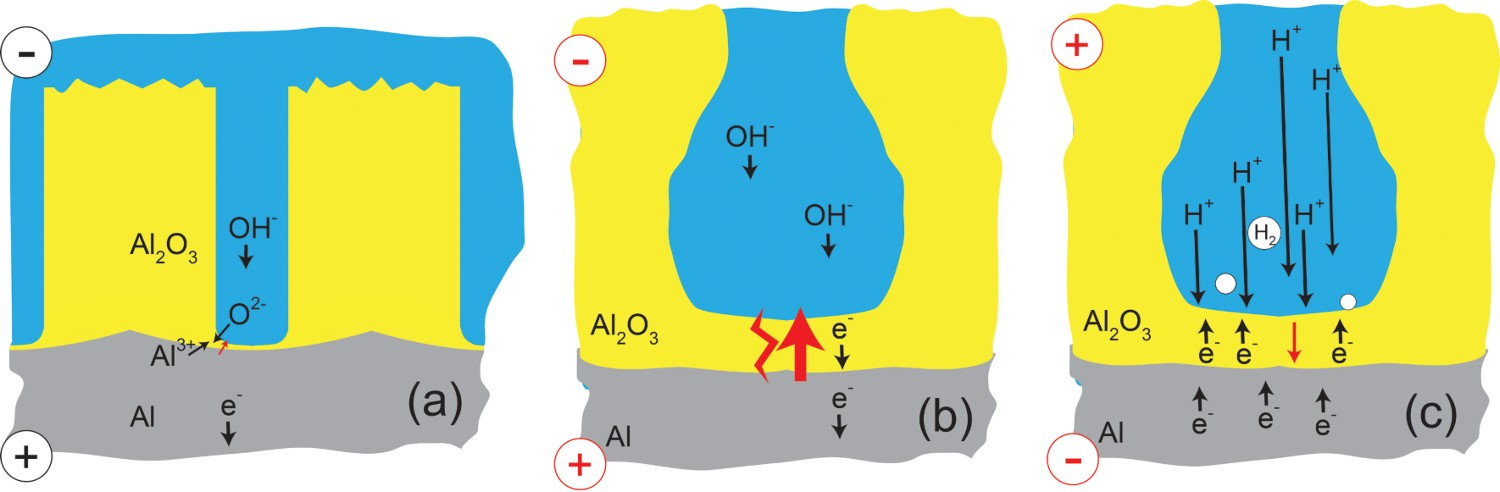
During PEO, on the other hand, oxidation of the metal takes place as the plasma collapses and cools, so the key issue is whether the electric field across the residual oxide layer reaches the level necessary for dielectric breakdown. It seems likely that the important point here is that, with anodic polarisation, the flow of electrons through the oxide is limited by the relatively slow rate of arrival of the OH− ions, which are moving through the electrolyte under the influence of the applied potential. This relatively slow rate of charge flow through the residual oxide layer ensures that the field across it reaches a level sufficient for discharge formation. Under cathodic polarity (Figure 5(c)), on the other hand, H+ ions are attracted towards the oxide layer. These are much smaller and significantly more mobile than the OH− ions, allowing a greater rate of flow of electrons through the oxide layer, with hydrogen gas being released at its top surface. (In fact, the structure and dynamics of H+ and OH− ions in aqueous solutions are quite complicated, with various complexes being formed [171], but nevertheless the outcome is understood to be that H+ ions do move significantly more quickly under the influence of an electric field.)
Quantification of ionic motion in the electrolyte may be instructive and work on this is now starting [172]. This easier current flow in the cathodic half-cycle may limit the magnitude of the field across the oxide layer, reducing the likelihood of dielectric breakdown. It can be noted at this point that a sensitivity might be expected to the rate at which hydrogen ions combine to form molecules on the oxide surface: there are certainly variations in this catalytic efficiency between different surfaces (so that hydrogen evolution is said to be more or less strongly ‘polarised’ on different electrodes). This issue is addressed in Section ‘Gas evolution’.
The oxides of most of the so-called valve metals have large band gaps. Broadly speaking, such band gaps (i.e. highly insulating oxides) might be expected to be associated with the oxide structure being highly stable thermodynamically, although there is not really a clear mechanistic link. Nevertheless, there is in practice a correlation, evident from the data [173] plotted in Figure 6, although it can be seen that it is not a close or well-defined one. (For example, the thermodynamic driving force for oxidation of Ti is similar to those of Al and Mg, but its oxide has a band gap with less than half the magnitude of those oxides.) Plot of the free energy of formation of selected oxides against their band gap [173].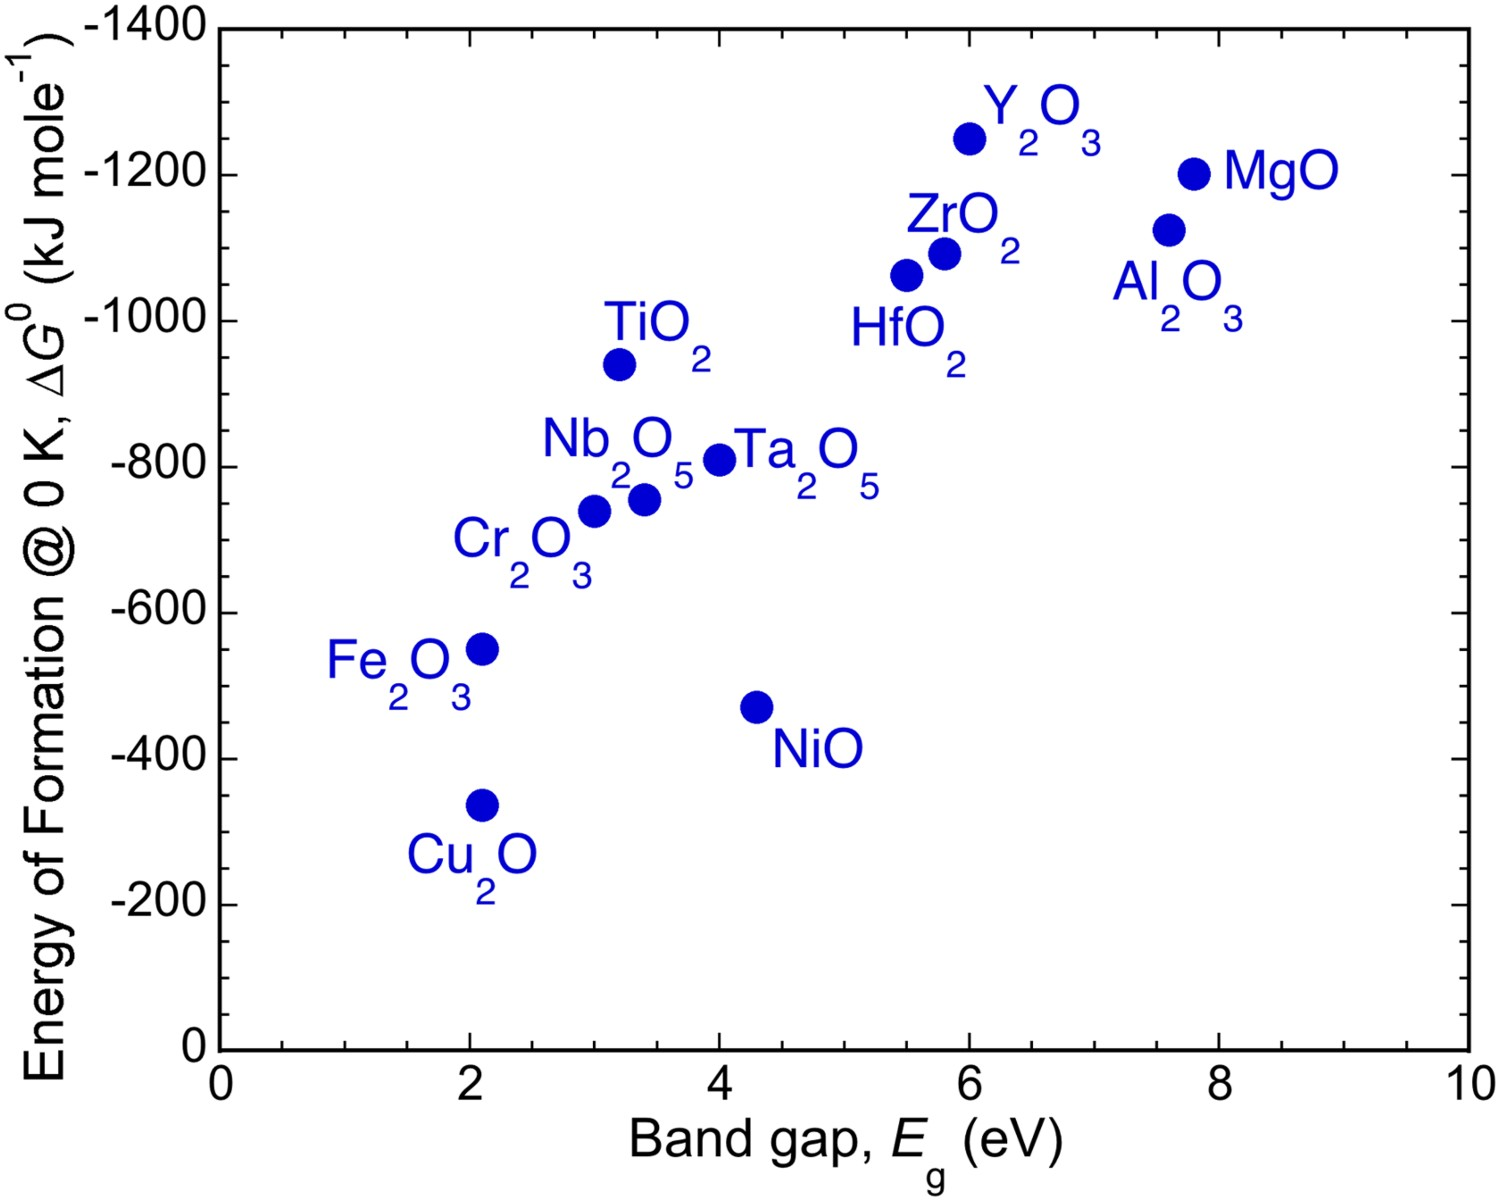
It is important to be clear about the relevance of the band gap to PEO processing. One issue is whether, treating the oxide as a semiconductor, it can acquire a relatively high electrical conductivity, either through doping or via thermal excitation of electrons across the band gap. In fact, the latter possibility can largely be ignored, since these layers remain cool (in contact with the electrolyte) up to the point of dielectric breakdown (and their band gaps are all very high compared with thermal energies). Extrinsic (doped) semiconducting behavior can also be largely neglected, since any such doping would be accidental and variable.
However, the issue of whether and how electrons can move through the oxide, and the relationship between this and the onset of dielectric breakdown, clearly is important for PEO and the band gap is significant in this respect. One possible mode of passage is electron tunnelling [174]. This is essentially a quantum effect and it is usually taken to be possible only through very thin layers – perhaps a few nm. It allows electrical contact to be established readily between nominally bare metal wires, even though they do in fact have (thin) surface oxide layers in the vast majority of cases.
The oxide layer thickness is clearly important and, while PEO coatings are often very thick (tens or hundreds of µm), it is now well established that residual oxide layers on the substrate remain much thinner throughout the process. This happens because PEO coatings are quite highly porous, particularly in the vicinity of an active discharge site, with the pores almost certainly being full of electrolyte before a discharge occurs – this is depicted in Figure 5(b,c). This explains the lack of any strong dependence on coating thickness of the voltage needed for PEO processing. In fact, while unequivocal evidence for this is lacking, there is a general consensus that dielectric breakdown commonly occurs during PEO across a residual oxide layer on the substrate that has a thickness of the order of 1 µm. (This issue is addressed in Section ‘Discharge lifetimes, bubble growth and incubation times’.) While this is ‘thin’ for many purposes, it is probably too thick for electron tunnelling.
However, this does not mean that electrons cannot move through these oxides, and indeed it is well established that electron mobility can be relatively high in some oxides, particularly those with variable stoichiometry and high levels of various defects. Considered in terms of a band gap, such defects may provide energy levels within the gap, which assist motion of electrons through the material. A general correlation is still expected between a high band gap and a low electron mobility and, on this basis, the metals for which PEO can be carried out most readily are likely to have relatively large band gaps. The key point here is that, if electrons do travel through the oxide layer, this will not, in general, lead to any oxidation of the substrate, and it may carry much of the imposed current, so that PEO (i.e. plasma formation and oxidation within the plasma) may be reduced or eliminated (even though there may be a strong thermodynamic driving force for this oxidation). In such cases, the voltage during (the anodic half-cycle of) PEO is expected to be lower than for cases in which most of the current is being carried by the discharges. Some support for this general idea is provided by the work of Munoz and Bessone [175], who showed that, during anodisation of Al, the introduction of small Ni and Co particles into the growing oxide layer (via cathodic deposition) raised the conductivity of the layer and hence reduced the electric field across it (and the rate of alumina growth).
The band gap evidently gives at least a pointer towards probable electron conductivity, and hence influences the electric field that tends to build up across the oxide. A dielectric strength is normally expressed as a breakdown field (in V m−1), which is measured experimentally. The outcome of such experiments tends to be slightly variable, depending on factors such as the purity and porosity levels. For ‘good’ insulators, values are usually obtained which are above that of (dry) air (usually quoted as ∼3 MV m−1). Values for alumina and magnesia, for example, are usually in the range 10–30 MV m−1. For other oxides, measurements have been made, often giving values in a lower range for oxides with smaller band gaps, but it is difficult to regard these as highly accurate or reliable and in general it is probably better to simply use band gap values (which are in most cases well established) as an indication of likely dielectric strength.
There is, however, another electrical property that is of potential significance here, which is the dielectric constant (relative permittivity). This is a dimensionless number that gives an indication of the capacity of the lattice to store electric charge. It depends on the nature of the bonding (how strongly ionic it is) and on the arrangement of the ions. (Non-centro-symmetric structures can have very large dielectric constants.) The exact significance of this for PEO is not clear, but the capacity of the oxide to store charge may affect the electric fields being created during the process (under AC conditions). There is no obvious reason why its value should correlate with either the band gap or the thermodynamic stability and indeed the plot shown in Figure 7 suggests that there is no clear correlation. It may be noteworthy that TiO2 has a very high dielectric constant – note the log scale in this plot. Plot of the dielectric constant [176] of selected oxides against their band gap.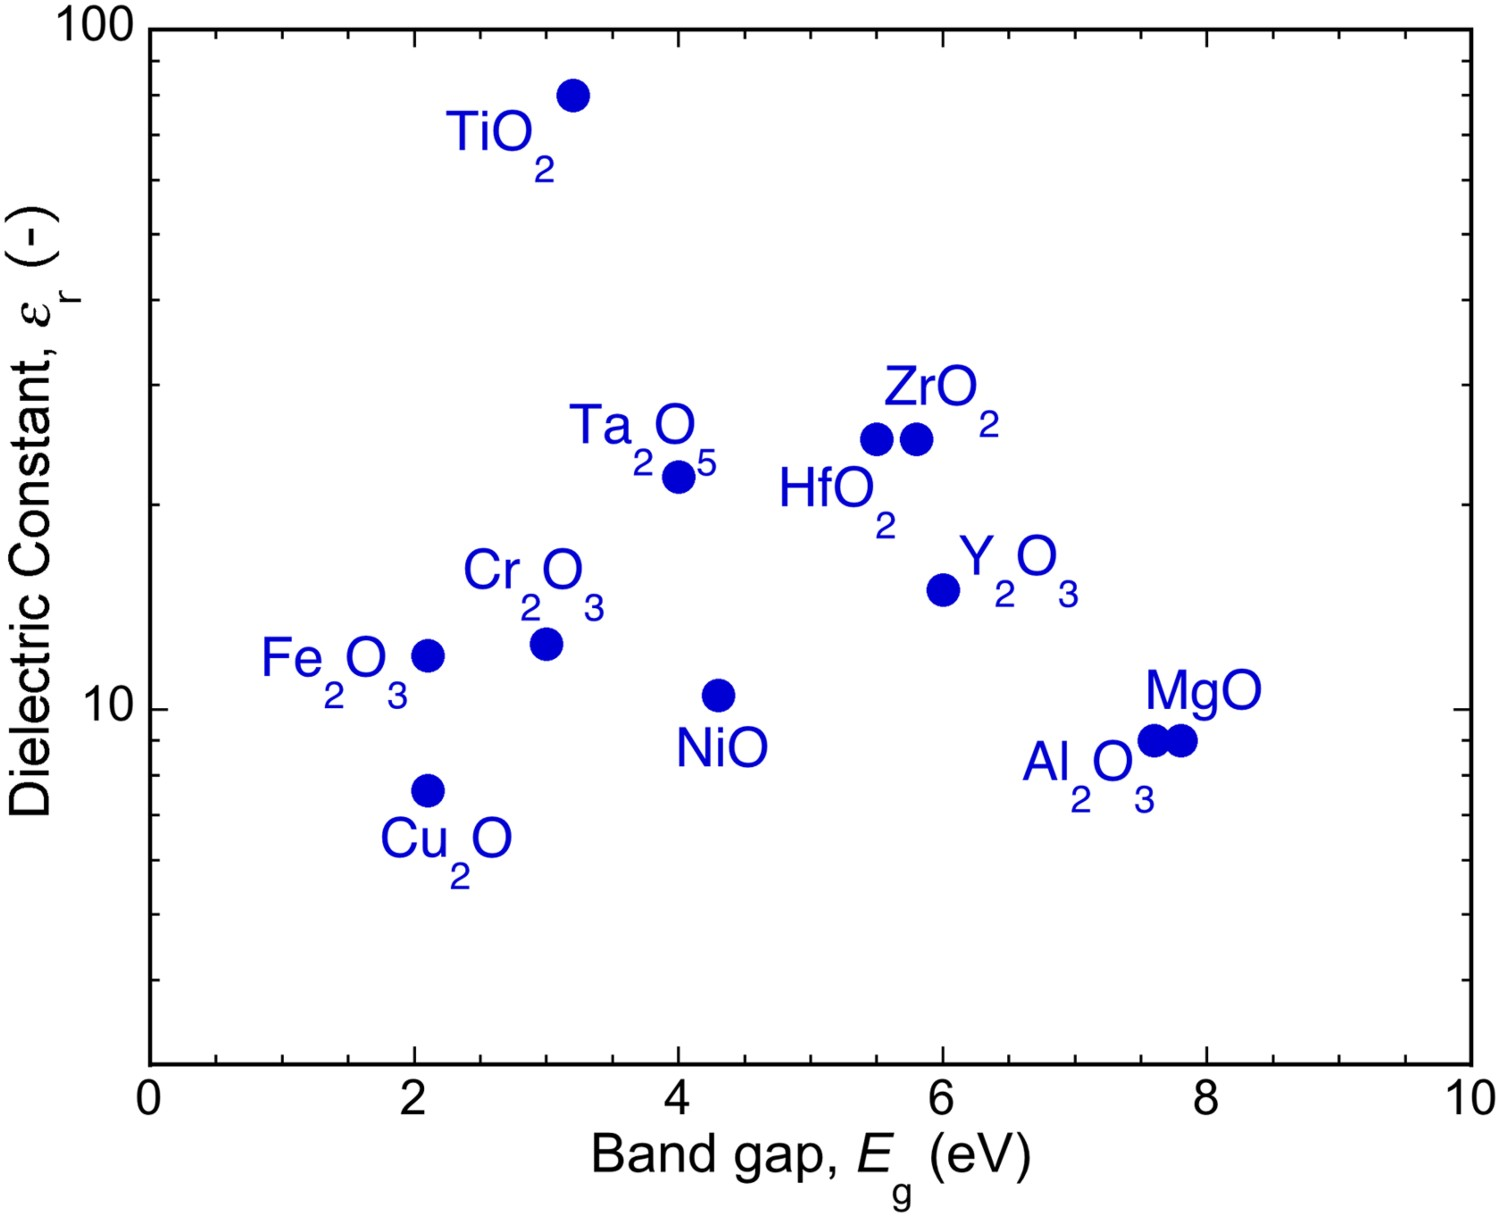
The electrolyte clearly fulfils several functions, as outlined in Section ‘Electrolyte composition and additives’. Primarily, it allows electric charge to flow around a circuit, so its electrical conductivity is relevant. It is also clear that the pH can be important and that, at least in some cases, species in the electrolyte may become incorporated into the coating and/or influence its microstructure and properties. Regarding ease of discharge formation, there is a shortage of systematic information about the role of electrolyte composition, but there have been a few studies dedicated to this. For example, Figure 8 shows the breakdown voltage [177] as a function of electrolyte concentration (three different types of solution) during processing of an Mg alloy. (These data actually relate to a DC voltage, and could thus be regarded as information about termination of an anodisation procedure, but this is in the context of PEO studies.) It can be seen that this voltage falls considerably as the concentration (and hence the conductivity) of the electrolyte is raised. This presumably relates to a part of the applied potential dropping across the electrolyte, leaving less to create the (breakdown) field across the oxide layer. There have been a number of studies, over an extended period [32,33,178,179], that are relevant to this issue. Plot [177] of the breakdown voltage during anodisation, as a function of the type and concentration of the electrolyte.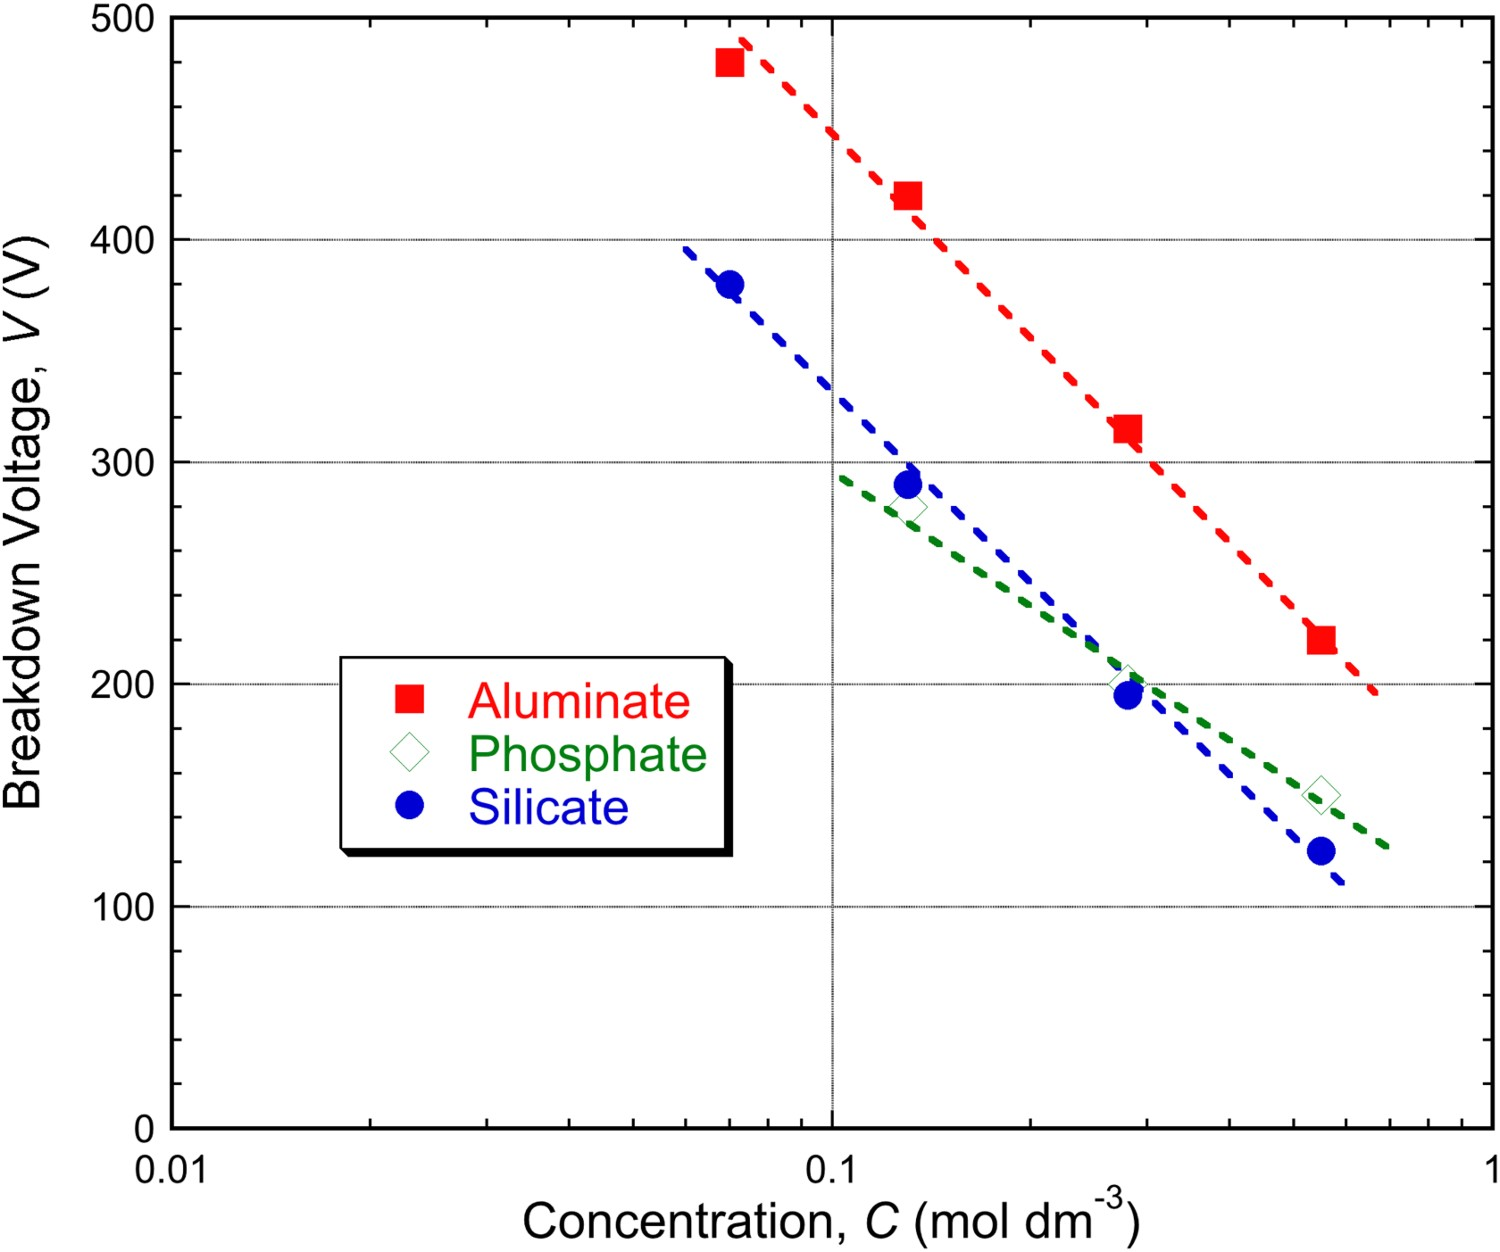
Calculations can be made concerning this potential drop effect, using electrolyte conductivity data. On the scale of the complete set-up, these are complicated by convection etc., but simple estimates can be made relating to the potential drop across a (stagnant) column of liquid within the pore above a PEO discharge site. The variables involved, apart from electrolyte conductivity, σ, are the dimensions of the pore (height h and diameter D) and the (discharge) current, I. The voltage drop is then given by Curves showing the voltage drop across a cylindrical electrolyte column, using Equation (1) in combination with input data appropriate for PEO coatings immediately before a discharge.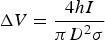
Small area sample monitoring of currents in individual discharges
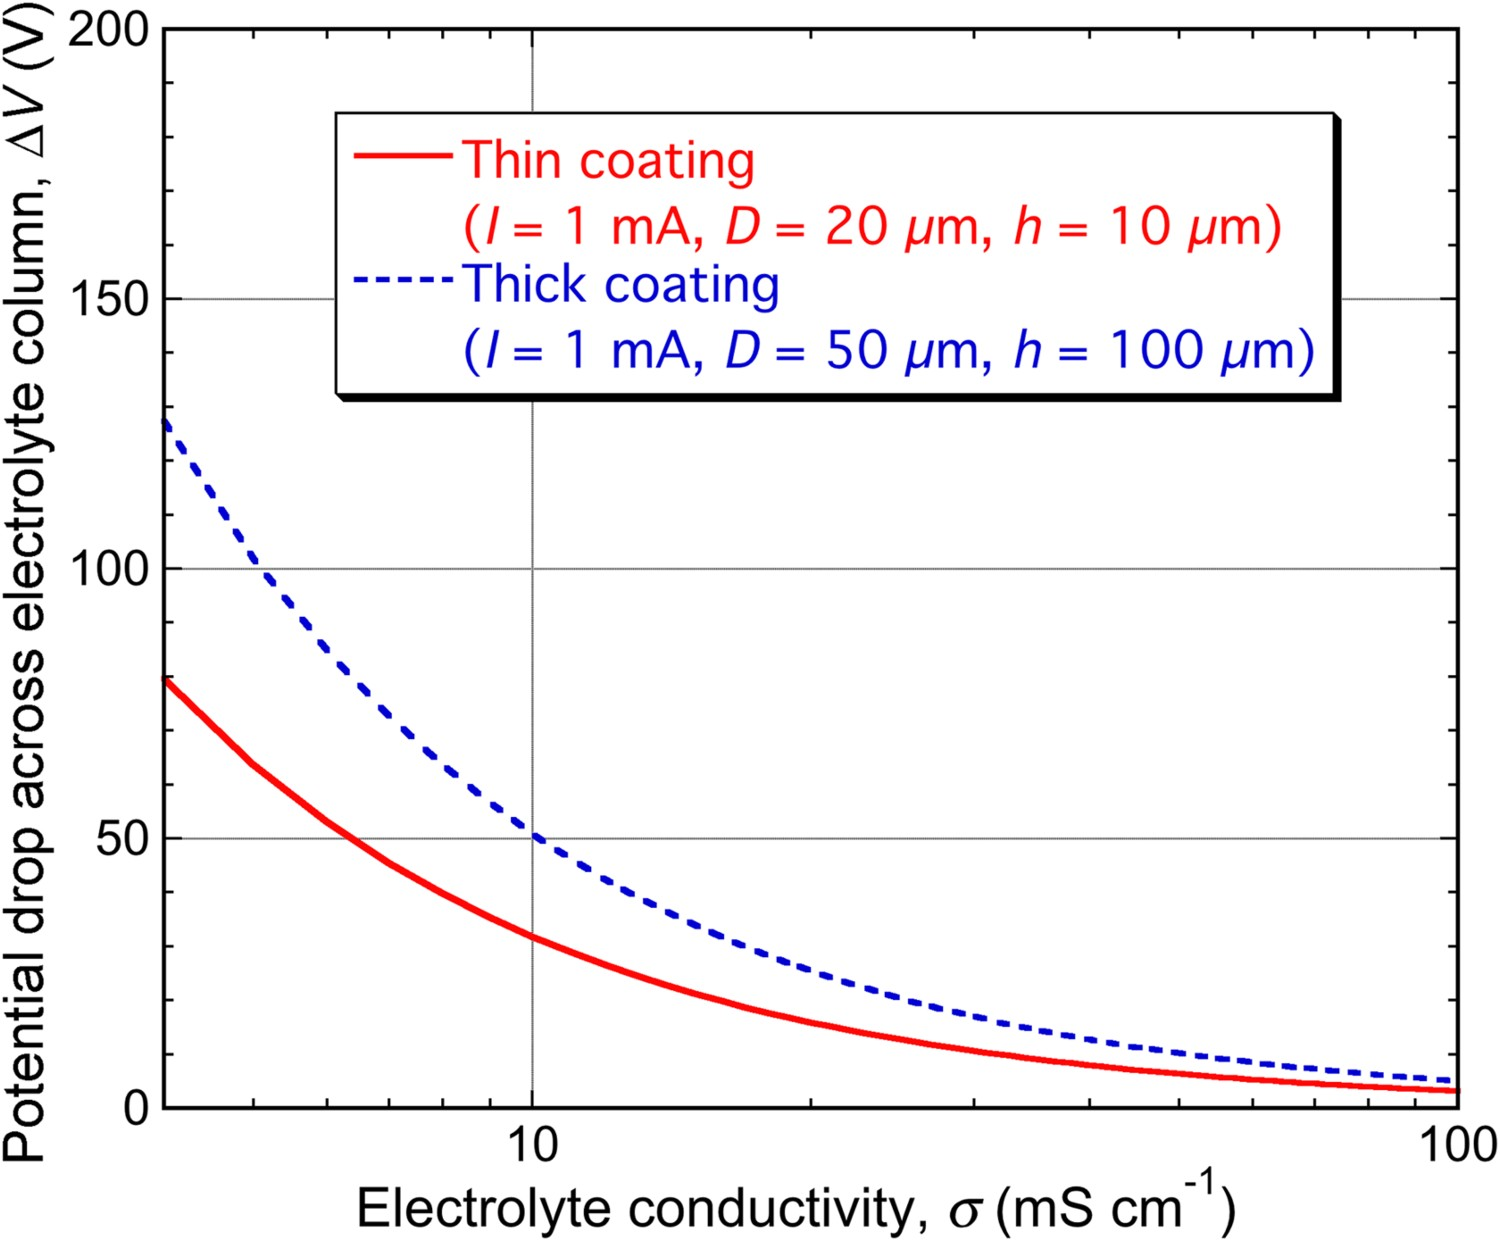
The key, indeed the defining, characteristic of PEO is the repeated formation of discharges on the surface of the sample, within which the substrate metal is converted to oxide. The nature of these discharges and their distributions in time and position are thus central to understanding and control of the process. This understanding has been advanced considerably as a result of the development of the small area sample technique (by Dunleavy co-workers [50,57,59], based on the earlier work by Klein and co-workers [180,181]). The concept is illustrated in Figure 10, which shows the experimental arrangement. This allows the current through the small area sample to be continuously recorded (typically at rates of up to about 1 MHz), while obtaining synchronised optical information, either from the light emitted by the discharges or via high-intensity (short duration) illumination. Schematic depiction of a small area sample set-up for monitoring of electrical and optical characteristics of individual discharges during PEO.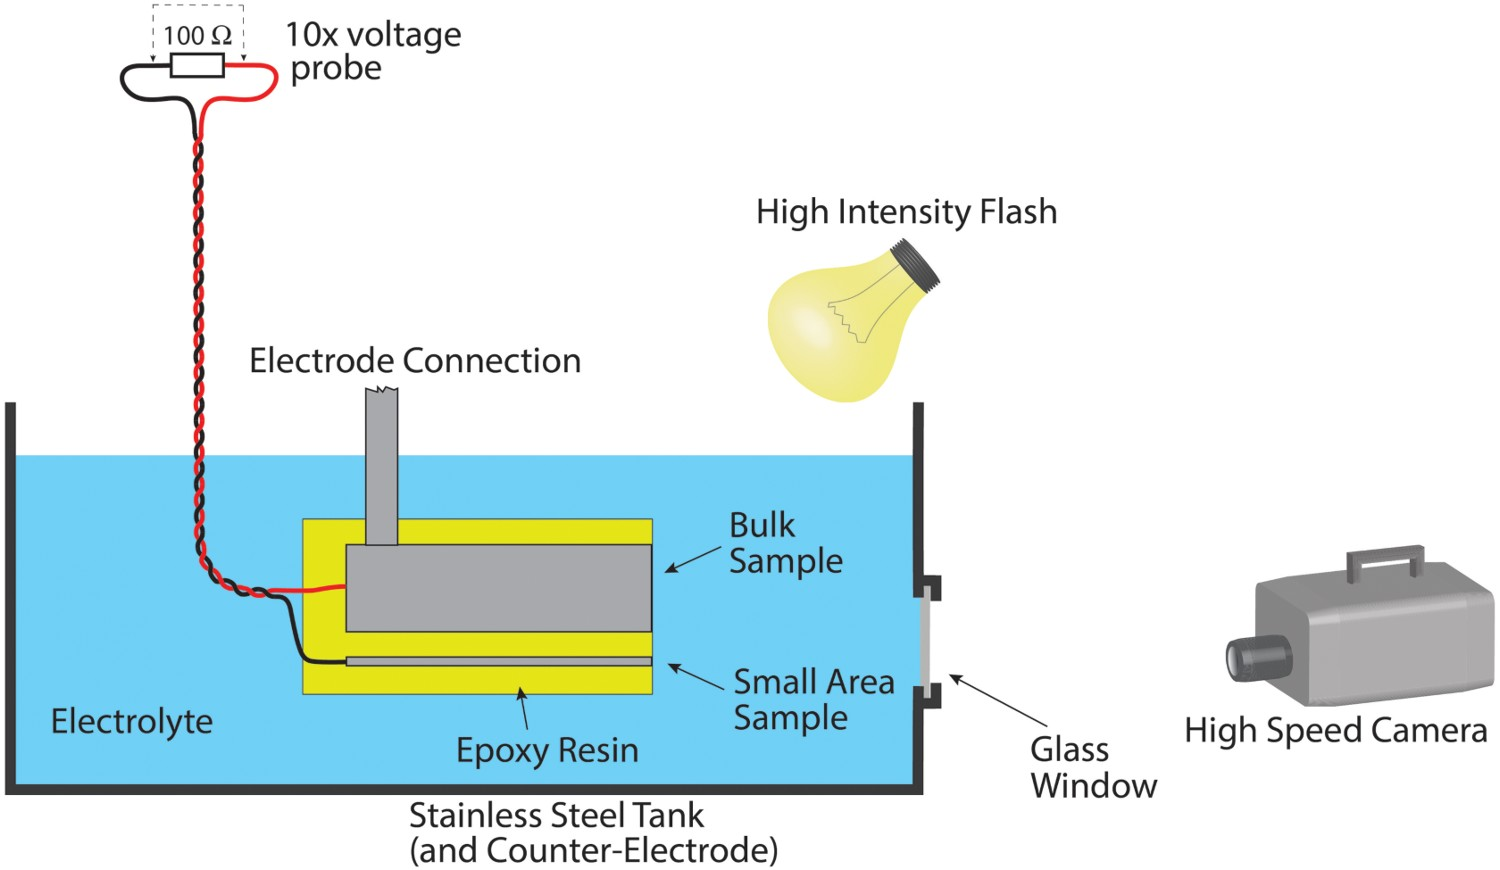
The central idea is that, provided the area of the small sample is sufficiently small, only single discharges will be occurring on it at any given time. Parallel processing of a conventional (bulk) sample, where many discharges are taking place throughout, ensures that, overall, the PEO process is proceeding as normal. The current associated with individual discharges (taking place on the small sample) can thus be monitored, and also correlated with optical emissions. The voltage, which is acting similarly on both small and large samples, is monitored in a conventional way (also synchronised with the small area current), as is the overall current. In detail, there may be some uncertainties about the exact similarity of conditions between small area and conventional conditions – for example, the electric field is probably more divergent for the small area sample, there may be an uncertainty about its exact surface area and in some cases more than one discharge (cascade) could be taking place on it at the same time. Nevertheless, in general the technique is clearly capable of revealing important information that is relevant to conditions during conventional processing of bulk samples.
There is no doubt that current pulses associated with individual discharges can be captured using this approach. For example, Figure 11 shows a result from early work [50], in the form of synchronised plots of current and light emission intensity – in this case for DC processing of an isolated small area Al sample. It is clear that the pulses of both light emission and current coincide closely with the occurrence of discharges. It can be seen that in this case the current pulses reached about 30–40 mA. Typical data [50] showing a sequence of current pulses, and associated light emissions captured by a photomultiplier tube (PMT), during small area DC processing of an Al alloy.
Later work has focused on AC conditions, with small area samples being processed in parallel with bulk material. Typical variations [62] of voltage and (small area) current are shown in Figure 12, for 50 Hz (square wave) processing of Al. It can be seen that seven discharges occurred during this particular anodic half-cycle (10 ms period). The anodic voltage developed was about 600 V. The average current during this cycle was about 20 mA. Discharges did not occur during every half-cycle and the overall average anodic current was about half of this value. It can be seen that at least most of the current is being carried via the discharges – a simple estimate leads to a value of over 80%. Synchronised plots [62] of voltage and (small area) current during PEO of Al-2014 alloy with a (square wave) 50 Hz supply. The coating thickness at this point was about 100 µm.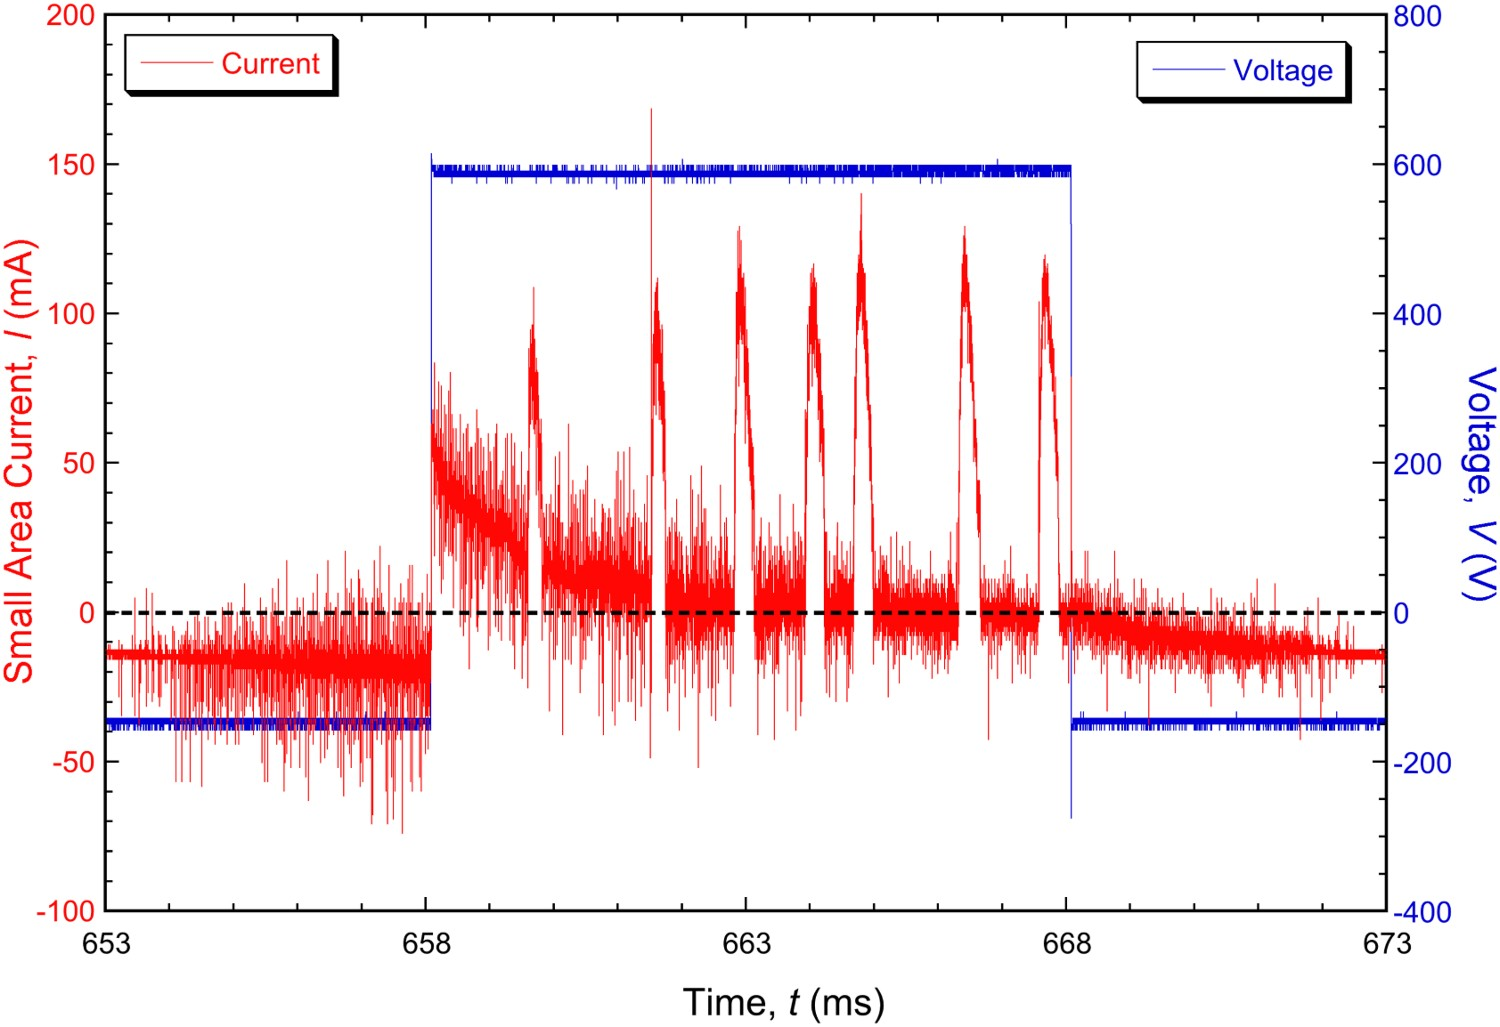
The average current during the cathodic half-cycles is more homogeneous and was also ∼10 mA, although it can be seen that the voltage needed to create this was only ∼150 V. This lower voltage in the cathodic half-cycle is consistent with the arguments put forward in Section ‘The “valve metals” and charge transfer during anodising and PEO’ (Figure 5) about the higher mobility of hydrogen ions allowing easier charge transfer through the electrolyte. No discharges took place during the cathodic half-cycles (although they can occur under some circumstances – see Section ‘Cathodic discharges and the effect of supply frequency’).
Converted to a current density, using the nominal surface area of the wire, a current of 10 mA corresponds to about 200 A dm−2, which is larger by a factor of about 6 than the pre-set value (which flows through the bulk sample). This difference is partly attributed to the convergent nature of the electric field in the vicinity of the small area sample (analogous to the ‘corner effect’ often observed with bulk samples) and also to some coating production on the cylindrical surface of the wire exposed by the small interfacial gap between it and the surrounding resin. It can be seen that typical peak discharge currents were ∼100 mA and discharge lifetimes were ∼300 µs, with ‘incubation periods’ between them of the order of 1–2 ms.
An important feature of PEO is that these discharge sequences have a strong tendency to occur repeatedly at particular locations on the surface of the sample – i.e. they occur in ‘cascades’ that typically consist of hundreds, or even thousands, of individual discharges. This is illustrated in Figure 13, which relates to a 50 µm thick coating on Al, with a sinusoidal 50 Hz supply [60]. The figure shows that, during the period concerned (∼100 ms), a series of discharges occurred at a particular location (and, at least in this case, nowhere else in the field of view, which was about 1.5 mm square). The discharges occurred only when the (anodic) applied potential was sufficiently high (>∼400 V for this case). Discharges lasted ∼100–200 µs, with incubation periods between them of ∼0.5–1 ms. These characteristics do, however, vary somewhat as the coating thickness changes, with a clear tendency for the discharges to become more energetic, and more dispersed in time and location, as the thickness increases. Information [60] from a sequence of 17,500 images (covering a period of about 0.1 s) of a region of a 50 µm thick coating on Al as PEO processing takes place, showing (a) the complete sequence superimposed, (b) total summed light intensity for each frame, as a function of time, (c) as for (b), but taken only from the bright area (circled) in (a), and (d) a higher resolution plot of part of (c), covering an anodic half-cycle, together with a typical measured voltage profile during such a period.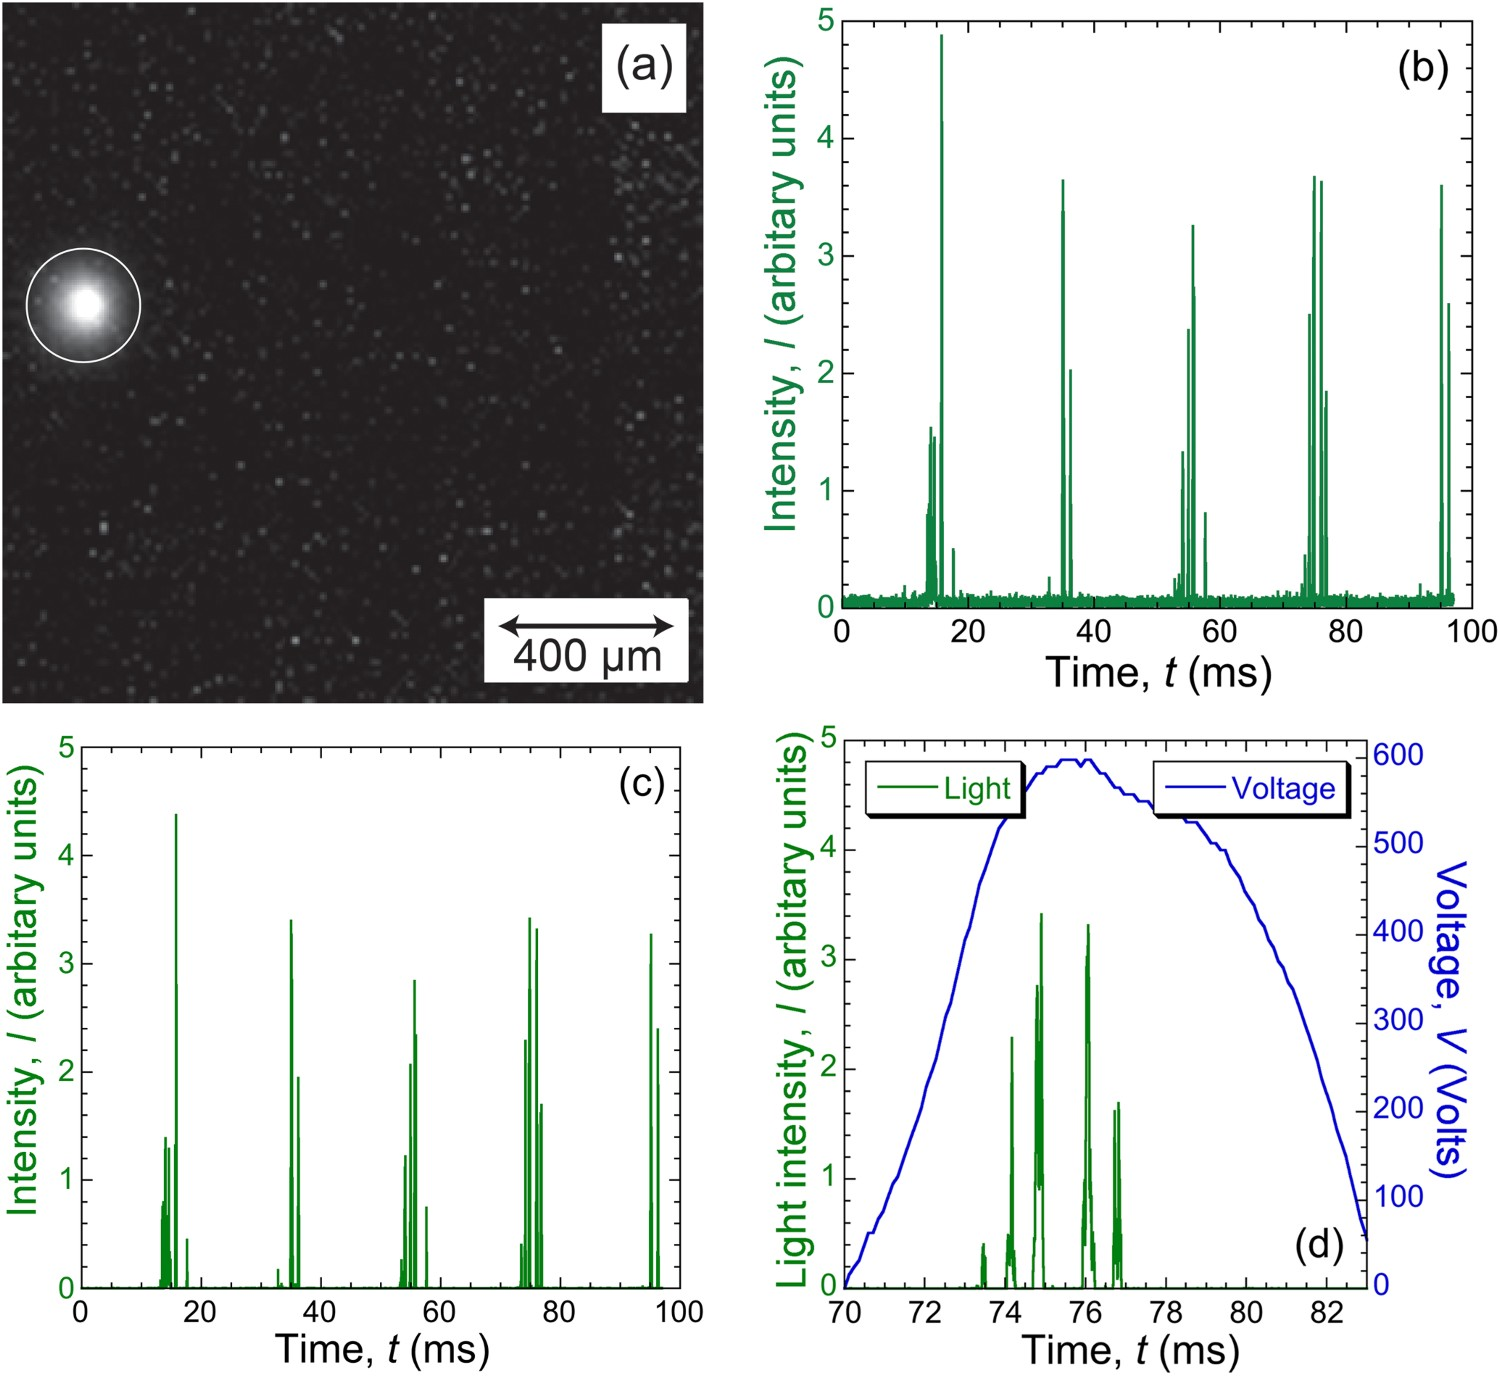
Of course, a key issue concerns the relationship between discharges and the evolving microstructure of the coating, particularly the pore content and architecture. Some insights into this are provided in Figure 14, which shows SEM micrographs of a complete small area sample [62] before and after a short (∼1 s) period of PEO processing. During this period, about 150 discharges occurred, all located at the single point where light emissions occurred – see Figure 14(b). Figures 14(c) and (d) show higher magnification views of this region. The site of the discharges (dotted red circle in Figure 14(d)) is the only location on the sample where a substantial change occurred in the appearance of the microstructure, although it can be seen that there are some very slight changes in the immediate vicinity. It was also observed [62] that, when the operation was repeated (i.e. the sample replaced in the electrolyte again, and PEO processed for a further period of ∼1 s), the cascade continued in the same location. This confirms that it must be local microstructural features that are promoting repeated discharges in the same place, rather than, for example, residual heat or some effect related to the transient distribution of electrical charge during processing. In fact, it is fairly clear that it is the presence of a deep pore that is stabilising the location of discharge sequences, creating a region of relatively low electrical resistance. Microstructural effects [62] of a discharge cascade on a small area sample (with a 100 µm thick PEO coating) during processing at 2500 Hz for 1 s, showing (a) an SEM micrograph of the surface in the initial state, (b) a superimposed set of (∼200,000) video images taken during the process, (c) a magnified SEM micrograph of the region indicated in (b) as the cascade location and (d) the same area after PEO processing (with the region in which the discharge was localised indicated by a circle).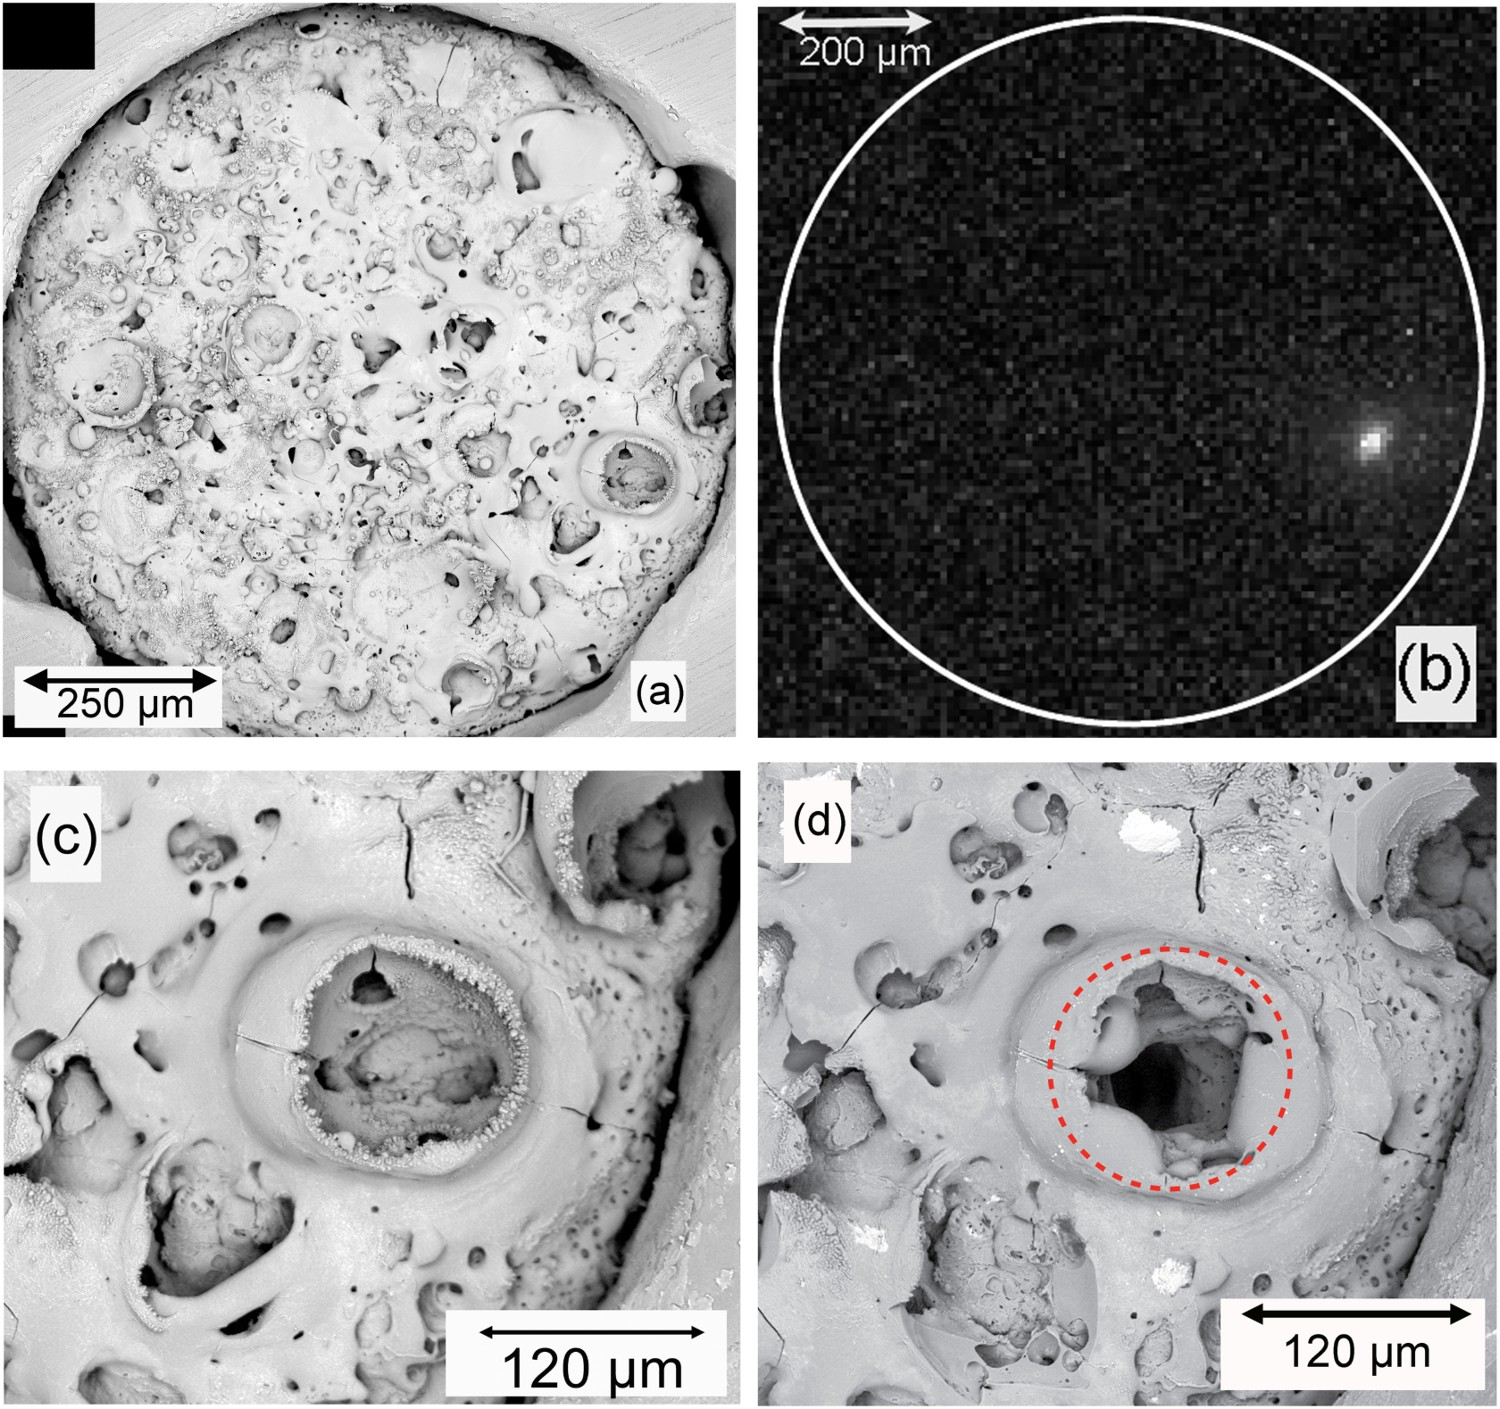
Estimates [60,61] of a typical discharge energy have indicated a value of ∼1 mJ and also that the conversion rate between discharge energy and resultant volume of coating is typically ∼1013 J m−3 (10−5 J µm−3). This suggests that, for example, 1000 discharges would create ∼105 µm3 of oxide, corresponding to an increase in thickness of ∼10 µm on a cylinder of diameter 100 µm. These are highly approximate figures, but, when the account is taken of a tendency to force liquid oxide laterally into neighbouring pores, it is plausible that a local increase in thickness of this magnitude might be sufficient to raise the electrical resistance of the locality sufficiently for the cascade concerned to terminate. (The full lifetime of an individual cascade has not yet been accurately measured, but there are indications that it might be of the order of 1000 discharges.)
A typical architecture [62] of a pore at a cascade site is illustrated in Figure 15, which shows a top-view visualisation and a series of sections normal to the plane of the free surface for the site in Figure 14(d). These were obtained by X-ray tomography. It can be seen that the central pore extends down almost to the substrate, which is covered by just a thin layer of oxide. This is not a very accurate way of estimating the thickness of the layer, but it can be seen that it is quite thin – of the order of a micron, or perhaps a few µm. Estimates of this order have been made by several authors [182–186]. Of course, once sufficient metal has been converted to oxide there, it will no longer be the case that the site has a lower resistance than others nearby, and the cascade will come to an end, although it is clear that this tends to happen only after a relatively large number of individual discharges have taken place. Tomographic data [62] from the circled region of the small area sample in Figure 10(d), showing (a) a perspective view into the pore channel and (b–g) progressive parallel sections (11 µm apart), containing the through-thickness direction, with sections (d) and (e) located near to the approximate axis of the pore.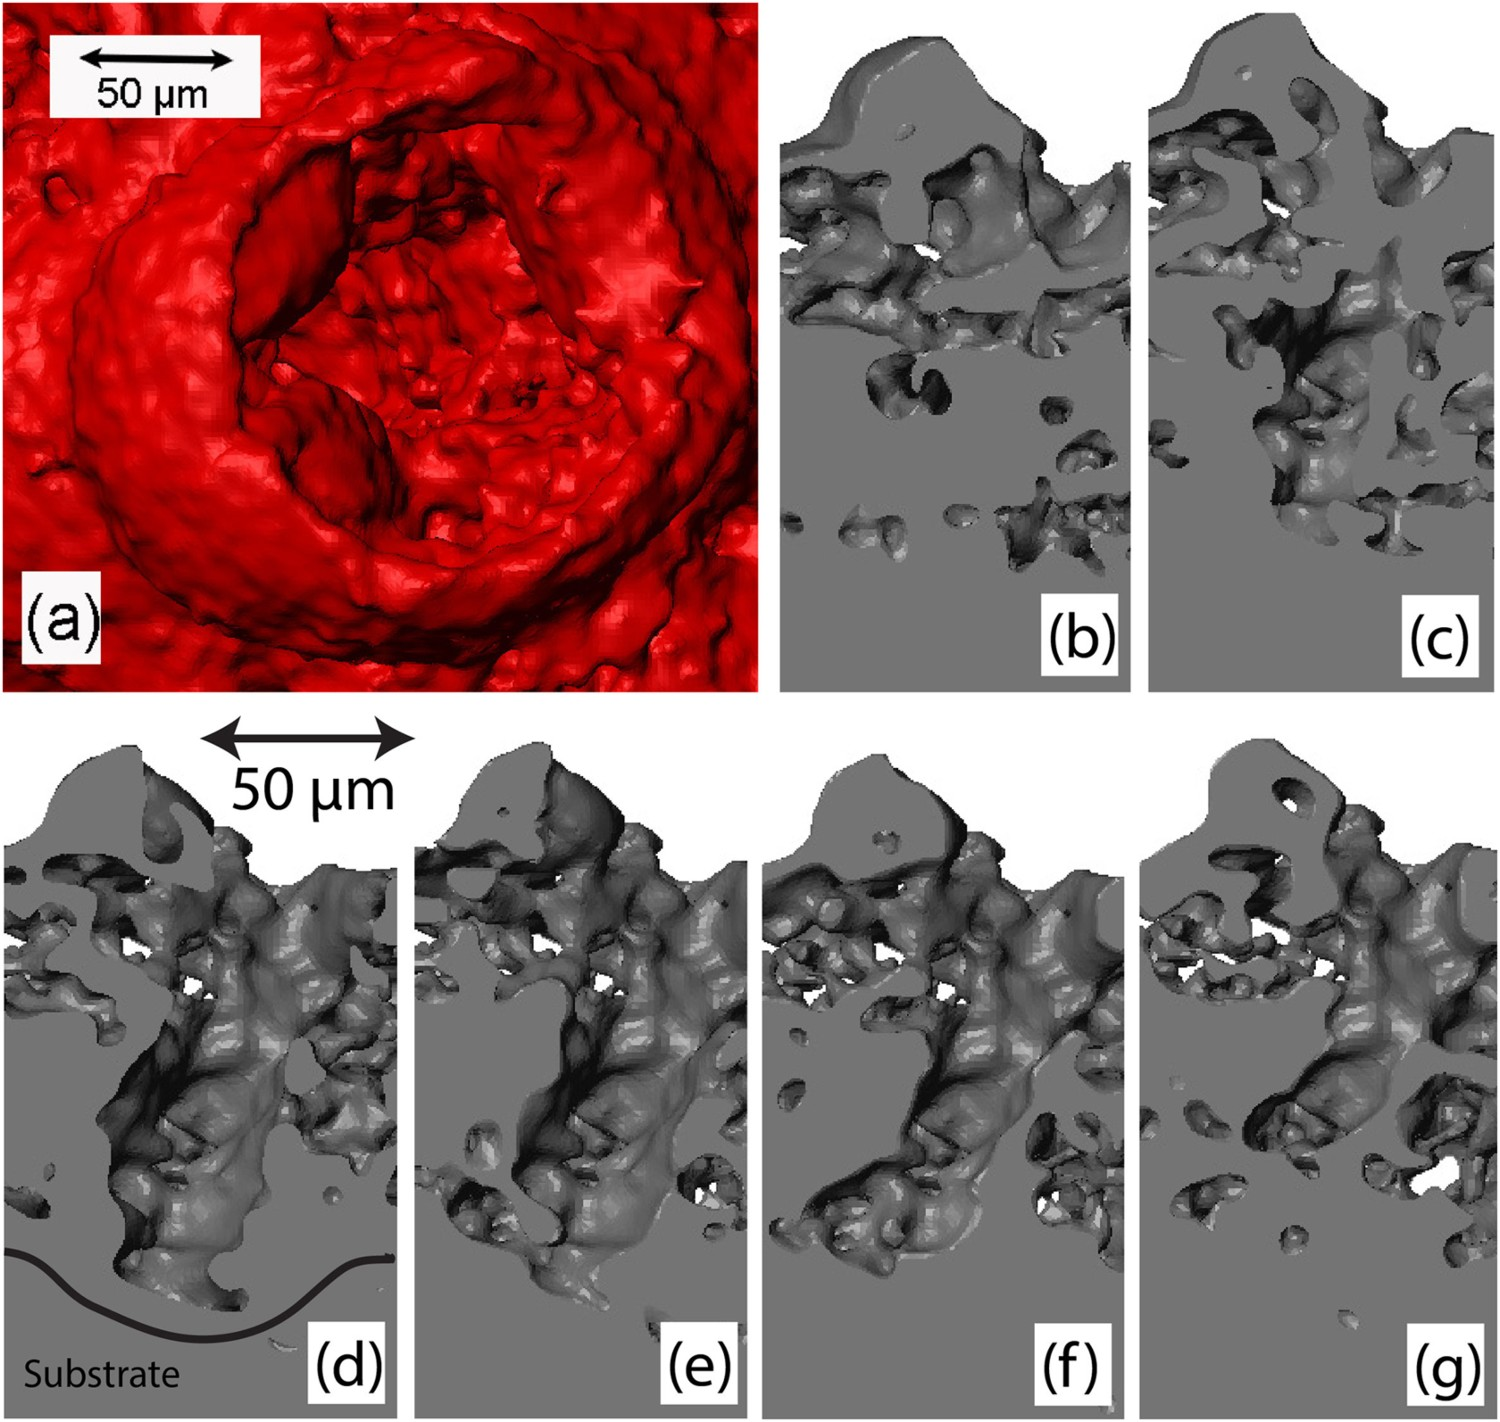
It is also of interest to understand how a single discharge is terminated. Some insights into this can be obtained by studying the details of how the current associated with a discharge changes with time. It is important to appreciate that these characteristics are not uniform, either within a cascade or between cascades. They vary significantly with coating thickness, but also with the details of the (evolving) microstructure at the location concerned. Nevertheless, allowing for stochastic variations, some clear features can be identified. Some of these are illustrated by the plots [57] in Figure 16, which shows data obtained by statistical analysis of a large number (millions) of individual discharges, relating in this case to two different coating thicknesses. It is clear that thicker coatings lead to discharges that require a (slightly) higher initiation voltage and also have rather longer lifetimes and carry higher currents. They are clearly more energetic (but more dispersed in time and location, assuming that the overall average current and also the coating growth rate remain much the same, which is commonly the case). In fact, it is a commonplace observation that discharges tend to evolve in this way as the coating thickens. Plots [57] of averaged current profiles for individual discharge events, grouped according to the voltage range within which the discharge initiated, after processing periods of (a) 6 minutes and (b) 42 minutes. (The coating growth rate was about 1 µm per minute.) Error bars are shown for every other curve.
However, there is a further point that can be noted from the shape of the plots in Figure 16, which is that the current shuts down rather abruptly, particularly with thicker coatings. There is clearly a process involved that pinches off the current flow over a short period. This implies a rapid rise in the resistance of the discharge site. This is almost certainly associated with the growth of a ‘bubble’ of water vapour at the top of the pore channel, where the plasma column is in contact with the bulk of the electrolyte. The discharge current is forced to flow through this expanding bubble. It will initially contain some charged species from the plasma, and will thus have a relatively high conductivity, but, as it expands due to heat flow and vaporisation of the water, these species will become dilute and the overall resistance will rise due both to an increased current flow path and to a reduced conductivity.
A number of authors [59–61,187–189] have noted that ‘plasma bubbles’ form at the top of discharge columns. Direct observations have been made of the growth of these bubbles, using high-intensity illumination. A sequence of video stills [61] covering the period of a single discharge lifetime (∼170 µs in this case) is shown in Figure 17. It can be seen that, as the discharge develops, a bubble rapidly grows into the water from the discharge site. It reaches a maximum diameter (of almost 1 mm in this case) in the frame having an arrow pointing to the discharge site, after which the current drops off sharply, light emission from the discharge stops and the bubble shrinks again. The rate of shrinkage is similar to the rate of growth. Sequence of video images [61] showing a small area sample (wire of diameter ∼1 mm) during PEO of Al, with high-intensity external illumination. This set covers the lifetime of a single discharge event. Times are given in ms.
A picture now emerges of the complete cycle of events during a discharge within a cascade sequence. This is illustrated in Figure 18, which shows a series of schematic sections (based on the pore architecture in one of the tomographic sections in Figure 14). The factors that control the timing of the sequence can be identified in these schematics. For example, the incubation period represents the time required for the electrolyte to flow back into the pore. It will, of course, tend to become longer as the coating thickness increases. The substrate is progressively consumed at the site of the discharge (by evaporation into the plasma) and oxide is progressively formed in the vicinity. Since the oxide normally occupies a larger volume than the metal from which it formed (partly due to porosity in the oxide), the interface moves downward relative to the original position of the metal surface, while the free surface moves upwards. The lifetime of a cascade is presumably terminated when enough oxide has been formed in the location concerned to raise its resistance above that of alternative nearby sites. The factors controlling the lifetime of the discharge itself are a little more complex, since they involve the dynamics of plasma ignition and growth, and the rate of vaporisation of the electrolyte. Nevertheless, it may be possible to model these phenomena, and perhaps to thus gain insights into the effect of changing certain variables, such as electrolyte conductivity, coating thickness and physical properties of the oxide concerned. This is likely to be a fruitful area for future research. Sequence of schematic sections through a pore during the cycle of a single discharge event in a PEO cascade.
There is, of course, quite a lot of operational experience concerning PEO processing of different metals and it is widely recognised that the detailed outcome (microstructure, surface roughness, colour, growth rates, etc.) can depend significantly on factors such as alloy composition, electrolyte composition and electrical conditions. There are certainly variations in effects such as whether alloying elements from the substrate become incorporated in the coating (or end up in the electrolyte as the substrate is consumed), whether species from the electrolyte are deposited within the coating, etc. In this respect, the process is a particularly complex (and potentially versatile) one. Nevertheless, there are certain systematic differences between the responses of different base metals. With some, PEO processing is not possible, which can largely be attributed to the thermodynamic (and related kinetic) issues outlined in Section ‘Thermodynamics of oxidation during PEO’. However, there are also some clear differences between the PEO characteristics of those for which the process does ‘work’.
These are illustrated by the representative voltage and (small area) current profiles shown in Figure 19 for Al, Mg, Ti and Ta. These all relate to 50 Hz processing at a point when the coating thickness was about 5–10 µm. Expanded views of the current profiles are shown in Figure 20. It is clear from Figure 4 that there is a stronger driving force for oxidation of all of these metals than there is for oxidation of hydrogen, although in the case of Ta the difference is not so large. Figure 6 shows that alumina and magnesia have large band gaps, whereas those for the oxides of Ti and Ta are significantly smaller – particularly in the case of Ti. Voltage and (small area) current profiles for 50 Hz processing of (a) Al, (b) Mg, (c) Ti and (d) Ta. Expanded current profile plots for the data in Figure 19.
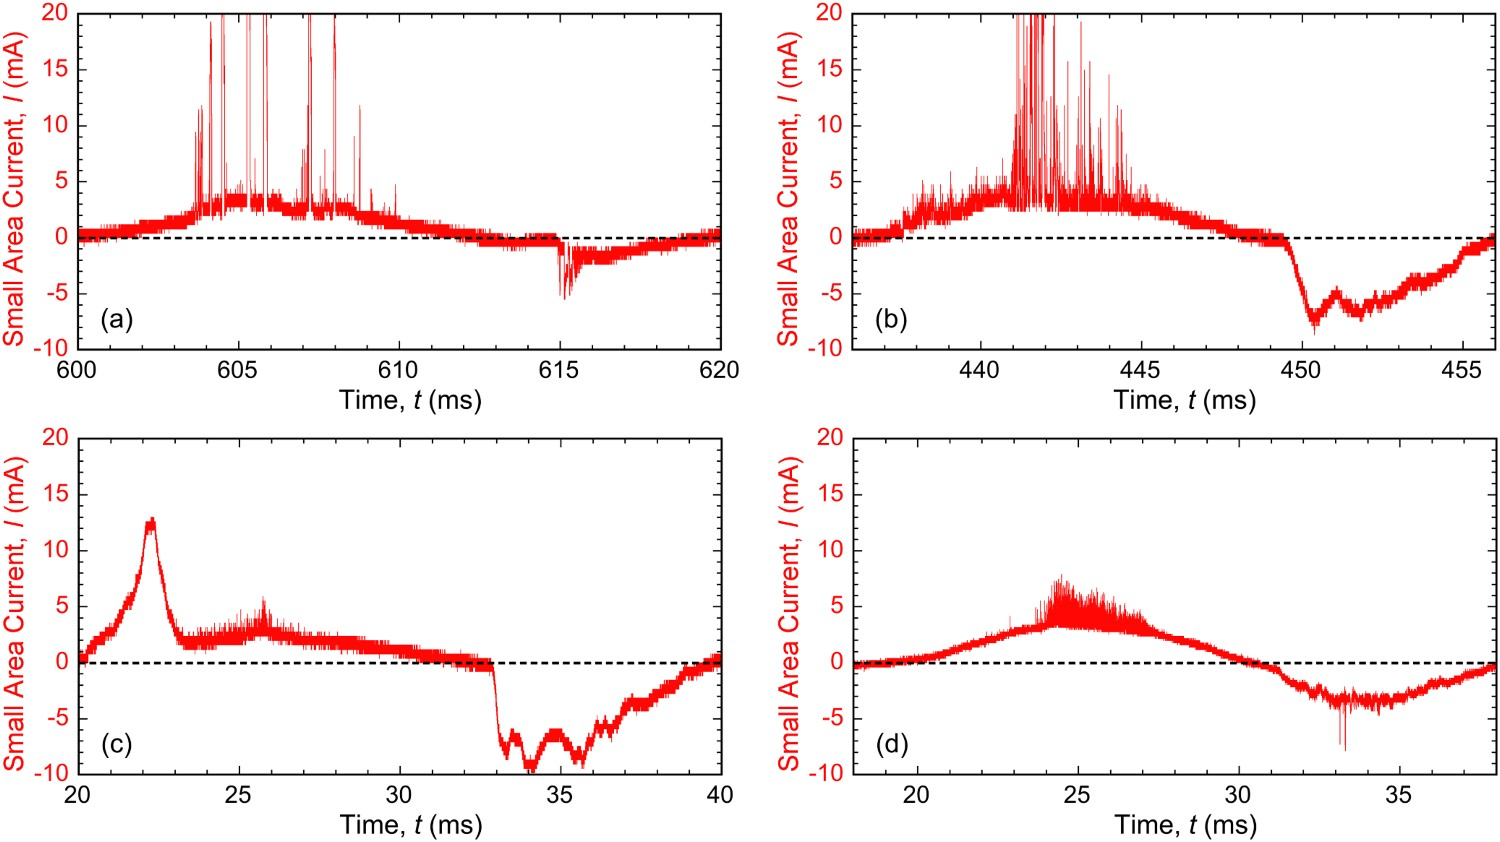
The plots in Figures 19 and 20 clearly show that the responses of these metals do fall into two broad categories, as might have been expected from the above points. For the Al and Mg, there were several well-defined discharges (also visible optically) during the anodic part of each cycle, when the voltage rose to 500–600 V. Current also flowed during the cathodic part, although the voltage only reached about 100 V. The other two metals, however, showed significantly different characteristics. Discharges did occur during the anodic part of the cycle, but there were more of them and their discharge currents were smaller. These current characteristics correlated with (synchronised) optical observations. Optical emissions associated with individual discharges could be detected for Ti and Ta, but they were short-lived (∼10 µs) and weak. (In fact, for both Ti and Ta, it could be seen optically that more than one discharge cascade often occurred at the same time on the small area sample: this means that the intervals between individual discharges cannot reliably be inferred from these plots, although the current associated with them should still be correct.) Also, the proportion of the total anodic current being carried by them was clearly smaller than for Al and Mg. Furthermore, the anodic voltage developed (∼400 V) was somewhat lower than for Al and Mg. These observations are consistent with the idea that electron flow through the oxide layer was taking place more readily with Ti and Ta, inhibiting the development of high electric fields across the oxide and hence of large, well-defined discharges.
One or two other features of potential interest are apparent in these plots. For example, there are noticeable pulses of current in the Ti plots early in the anodic part of the cycle (and also, with lower amplitude, early in the cathodic part). These were not associated with optical emissions of any sort. This is speculative, but these current surges could be due to some kind of charge capacitive phenomenon, with the potential for complex (out of phase) effects in view of the short timescales involved. It is perhaps worth noting in this context that the dielectric constant (reflecting the capacity to store charge) of TiO2 is much higher than that of most other oxides – see Section ‘Dielectric strengths and dielectric constants of oxides’. None of the other metals exhibited any similar charge pulsing, although there were some (small) discharges in the cathodic part of the cycle with Ta.
More generally, it may be noted that there is clearly scope for complex charge redistribution effects to arise during PEO, both in the coating material itself and in the electrolyte within and adjacent to the coating. Several recent publications have emphasised the potentially important role of charge accumulation, particularly at the interface between coating and electrolyte. For example, Martin et al. [65] reported that formation of discharges may be delayed by this accumulation, making them less energetic (and thus potentially less likely to cause damage to the existing coating).
PEO is normally carried out using an AC supply, with the electrical circuitry often set such that the current (i.e. the current density) is fixed and is the same in both anodic and cathodic parts of the cycle. For metals that are well suited to PEO processing, at least most of the current flowing in the anodic part of the cycle is carried in the form of discharges (that stimulate oxidation of the substrate). These discharges are initiated by the flow of electrons from the electrolyte to the substrate, through the residual oxide layer, in some kind of avalanche process that leads to plasma formation and growth. Hydroxyl anions could lose electrons to form oxygen gas (as in conventional electrolysis of water), but during (successful) PEO this process is likely to be interrupted by the plasma formation. It seems likely that these ions, and possibly oxygen molecules that have just been formed, will become incorporated into the plasma. Of course, they will not be the only source of oxygen in the plasma, since water molecules will also enter it (and become ionised). Some of this oxygen is then likely to combine with metal cations in the plasma as it cools down during its collapse, particularly if the thermodynamic driving force for this is greater than for the (re)formation of water.
In general, it is thus expected that, if PEO is proceeding successfully, with most of the current flowing via plasma discharges, then there should on this basis be little or no evolution of oxygen gas during the anodic half-cycle. It is perhaps worth mentioning in this context that there has been a relatively little direct experimental investigation of the rates or types of gas evolution during PEO. Nevertheless, there has been some systematic work and a consistent finding [190–192] is gas evolution rates considerably above the Faraday yield level (corresponding to conventional electrolysis of water). Figure 21 shows an example plot [192] of the voltage and the quantity of gas evolved (at the anode) during a typical PEO run, with it being reported in this case that virtually all of the gas was oxygen (although other reports suggest that hydrogen can also be formed at the anode). It can be seen that, once PEO discharges had become established (at ∼500 V), gas evolution started and the rate of gas production remained approximately constant (∼0.6 L m−2 s−1) after this. Since the current density was 935 A m−2, the maximum rate of gas evolution during conventional electrolysis (Faraday yield) would have been 935 × 22.4/(4 × 96,485) ∼ 0.05 L m−2 s−1, so the observed rate is an order of magnitude greater than the maximum expected value. Of course, it is clear that PEO is not a conventional electro-chemical process, but the source of this gas is nevertheless of interest. Experimental data [192] for gas evolution and voltage development during PEO of 6082 Al, with an electrolyte containing 1 g L−1 of KOH and a current density of 935 A m−2.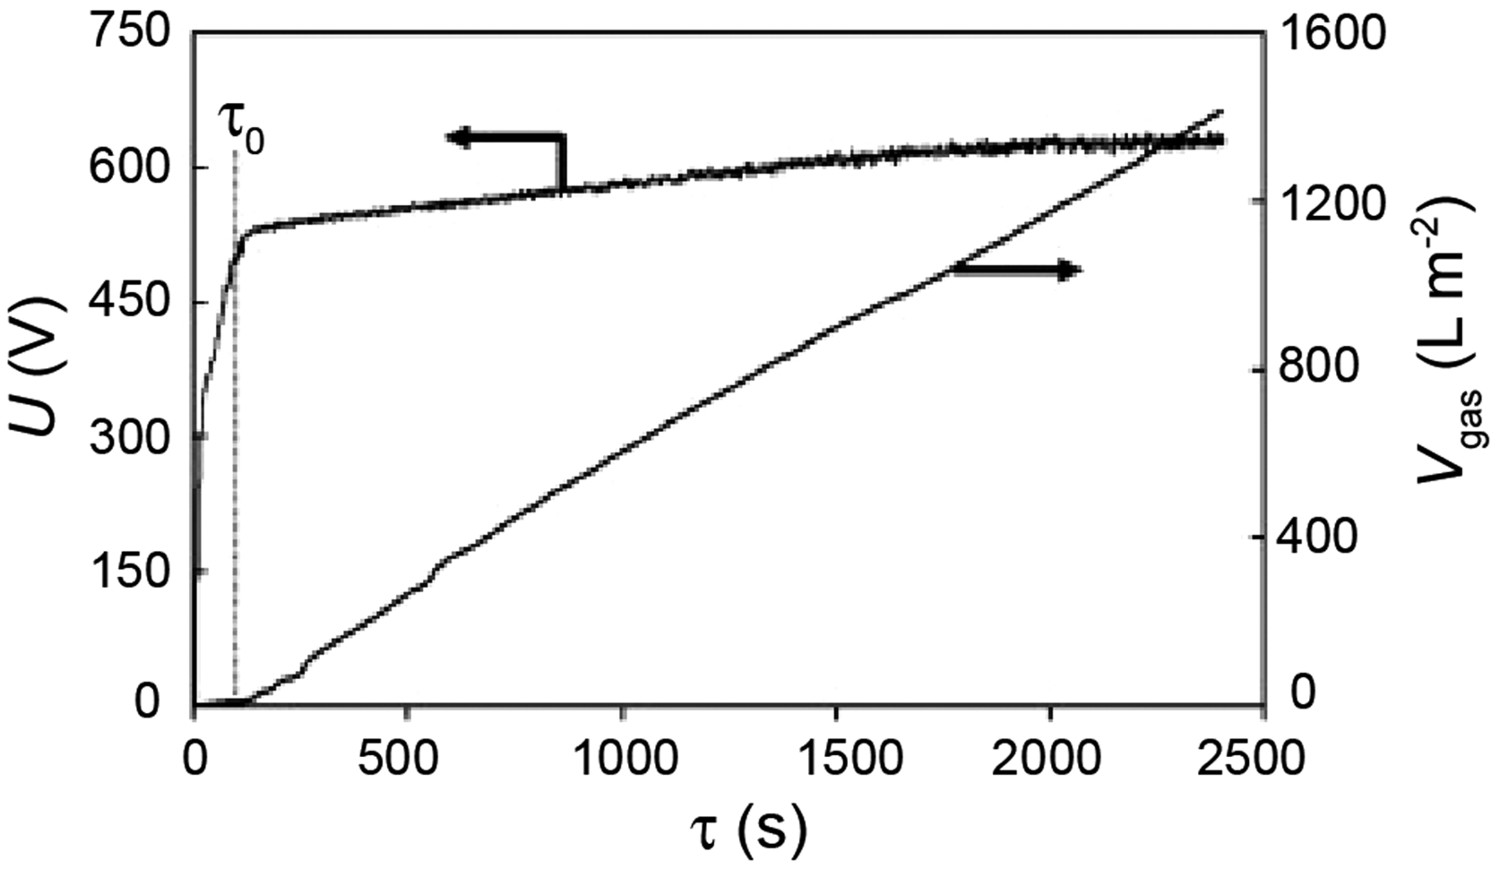
In fact, it seems clear that this gas must come from the plasma. Various species enter the plasma, but, in terms of quantity, a lot of these are produced by breakdown of water. It is clear from Section ‘Discharge lifetimes, bubble growth and incubation times’ that the quantity of gas produced during each discharge is far greater than that needed to account for the net rate of gas evolution evident in Figure 21. Of course, most of the hydrogen and oxygen in the plasma will recombine as it cools to recreate the water. However, the quenching is very rapid and it is certainly plausible that some residual gas could be left, perhaps partly because an imbalance between hydrogen and oxygen had been created as the plasma cooled. Of course, this mechanism, which is not electro-chemical in nature, would not be subject to Faraday yield limits – the quantity of gas potentially available would only be limited by the total energy input, which is normally substantial.
Such effects, which could take place within both anodic and cathodic plasmas, are likely to confuse the interpretation of gas evolution rates. However, it does in any event seem clear that, in the cathodic part of the cycle, there is a high likelihood of hydrogen ions being able to move rapidly through the electrolyte to the surface of the residual oxide layer, and there acquire electrons that have passed through the layer, so that hydrogen gas is evolved. This may depend on how effectively the surface concerned catalyses this hydrogen ion discharge – as indeed it does during conventional electrolysis of water [193]– but it is certainly well known in practical terms that hydrogen gas does tend to be evolved at relatively high rates during PEO. The notion of the ‘valve metals’ presumably arose from the idea that electrons could move through the oxide layer in this direction (without causing dielectric breakdown), but not in the other direction (from electrolyte to metal). However, as outlined in Section ‘The “valve metals” and charge transfer during anodising and PEO’, there is no clear reason to expect this. An alternative explanation is that the high mobility of H+ ions in the electrolyte allows them to reach the oxide surface at rates sufficient to carry much of the imposed current, reducing the field across the oxide layer and hence the likelihood of dielectric breakdown. If this is indeed largely a dynamic effect, then some dependence on supply frequency might be expected. This is explored in the next section.
The cathodic part of the cycle has been increasingly studied recently. It has been clear for some time [194] that PEO coatings produced using AC are in general of superior quality (harder and denser, for example) than those produced under corresponding (anodic) DC conditions. It has also been shown that coating quality is improved if the cathodic voltage is raised [90] or if the ratio of cathodic current to anodic current is increased [195]. What actually happens during the cathodic half-cycle is less clear. It is certainly the case that, at least under most conditions, discharges predominantly occur during the anodic half-cycle, although current does flow in both half-cycles.
However, discharges have been observed in the cathodic half-cycle under some conditions, particularly when the electrolyte is strongly alkaline [172,196–198] and for relatively thick coatings. It is also worth noting that PEO coatings have been produced under conditions in which cathodic discharges predominate. For example, Stojadinovic et al. [54] reported cathodic PEO of Mo. It certainly seems likely that substrate material can become oxidised as readily within a cathodic discharge as within an anodic one. On the other hand, while there have been suggestions about this [199,200], the mechanism of charge transfer during the cathodic part of the cycle, in the absence of cathodic discharges, is often rather unclear. A likely one, however, is simply the discharge of hydrogen ions (protons), leading to evolution of hydrogen gas – see Section ‘Gas evolution’. Of course, this is unproductive in terms of coating growth, although it is possible that the associated charge redistribution could help promote the anodic discharges in some way. The fact that cathodic discharges appear to be favoured by strongly alkaline electrolytes (and by the coating already being relatively thick) may relate to inhibition of hydrogen gas formation (respectively via a shortage of protons and a greater difficulty in moving them through the coating).
In practice, PEO processing is conventionally carried out using AC, with most coatings, both in research work and in technological usage, often being produced at 50 or 60 Hz (although higher frequencies are becoming more popular). The cycle period is thus commonly about 20 ms, which is sufficiently long to allow extended cascades during each (anodic) half-cycle. There is considerable interest in how the process changes as the supply frequency is increased, such that the cycle period is no longer large compared with the inter-discharge period, or the discharge period itself. There are several reports [22,201,202] that an increase in the supply frequency (with maximum values usually around 1.0–1.5 kHz) leads to a reduction in coating growth rates, although it must be recognised that others have reported different effects [24,203,204] and, as with many aspects of PEO, there is considerable complexity and scope for extraneous factors to exert an influence. There have also been reports that the coating microstructure becomes finer and denser as the frequency is increased, which might be regarded as beneficial.
It is clearly of interest to examine the effect of frequency on the (small area) current . Figure 22(a) shows a typical (square wave) voltage profile during a single 50 Hz cycle (i.e. over a period of 20 ms), at a stage when the coating thickness was about 50 µm. It can be seen that the anodic voltage was ∼600 V, while the cathodic voltage was ∼125 V. Figure 22(b) shows corresponding currents, both the total and that through the small area sample. Apart from short initial transients, the total current was just above 2 A throughout both anodic and cathodic half-cycles (corresponding to the pre-selected current density). The cathodic current through the small area is consistent with the total current (taking account of the area ratio between small and large samples, and also the greater significance of edge effects for the small sample). This suggests a cathodic process that is smooth and continuous, such as might be expected for conversion of protons to hydrogen gas. In contrast to this, the anodic current is made up of a series of current pulses corresponding to discharges. Synchronised profiles of voltage and current (bulk and small area) during PEO of an Al alloy, for supply frequencies of 50 Hz (a and b) and 2500 Hz (c and d).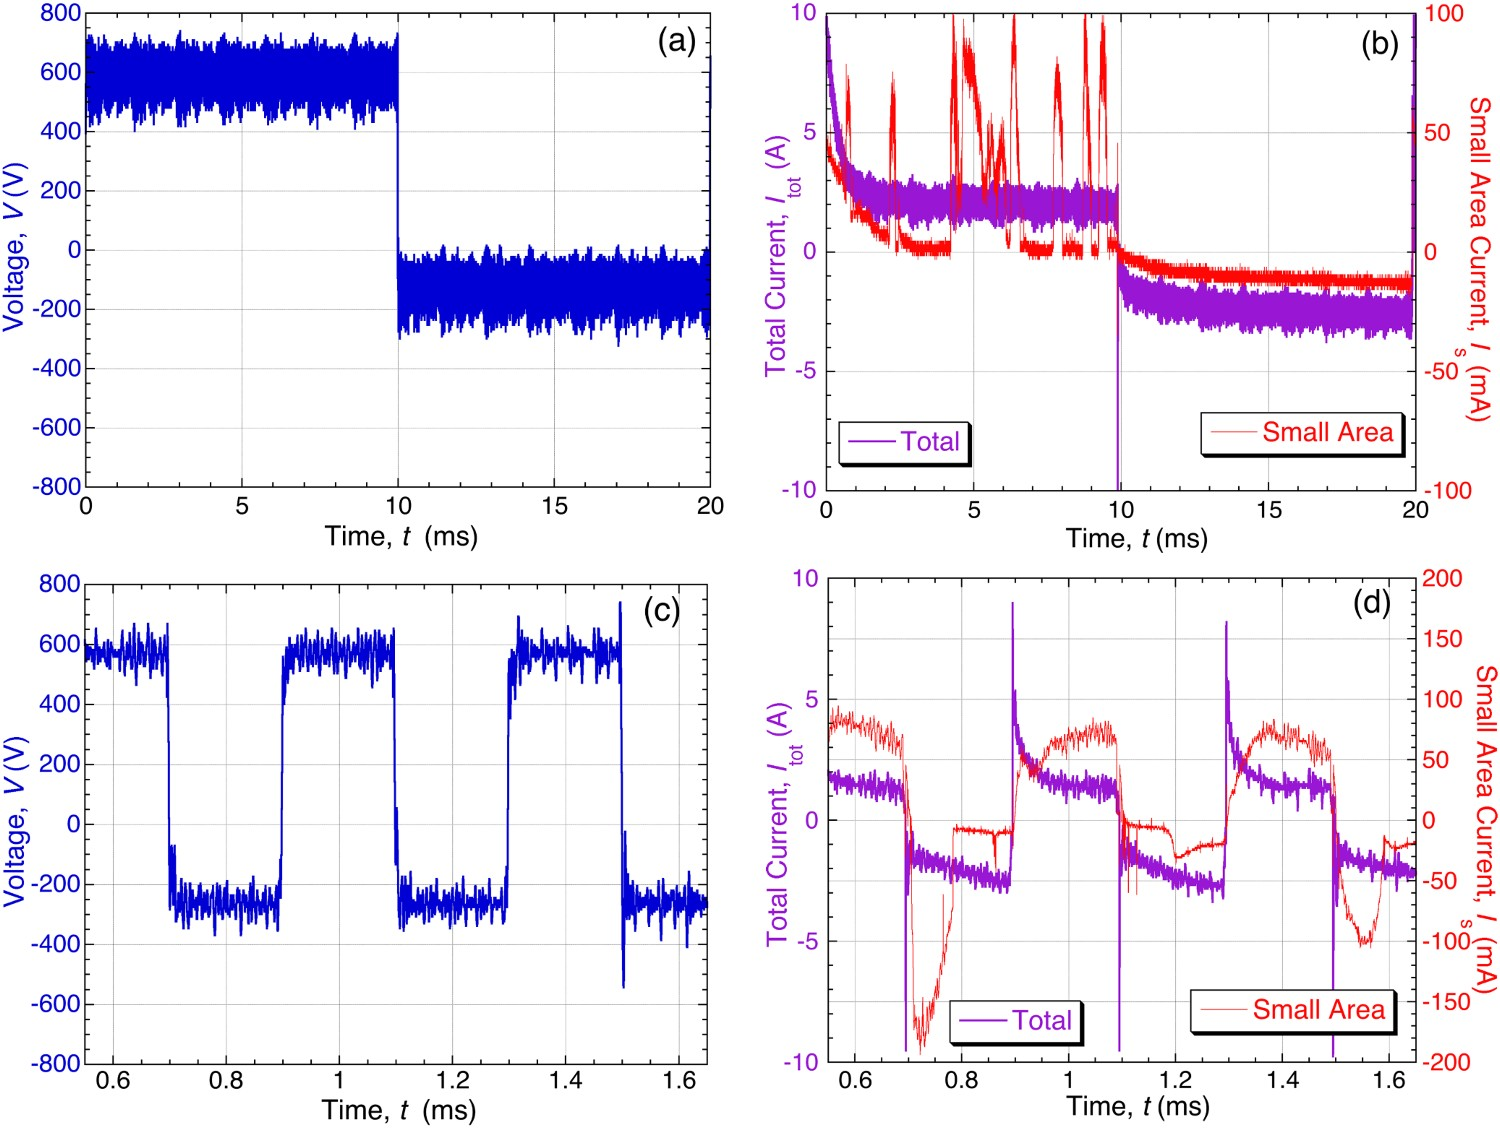
As the supply frequency was increased, and the half-cycle period started to approach typical lifetimes of the discharges, changes were observed in the nature of the voltage and current profiles (although, as with the 50 Hz case, there were some cycles in which no discharges occurred on the small sample). Figure 22(c) and (d), which show profiles from experiments carried out at 2.5 kHz, illustrates these changes. The half-cycle period is now 200 µs, similar to a typical discharge lifetime. The voltage profiles (Figure 22(c)) are similar to those at 50 Hz (Figure 17(a)), except that the cathodic voltage has risen to about 250 V, compared to 125 V at 50 Hz, while the anodic voltage remained unchanged at about 600 V. This suggests a switch to a cathodic process that requires a larger driving force. It is also clear from the current profiles (Figure 22(d)) for the small area that changes have occurred in phenomena occurring during the cathodic part of the cycle. While the anodic discharges are still taking place (with approximately unchanged lifetimes, of the order of 100–200 µs – now occupying most of the half-cycle – and also similar current levels of ∼50–100 mA), there are now clear current pulses in the cathodic part of the cycle as well. Moreover, some of these pulses rise to higher current levels than those of the anodic discharges, with peaks approaching 200 mA. Their lifetimes are similar to the anodic pulses, although with an apparent tendency to be slightly shorter (<∼100 µs).
Confirmation that these cathodic pulses correspond to discharges is provided by high-speed photography observations, with the images in Figure 23 showing that light emission accompanies both anodic and cathodic pulses. It also appears that, as for the anodic discharges, those in the cathodic half-cycle also occur in spatially localised ‘cascades’, although the two types of discharge occur in different locations. This is unsurprising, since the periods between discharges in a cascade are thought to be required for re-filling of the pore by electrolyte, so that the site would not be available for a cascade of the opposite ‘sign’ (during high frequency operation). Set of stills from a high-speed video taken during PEO processing at 2.5 kHz, with the times corresponding to those in Figure 22(c) and (d).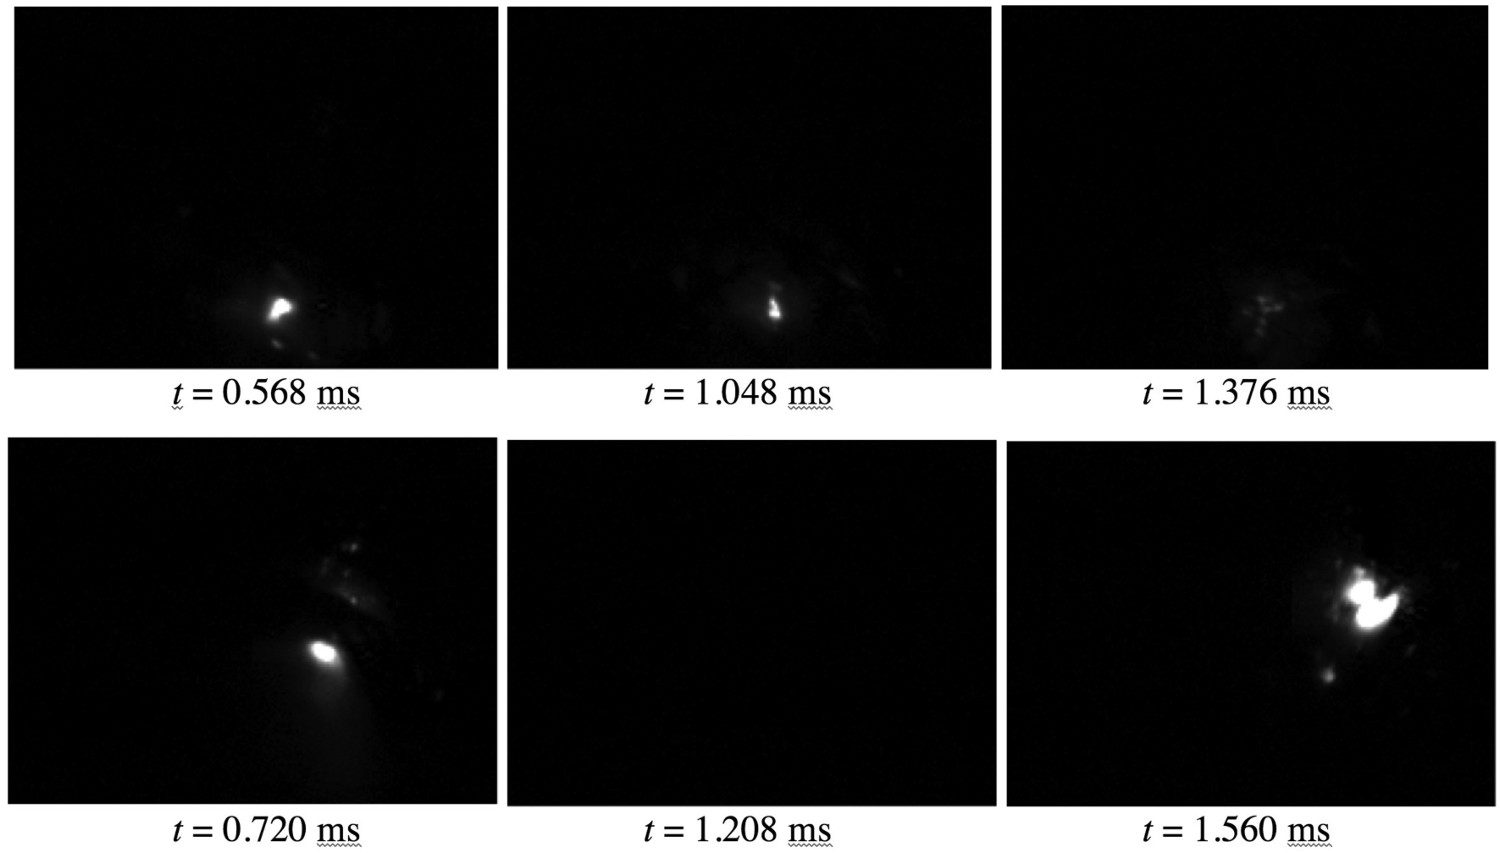
There may be potential for increased energy efficiency by promoting discharges in the cathodic part of the cycle, since it seems likely that these will lead to coating growth, whereas hydrogen evolution will not do this (and is also potentially hazardous). The issue of energy efficiency is addressed in Section ‘Energy consumption’.
Over recent years, increasing attention has been paid to the so-called soft-sparking or soft’ regime during PEO [24,63,184,200,205–212]. Normally, as the thickness of a PEO coating increases, the through-thickness electrical discharges become more intense and longer-lived. This often places an upper limit on the thickness of PEO coatings, since intense discharges start to destroy the coating. However, under certain conditions, termed the soft regime, it appears that this can be avoided and coating microstructures can be improved.
In such cases, the process starts conventionally, but, once a certain coating thickness or processing time has been reached, a reduction is observed in the applied potential (under constant current conditions [63]– see Figure 24) and the discharges become almost invisible (although coating growth continues). This is illustrated [205] in Figure 25 – note that (d) has an integration time longer than (a)–(c) by a factor of 200: clearly, the quantity of light being emitted is much less in this case, although it can be seen in Figure 25(d) that there still appear to be preferred locations for its emission. This ‘soft’ regime was first studied by Jaspard-Mécuson et al. [205], who asserted that the ratio of anodic to cathodic charge (termed the charge ratio, R) must be less than unity for the transition to occur. This does appear to be an important factor, since virtually all subsequent studies concerning the soft regime report using larger cathodic than anodic rates of charge transfer, although it remains unclear why this is needed. Additionally, the transition to the soft regime apparently occurs sooner for higher current densities and higher AC supply frequencies [24], and also as the electrolyte gets older [39]. The literature is largely focused on Al, but there are also reports for Mg [184], Zr [89,213] and pre-anodised Al [207,208]. The concept of a pre-anodised layer on Al is of interest, since as it apparently accelerates the transition. This may constitute evidence that coating thickness plays an important role in the transition. It has also been suggested that this pre-anodising step apparently reduces the overall energy consumption. Evolution of the anodic voltage over the process duration under standard conditions (termed arc regime) and soft regime conditions, with the transition to soft regime indicated by the dashed line [63]. Side-view photos [205] of aluminium alloy samples at a different time during PEO processing (R = 0.89). The integration time was between 8 and 10 ms for photos (a–c), but 2000 ms for photo (d).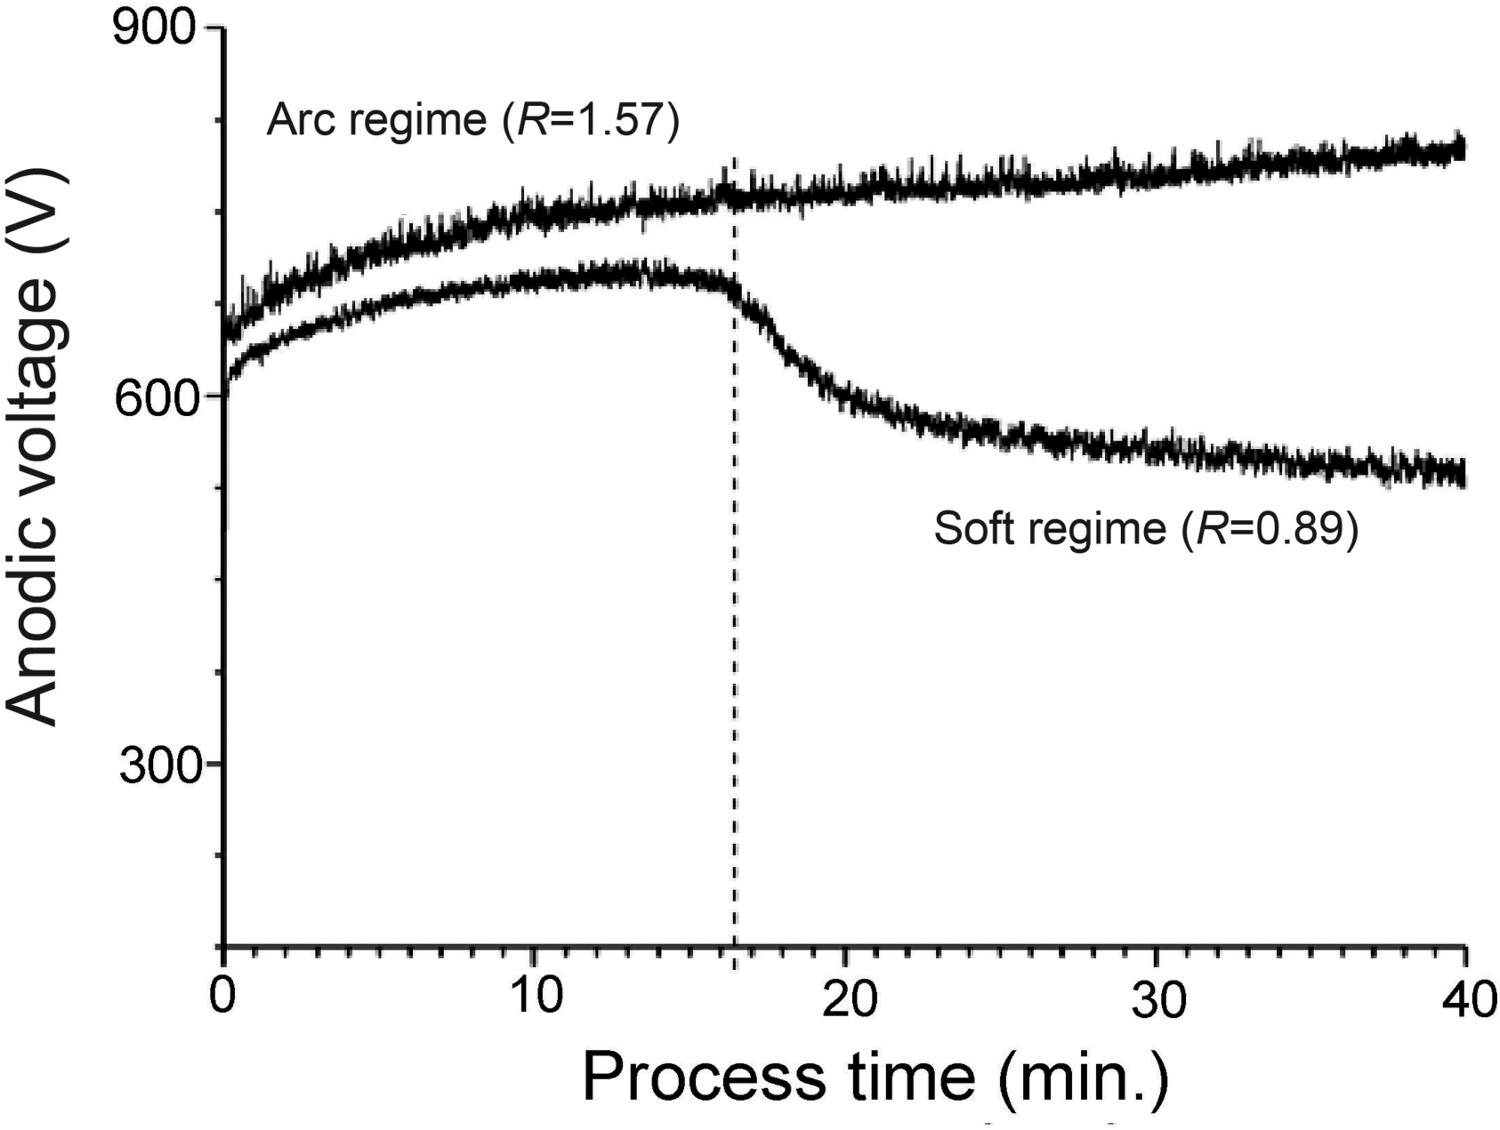
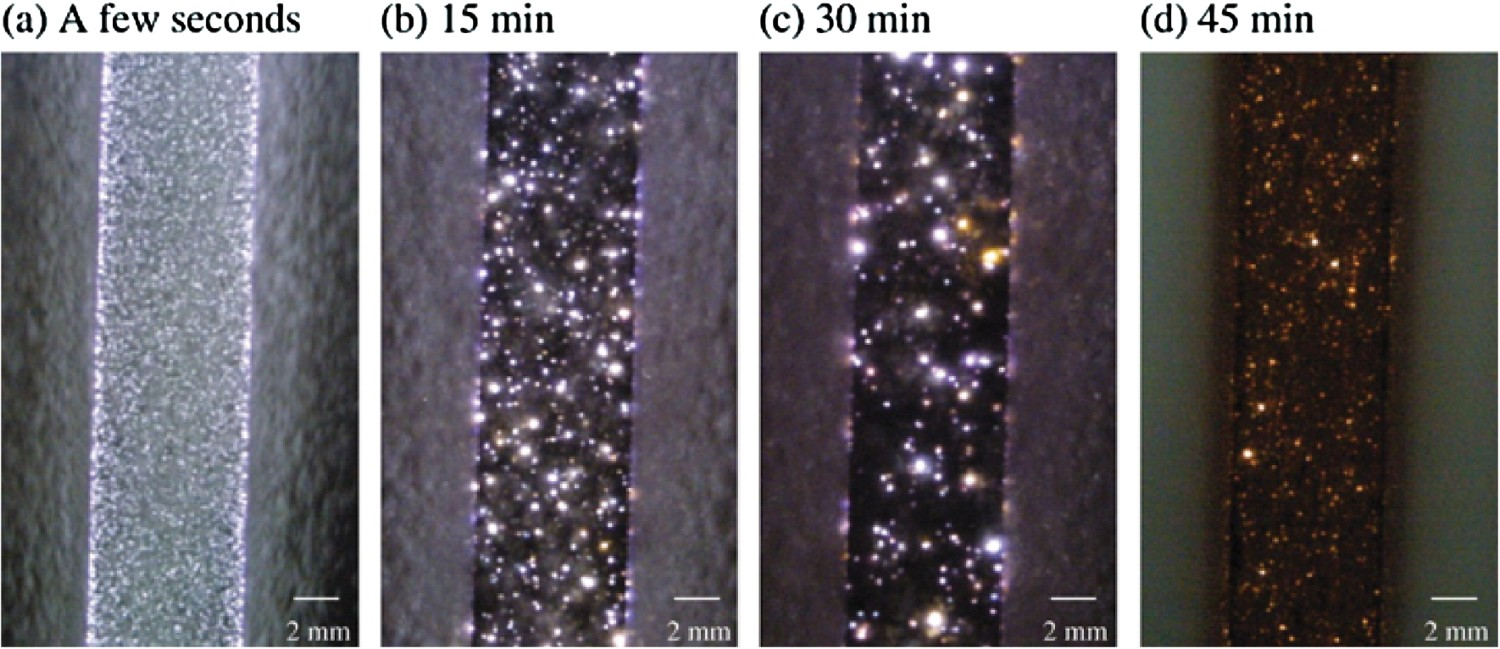
Polished cross-sections of these coatings do not appear to exhibit large through-thickness pore channels, although examination of these microstructures on such sections can be misleading, due to the effects of the polishing. More convincing is the observation that the diameters of ‘melt-pools’ formed around discharge channels remain approximately constant [205] after the soft regime has been established (whereas, under standard conditions, these diameters tend to increase linearly with processing time). In a tracer study [209], it was found that all new coating growth occurred at the substrate-coating interface after the transition to lower applied potential occurred, which would explain why the melt-pool diameters on the coating-free surface remain constant. The reduction in the applied potential during the transition to the soft regime suggests that the power consumed during processing in the soft regime should fall. Interestingly, the growth rate of the coating actually appears to increase after the transition [205], although there is no doubt that more work is needed to confirm such effects, partly because the techniques used to measure coating thickness are often rather inaccurate.
Clearly, this transition could be of considerable industrial interest, since one of the major issues with PEO is its relatively high energy consumption – see Section ‘Energy consumption’. In fact, data have been published that give information about such a reduction in rates of energy consumption as the soft regime is entered. Figure 26 shows how the reduction in anodic potential that accompanies the onset of the soft regime occurs earlier when R is lower, and also plots the associated reduction in specific energy consumption rate [210]. It can be seen that there is a significant fall (of around 40%). None of these publications, however, has presented a mechanistic explanation of how or why the process is taking place differently in the soft regime. Furthermore, it does need to be convincingly confirmed that the rate of coating growth does not fall as the soft regime becomes established. Plots of data [210] obtained during PEO processing of Al at 50 Hz, with a fixed anodic current density of 10 A dm−2 and four different values of R (ratio of anodic to cathodic current densities), showing (a) anodic and cathodic voltages needed to maintain these current densities and (b) corresponding rates of energy consumption, per unit volume of coating produced.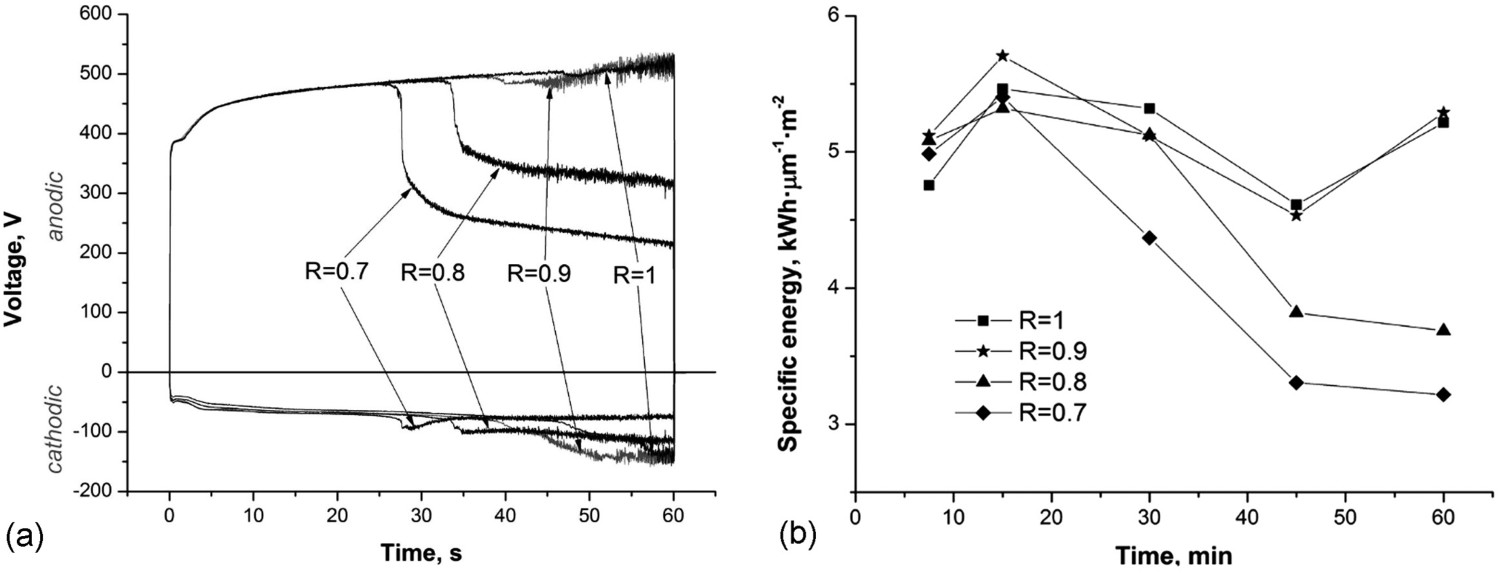
A possible explanation for the soft regime is that a large number of small discharges are taking place at the metal/oxide interface, but these are not developing in the way that they normally do, and so do not reach the free surface of the coating (such that there is little or no light emission). This is, however, not entirely consistent with information such as that in Figure 25(d) and it is clear that further study is needed. At present, it is unclear whether such (small) individual discharges can be identified in some way (e.g. using the small area monitoring technique) or even whether they are anodic and/or cathodic. Also, there is no explanation so far of why raising the potential (or the charge flow) in the cathodic part of the cycle should stimulate this transition, or any indication of the effects of changing the electrolyte composition (e.g. the pH). It may also be noted that suggestions have been made [200] to the effect that the soft regime may represent a reversion to the growth mechanisms that predominate during anodisation. In summary, however, it cannot at present be said that the ‘soft regime’ is well characterised. Reliable guidelines for ensuring that operation takes place in this regime are not yet available and the potential benefits have not been confirmed or systematically exploited. It seems unlikely that this will be possible until it is much better understood.
While these figures are necessarily very approximate, it has been estimated [60,61] that a typical discharge energy is ∼1 mJ and that the conversion rate between discharge energy and resultant volume of coating is typically ∼1013 J m−3 (10−5 J µm−3). This can also be expressed as about 3 kWh µm−1 m−2, which are the units used, for example, in Figure 26. It follows that, during a 1 s PEO treatment, with ∼300 localised discharges occurring on the small area sample, about 0.3 J of energy was absorbed there, creating about 3 × 104 µm3 of oxide (cube of side ∼30 µm, or, on a cylinder of diameter 100 µm, an increase in length of about 4 µm). Of course, much of this oxide was probably created near the interface with the substrate and a relatively small proportion ejected through the discharge channel onto the free surface. It is also likely that molten oxide gets injected under the pressure of the discharge into neighbouring inter-connected pores.
A study has been undertaken of the energies absorbed by various phenomena taking place during PEO – melting and vaporisation of substrate, melting of existing oxide coating, initiation and sustaining of the plasma, vaporisation of water, electrical heating of the electrolyte and conversion of metal to oxide (which releases energy, rather than absorbing it). A semi-quantitative graphical presentation of the energetics involved [61] is shown in Figure 27. It can be seen that most of the injected energy is (transiently) absorbed in the form of vaporisation of water, after which it will inevitably end up as rather low-grade (difficult to recover) energy in the form of a large mass of (moderately) heated electrolyte. The energy released by oxidation of the metal is not included in the plot, since its magnitude is small compared with these absorbed energies. Semi-quantitative plot [61] showing how the total (electrically injected) energy changes during the formation of an individual discharge, and how it is converted between different forms during and immediately after the discharge period.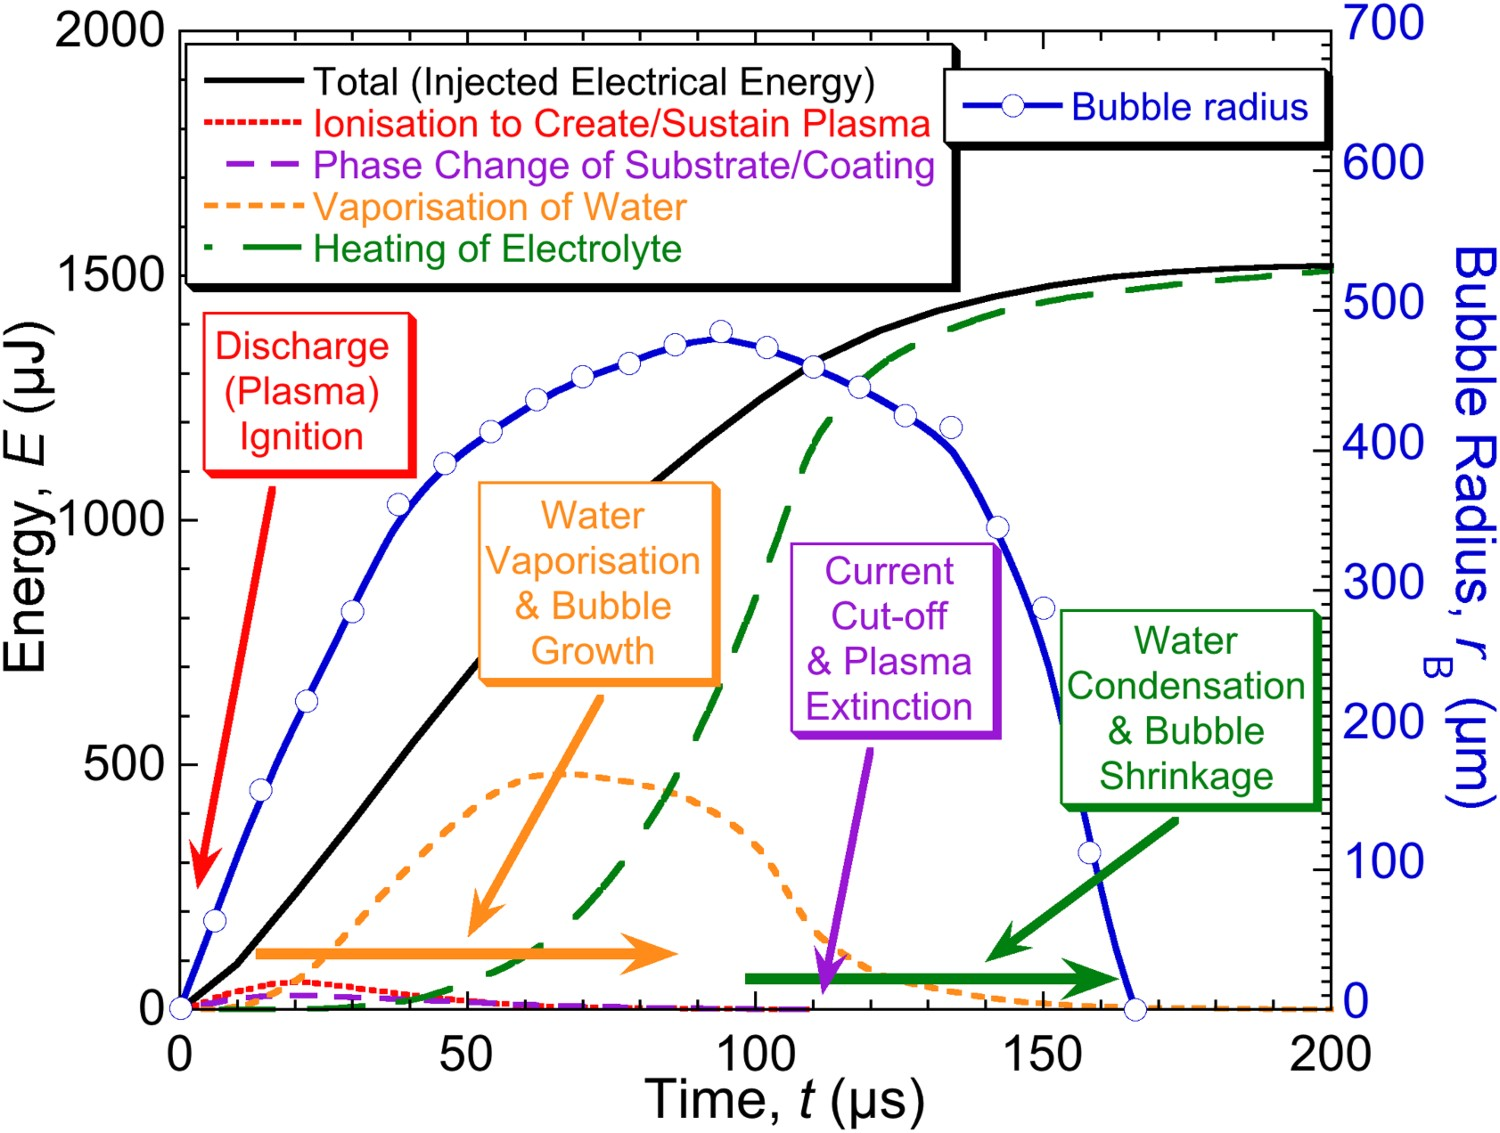
There does not appear to be any immediately obvious way of reducing this energy wastage, although improved understanding of details such as those presented here is certainly of potential value in considering various measures. The basic problem appears to be that exposing the substrate to oxidising agents via these highly energetic discharges is very inefficient, at least under the conditions conventionally employed. There have been studies [66,214,215] aimed specifically at energy efficiency, and one or two suggestions made about measures, such as the use of a grid cathode [216], that could be helpful. The most promising approach is probably to somehow reduce the energy associated with each discharge (while retaining a similar rate of transformation of substrate), possibly by reducing the voltage needed for it to occur, or to promote more transformation per discharge (while retaining a similar discharge energy). Further study of the details of the energetics of the process is clearly likely to be helpful in pursuing such aims.
The PEO process has constituted a recognised coating technology for well over 30 years and has been in significant commercial use for most of that time. It has a number of characteristics that make it almost unique, and potentially very attractive. One of these is that the process involves a continuous restructuring of the coating throughout its thickness, tending to reduce residual stress levels and improve its through-thickness homogeneity. Another is that, since coatings are created via partial consumption of the substrate, they tend to exhibit excellent interfacial adhesion. On the other hand, the resultant coatings are certainly not free from what might be regarded as defects – indeed, they tend to contain a lot of porosity, microcracks, inclusions, etc. These arise from the inherent nature of the process, which involves the repeated formation of plasma discharges through the thickness of the existing coating, with new coating material being created as they collapse, after which it is rapidly injected into surrounding regions. These events are highly transient and create rapid cooling and high thermal gradients, so it is unsurprising that the coating microstructure should be disordered and metastable. However, the effects of these microstructural features are largely beneficial. The porosity confers a low stiffness and hence a high strain tolerance, which (in combination with the good interfacial adhesion) leads to excellent spallation resistance. Moreover, while they tend to be porous and compliant, PEO coatings often have a high hardness and exhibit good wear resistance. They are also excellent keying surfaces for further treatment, such as painting and adhesive bonding, or for particular types of functionality, such as catalytic or biomedical activity.
It is also important to recognise that the PEO process is a very versatile one. There are many process variables, most of them associated with the composition of the electrolyte and the parameters of the electrical supply. These variables can have profound effects on the coating microstructure, hence influencing important characteristics such as colour, texture, hardness, permeability and specific surface area. There is therefore enormous scope for tailoring PEO coatings to their planned functionality. There are, however, certain challenges involved in expanding their usage to fulfil such promise. A key one, central to the objectives of this review, is to obtain an improved understanding of the process–microstructure–property relationships, which are probably less well understood in the PEO area than in virtually any other type of processing technology in commercial use. The main hurdle here concerns the pivotal role of the individual discharges, which are highly complex, short-lived events. Background knowledge from various fields (plasma physics, electro-chemistry, electrical engineering, transport phenomena, heat transfer, etc.) is required in order to obtain a full picture of their influence on process characteristics and on coating structure and properties. There is no doubt that, while progress is being made, the current picture is in fact far from complete. Nevertheless, the transition from a purely empirical selection of conditions for particular requirements to an entirely logical design procedure is well under way. This should in due course allow various types of systematic optimisation, reduction of energy consumption, tailoring of coating properties, etc., leading to considerably expanded usage.
Footnotes
Acknowledgements
PEO work in the Gordon Laboratory in Cambridge has been supported over several years by EPSRC (notably via grant EP/I001174/1), a Sims Scholarship (for SCT) in Cambridge University and Keronite plc. The latter collaboration has included extensive interactions and discussions with Keronite personnel, notably Robin Francis, Steve Hutchins and Suman Shrestha. Particular thanks are due to Mike Coto, a Keronite employee who works closely with University personnel in several areas. Collaboration with the groups of Gerard Henrion (Nancy) and Allan Matthews (Manchester) has also been fruitful. The authors are also grateful to Matt O’Hara, of the Materials Science Department in Cambridge, for helpful discussions and recent contributions to the experimental programme.
Disclosure statement
No potential conflict of interest was reported by the authors.
1
It should be recognized that this is not a purely thermodynamic issue. Oxide formation can only occur when the plasma temperature has become relatively low (perhaps <∼3000 K, depending on the metal and its concentration) and at this point it is being rapidly quenched, perhaps passing through the temperature range concerned in a time as short as ∼10 µs. The kinetics of combination is therefore important. Of course, the presence of an excess of a competitor with a higher affinity for the oxygen, such as hydrogen in the case of some metals, will certainly slow down the kinetics of formation of the metal oxide and may inhibit it completely.
2
Flow of ions through the oxide layer during anodization requires a very high field, and hence can only occur if it remains very thin (few nm). While it is common to depict this layer as if it has a significant thickness, it should be borne in mind that it must in fact be considerably thinner than the scale of the column structure.