
Abstract
Dissimilar metal welds (DMWs) between ferritic steel grades are found extensively in the construction of thermal power plants. The potential combinations and approaches for joining dissimilar ferritic steels are nearly limitless. For DMWs, the difference in alloy composition (specifically chromium and carbide-forming elements) provides the main driving force for carbon diffusion during welding, post-weld heat treatment and long-term service at elevated temperatures. Since the high temperature creep strength of local, carbon-denuded zones can be dramatically reduced from that of the parent or filler material, the service performance of ferritic DMWs can be severely reduced. This article reviews experimental observations on microstructural evolution in dissimilar ferritic welds, activities to describe the observed phenomena by modelling and simulation and discusses the performance of these welds at high temperature. Lastly, a well-engineered approach to the design of ferritic DMWs is discussed in the context of thermal power plants which are subject to damage by creep.
Introduction
The complexity of issues used in design and manufacturing practice in power boilers and piping necessitates the use of components made from different steels and with different geometries. These variations mean that the pressure boundary fusion welds involved are frequently used in locations of transitions in component dimensions, microstructure and properties. Dissimilar metal welds (DMWs) between ferritic and austenitic steels frequently receive attention because these joints involve significant local changes in physical, mechanical and fracture properties. However, particularly for components which must operate for long times at high temperature (i.e. in the creep regime), joints between different ferritic steels also introduce technical challenges [1]. These challenges are detailed in the present review for the ferritic to ferritic DMWs which are widely used in the construction of thermal power plant components and in the processing industry.
Failures in DMWs have been documented as early as the late 1930s [2]. In these early cases, the premature failure of transition joints was observed in cases where mild steel drums had been welded with austenitic stainless steel filler metals to avoid post-weld heat treatment (PWHT) [2]. The differences in chemical composition, especially the difference in chromium contents, were identified as just one of the several key driving forces for diffusion governed processes leading to premature failures of these components [3].
In the modern power plant, it is possible to have thousands of joints where low-alloyed steels are joined to high-alloyed ferritic grades, such as creep strength enhanced ferritic (CSEF) steels. CSEF steels can possess either a ferritic, bainitic or martensitic microstructure which is stabilised by a controlled distribution of precipitates. A complete listing of commonly utilised ferritic materials in the power generation industry is provided in Table 1. Realistic examples and common scenarios where ferritic DMWs are constructed in thermal power plants are provided below; this list is not meant to be inclusive. It is, however an illustration of the magnitude of ferritic DMWs in existing power stations.
Tube to tube butt welds: In replacement tube pendants, the designer may take advantage of higher stress allowable values and better steamside and fireside corrosion resistance of T91 versus T22. This would necessitate a ferritic DMW to join the hundreds or thousands of tube to tube connections. In a similar approach, designs for state-of-the-art power stations may use a similar approach and accommodate the newest generation of high chromium, ferritic CSEF steels, such as VM12SHC; this material would likely be joined to T91 or T92.
Waterwall panels: Modern, supercritical and ultrasupercritical power plants may require a transition from typical T12 material to T23 or T24 since the outlet design steam temperature for the waterwall panel in these power plants is on the order of 480°C (900°F). In the case of a modern boiler constructed in the U.S.A., no less than 1340 ferritic DMWs existed between T12 and T23 [4].
Stub to header welds: In state-of-the-art combined cycle power plants, a thick-section Grade 91 header may be ‘stubbed’ with T23. The composite header would undergo a PWHT in the fabrication shop per Code requirements. Once in the field, an as-welded connection between the T23 stub to the T23 material would be allowed (provided the thickness <12.7 mm, 0.50 in.). This approach avoids the requirement of complex and problematic field PWHT.
Static, thick-section components: In several documented cases, legacy power stations in the UK have undergone replacement of CrMoV headers with Grade 91 resulting in a series of thick-section transitions [5]. In new construction, a lower chromium CrMoV material in the steam turbine casing or a valve body may be joined to a 9%Cr CSEF steel material.
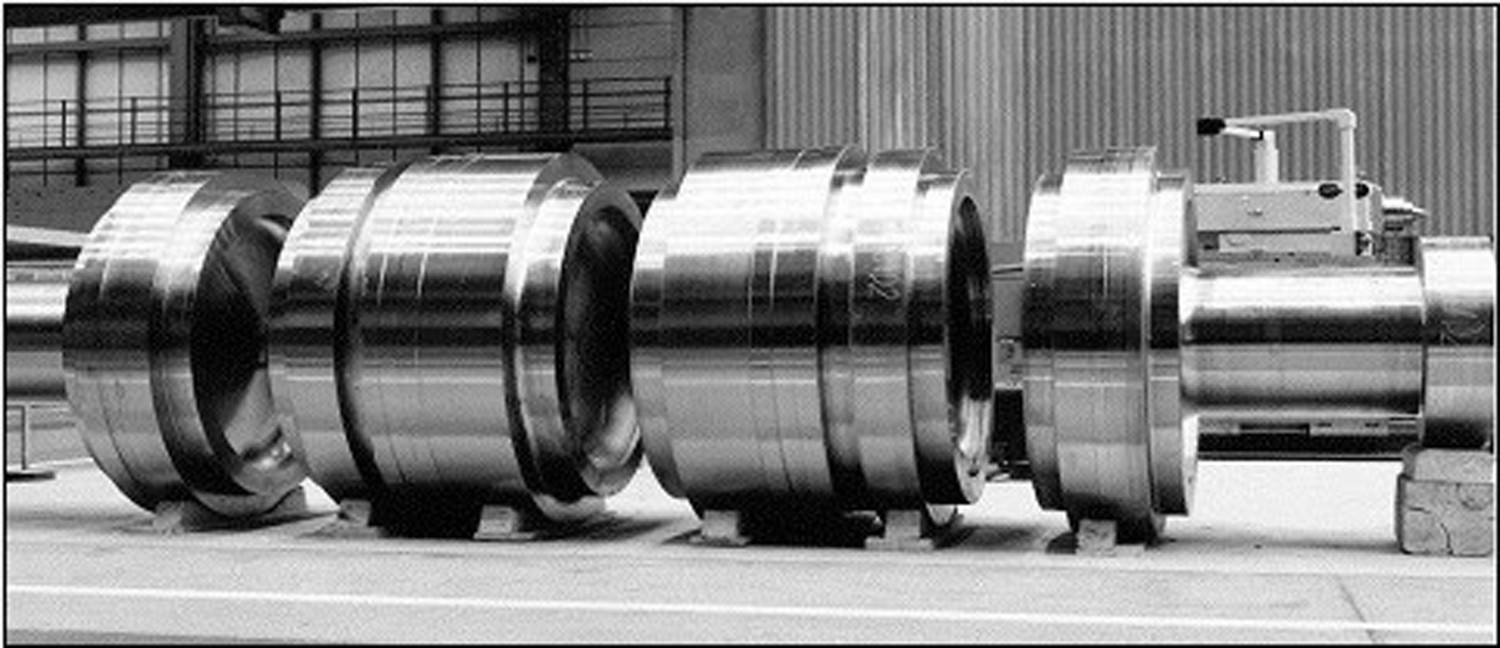
Rotating, thick-section components: State-of-the-art rotor design may incorporate a series of DMWs between CSEF steels such as in Ref. [6]. This concept allows producing a rotor out of forged disks of different steel grades as shown in Figure 1, resulting in a rotor tailored for the individual thermal and mechanical loads experienced in the corresponding section of the turbine. The DMW itself is typically positioned in a low stressed region providing additional confidence in the safety of a welded rotor design.
Practical limitations: In at least one scenario, plate material matching to a Grade 23 header was unavailable to complete fabrication of the component. To complete the component, Grade 91 plate material was utilised facilitating a Grade 23 header to Grade 91 end-cap DMW [8]. Assembly of forged turbine disks of different material grades for the production of a welded turbine rotor [7].
Although a wide range of combinations exist for ferritic DMWs, there is no standard approach to the design and fabrication of DMWs in the power generation industry. This is a direct result of allowable stress values, which are provided for most ferritic materials up to a maximum service temperature approaching 650°C (1202°F), Figure 2.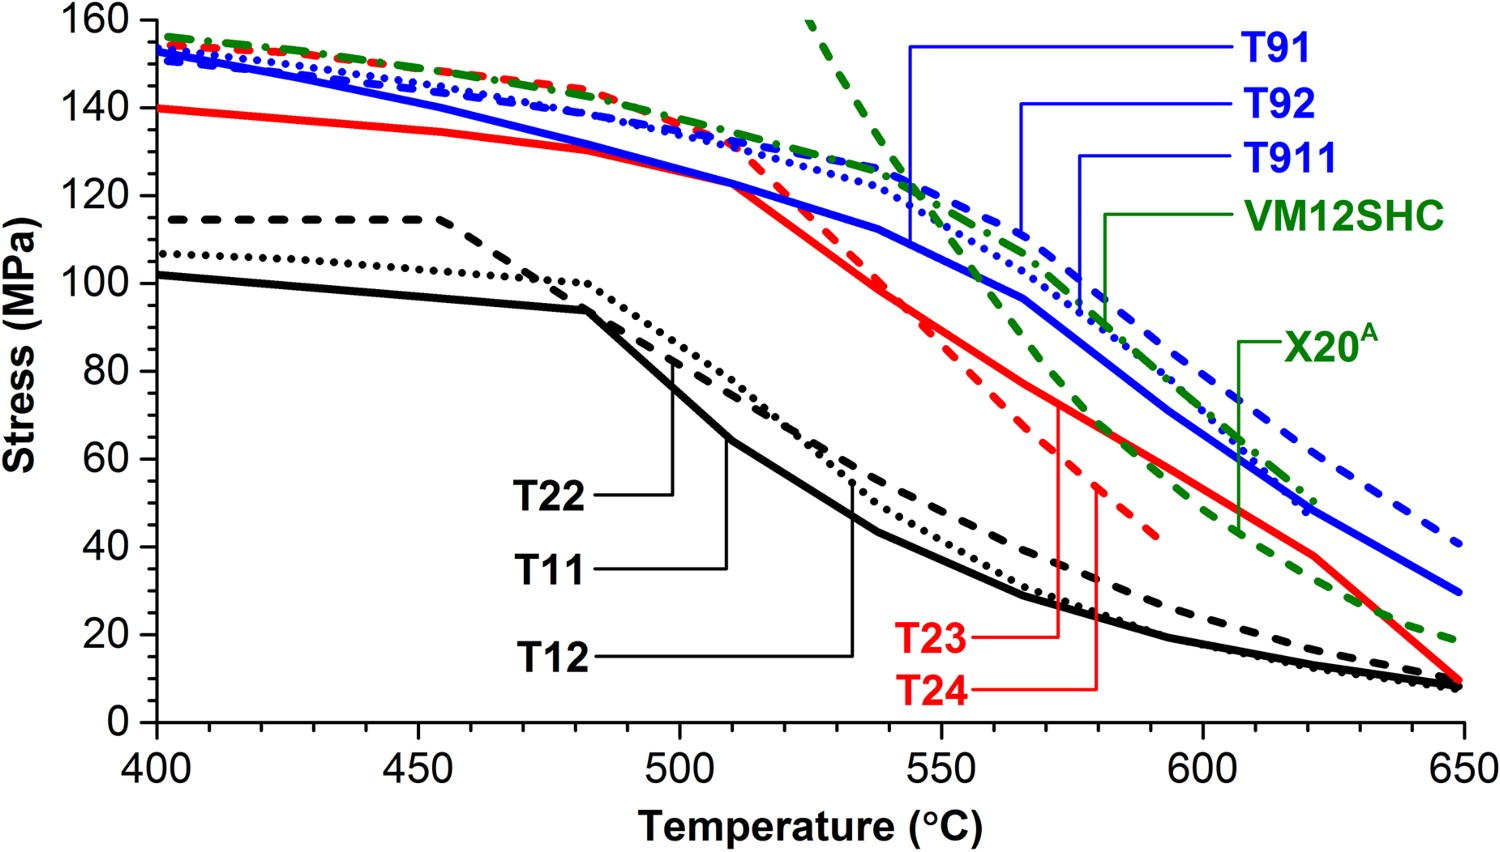
AX20 steel is not approved in ASME B&PV Code. The provided allowable stress values are from the Ref. [16] and based on the allowable stress value for failure in 200,000 h.
Note: Values for Al, Co, Cu, Mn, Ni, P, S, Si not included.
Chemical composition for common filler materials used in the fabrication of low alloy and CSEF steel components.
Note: Nominal composition provided for SMAW consumables [18–21].
The issues concerning ferritic DMWs are not solely isolated to the issue of carbon migration. While the issue of carbon migration is an important consideration, there are a number of key factors which govern the performance of ferritic DMWs for high temperature, creep-dominated failures. These potential factors for consideration in the design and fabrication of a well-engineered joint are provided below and represent the subject of this review paper:
Weldability: The susceptibility to reheat cracking is a real concern, such as in the welding and repair of CrMoV or use of filler materials matching to Grade 23 or 24 [22–28]. In these instances, it may be advantageous to limit the use of materials susceptible to reheat cracking (either in filler metal or as parent material) and take advantage of more creep ductile or martensitic filler materials which exhibit lower levels of welding residual stress [29].
Composition of filler material: Chromium is just one consideration as the additions of Nb, Ti and V stabilise carbon as M23C6, M6C, M2C or MX carbides. During PWHT and service, M2C and MX carbides are more stable and resistant to dissolution. These carbides not only reduce the amount of free carbon in the system, but reduce the recrystallisation in the carbon-denuded zone (CDZ) as they effectively pin grain boundaries [30,31].
PWHT: Higher temperatures and/or longer durations at a given PWHT temperature can accelerate dissolution of carbides and provide the necessary free carbon for migration in service.
Strength of filler metal: A strong filler metal can provide additional constraint on the weakened, CDZ and prolong failure. A similar effect has been noted in materials susceptible to heat-affected zone (HAZ) failure, such as 9%Cr CSEF steels as reported in [32–34]
Combinations of base metal(s) and filler metal: In cases where the parent or filler material is susceptible to carbon migration, the presence of deleterious elements may increase susceptibility to damage.
Design: DMWs are often designed with poor consideration of the application. In many cases, where DMWs are required and especially in piping, materials of dissimilar thicknesses are machined to match the inside diameter dimension without consideration of the service stresses. In poorly designed DMWs, the CDZ may be placed in a region designed to accommodate a higher stress.
End use application: It is important to design DMWs for the expected failure mechanism. Furthermore, and in many instances, it is important to design these components such that they fail in a predictable and/or desirable manner. One such example is that of attachment to header welds. A failure on the header-side of the DMW will create more complex issues in ensuring that the damage has been excavated and increase the complexity of the weld repair. In this scenario, it may be more palatable to match the filler metal of the header to force failure in the less-critical component (i.e. in the weld itself or at the fusion line of the attachment).
It must be emphasised that the approach to welding ferritic DMWs needs to be well-engineered. That is, the developed welding procedure must consider a host of potential issues that are specific to the materials, the application and complexities imposed by the component. Often, researchers attempt to over-simplify the approach and only give specification recommendations regarding the filler metal and PWHT. Doing so ignorantly eliminates potentially important considerations such as those listed above.
This review begins with a brief introduction regarding the fabrication of ferritic DMWs. The microstructural evolution during welding, PWHT and in service are reviewed on the basis of measured and calculated results. Next, the state-of-the-art approaches for the modelling of DMW material couples are reviewed. Expected performance of DMWs is discussed in the context of high-temperature uniaxial creep testing including both time to rupture results and observations of in service failures. Lastly, the review concludes with a description of state-of-the-art approaches currently investigated for reducing or eliminating diffusion of carbon across the fusion line and innovative approaches to damage tolerant design of DMWs. The term ‘DMW’ is used in the context of this manuscript to refer primarily to ferritic to ferritic DMWs unless otherwise noted.
Fabrication of ferritic DMWs
The fabrication of ferritic DMWs must take into account important considerations such as filler metal selection, fabrication sequence including the potential use of buttering, PWHT requirements for the material constituents and the constraints of the application. In some cases, there may be Code-specific criterion which introduces complexities in the qualification of ferritic DMWs (such as the requirement for Charpy impact tests) or allows for relaxation of the allowable PWHT range (depending on the selected filler material).
The power piping systems of many of the 500 MW coal-fired stations which were completed in the 1970s for the Central Electricity Generating Board's fleet in the United Kingdom illustrates many of the long-term challenges. These systems were often manufactured using ½Cr½Mo¼V steels and have now operated for very long times (i.e. ≥design life) at temperatures of around 565°C. Concerns linked to low creep ductility of matching weld metal resulted in very many of the pressure boundary welds being manufactured using a 2.25Cr–1Mo (i.e. American Welding Society designation, -B3) consumable.
It was recognised that the 2.25Cr–1Mo consumables did not fully match the creep strength of the parent but the benefits derived from significantly reducing the risk of brittle behaviour were considered sufficiently important, i.e. it was considered that decisions should balance BOTH strength and ductility. Interestingly, when in service, problems were experienced with these joints and damage was primarily found in the HAZ of the ½Cr½Mo¼V steel. Root cause analysis of this damage, frequently termed Type IV cracking, determined that the weld thermal cycles were such that the intercritically transformed region in the HAZ (i.e. ICHAZ) exhibited the lowest strength.
As time in service increased in these pressure boundary welds, experience showed that the most damage susceptible region of the weldment was in the HAZ close to the fusion boundary. Assessment revealed that the difference in carbon activity had resulted in diffusion of carbon into the 2.25Cr–1Mo weld metal and a carbon-depleted region in the HAZ. This carbon depletion reduced the creep strength below that of the Type IV location. This new damage has been classified as Type IIIA. Interestingly, many of the weld repairs fabricated to remediate damage in these welds were made using a dissimilar Ni-based consumable [35–37]. The rationale behind introducing this transition weld was that repairs could be made without PWHT. Although often identified as temporary many of these welds operated for long times with no recorded damage being found.
Recently, the complexity in joining ferritic to ferritic DMWs has been highlighted by the need to manufacture pressure boundary welds between low-alloy steels and 9Cr–1Mo–V CSEF (Grade 91) steels. What is clear is that this type of joint cannot be made by simply selecting ‘matching’ consumables. There are at least seven different approaches which have been examined in the literature, these are summarised in Figure 3 and Table 3 [5,38,39]. Possible configurations of ferritic DMWs between low and high chromium ferritic steel grades. Note: Descriptions accompany Figure 3.
aFor reference, the AWS specification for the SMAW electrode is provided in parenthesis.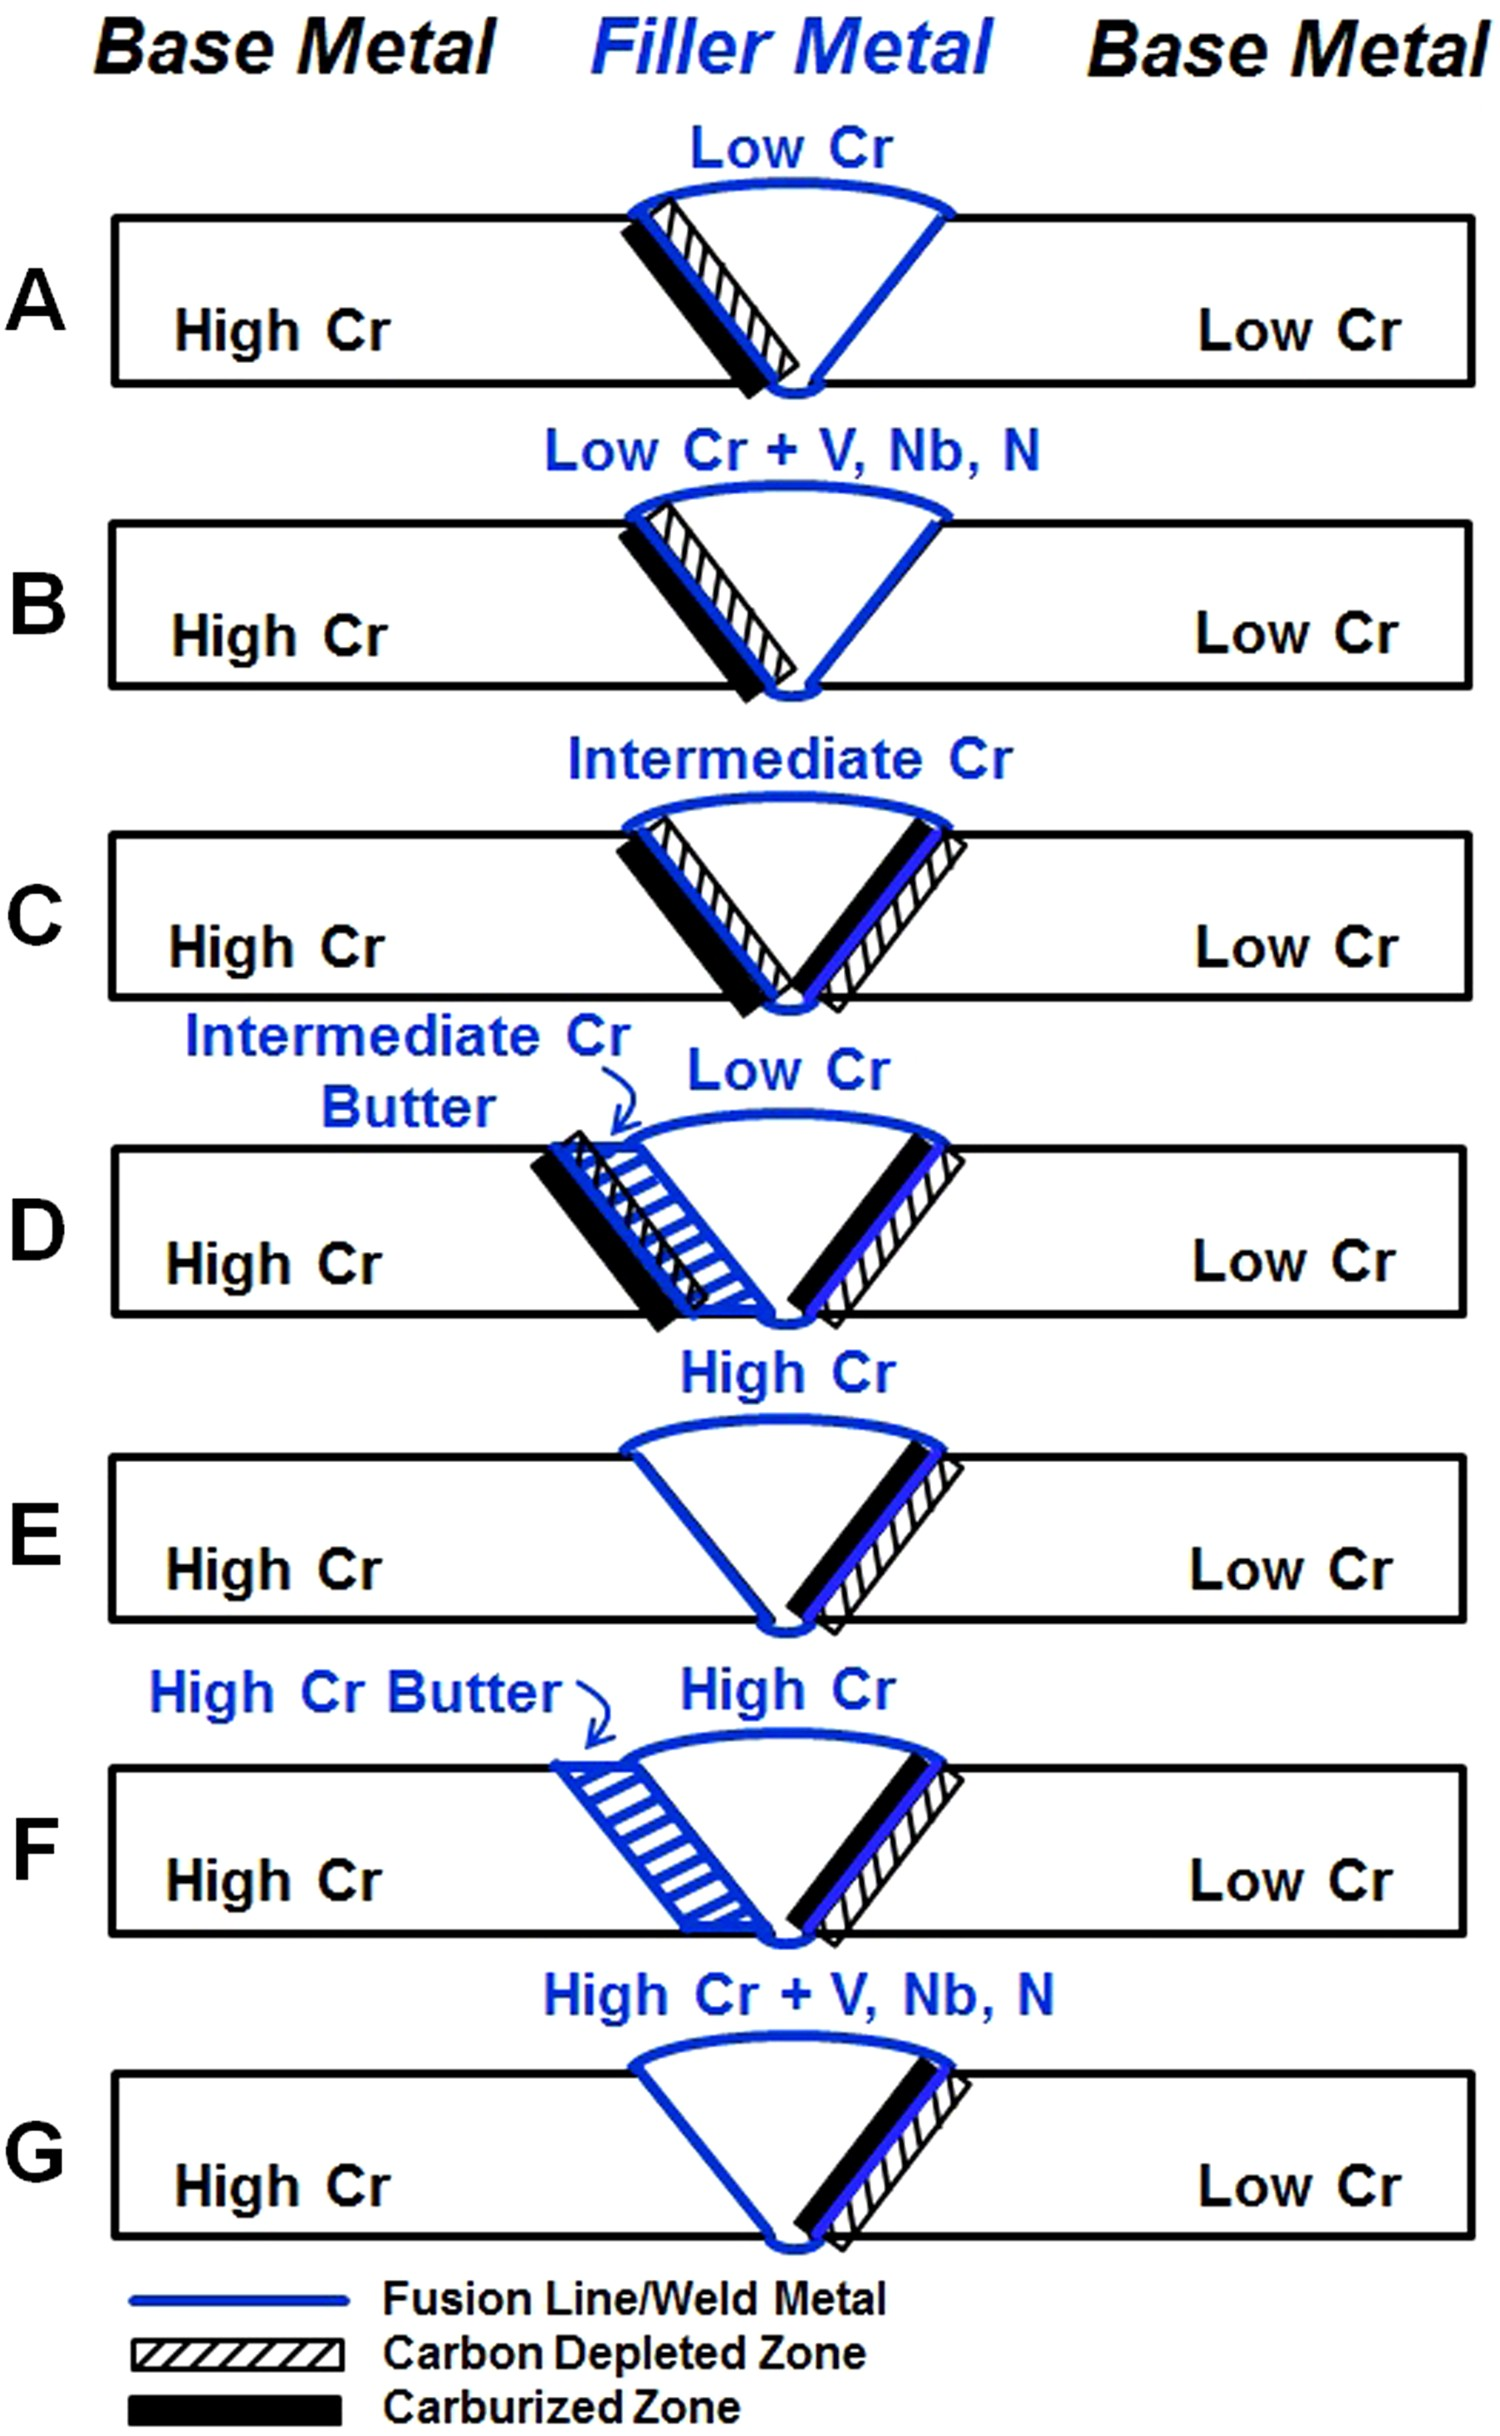
Interestingly, most Codes of Construction do not provide explicit recommendations or requirements for filler metal selection when welding ferritic to ferritic DMWs. Thus, although guidance exists from some filler metal manufacturers, there is little consensus regarding ‘best practice’ so that the end-user or fabricator often use different approaches. This lack of consensus is one reason for the variation in reported behaviour.
The following bullet points summarise issues which are involved in the decision-making process: When using a filler metal matching to the lower alloy material, the steepest gradient in chemical composition and therefore the location of interest is between the high Cr base material and the low Cr filler metal. On the opposite side of this weld, the low Cr filler will connect to the low Cr base material. The matching chemistry will result in similar microstructures and a low driving force for changes during exposure to elevated temperatures. If a filler metal matching to the higher alloy material is used, the fusion line between the low Cr base material and the weld metal is of special importance. On the opposite side of this weld, the high Cr filler will connect to the high Cr base material. The matching chemistry will result in similar microstructures and a low driving force for changes during exposure to elevated temperatures. For weldments made with an intermediate Cr content, such as a 5Cr–1Mo (e.g. E8015-B6) filler for a joint between a 9Cr and 2.25Cr base metal, there will be a gradient in chemical composition at both fusion lines. The rate of diffusion on either side of the weldment will be governed by the difference in carbon activities; this attribute is not only a function of the Cr content but also of alloying additions such as Si and carbo-nitride formers (i.e. Ti, V and Nb).
One significant factor linked to the selection of the filler material is related to the requirement for PWHT. As shown in Figure 4, in select cases, such as welding Grades 11/12 to higher alloyed ferritic steels there may exist no overlap between materials which may need to be welded together. This is particularly important regarding the welding of thick-section components (i.e. >12.7 mm, 0.50 in.) where PWHT is always required for the listed materials in Figure 4 (note that in many Codes of Construction exemptions for PWHT may exist for the fabrication of thin-section components).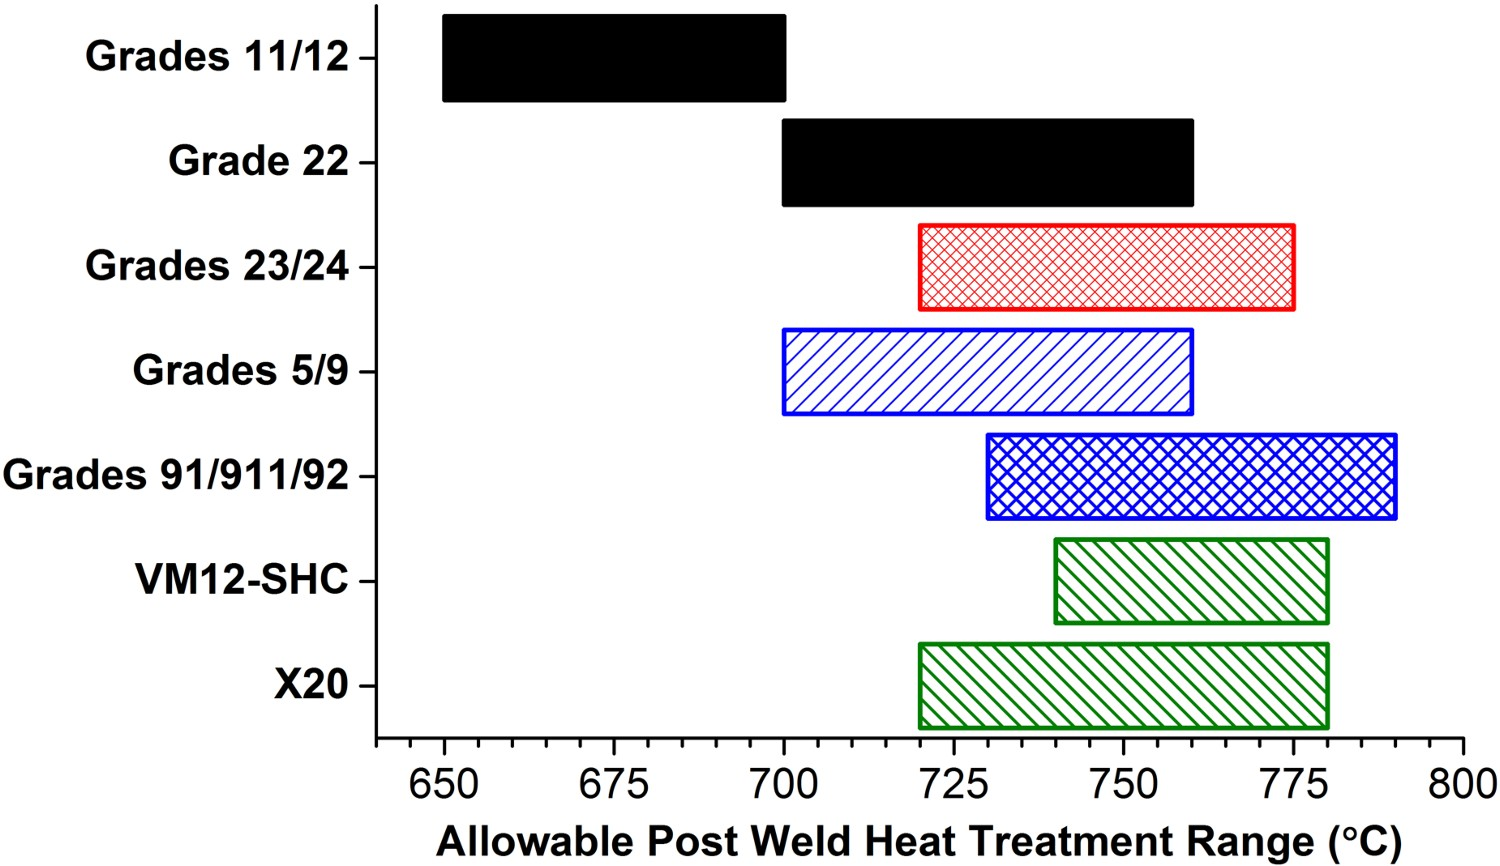
In the example of welding Grade 22 to Grade 91, the use of a 9Cr–1Mo electrode (E8015-B8, Table 2), highlighted in Figure 3(F) and Figure 5, allowed the Grade 91 component to be buttered in the fabrication shop and subcritically post-weld heat treated within the Grade 91 allowable range (760 ± 10°C, 1400 ± 6°F). Example of a ferritic to ferritic DMW between P22 and P91 using E8015-B8 filler material as a buttering layer and E8105-B8 for the fill passes.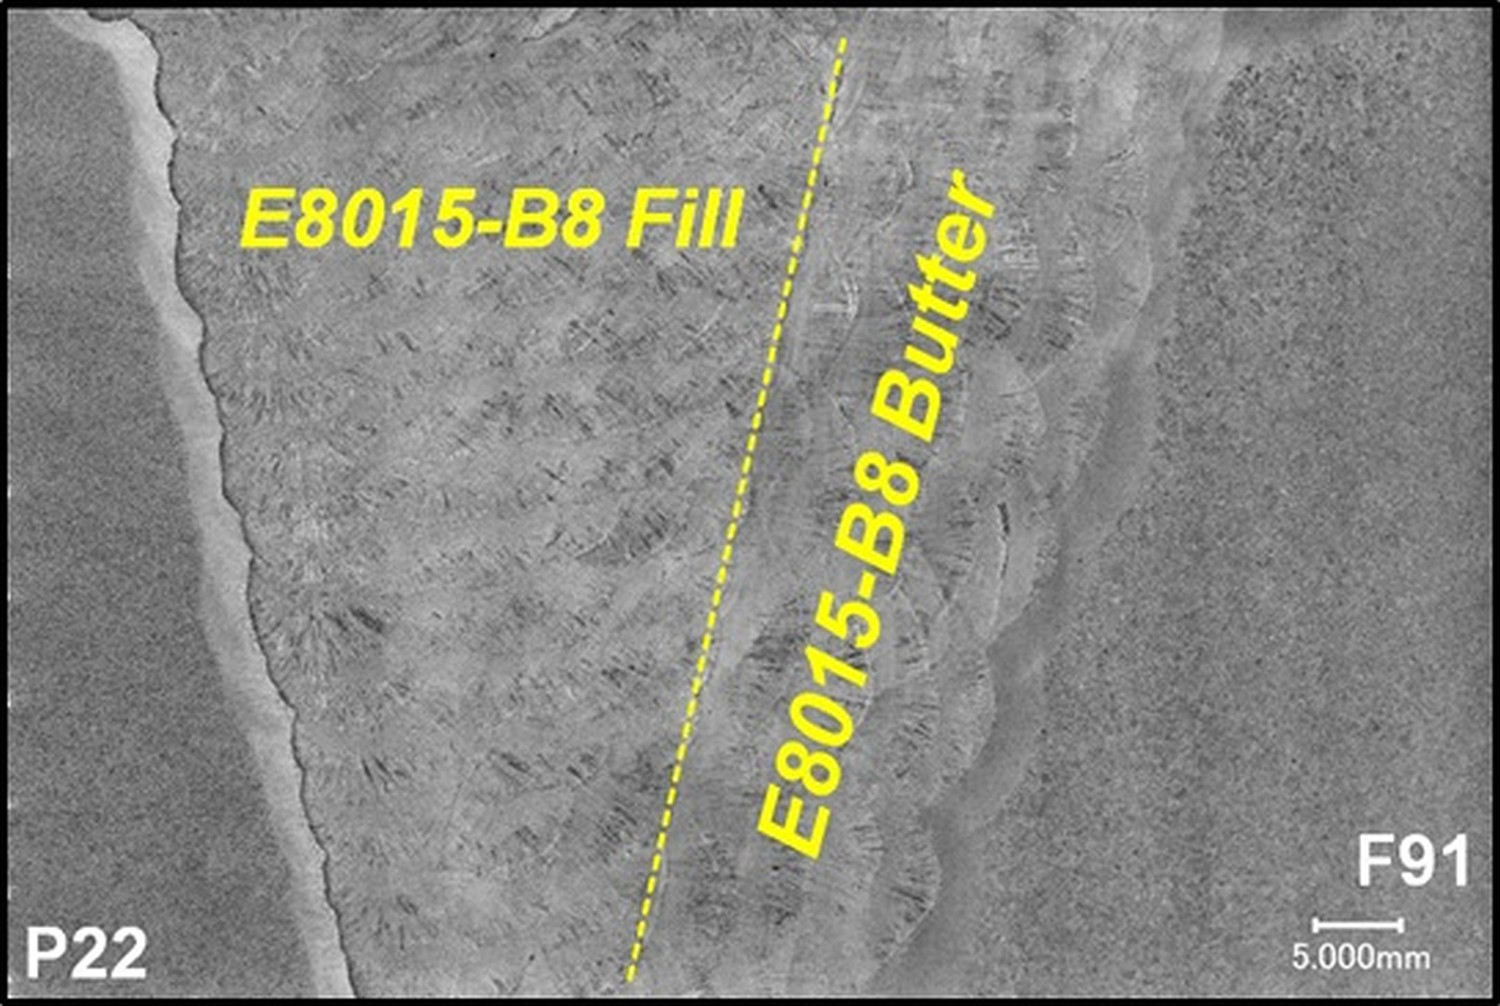
The buttered Grade 91 was then welded in the field to the Grade 22 and given a reduced PWHT within the allowable range for Grade 22 of 720 ± 20°C (1328 ± 11°F). The amount of carbon diffusion between the Grade 91 steel and the 9Cr–1Mo filler metal should be low. Furthermore, and because the 9Cr–1Mo filler metal does not have deliberate additions of carbo-nitride formers, the use of a lower PWHT to the Grade 22 steel is acceptable, since the filler metal tempers readily at temperatures as low as 600°C (1112°F) [41].
In some cases, Codes of Construction allow relaxation of guidance for individual steels when making ferritic to ferritic DMWs. An example of this approach is illustrated for the rules contained in ASME B&PV Code Section I, Table PW-39.5 [5,38,39,42]. Although the mandated minimum PWHT for Grade 91 steel is 730°C (1350°F), there is a footnote specific to DMWs. For welds made between Grade 91 and another lower chromium ferritic steel provided the Cr content is <3.0 wt-%, the minimum temperature is specified as 705°C (1300°F). It should be noted that recent research [43,44] offers justification for reducing the minimum required PWHT for all Grade 91 steel welded components to 675°C (1250°F). Discussions with Code bodies, including the ASME B&PV Code, are in process regarding acceptance of this new minimum temperature [45].
Qualification testing of weldments is an important consideration for the selection of welding procedures, filler materials and PWHT ranges. This is because regardless of the technical merits for a given scenario and as a minimum, the selection of welding processes, filler materials and PWHT must meet the specified requirements as for example in ASME B&PV Code Section IX [46]. However, it should be noted that these qualification tests do not have the same requirements. Thus, a key difference in the world's construction Codes is whether a given Code requires the use of Charpy impact toughness tests as an assessment of fracture resistance. As one example, and in the case of welding Grade 23 to Grade 91, a major supplier of CSEF filler metal recommends the use of filler material matching to Grade 23, in part, because bainitic materials exhibit better Charpy impact values than martensitic filler materials at room temperature [39]. Although there is substantial debate regarding the merit of room temperature Charpy impact energy governing qualification of high-temperature components [43], the constraints imposed by the Codes can drive key aspects of the welding procedure.
Microstructure of ferritic steels
The ferritic steels of interest can experience phase transformations during the thermal cycles associated with fusion welding. As a basic exemplar of the phase transformations, Figure 6(A) shows the microstructural effects with peak temperature while Figure 6(B) on the right side provides the calculated equilibrium phase diagram for a composition consistent with Grade 91 steel. Schematic of the sub-zones of the heat affected zone in relation to the calculated equilibrium phase diagram of a 9Cr–1Mo steel [47].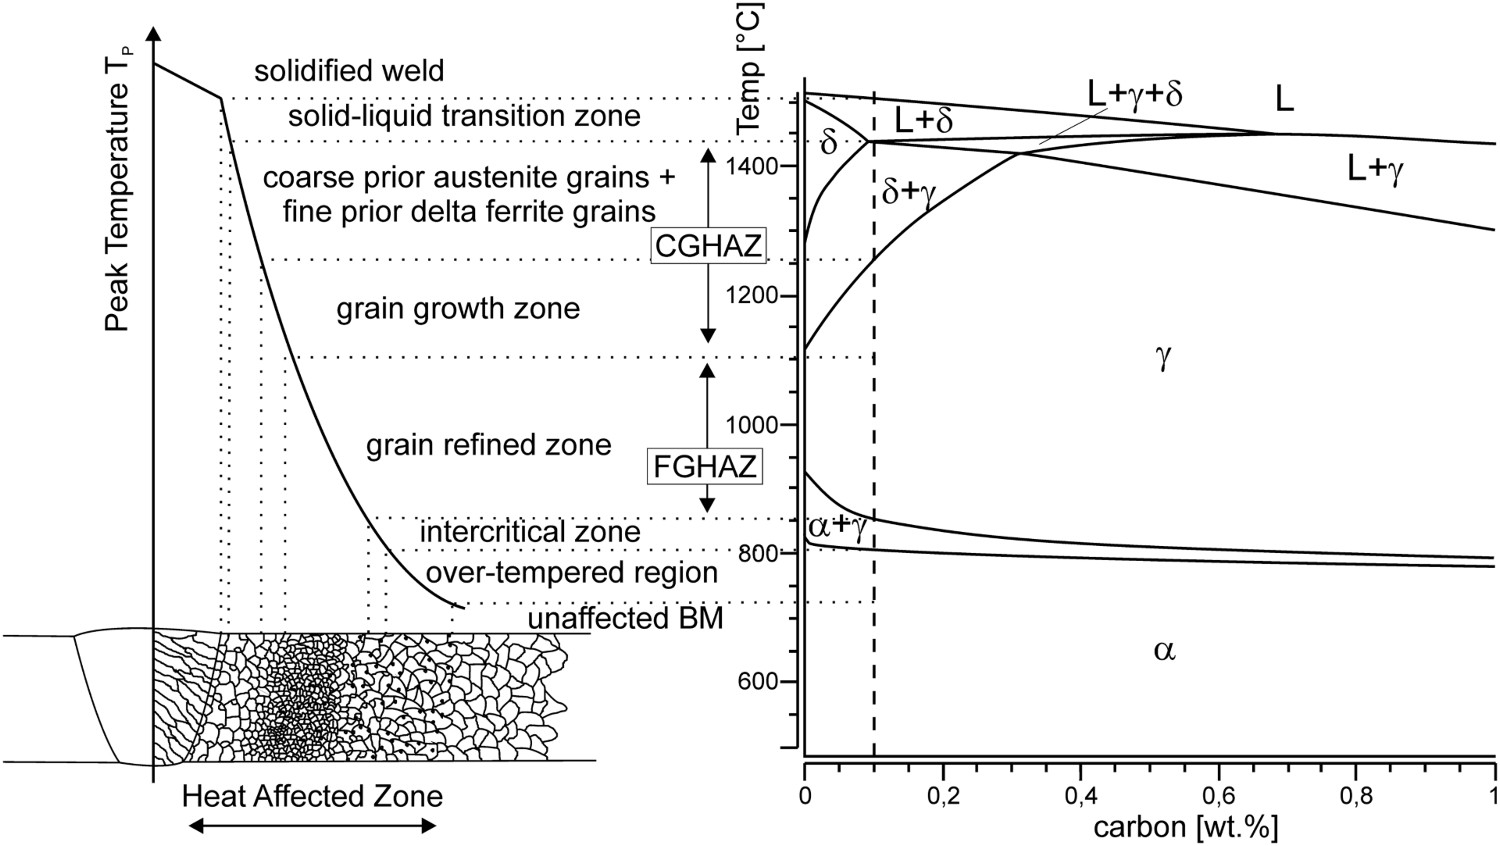
Actual phase transformation temperatures observed during welding will be different from those of equilibrium diagrams due to super-heating and super-cooling which are a function of high heating and cooling rates.
Characteristic for all ferritic steels, on-heating above about 1000°C (i.e. the AC3 temperature) the ferritic matrix will transform entirely to austenite (γ) and at highest temperatures before reaching the solidus temperature, the phase field of delta ferrite (δ) will be reached. On-cooling, if sufficient time is available, delta ferrite will entirely transform back to austenite and on further cooling the equilibrium phase diagram predicts formation of ferrite. In reality, it should be emphasised that the austenite will either transform to ferrite, bainite or martensite depending on the chemical composition and the cooling rate. This is a point highlighted in the continuous cooling transformation (CCT) diagrams in Figure 7 for steel Grades 11, 22 and 91 [9,48,49].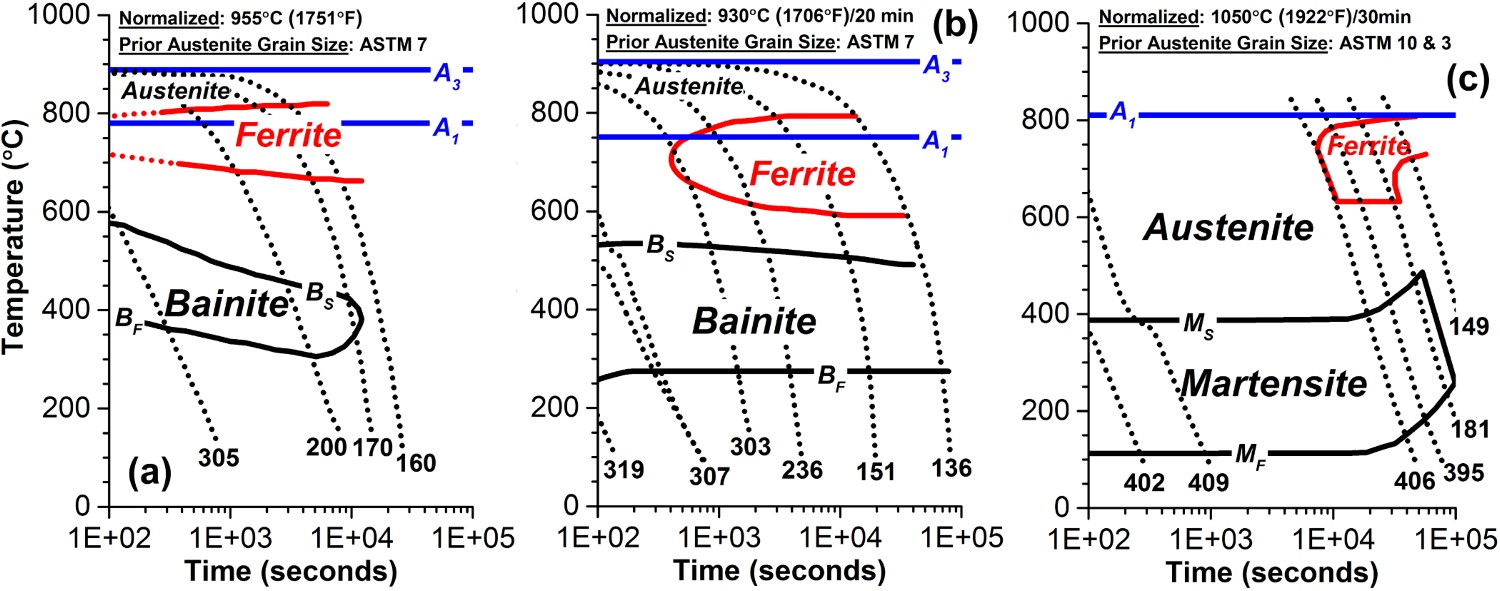
In the case of the low-alloyed steel grades, ferrite is the dominate phase over a large portion of the expected cooling rates. In the case of Grade 22, the formation of ferrite is partially displaced by the introduction of a bainitic phase transformation. Finally, for a Grade 91 steel, the dominate phase is expected to be martensite over a vast majority of the cooling rates expected after welding. For 11–12%Cr steels and depending on the compositional balance of the austenite or ferrite stabilising elements there can be some fraction of ferrite in addition to the martensite. Achieving a 100% martensitic material can be challenging for these higher Cr grades, and in some cases elements are added or increased to high ensure a predominately martensitic matrix on-cooling from welding.
For a selected DMW consisting of two ferritic heat-resistant steels and divided into two halves, no less than 10 distinct zones of different microstructures can be present. Near the centre of the weld, the fusion zone is the region of solidified metal containing weld filler metal and the molten fraction of the two base metals. The fusion zone associated with traditional arc welding processes typically shows a macroscopically uniform chemical composition due to extensive mixing in liquid condition before solidification.
The cross-section in Figure 8 shows a 9Cr multi-pass weldment made with matching filler metal and analysed in ‘as-welded’ condition. Macrograph of a cross-section of a multilayer weld of a 9Cr martensitic steel in as-welded condition [50].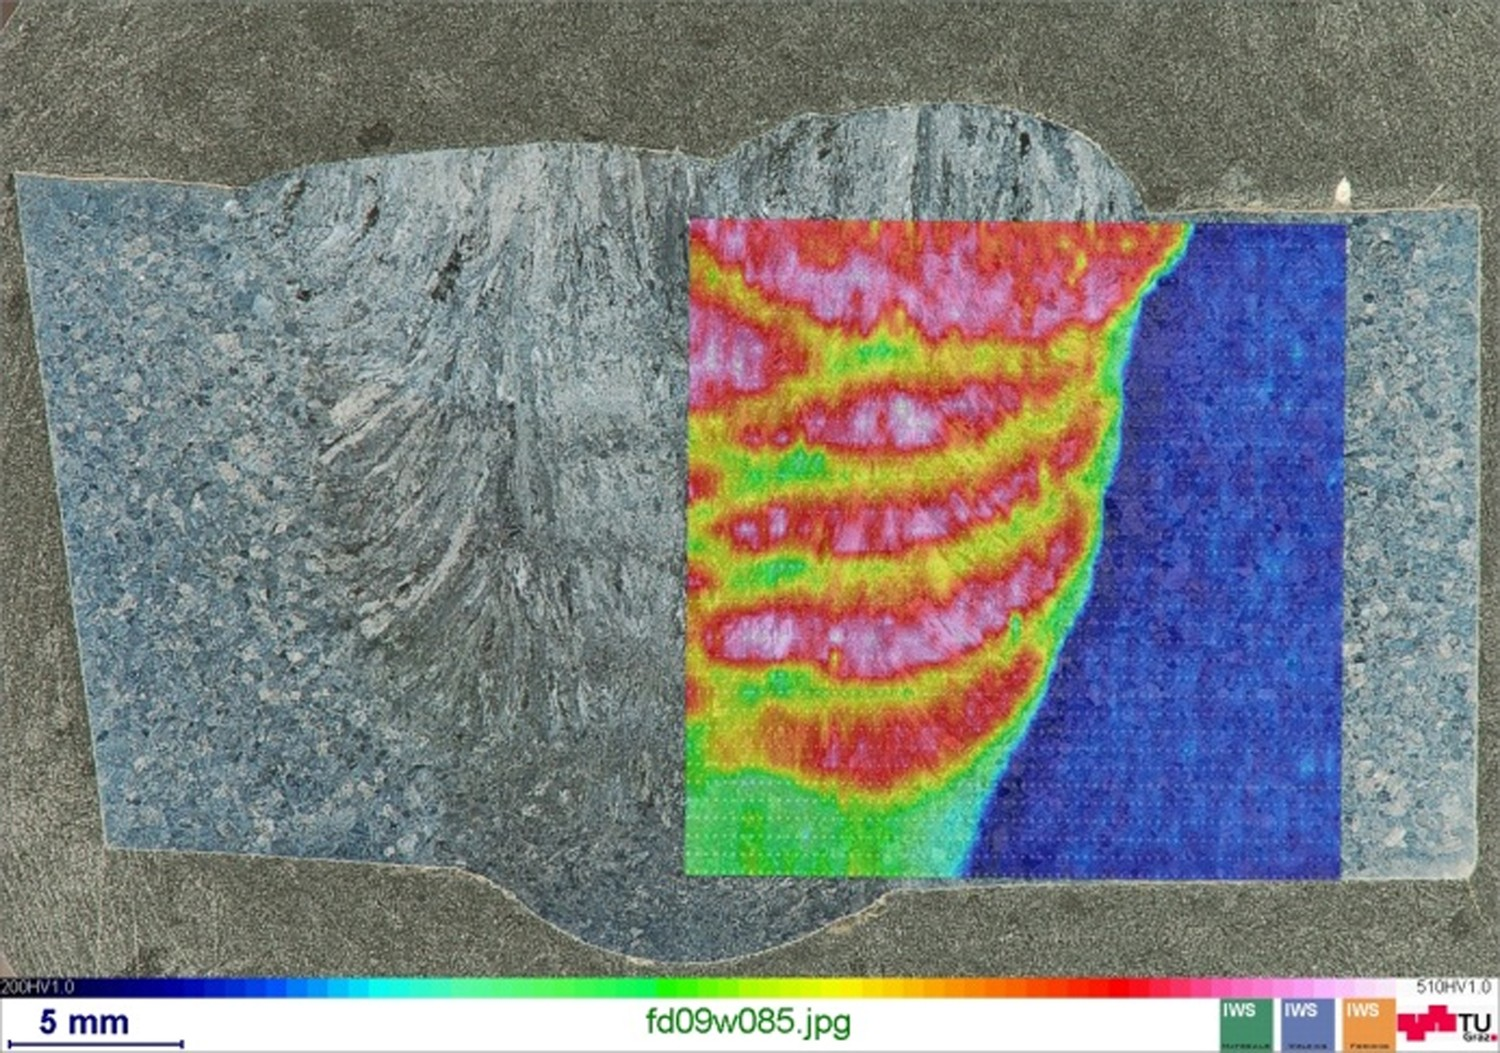
On the right side of the macrograph image, a hardness map has been superimposed. This form of hardness map reveals the heterogeneity in the as-deposited structure resulting from re-transformation and tempering. The ‘as-solidified’ weld metal microstructure is not uniform for multi-layer welds. Three zones in the weld metal can be distinguished on the basis of prior austenite grain (PAG) type, size and hardness measurements: columnar, fine equiaxed regions and very fine equiaxed regions, Figure 9. An Example of the heterogeneity in as-deposited E9015-B9 filler metal showing at least three distinct regions [51].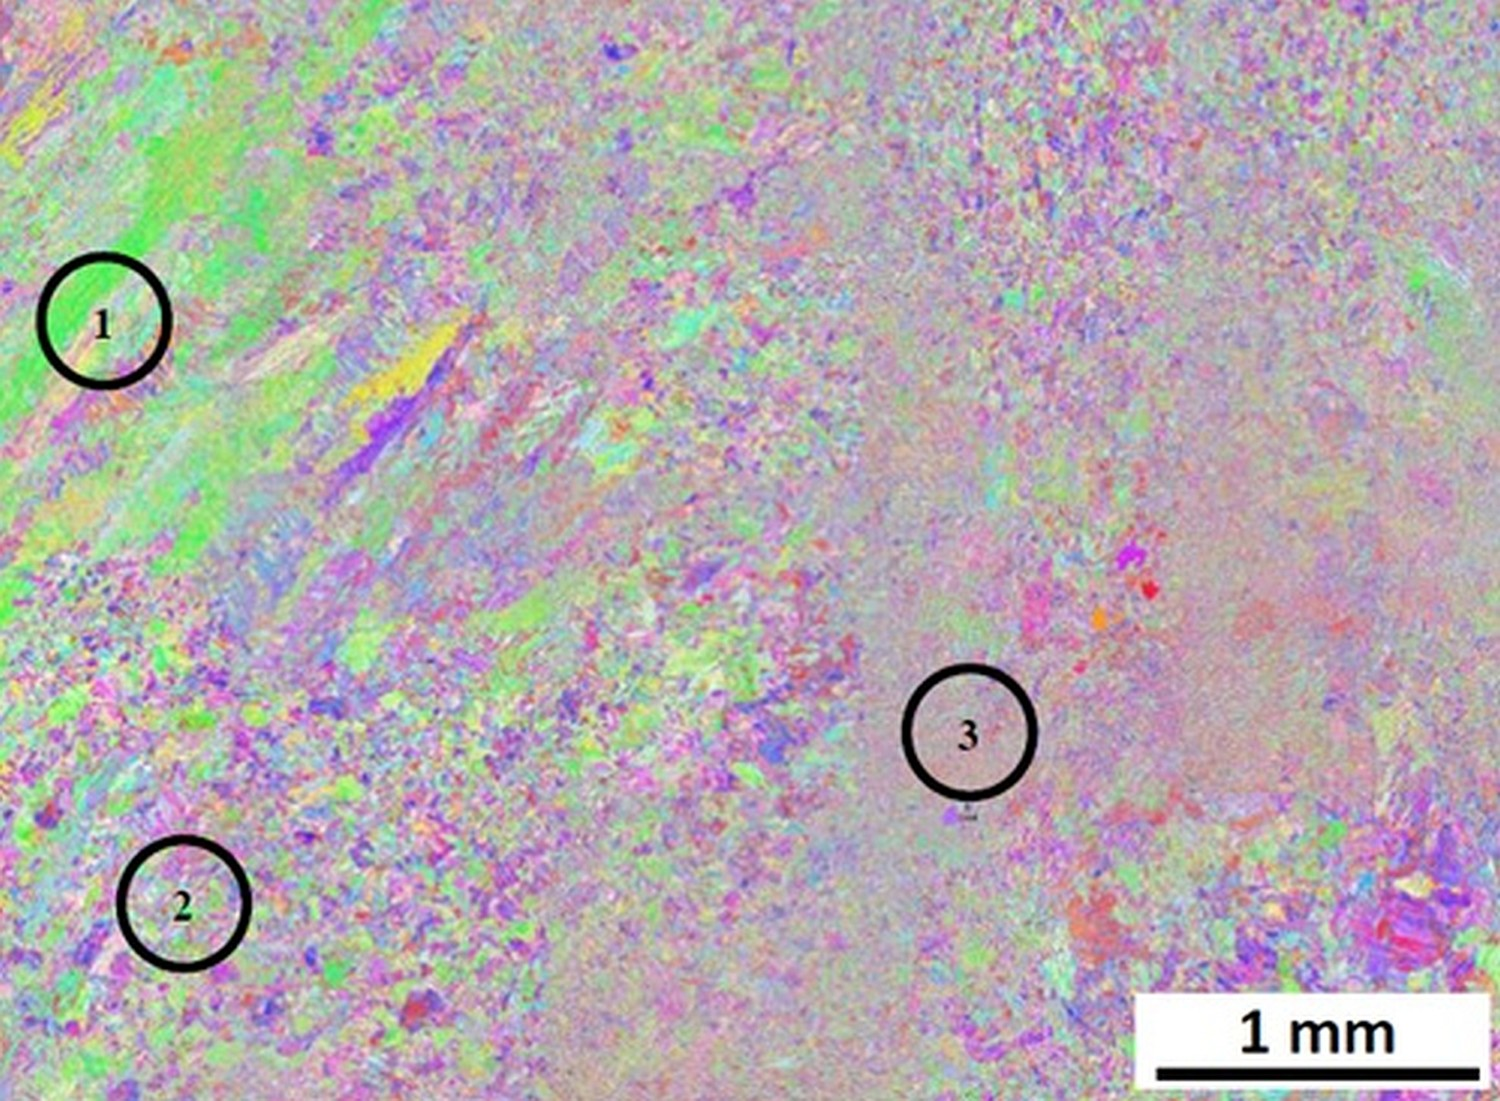
With regard to the PAG size, these three regions can generally be classified where the columnar region has a PAG size >>40 µm, the fine equiaxed region has a PAGB size between 30 and 40 µm and the very fine equiaxed region has a PAG size <10 µm. There exists a fourth region unique to the as-deposited weld metal region. It is a region of immediate transition between the filler metal and base material where incomplete melting and mixing occurs.
Descriptions of unique regions in the heat affected zone of ferritic steels [47].
Example images for Grade 92 steel, obtained using electron back-scatter diffraction (EBSD) are provided in Figure 10. Electron back scatter diffraction images for each of the regions in the heat affected zone.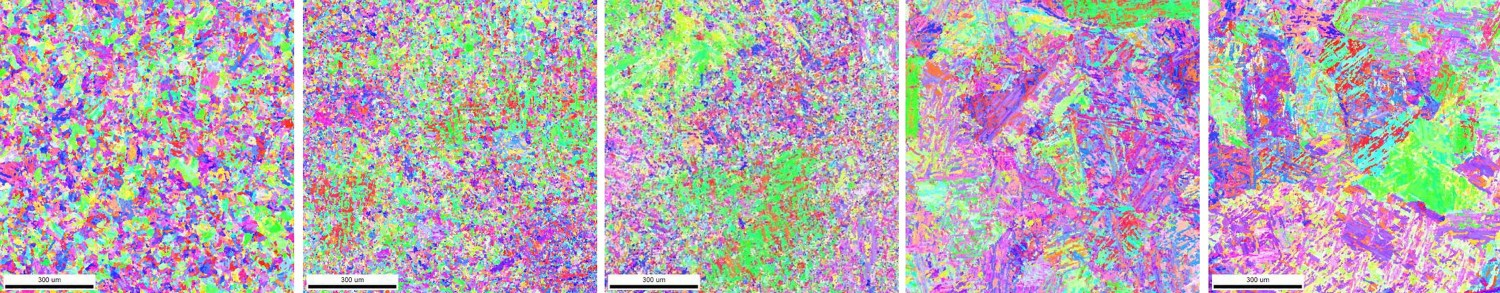
It must be noted that in the overwhelming majority of cases where ferritic to ferritic DMWs are made using of arc welding processes, the weldment contains a complex combination of HAZs which depend on the specifics of the thermal cycle and the pre-welding microstructural condition. Although the use of Figure 10 and Table 4 is instructive, the reality is that the various HAZ regions in Table 4 are subjected to multiple thermal cycles creating a number of additional HAZ regions.
In metallurgically complex CSEF steels such as Grade 91 complete characterisation requires the use of advanced metallographic techniques. Work is on-going to properly define the different HAZ microstructures for 9Cr steels using an approach that is not borrowed from the zones identified for bainitic steel grades. Such work has recently been detailed in [52] and has defined three distinct regions for a single pass weld made in a 9Cr CSEF steel: the completely transformed HAZ (CT-HAZ) where the peak temperature is >AC3, partially transformed HAZ (PT-HAZ) where the peak temperature is between the AC1 and AC3 and an over-tempered HAZ (OT-HAZ) where the peak temperature is below AC1. Clearly in multi-pass welds a number of more complicated scenarios occur and increase the number of zones that can be obtained in the HAZ. These regions have not been defined on the basis of EBSD or grain size, but on the dissolution of carbides in each region, Figure 11. Comparison of the dissolution of carbides in the heat affected zone of a grade 92 steel for simulated peak temperatures of 1250, 1000, 900 and 830°C [51].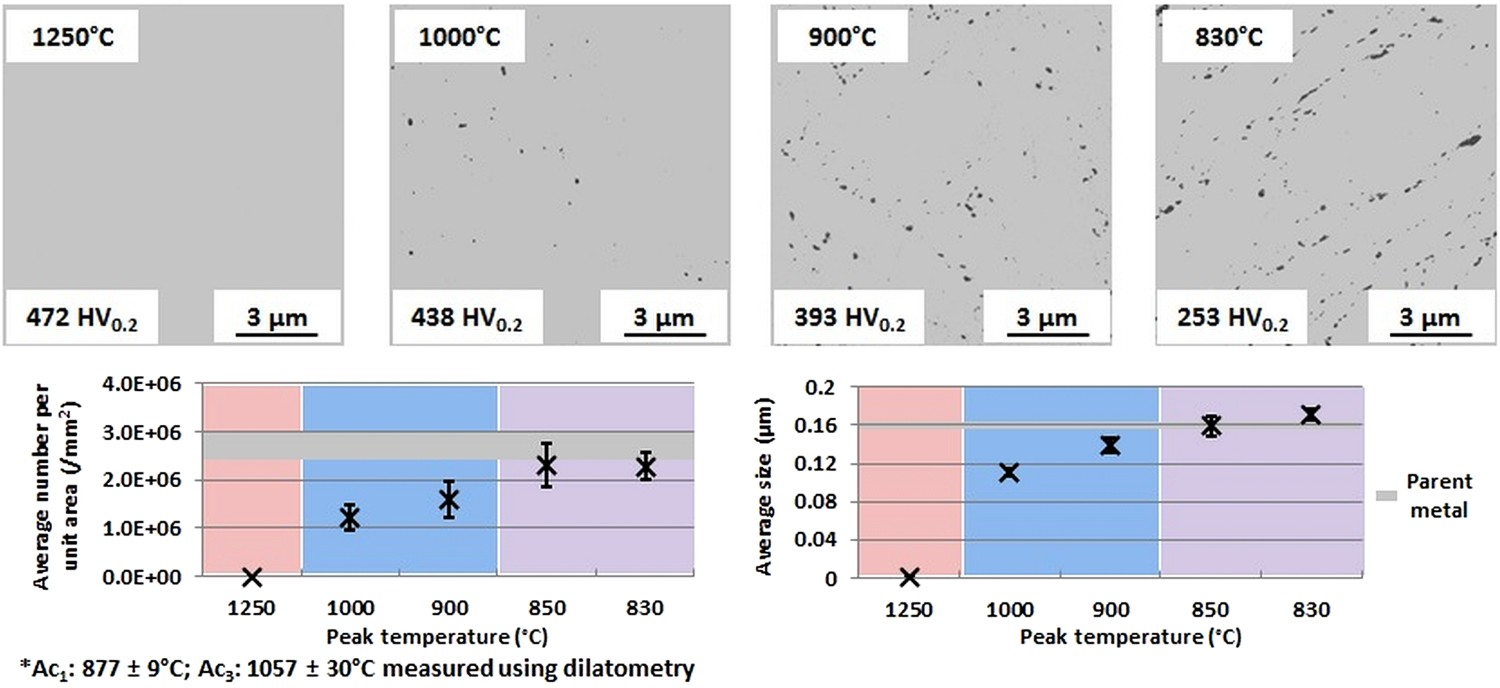
Because the solubility of carbon in ferrite is low, there exists a need to appreciate the initial microstructure in the parent material and how this is altered by the imposed welding thermal cycle and/or PWHT thermal cycle. This is important to this manuscript as the migration of carbon is not dictated by the presence of free carbon only but also by the dissolution of carbides and creation of free carbon for migration. It is thus the case that the migration of carbon in the dissimilar materials will ultimately dictate the stability of the microstructure and with respect to the type of carbides which are stabilised in either the HAZ or weld.
Carbon migration
Time dependent, thermally activated changes in carbon level (carbon migration) is very important since local carbon levels are critical to local microstructure and properties. In the extreme, carbon migration can be seen due to the formation of a CDZ and carbon-enriched zone (CEZ). However, even in samples where no microstructural changes are revealed using light optical metallography there can exist complex changes that are not easily detectable. One of the classic experiments examining the effect of alloying content on carbon migration is that of Darken [53]. In his studies, Darken experimented with diffusion-bonded steels containing different concentrations of C, Si, Mn and Mo and held these material couples in the austenitic phase field at 1050°C (1922°F) for around 14 days. In one material combination where the initial carbon content in each material was nominally the same (0.49 and 0.45 wt-%), the ‘uphill’ diffusion of carbon occurred in the region of the diffusion bond from a local carbon content of 0.315–0.586 wt-%, Figure 12. Carbon distribution in welded specimen of steels with similar carbon content and differing Si content after 13 days at 1050°C revealing uphill diffusion of carbon experimentally observed by Darken in 1949 [53].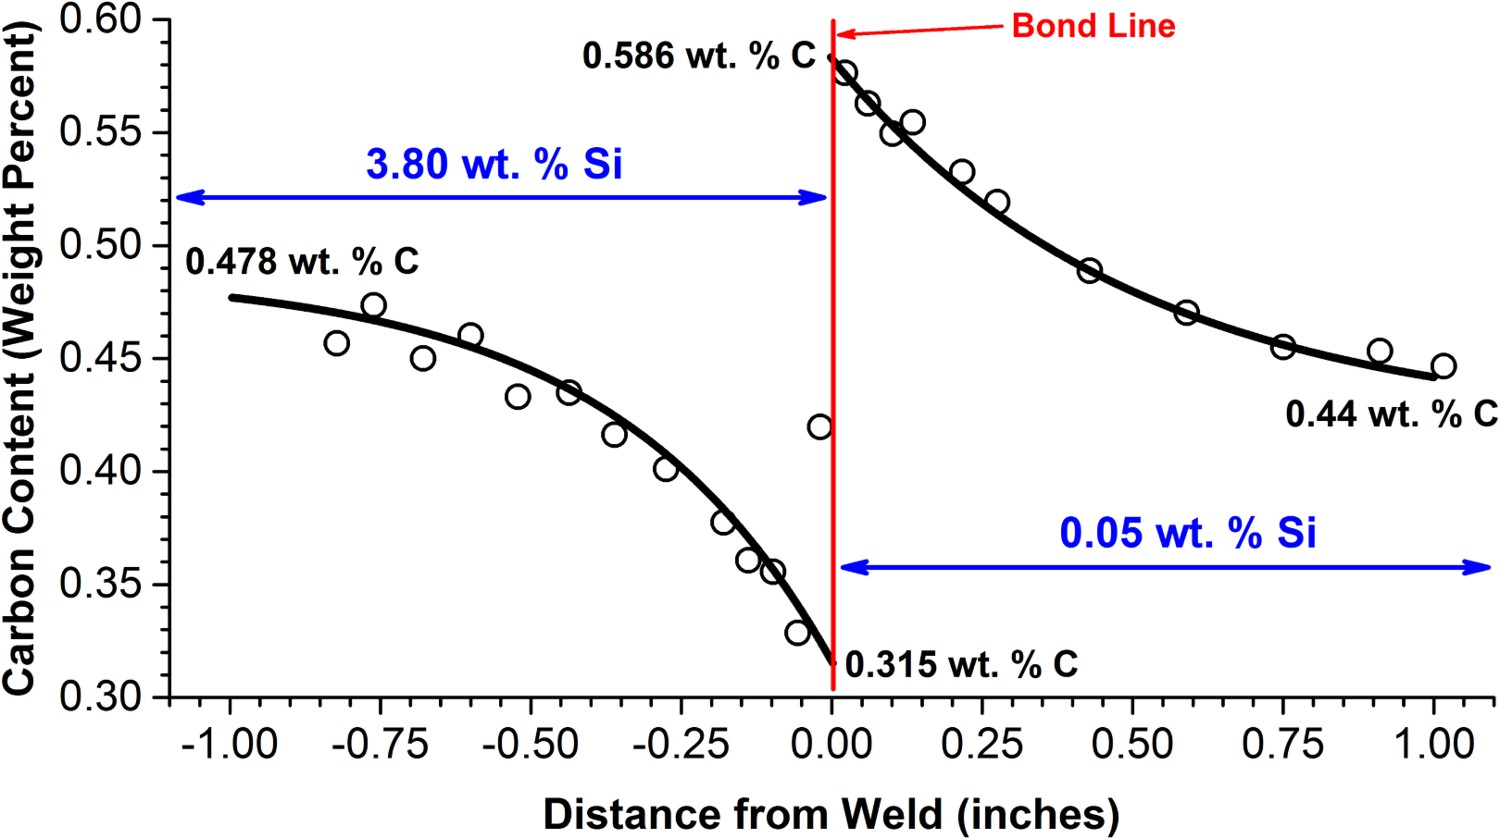
This observation was notable in that the carbon had diffused from the higher Si steel to the lower Si steel giving rise to the reported carbon imbalance.
The driving force in an isothermal diffusion process may be regarded as the negative gradient of the chemical potential (partial molal free energy) of the diffusing substance. For a system of more than two components it is no longer necessarily true that a given element tends to diffuse toward a region of lower concentration gradient even within a single phase region. Concentration gradient and the chemical potential gradient, or activity gradient, may be of different sign, thus giving rise to ‘uphill’ diffusion. Darken’s observations were important as they represent one of the first studies examining the effect of carbon migration in dissimilar steels and laid the foundation for key follow-on studies including those of Christoffel and Curran [3].
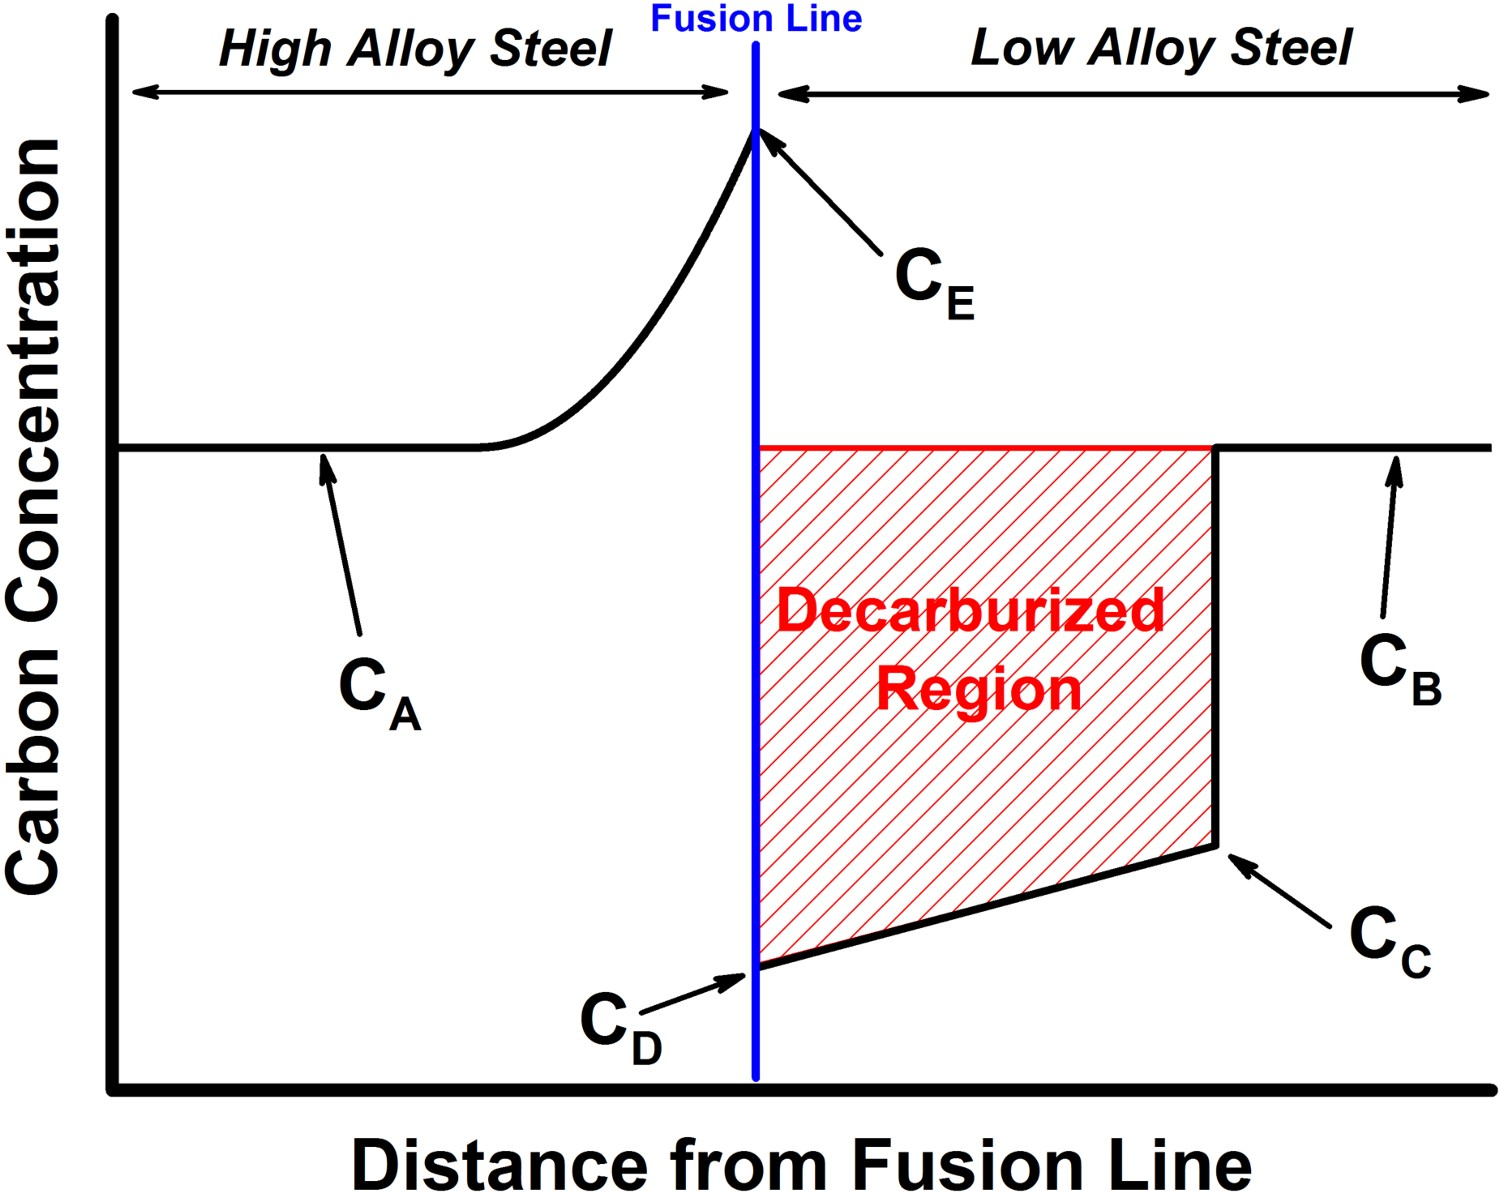
Christoffel and Curran [3] expanded on Darken's experiments to examine a wider range of material combinations including ferritic to ferritic and ferritic to austenitic materials for sub-critical PWHT thermal cycles. The detailed study included PWHT of DMWs in the range of 593–704°C (1100–1300°F) and for times between 25 and 3000 h. In their series of experiments, they proposed one of the first explanations regarding the concentration of carbon across a dissimilar interface, Figure 13 and provided below: Carbon in solution migrates across the fusion line from the low-alloy steel to the high-alloy steel. The primary driving force for carbon migration is the alloy content (such as Cr) resulting in a lower energy for carbon in the high-alloy steel as compared to that of the low-alloy steel. This magnitude can be measured by the difference in carbon concentration on the high-alloy and low-alloy sides of the fusion line (CE-CD). The migration of carbon to the high-alloy steel increases the carbon concentration on this side of the fusion line and will result in the precipitation of carbides if the carbon concentration is above the solubility limit. The added carbon results in a carbon concentration gradient and carbon will tend to migrate away from the fusion line under the influence of this gradient (CE-CA). The carbon which has crossed the fusion line reduces the concentration of the carbon in solution in the low-alloy steel. This results in a carbon concentration gradient in the low-alloy steel (CC-CD). The carbon diffuses to the fusion line in the low-alloy steel under the action of the concentration gradient. When the carbon concentration in the low-alloy material has dropped below the solubility value by virtue of the migration across the fusion line, the carbides in the low-alloy steel begin to break down and carbon goes into solution to bring the carbon level in solution back up to its solubility value at this point. Note that carbon can only migrate when in solution and is not mobile in the matrix when in the form of a carbides. The carbon distribution across a DMW fusion line [3] where CA = original total carbon content in high alloy material; CB = original total carbon content in low alloy material; CC = carbon solubility concentration in low-alloy material; CD = carbon content in low-alloy material at the fusion line; CE = carbon content in high alloy material at the fusion line.
These first experiments were extremely important because they highlighted that carbon migration is a function of no less than three critical considerations: Amount of free carbon in the matrix; an inherent property to the material(s) of interest. Barrier to break down existing carbides to introduce additional free carbon in the matrix; primarily controlled by the welding and applied PWHT. Rate of carbon migration; controlled by the temperature and time during PWHT and/or service operation.
In subsequent research, and as materials have become more complex leading to controlled additions of Ti, V, Nb, N and other alloying elements, a fourth consideration needs to be considered – resistance to recrystallisation of ferrite grains [30,31]. This is primarily controlled by the stability of the carbides present. Stable carbides will ‘tie up’ the available carbon and will pin grain boundaries and prevent recrystallisation and grain growth. For example, where materials may have purposeful additions of V, Nb and N, the formation of MX precipitates which do not readily dissolve in service and precipitate during PWHT can provide added resistance to grain growth.
These primary considerations, highlighted by a number of studies over the last 60 years, will be reviewed in the following sections. As will be discussed, many studies examining carbon migration in ferritic DMWs rely only upon light microscopy and/or hardness evaluation for establishing the extent of carbon migration during welding, PWHT or service exposure. This evaluation may lead to inaccurate conclusions since there are inaccuracies associated with these methods including interpretation of the data, etching effects, resolution of the technique and other issues. Although quantitative techniques, such as wavelength dispersive X-ray spectroscopy (WDX) or energy-dispersive X-ray spectroscopy (EDS) are more relevant to the examination of carbon migration, it is only recently that these methods have been capable (especially in the case of EDS) of resolving carbon contents at least semi accurately.
Influence of fabrication on microstructural evolution
For DMWs with differential alloying additions of Cr, the carbon will diffuse from the low Cr side to the high Cr side. To a lesser extent, minor alloying and carbide-forming elements can drive carbon migration including elements like Nb and V. Main influencing factors for this diffusion governed process are time and temperature including the effect of welding, PWHT and service exposure. These effects are of concern in following sections.
Influence of welding on carbon migration
The fusion line of DMWs is of highest interest as in this location, by the nature of fabricating DMWs, the steepest gradient in chemical condition can be found. Lundin et al. [2,54] investigated a simple bead-on-plate weld in which a 9Cr–1Mo filler was deposited on a 2.25Cr–1Mo base metal plate by the gas tungsten arc welding (GTAW) process. In this examination, the elemental distribution was investigated across the fusion line in the as-welded and PWHT condition at 730°C (1350°F) for times ranging from 1 to 64 h. In the as-welded condition, a sharp difference in Cr content across the fusion line of the 2.25Cr–1Mo/9Cr–1Mo weld can be observed while there is no difference in Mo, Mn and Si contents, Figure 14. Elemental distribution across a DMW between a 2.25Cr–1Mo base material and a 9Cr–1Mo filler metal and in the as-welded condition [55].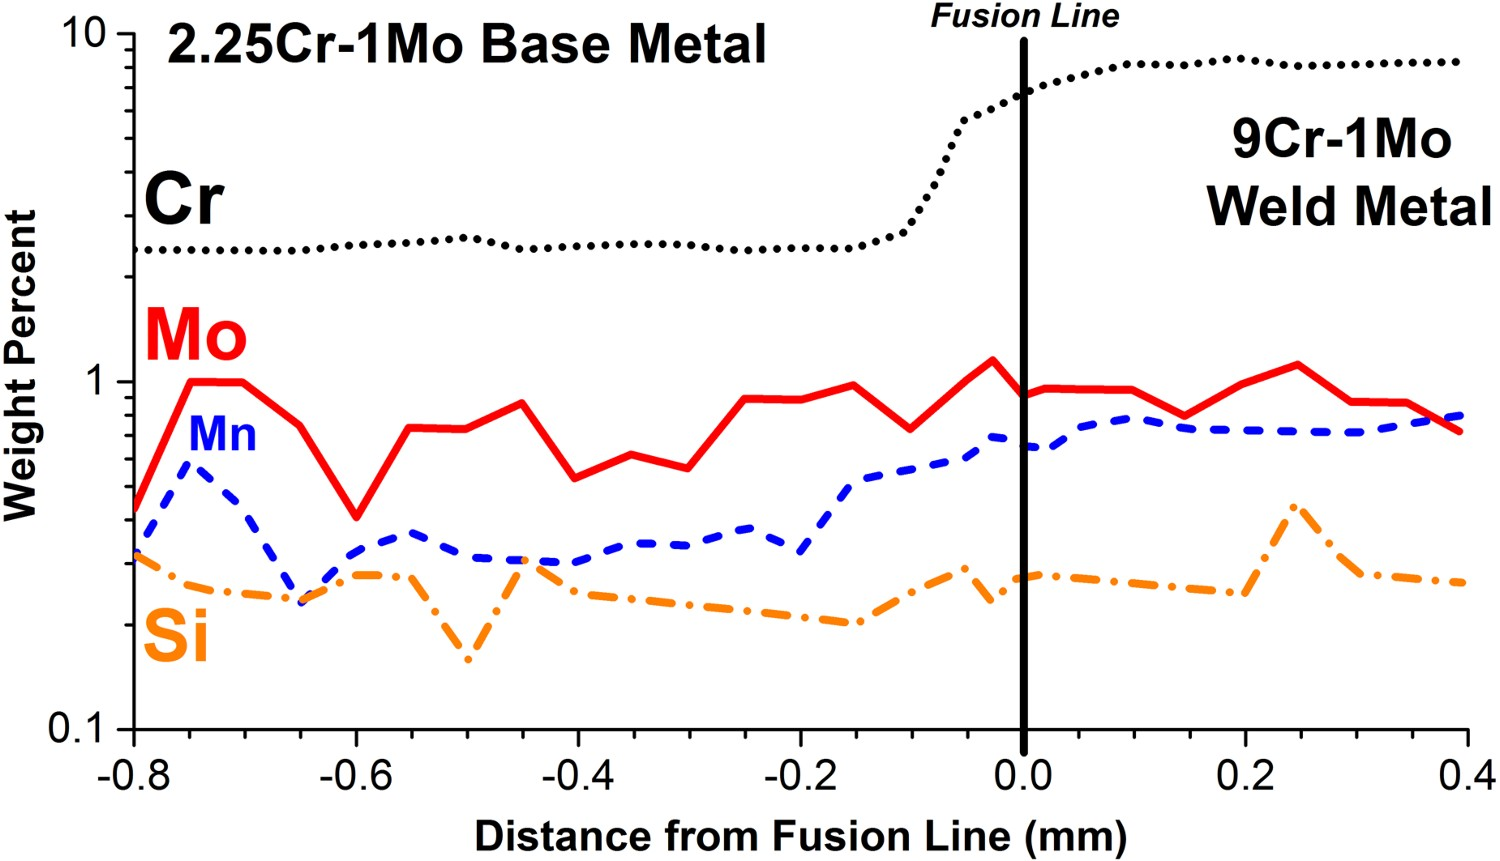
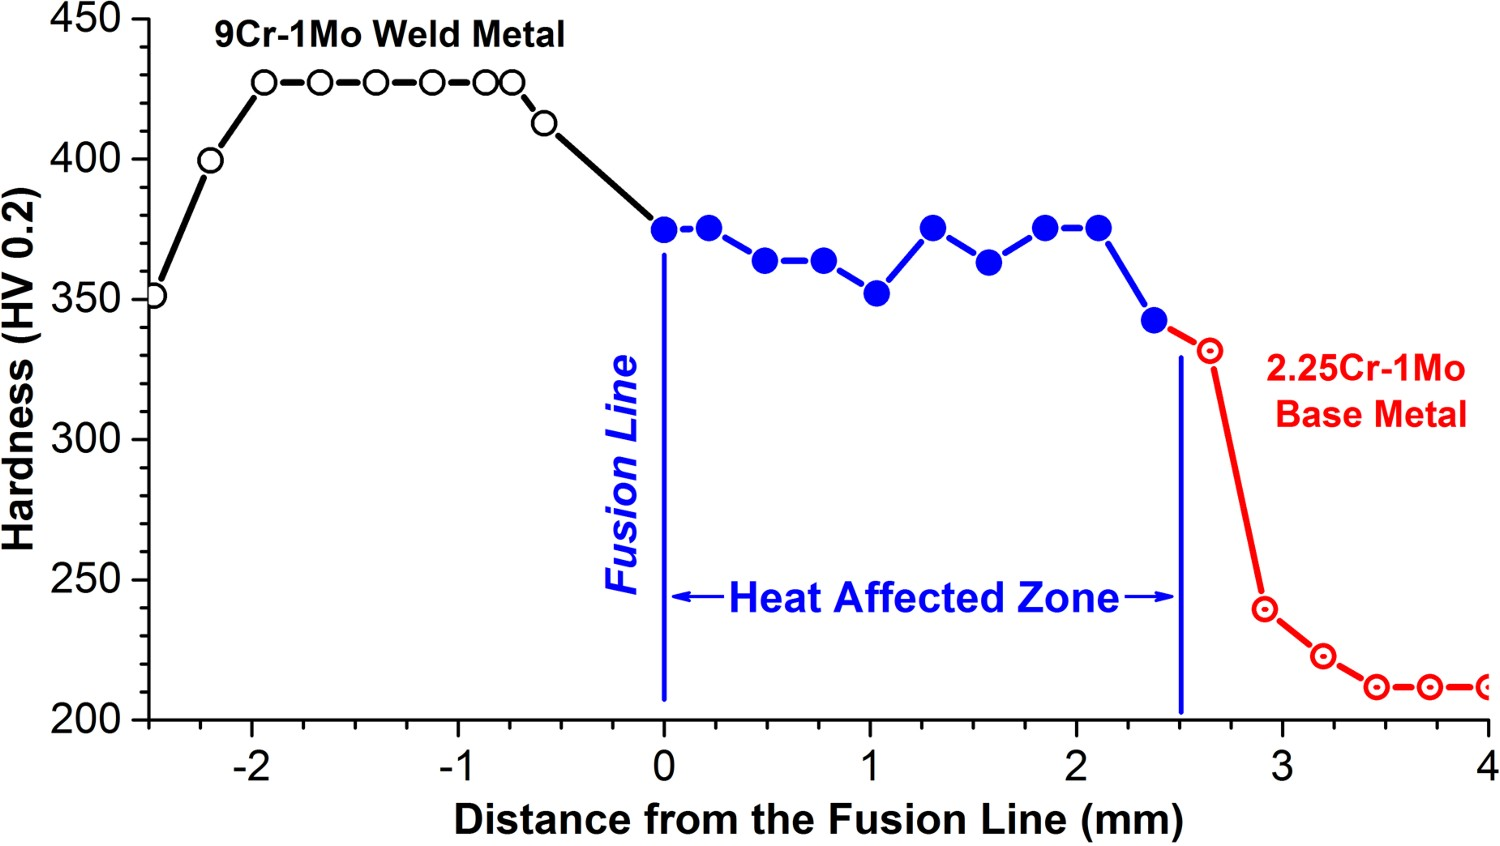
The results of the electron micro probe analysis (EMPA) of the Cr content reveal a steady transition from 2.25Cr–1Mo to 9Cr–1Mo within a distance of approximately 0.2 mm. On the basis of light-optical microscopy and hardness measurements there was no evidence of migration of carbon after welding (Figures 15 and 16) and consistent with observations made by other researchers [56]. Light optical microscopy image of the fusion line in a DMW between a 2.25Cr–1Mo base material and a 9Cr–1Mo filler metal and in the as-welded condition [56]. Vickers hardness values across the fusion line in a DMW between a 2.25Cr–1Mo base material and a 9Cr–1Mo filler metal and in the as-welded condition [56].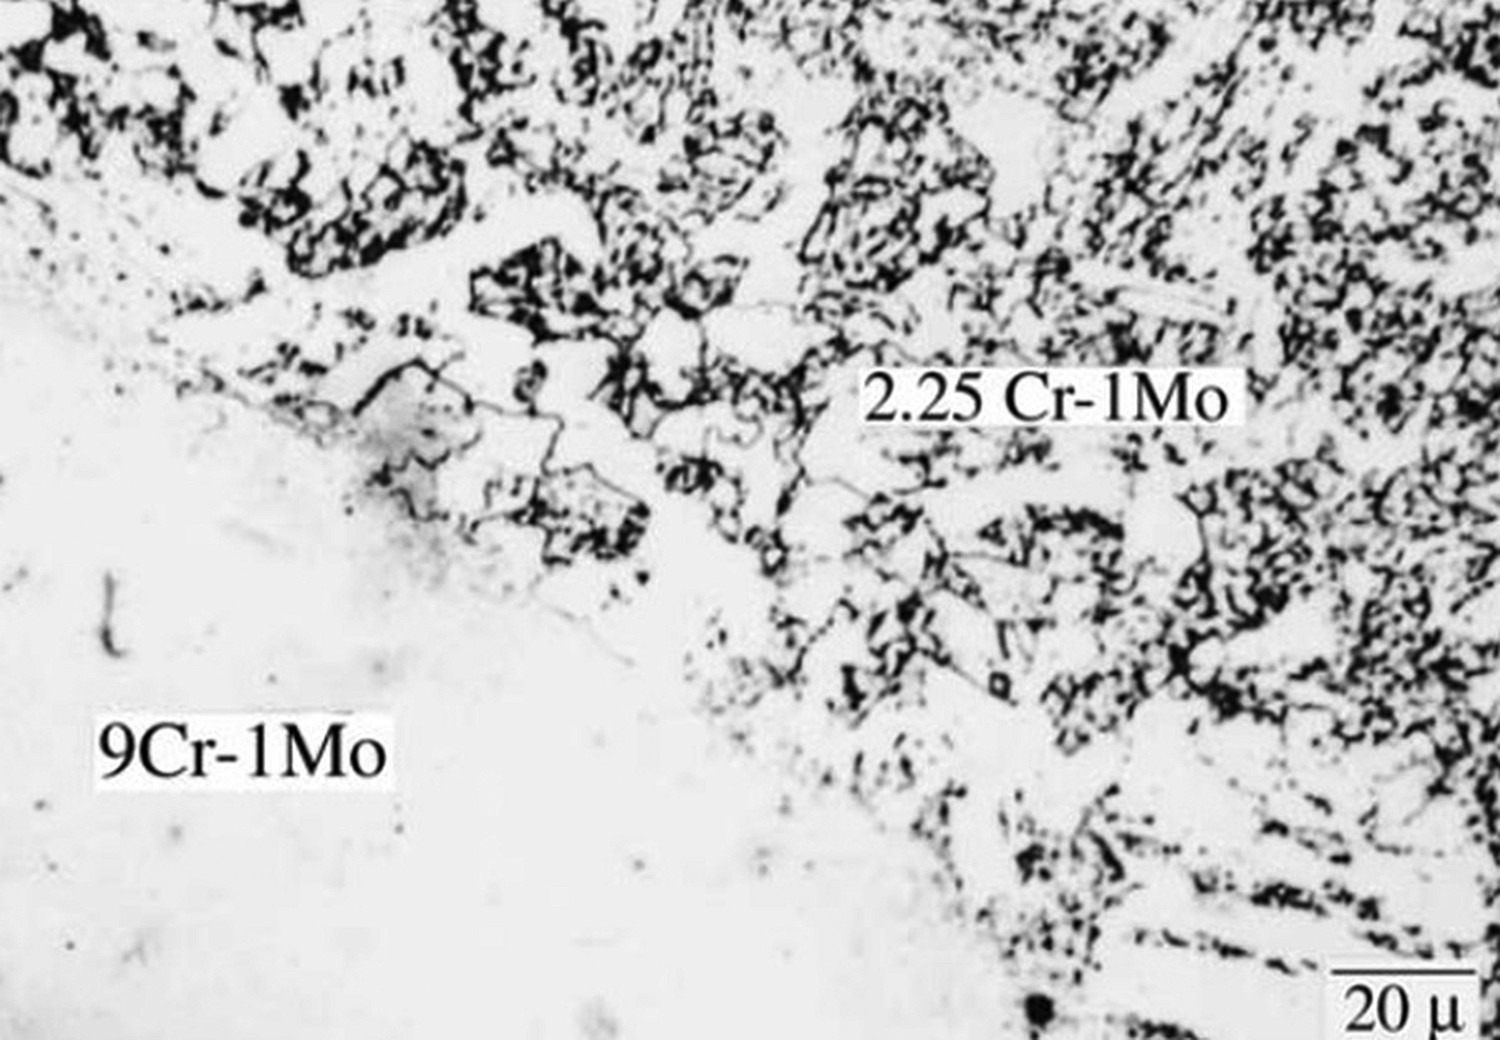
The fusion line and HAZ for a weldment between 1CrMoV and 12CrMoV base metals welded with 5CrMoV and 12CrMoV weld metal was analysed for carbon migration in [57]. In Figure 17(A,B), a comparison in hardness measurements made across the fusion line between the 1CrMoV and filler metals (Figure 17(A)) is compared to an identical procedure for that of the 12CrMoV fusion line (Figure 17(B)). Micro-hardness profiles across the cross-section of a DMW give a first indication of the microstructural changes in the fusion line area. Hardness in the HAZ is mainly influenced by the chemical composition of the base materials, especially the carbon content, but also the welding parameters applied and the resulting thermal cycles. Their influence can be observed in Figure 18 [57].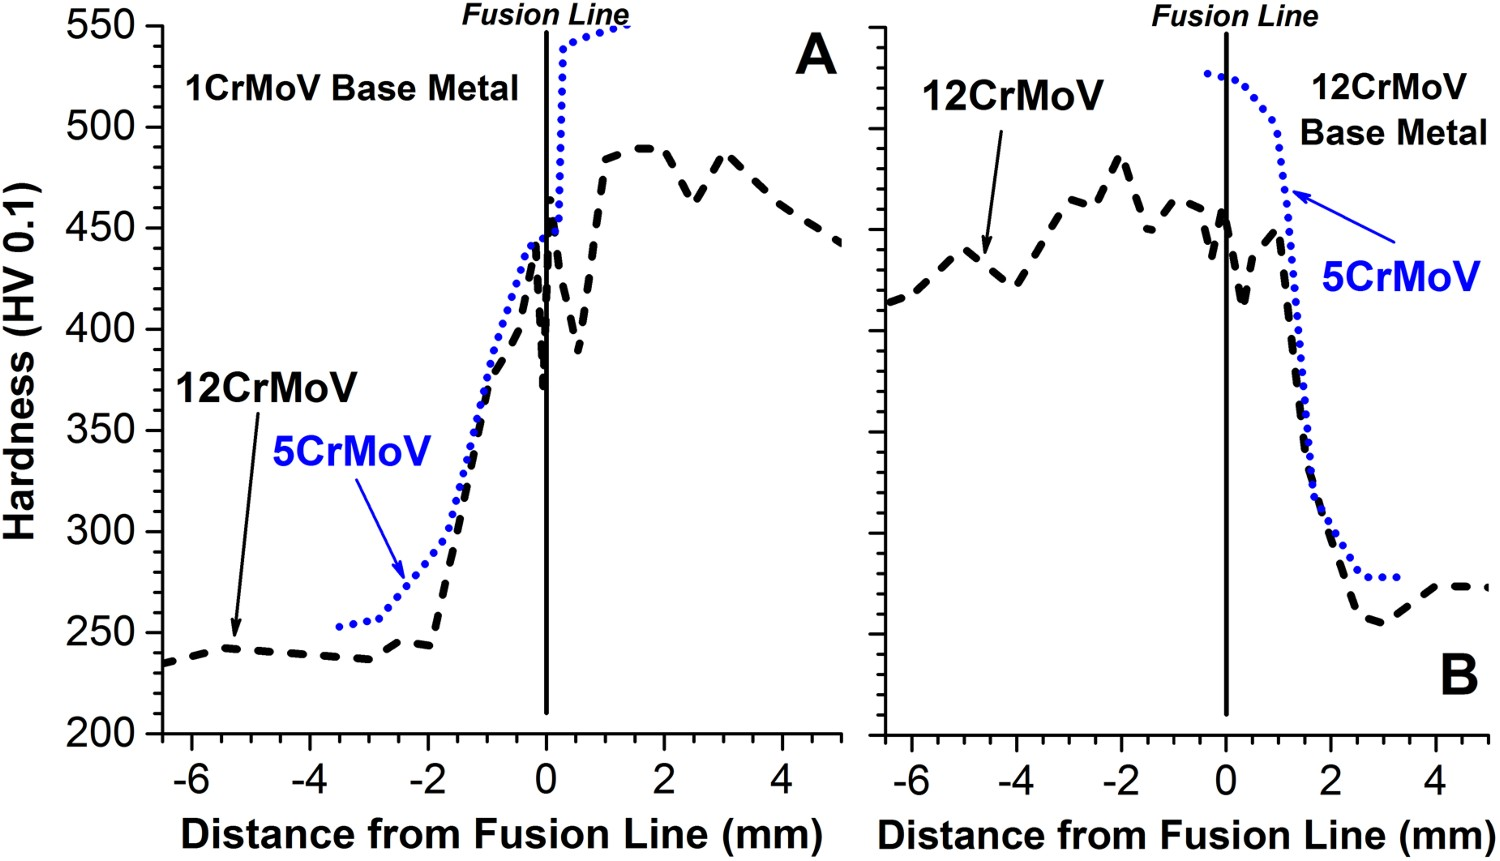
In general, it can be stated that there is not a noticeable increase or decrease in the local hardness measurements suggesting that on the basis of hardness measurements there is not gross migration of carbon across either investigated fusion line.
In work of Kozeschnik et al. [58,59] a thick-section, multi-pass weldment made in 2.25Cr–1Mo base metal with 9Cr–1Mo weld metal was investigated. Unlike in the investigations performed by [55–57] measured carbon profiles across the fusion line using WDX revealed partitioning of carbon in the as-welded state, Figure 18(A,B). The micrograph in Figure 18(A) shows the formation of a carbide depleted zone on the left side of the fusion line in the low-alloyed 2.25Cr–1Mo steel and a ∼20 µm wide carbide seam is clearly visible in the 9Cr–1Mo weld metal. Optical micrograph of the fusion line between a 2.25Cr–1Mo base metal and a 9Cr–1Mo weld metal in the as-welded condition (A) and corresponding carbon profiles obtained by wavelength dispersive X-ray analysis (WDX) analysis revealing partitioning of carbon during welding (B), adapted from Ref. [58].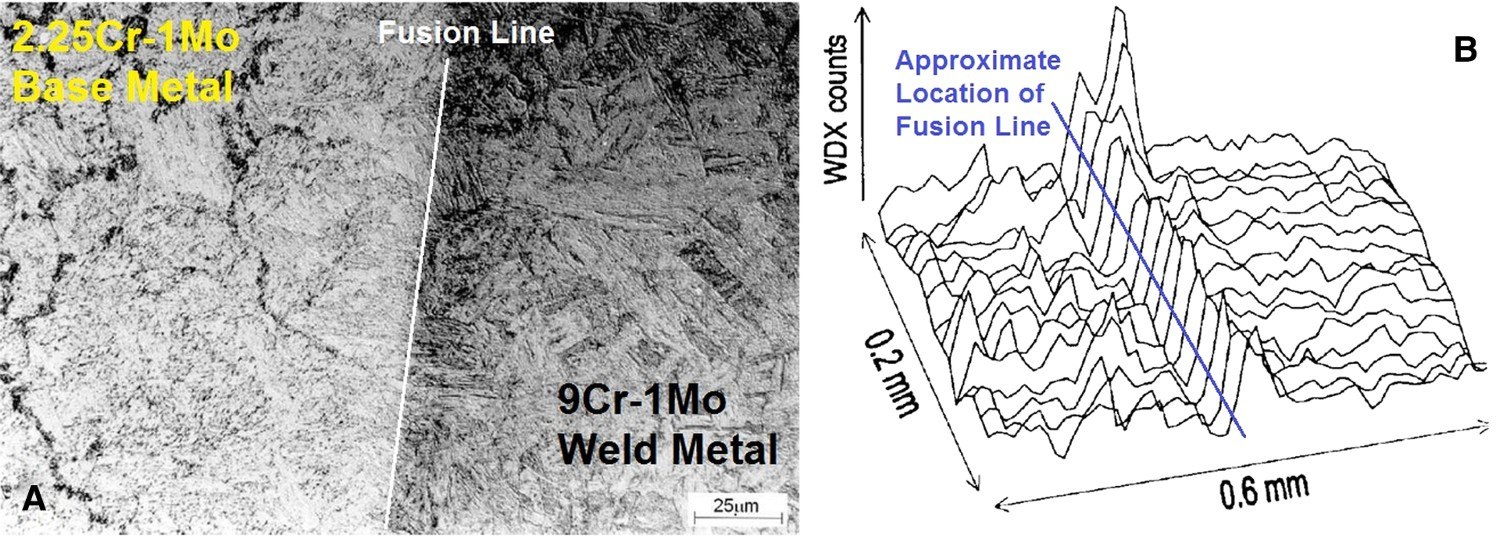
The results in Figure 18(B) emphasise the importance of representative weldments and techniques to effectively assess the influence of the welding process on carbon migration. This Figure provides an assembly of 15 WDX carbon line scans across the fusion zone that confirms the occurrence of carbon partitioning. This diffusion-governed effect is more pronounced as a multi-layer weld is investigated so that the material has experienced several elevated temperature weld thermal cycles which have increased the carbon activity and migration.
Although there appears to be a disagreement among the literature regarding the influence of the welding thermal cycle on carbon migration, there is reason to believe that welding thermal cycles can have a significant impact on the formation of a CDZ and CEZ in a DMW. For example, it will be shown in the following section that the welding process can have a dramatic effect on the local carbon migration following a mandatory PWHT due to the refinement that occurs in a complex multi-pass weld.
Influence of PWHT on carbon migration
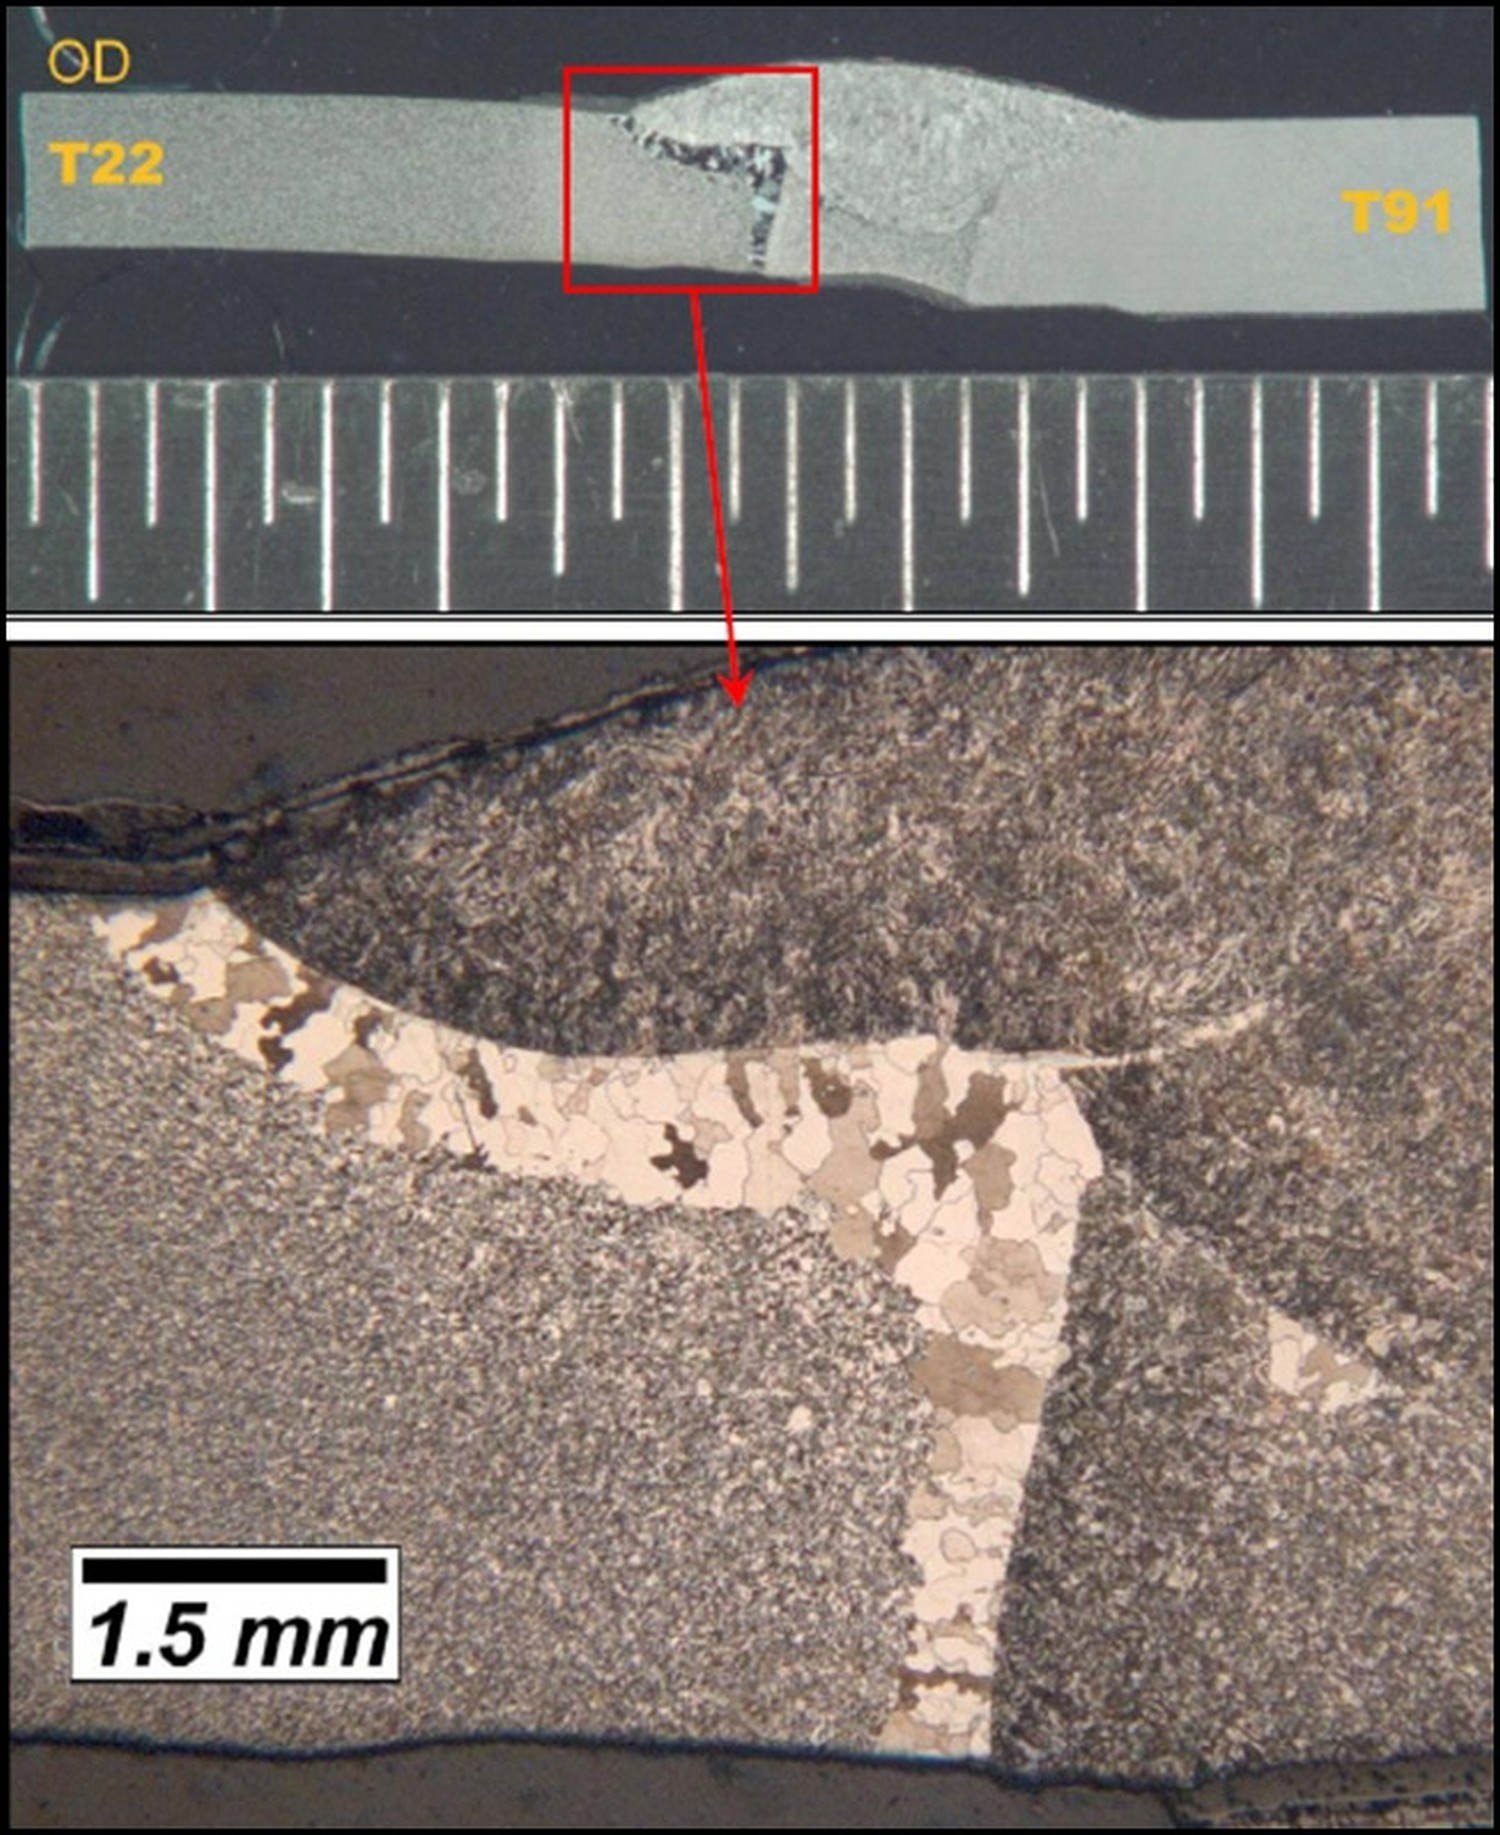
The effect of PWHT clearly enhances the partitioning of carbon and is evident in Figures 19–21. In Figure 19, the micrograph shows the fusion line between a 2.25Cr–1Mo base metal and a 9Cr–1Mo weld metal following PWHT at 732°C (1350°F) for 64 h [55]. Light optical micrograph of 9Cr–1Mo weld metal deposited by the GTAW process on 2.25Cr–1Mo base metal and following PWHT at 732°C (1350F) for 64 h revealing severe carbon migration [55]. Representative images of the fusion line between a 9Cr–1Mo weld metal and 2.25Cr–1Mo parent metal showing the CEZ (“ppt zone’) and the CDZ (‘soft zone’) for [56]: A – 750°C (1382°F) for 1 h; B – 750°C (1382°F) for 2 h; C – 750°C (1382°F) for 10 h. Ex-service T22 to T91 weldment operating in a reheater section after 45,000 h at service temperature (>565°C, 1050°F).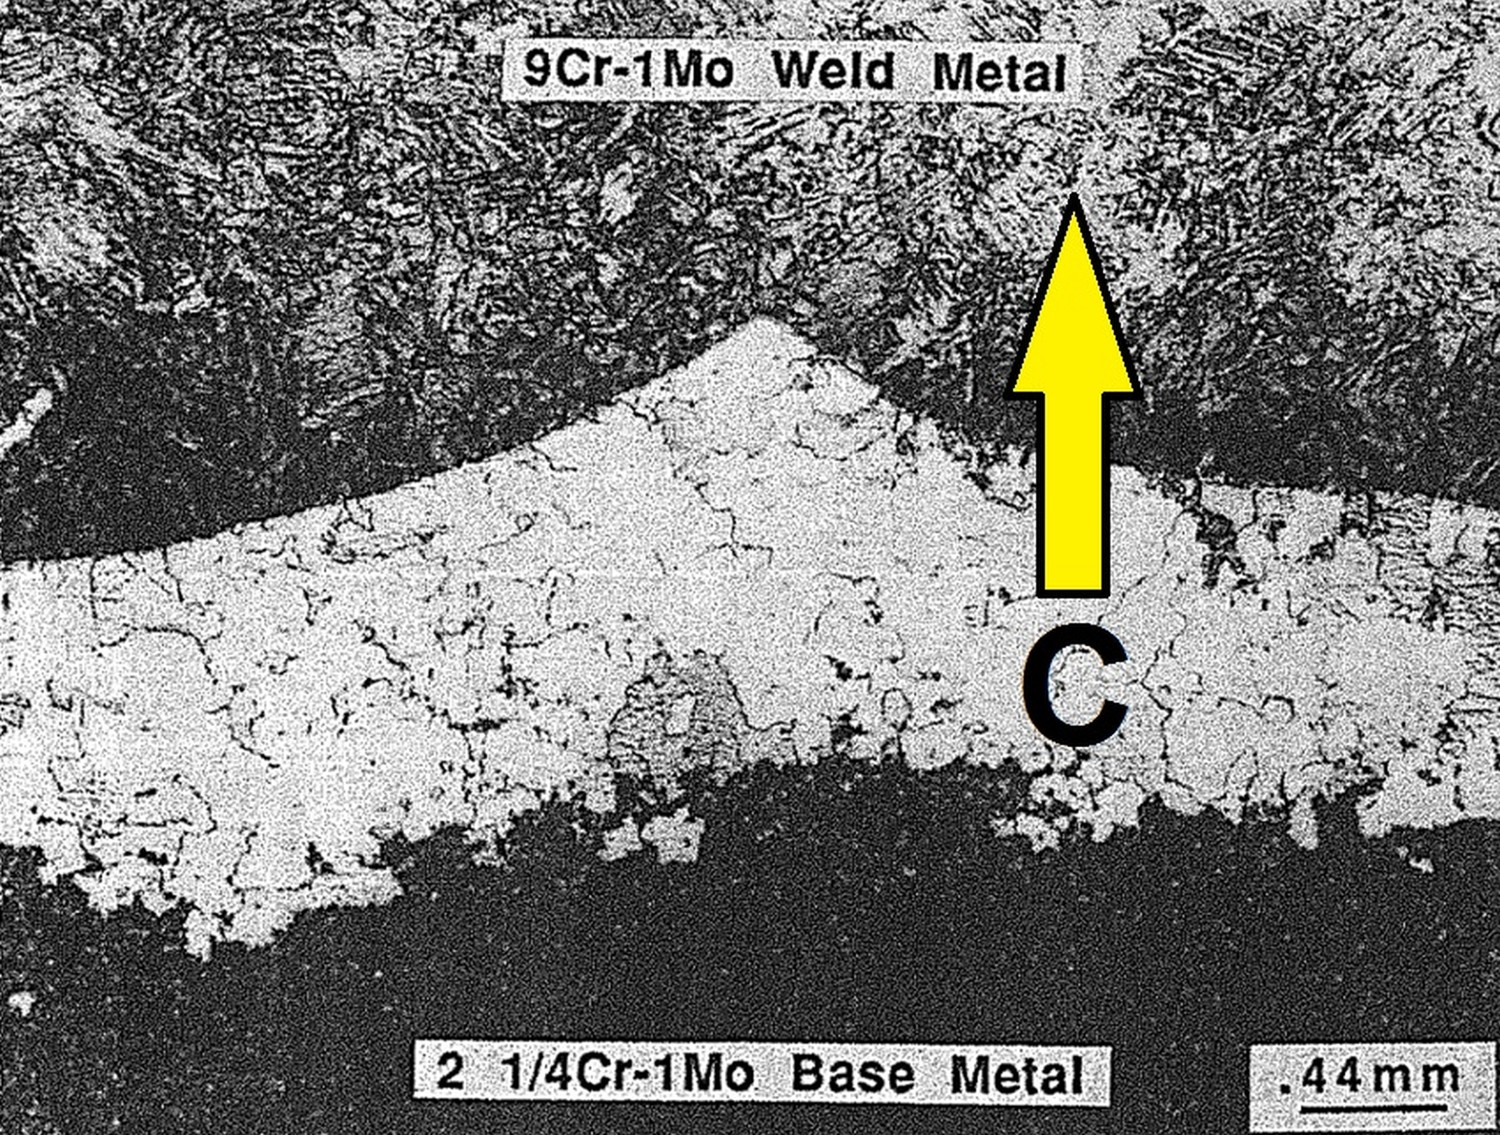
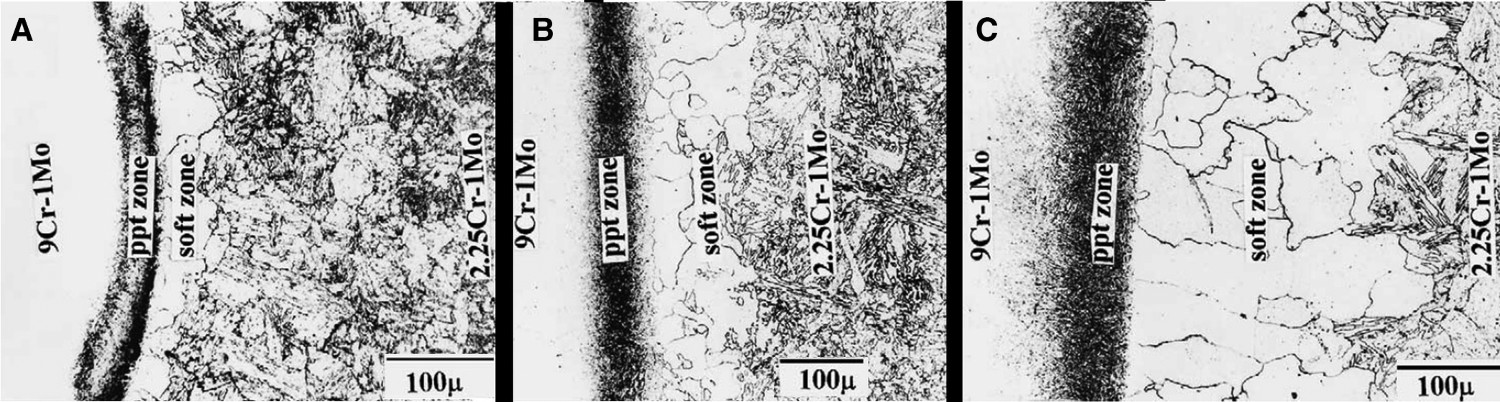
The width of the CDZ increases with additional time at temperature, a point highlighted by the series of images shown in Figure 20 [56].
A comparison of PWHT at 750°C (1382°F) is provided for times of 1, 2 and 10 h effectively showing this growth within the 2.25Cr–1Mo base material and adjacent to the fusion line. An ex-service weldment between T22 and T91 installed in a reheater section of a supercritical boiler is shown in Figure 21.
The CDZ is clearly visible in the T22 along the entire length of the fusion line where the carbon has migrated from the low-alloy T22 to the higher alloy filler metal (i.e. filler metal is matching to the T91 material).
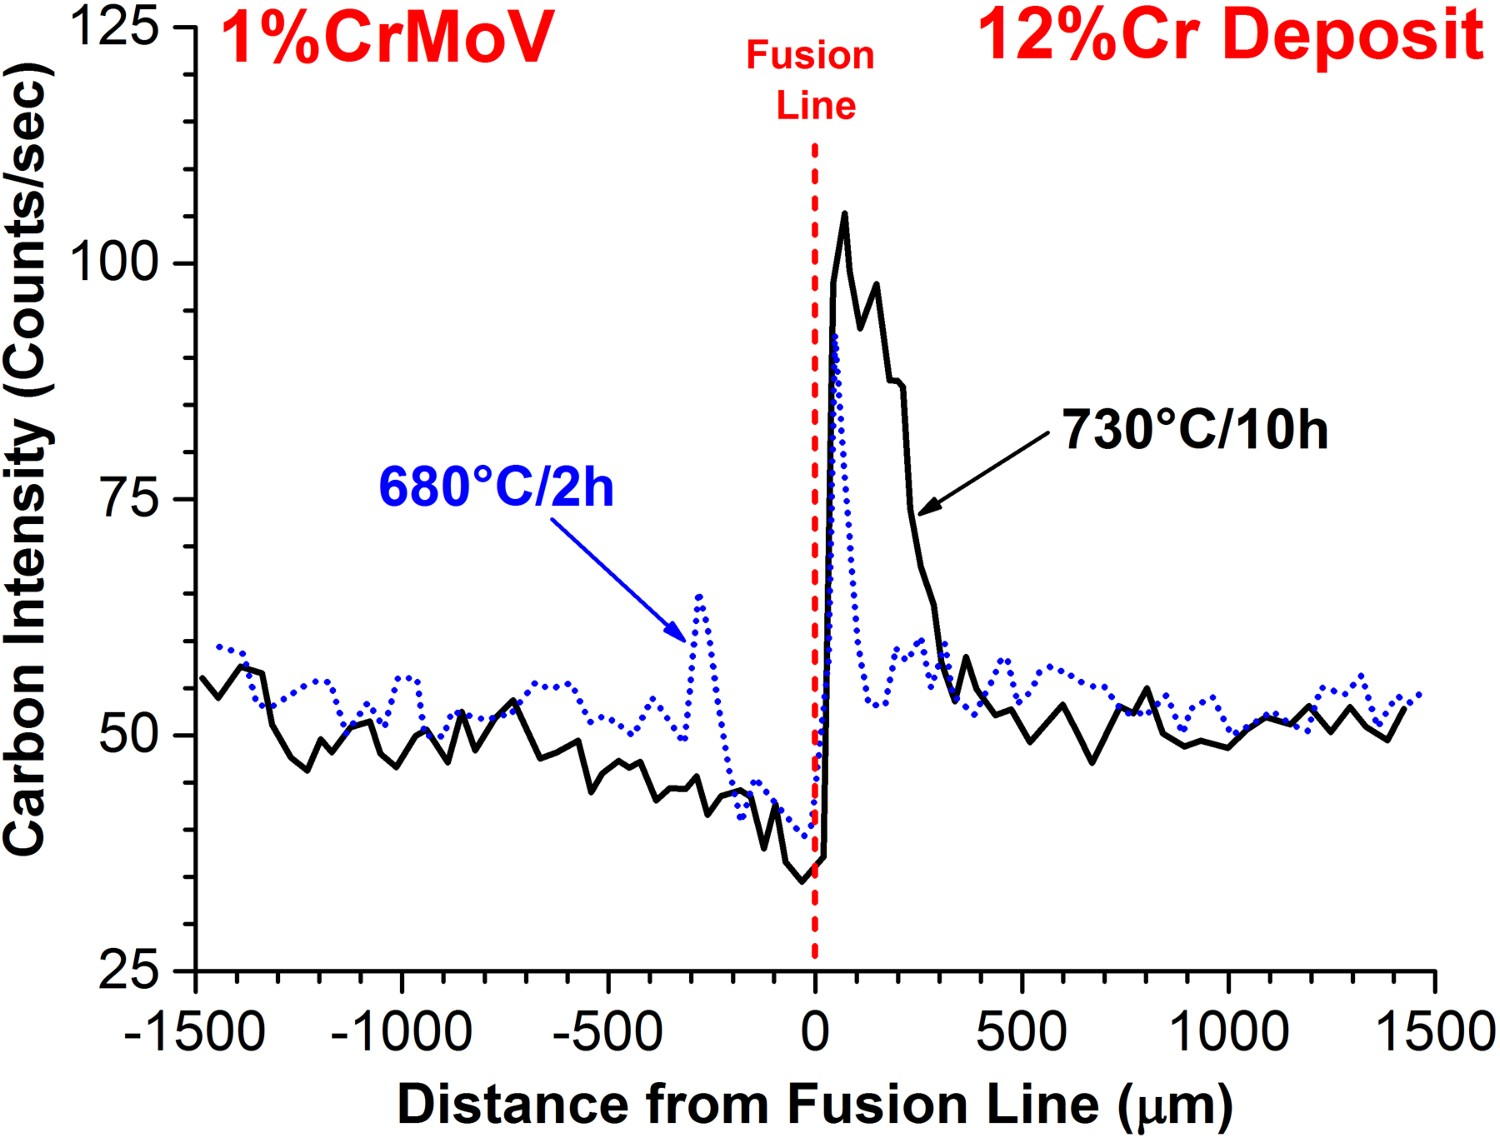
The effect of PWHT on the measured width of the CDZ is provided in Figures 22–24. The fusion line in a weldment between a CrMoV bainitic steel and a 5Cr and 12Cr weld metal were investigated following PWHT at 730°C (1346°F) for 2 h, Figure 22 [57]. Effect of PWHT (730°C/2 h) on the migration of carbon at the fusion line in a ferritic to ferritic DMW between a 1%CrMoV parent material and either 5%Cr or 12%Cr weld metal [57]. Effect of PWHT (680°C/2 h and 730°C/10 h) on the migration of carbon at the fusion line in a ferritic to ferritic DMW between a 1%CrMoV parent material and 12%Cr weld metal [57]. (A) Characteristic micrograph of the fusion line between a 2.25Cr–1Mo and 9Cr–1Mo weld following PWHT at 750°C (1382°F) for 4 h and service exposure to 580°C (1076°F) for 10,000 h. [58]. (B) measured redistribution of carbon in a 9Cr–1Mo and 2.25Cr–1Mo weld following PWHT at 730°C (1346°F) for 3 h and service exposure to 580°C (1076°F) for 10,000 h [58].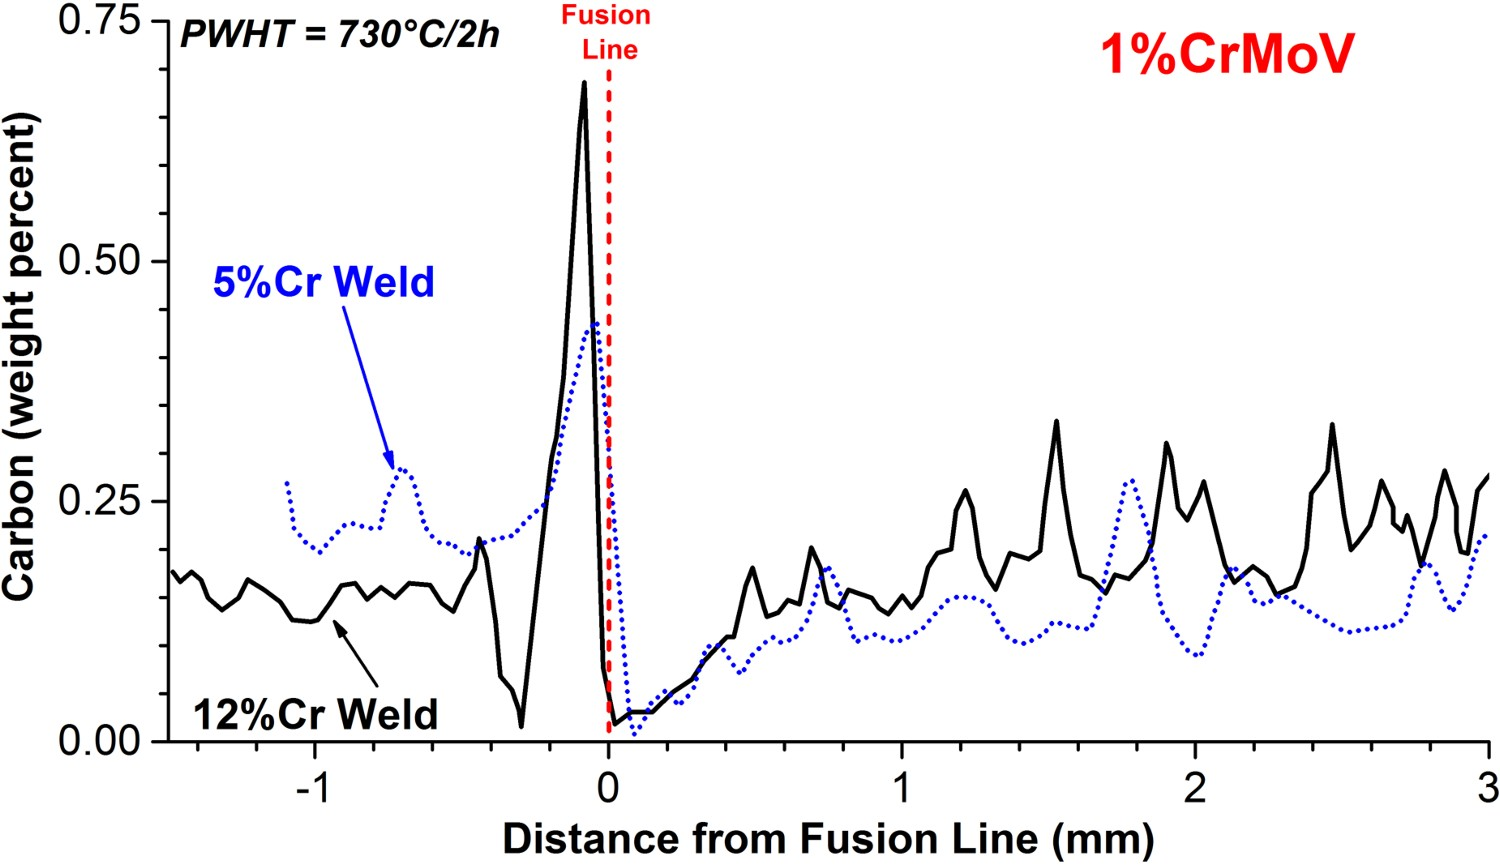
In this example, there are similar trends in the formation of a CDZ and a CEZ. Where the 1CrMoV steel was welded with the higher Cr-content filler metal (12CrMoV), the peak in the CEZ appears to be more pronounced.
In Figure 23, the results in [57] were evaluated for a 12CrMoV filler metal deposited on a 1CrMoV base metal for PWHT thermal cycles of 680°C (1256°F) for 2 h and 730°C (1346°F) for 10 h. In this comparison, the effect of the higher temperature and time are clearly demonstrated where the absolute peak in carbon and the width of the CEZ are more distinct.
Kozeschnik et al. [58] investigated the influence of filler metal on the measured and simulated carbon migration. In their results, the authors identified a clear effect following a PWHT cycle, Figure 24(A,B). In these examples, the effect of the Cr gradient and mandatory PWHT cycle to that of the Grade 91 constituent is clear. In this example, the deleterious formation of the CDZ is a direct result of the combination of welding and PWHT.
Anand et al. [60] showed the influence of a 9Cr–1Mo weld metal against a 2.25Cr–1Mo base metal following a relatively modest PWHT at 650°C (1202°F) for 1 and 50 h using EMPA, Figure 25. The trend in the measured carbon content is similar to that of the previously detailed results. Effect of time (1 and 50 h) at temperature (650°C, 1202°F) for a DMW between a 2.25Cr–1Mo base metal and 9Cr–1Mo weld metal. Measurements made using the EMPA quantification method [60].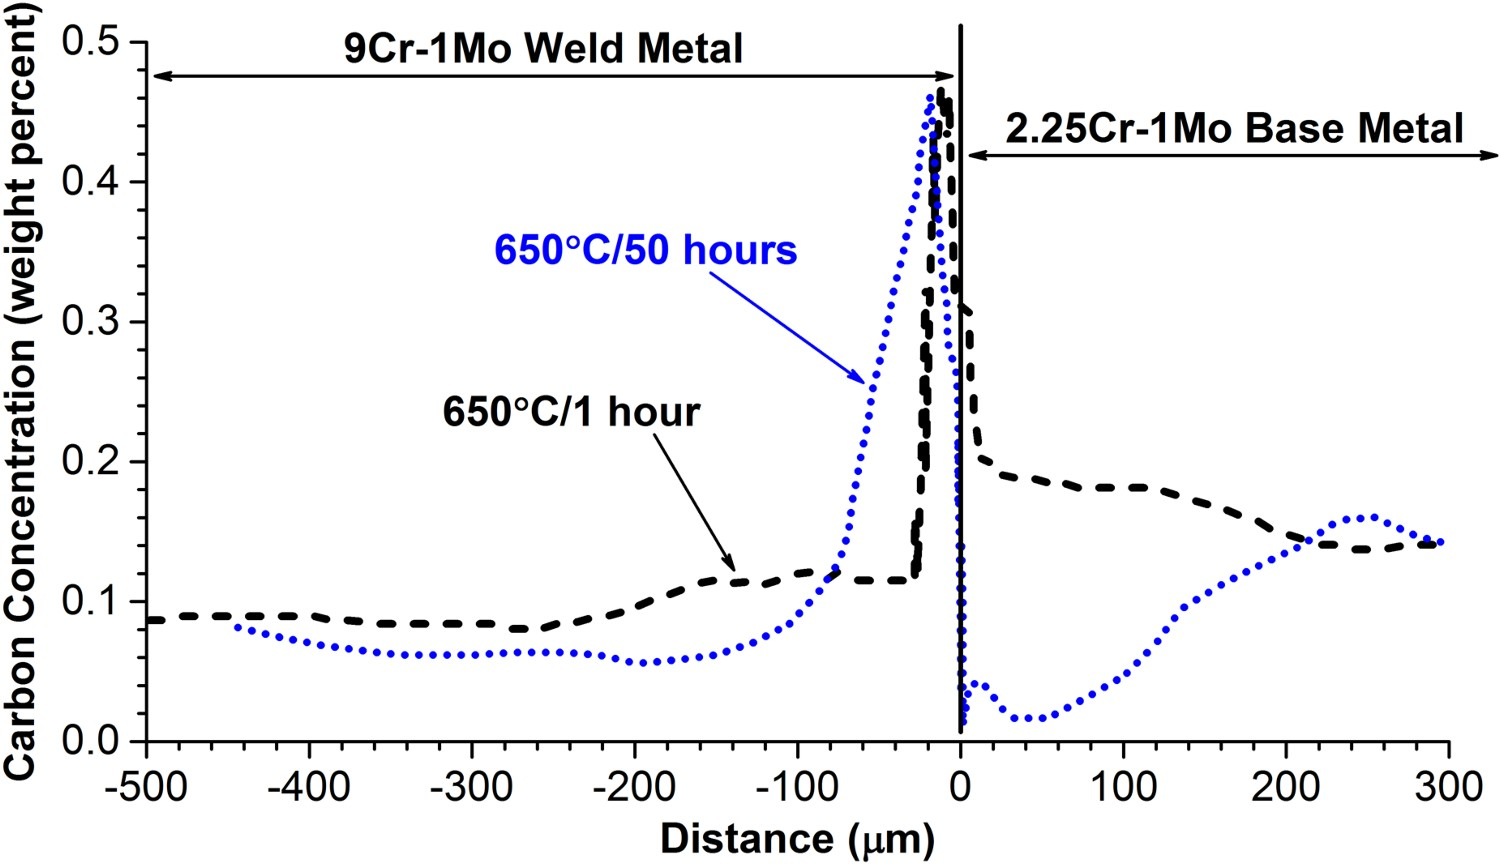
Lundin [55] observed that in the fusion zone of bead-on-plate welds in which a 9Cr–1Mo weld metal was deposited on a 2.25Cr–1Mo base metal plate by means of GTAW, the formation of a CDZ started in the overlapped HAZ region between the first and the second weld pass after a PWHT at 732°C (1350°F) for 1 h. He concluded that due to multiple thermal cycling the accumulative phase transformations in this region reduced the grain size compared to other regions adjacent to the fusion line in the base metal. Through grain boundary refinement, carbon atoms migrate faster in this region due to a higher fraction of grain boundaries compared to coarse-grained structures. Lundin estimated that the diffusion in the fine-grained overlap region is about an order of magnitude faster than that in the coarse-grained region. Figure 26 shows optical micrographs of the weld configuration and the first signs of decarburisation in the HAZ in the overlap region between the first and second pass. This work highlights the importance of PWHT and of the effect that multi-pass weld thermal cycles can have in the formation of CDZ and CEZ in a DMW. Light optical micrograph of 9Cr–1Mo weld metal deposited by the GTAW process on 2.25Cr–1Mo base metal and following PWHT at 732°C (1350F) for 16 h revealing localised carbon migration in overlapped weld bead regions in the heat affected zone of the 2.25Cr–1Mo base metal [55].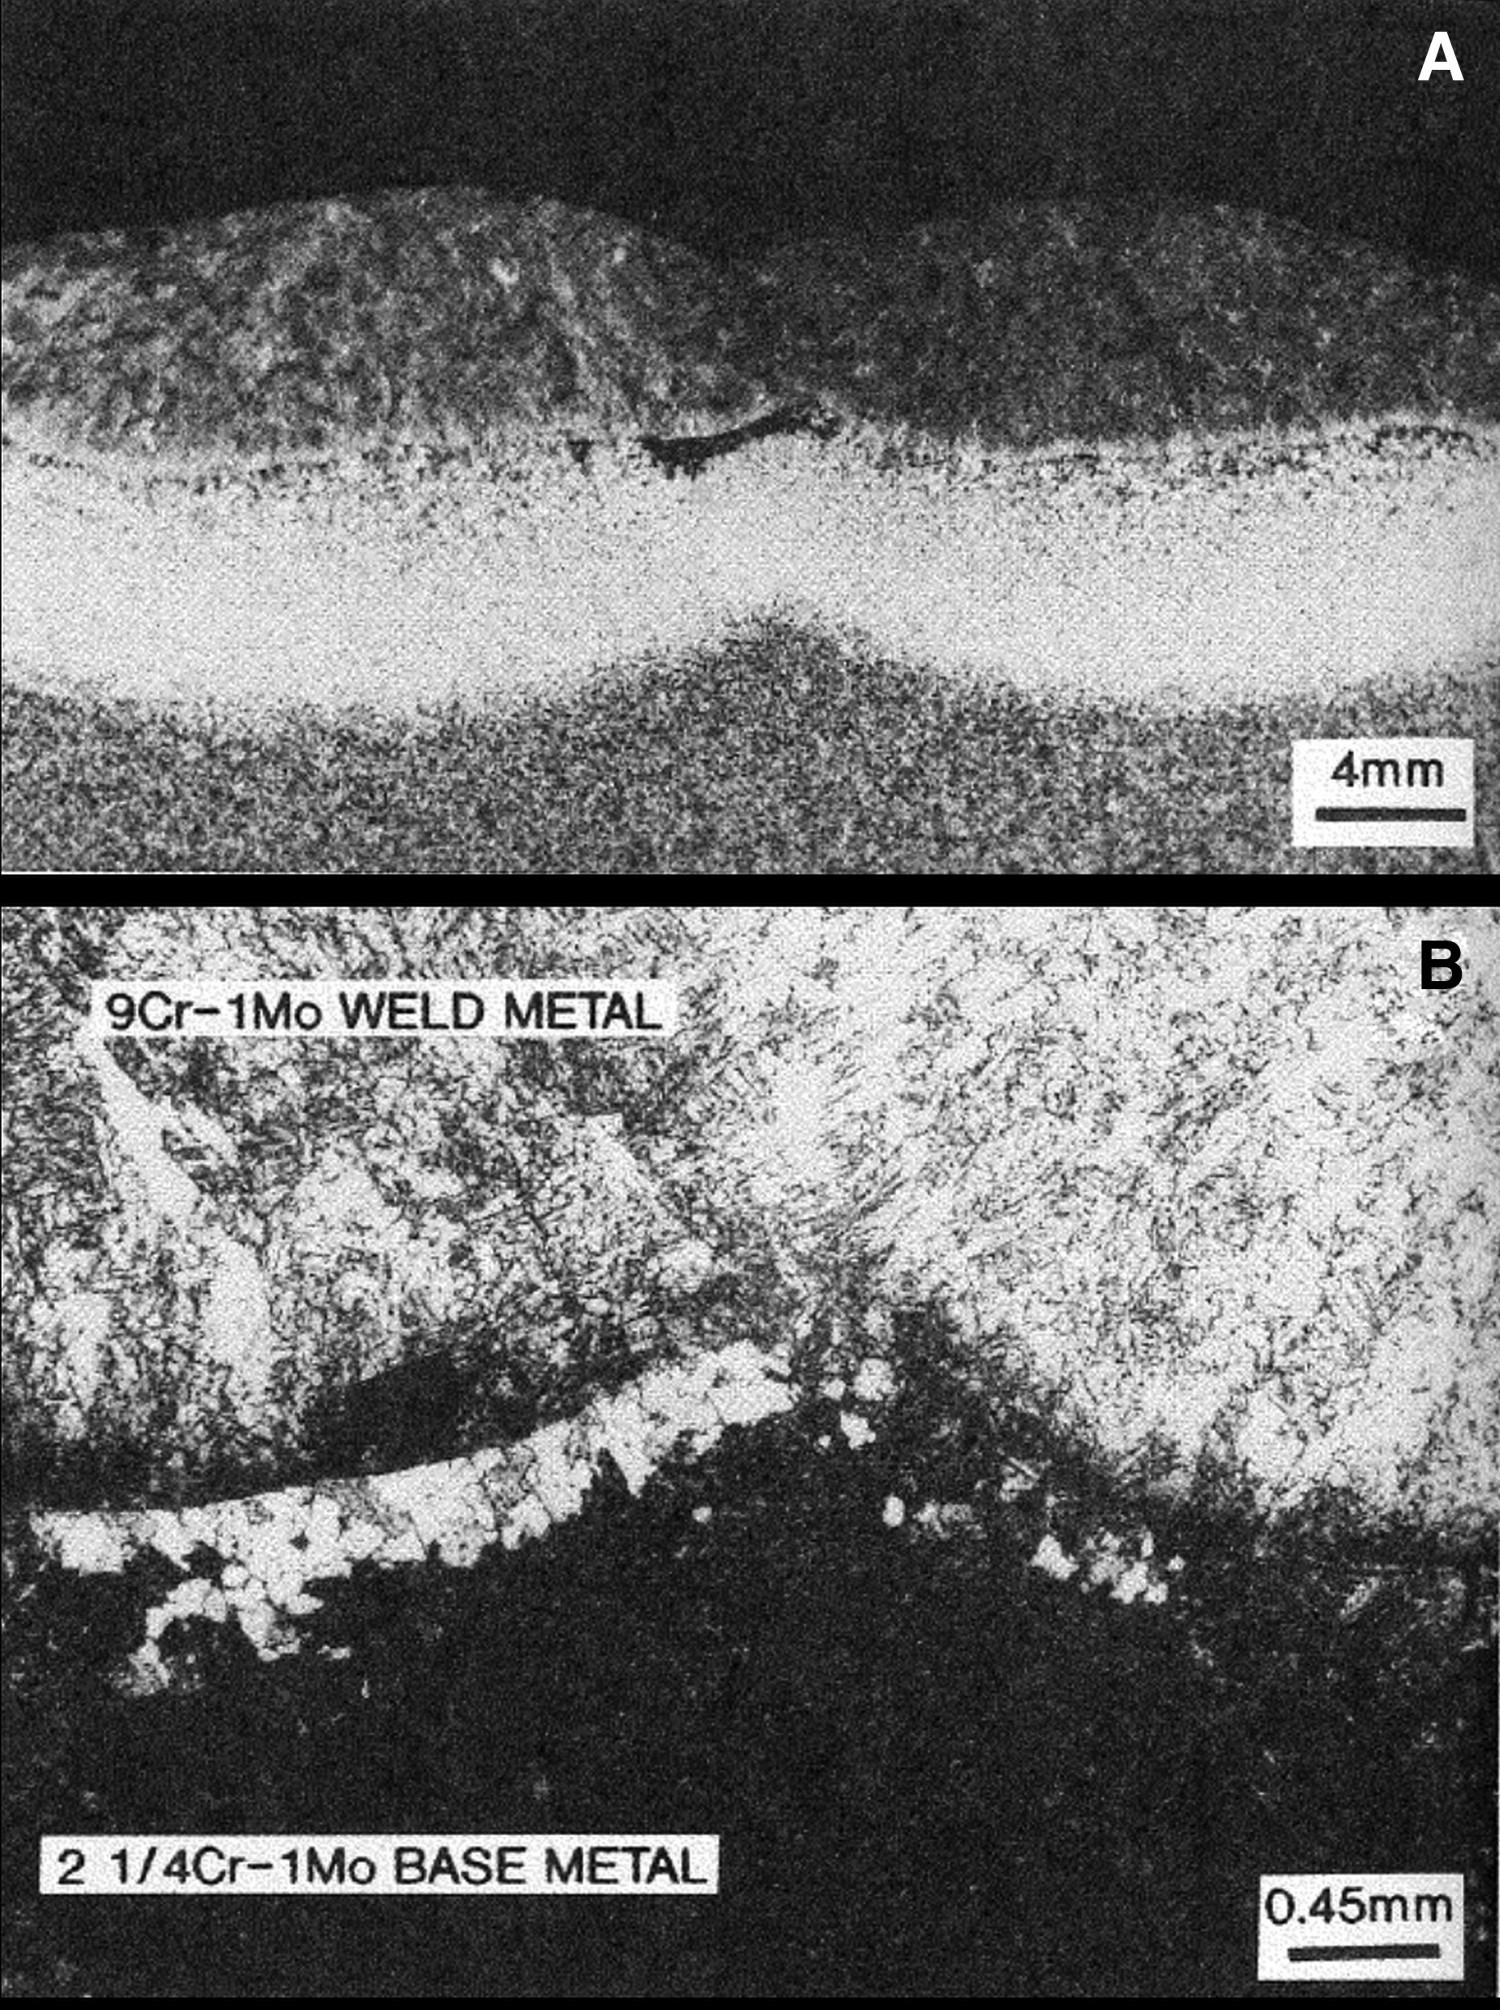
Influence of service exposure on carbon migration
There are relatively few studies which examine the effect of carbon migration during service at temperatures that are lower than conventional PWHT. This is an important clarification because DMWs may be expected to operate for durations in the 100,000s of hours and for conditions that are likely not directly relevant to PWHT.
Different PWHT temperatures and times were investigated in Ref. [57] showing the general trend that increases in temperature and time increased the width of the CDZ, Figure 27. In this study, weldments which were given different PWHT thermal cycles were subsequently exposed at 550°C (1022°F) for times ranging from 2000 to 10000 h. Interestingly, the widths of decarburised zones differing after welding or PWHT begin to merge for the longest investigated duration at 550°C (1022°F). emphasising the importance of long-term service on formation and growth of the CDZ in DMWs. Effect of PWHT on the width of the decarburised zone in a ferritic to ferritic DMW between 1Cr–1Mo–0.25V and 12Cr–1Mo–0.25V base metals. In this figure, the filler metal is 12Cr filler metal [57].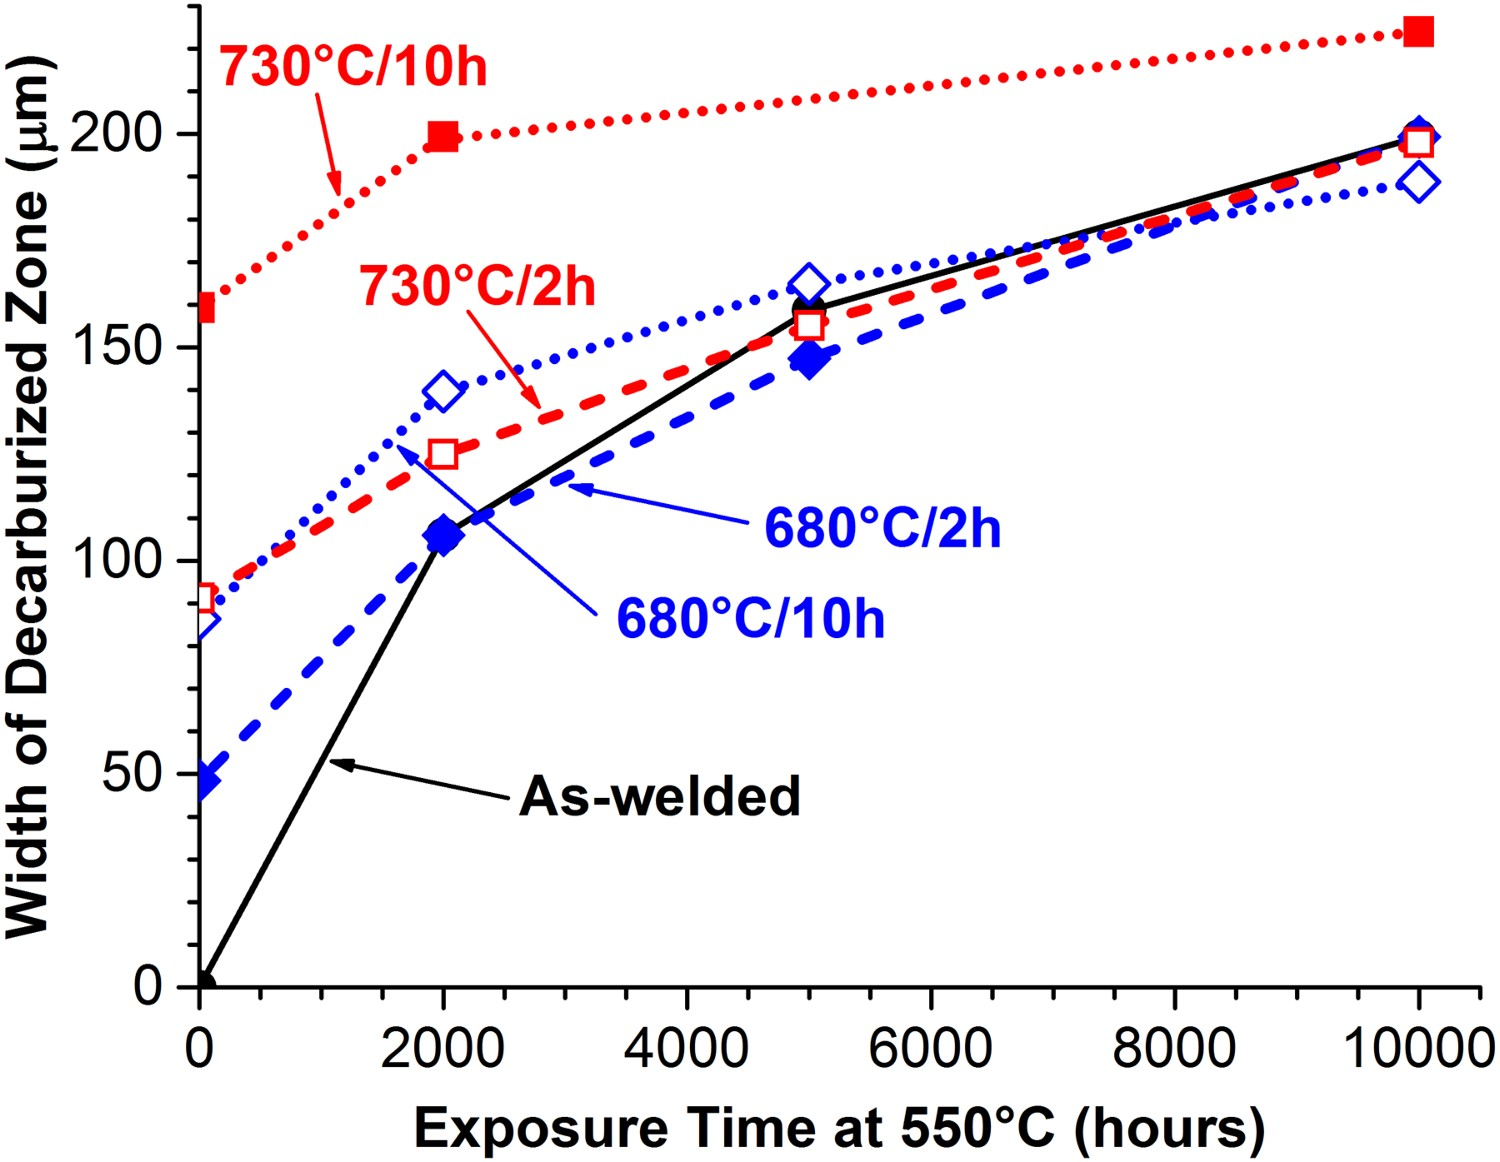
Simulation of carbon migration
Owing to the difficulty in accurately measuring the CDZ and CEZ in a given DMW as well as the durations often required to develop meaningful results (such as long-term aging at service temperatures), the maturation of thermal models to describe the formation of the CDZ and CEZ in dissimilar metal couples has been particularly helpful. Initial approaches to modelling the diffusion of carbon in ferritic DMWs was based on the classical experiments by Darken [53,61,62]. As discussed previously in the Christoffel and Curran experiments, the carbon diffusion in ferritic DMWs is far more complex than originally suggested. The complexity is associated with a number of factors that must be resolved: At elevated temperature, such as during welding thermal cycles or normalisation, the materials may be face-centred-cubic (FCC). However, during PWHT or service the materials are body-centred-cubic (BCC). There is little free carbon in ferritic BCC systems. In mild steels, the carbon is precipitated as cementite. In low-alloy steels, the carbon may be present in a number of carbides such as M23C6 or M2C and in high strength CSEF steels, the carbon may be present as M23C6, M6C or MX. The dissolution of these phases is an important consideration in the lower chromium material to create the necessary ‘free carbon’ for migration. Absorption of carbon and formation of carbides in the higher chromium material. As carbon saturates, the higher chromium constituent and carbides begin to precipitate, the migration of carbon slows with increasing time at temperature.
The authors in Refs. [63,64] considered non-parabolic kinetic relationships for calculating the extent of carbon migration using a discrete particulate model for diffusion in a 2.25Cr–1Mo to mild steel weldment and at applied PWHT temperatures of 620 and 700°C. This approach was chosen so as to accommodate the dissolution and re-precipitation of carbides and the non-parabolic nature of the carbon migration process. A depiction of the discrete particulate model is provided in Figure 28. Schematic for the discrete particulate model to describe carbon migration in ferritic to ferritic DMWs [63].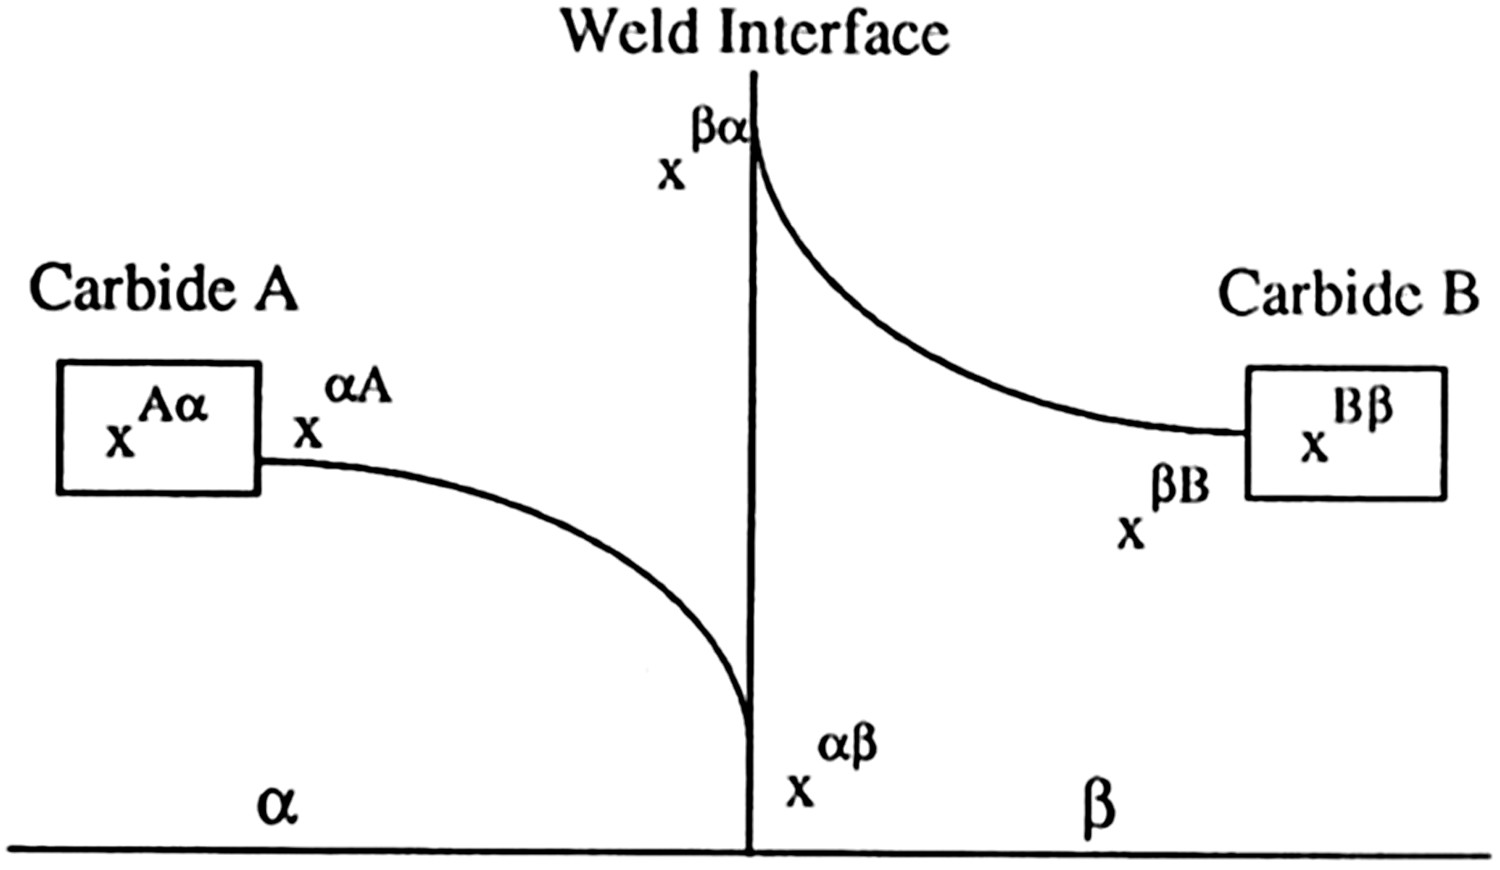
A comparison of this approach to actual measurements is provided in Figure 29. It can be seen that the modelling under-estimates the extent of diffusion for both of the investigated PWHT temperatures, e.g. at 700°C after 40 h the width of CDZ is about 2.5 and 0.8 mm for the measurement and the simulation, respectively. Measured width of the carbon-denuded zone at 620 and 700°C using optical microscopy (a) and calculated width of the carbon-denuded zone at 620°C and 700°C using the developed model in [63]. Note the difference in the y-axis scale for each graph.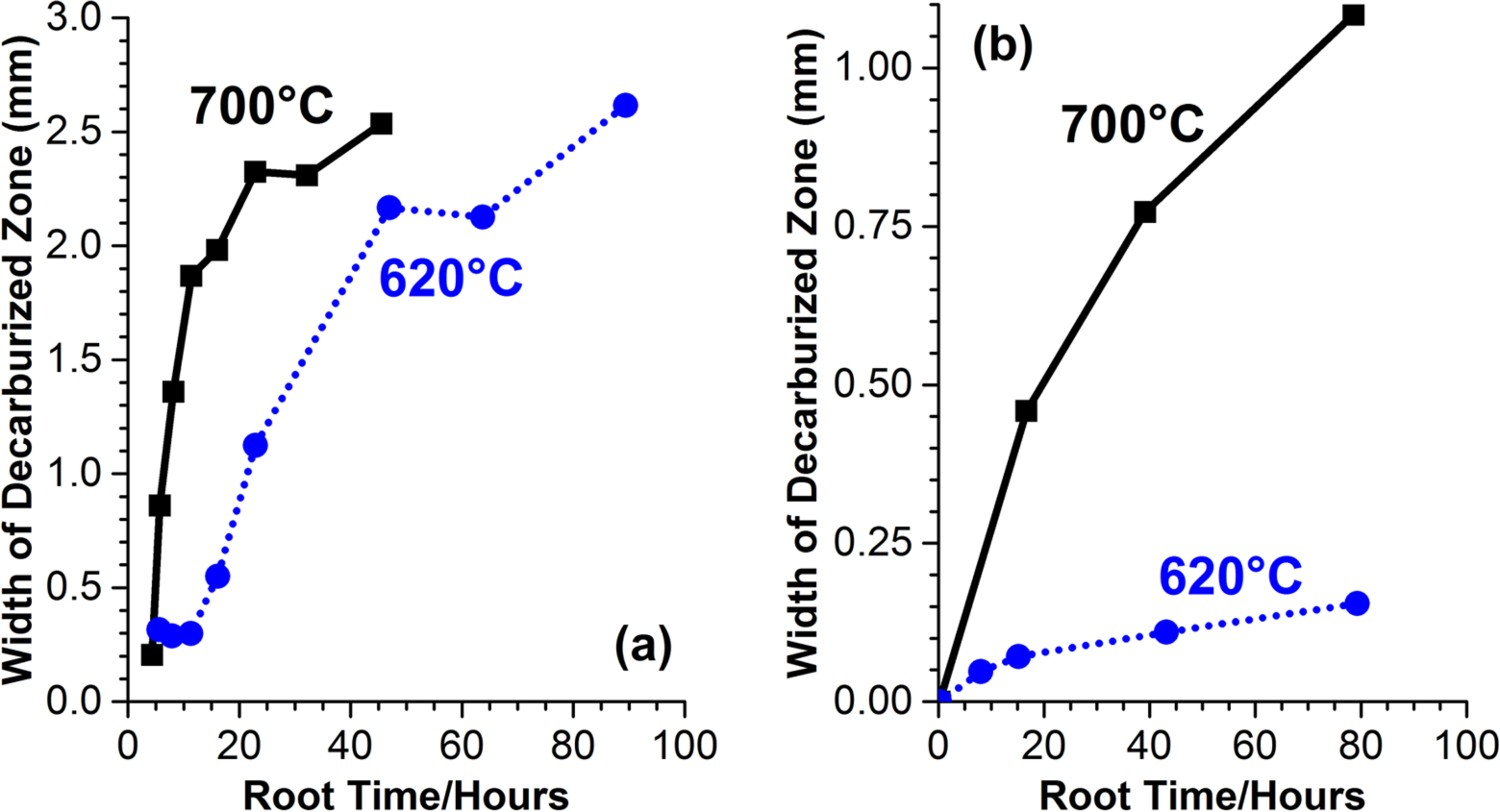
To adequately describe and account for this complex behaviour, researchers commonly use CALPHAD tools such as DICTRA [65] and MatCalc [66]. Their models are based on ternary diffusion, first described by Christoffel and Curran in [3] and subsequently examined in several papers [57,67–70].
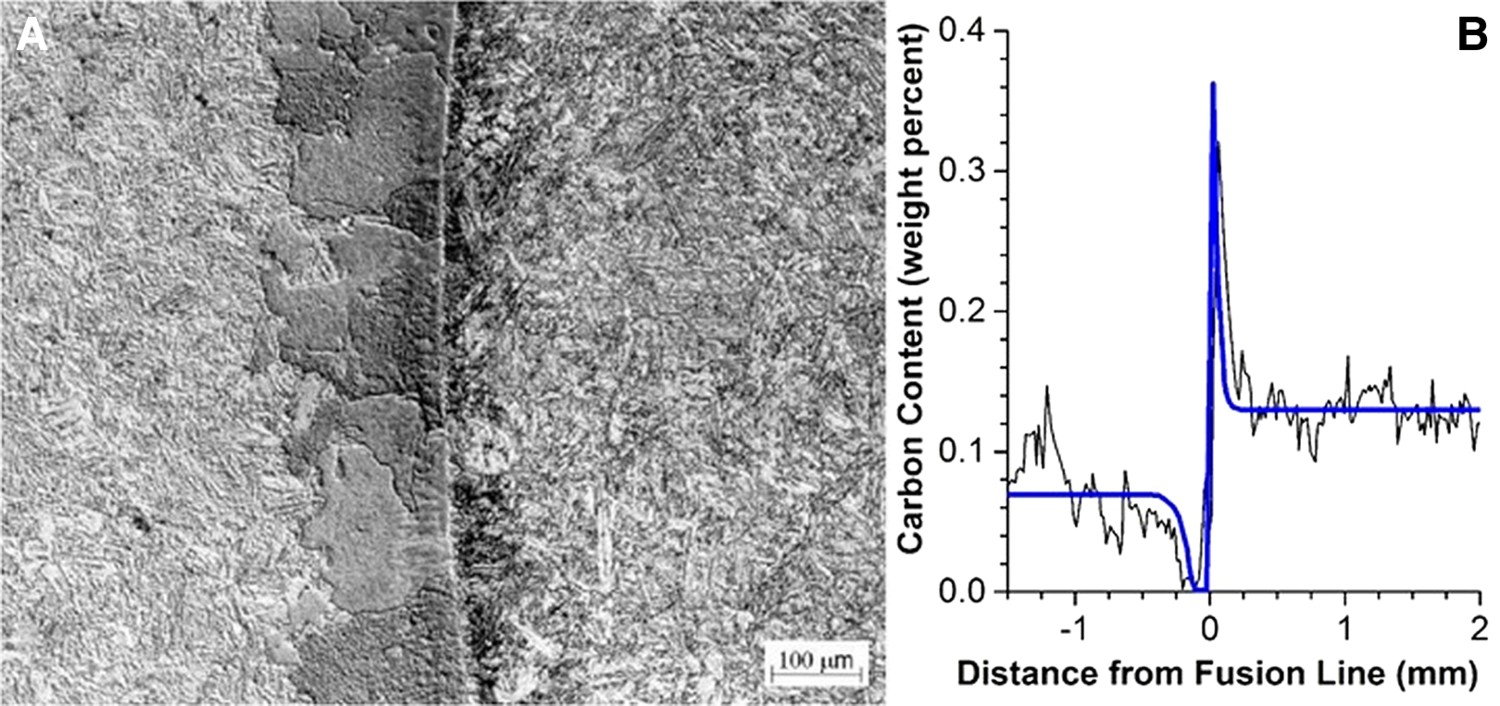
The authors in Ref. [69] measured the carbon migration across the fusion line of a weldment made between 2.25Cr–1Mo base metal and a 12Cr weld metal using EMPA. The results of the simulation for carbon migration across the fusion line are in excellent agreement with the results of the measurement, Figure 30. Comparison of EMPA results to a simulation for carbon migration. The multi-pass weldment of interest was made between 2.25Cr–1Mo base metal and 12Cr weld metal and given a PWHT of 750°C (1382°F) for 2 h [69].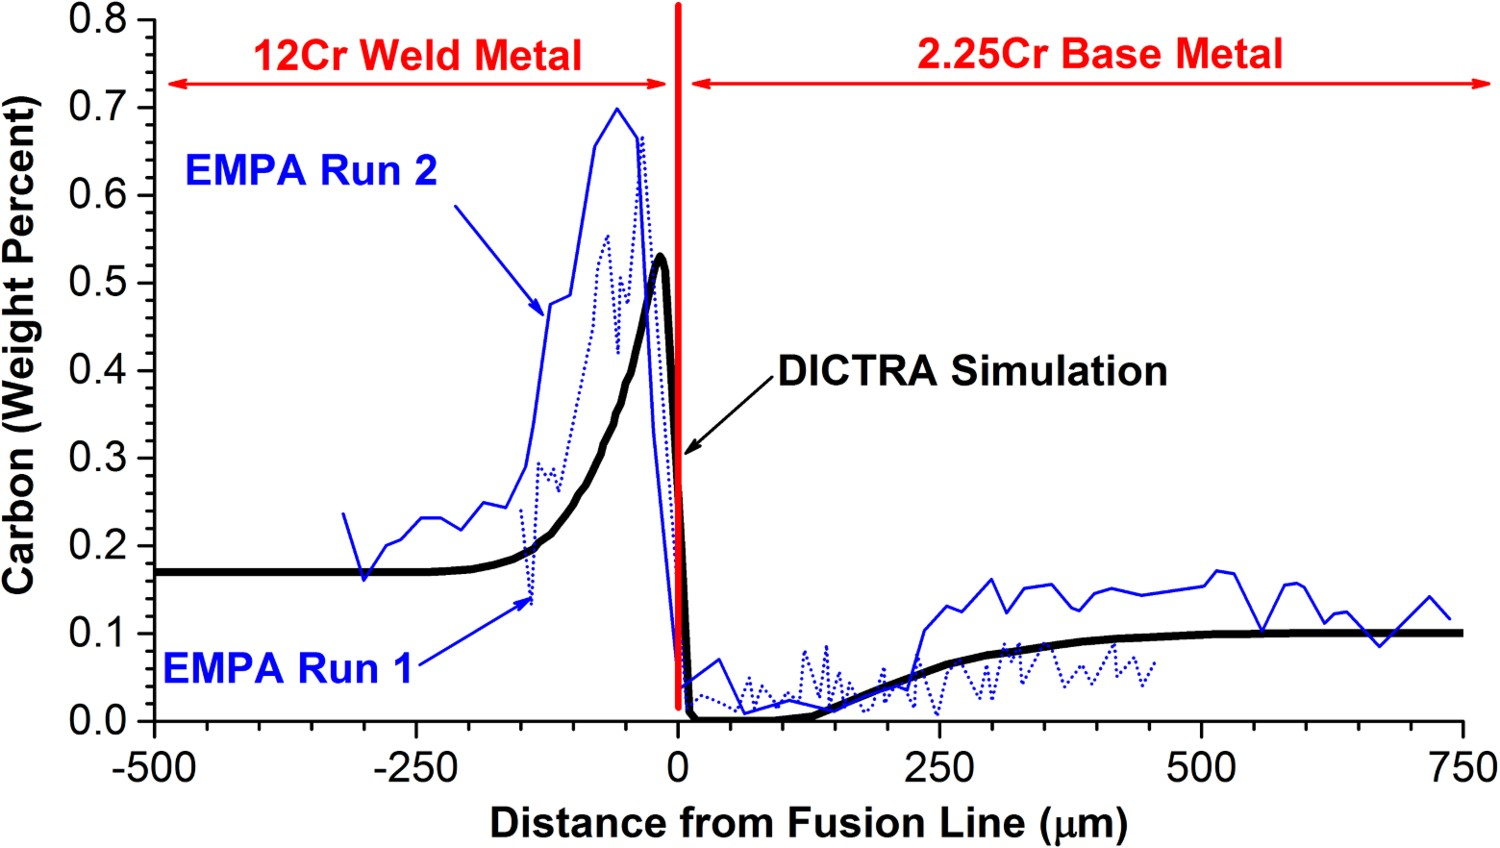
In utilising the baseline weldment to examine the validity of the results, the researchers extended the simulations to examine the effect of PWHT temperature on the extent of carbon migration, Figure 31. Effect of PWHT temperature on carbon migration in a 2.25Cr–1Mo to 12Cr weldment for 2 h [69].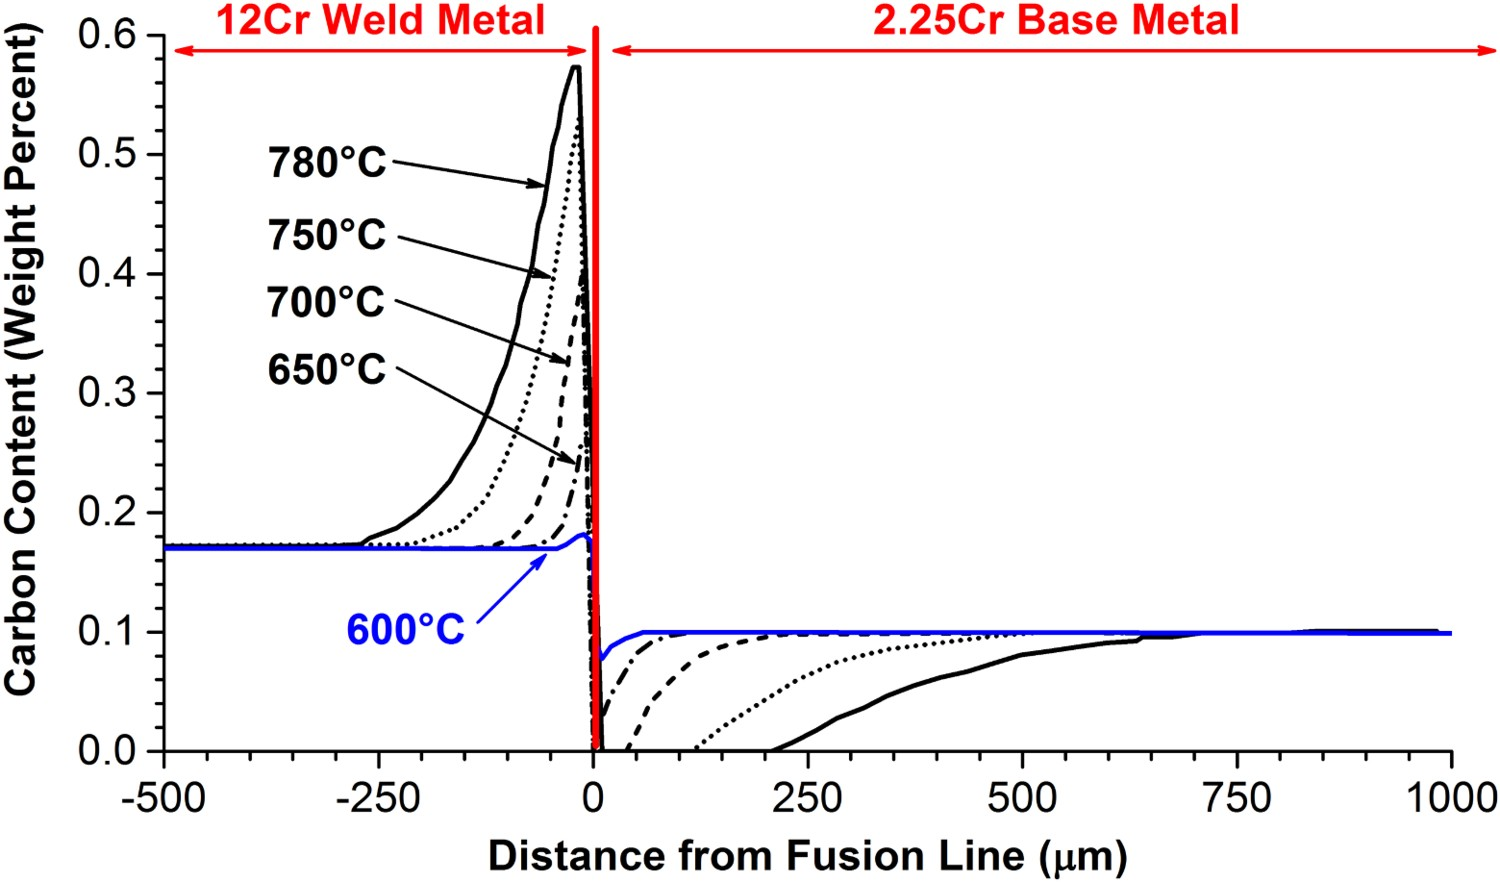
The effect of PWHT is shown in this Figure to be quite profound on the formation and growth of the CDZ and CEZ.
A recent publication compared the methods for measuring CDZ in a Grade 22 to Grade 91 DMW made using E8015-B8 filler material, Figure 32. Comparison of the simulated carbon migration in a 2.25Cr–1Mo (P22) to 9Cr–1Mo (E8015-B8) weldment to different measurement techniques: (A) results for MatCalc simulation; (B) EMPA measurement across fusion line; C – light microscopy measurement of CDZ at fusion line; (D) microhardness (HV 0.05) measurements across fusion line.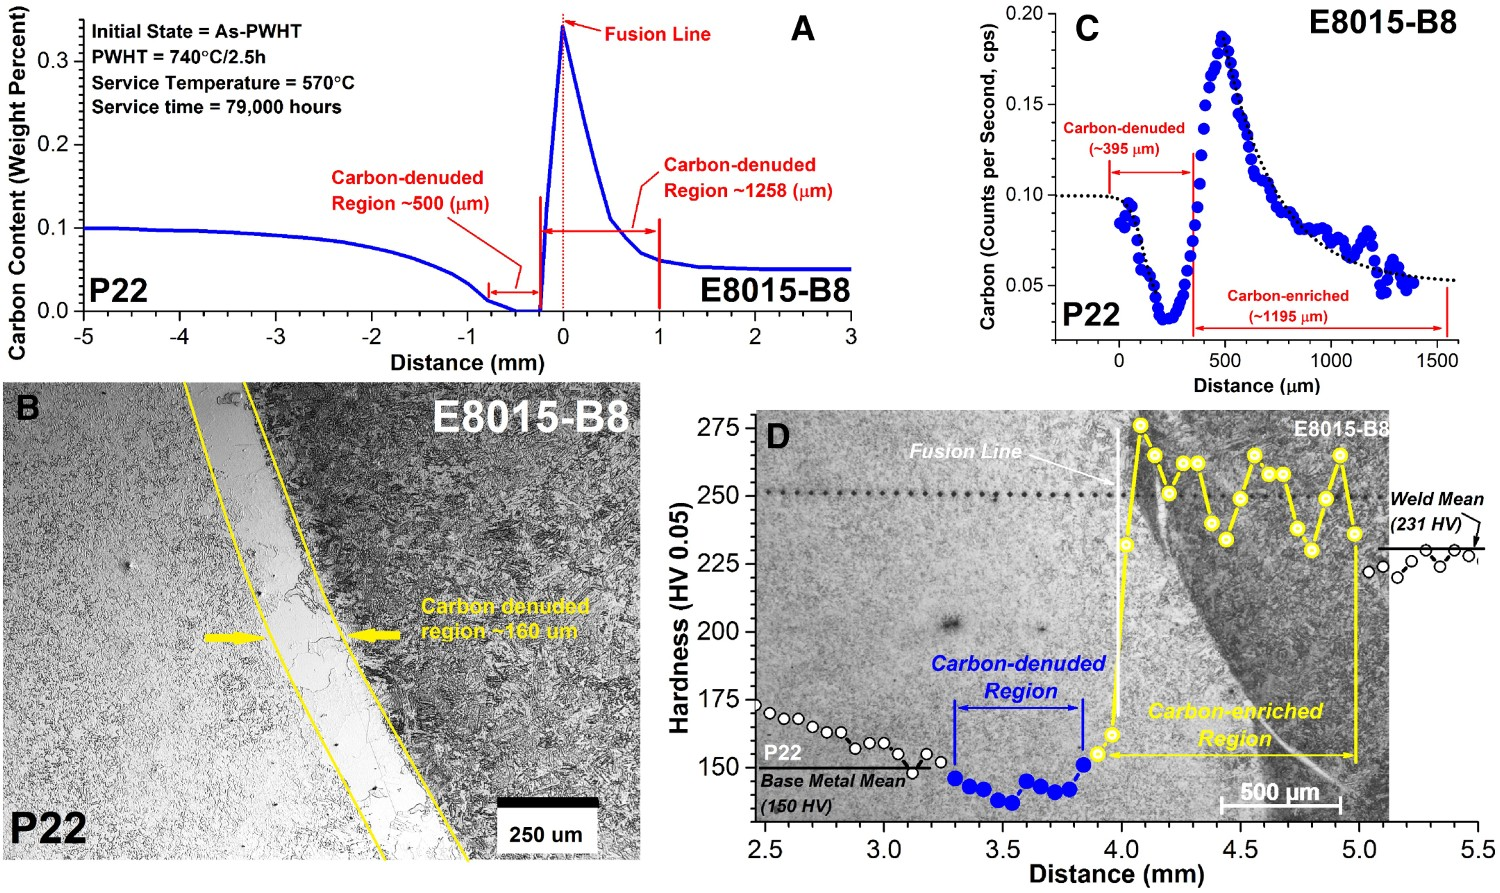
The weldment of interest was provided from an ex-service Grade 22 to Grade 91 weld using 9Cr–1Mo (E8015-B8) filler metal. The final weld (cross section shown in Figure 5) was given a PWHT at 740°C for 2 h and then operated in service at 570°C for 79,000 h [5]. The calculated width of the CDZ and CEZ determined using MatCalc is compared with the results for measurements made using light microscopy, EMPA and a low-load hardness traverse across the fusion line. As shown in the figure, the results for measured carbon values using EMPA and calculations are in reasonable agreement, whereas the light microscopy vastly underestimates the size of the CDZ. The hardness traverse is reliant upon proper interpretation and may provide a better estimate of the CDZ as opposed to light microscope alone.
The ability to simulate carbon migration with reasonable accuracy has produced a number of relevant publications which examine the effect of alloying content on carbon migration [68,71]. In Figure 33, a comparison is shown between several steels and for PWHT or service conditions [71]. Comparison of the carbon activity for various materials at a PWHT temperature of 750°C (1382°F) and a service temperature of 600°C (1112°F).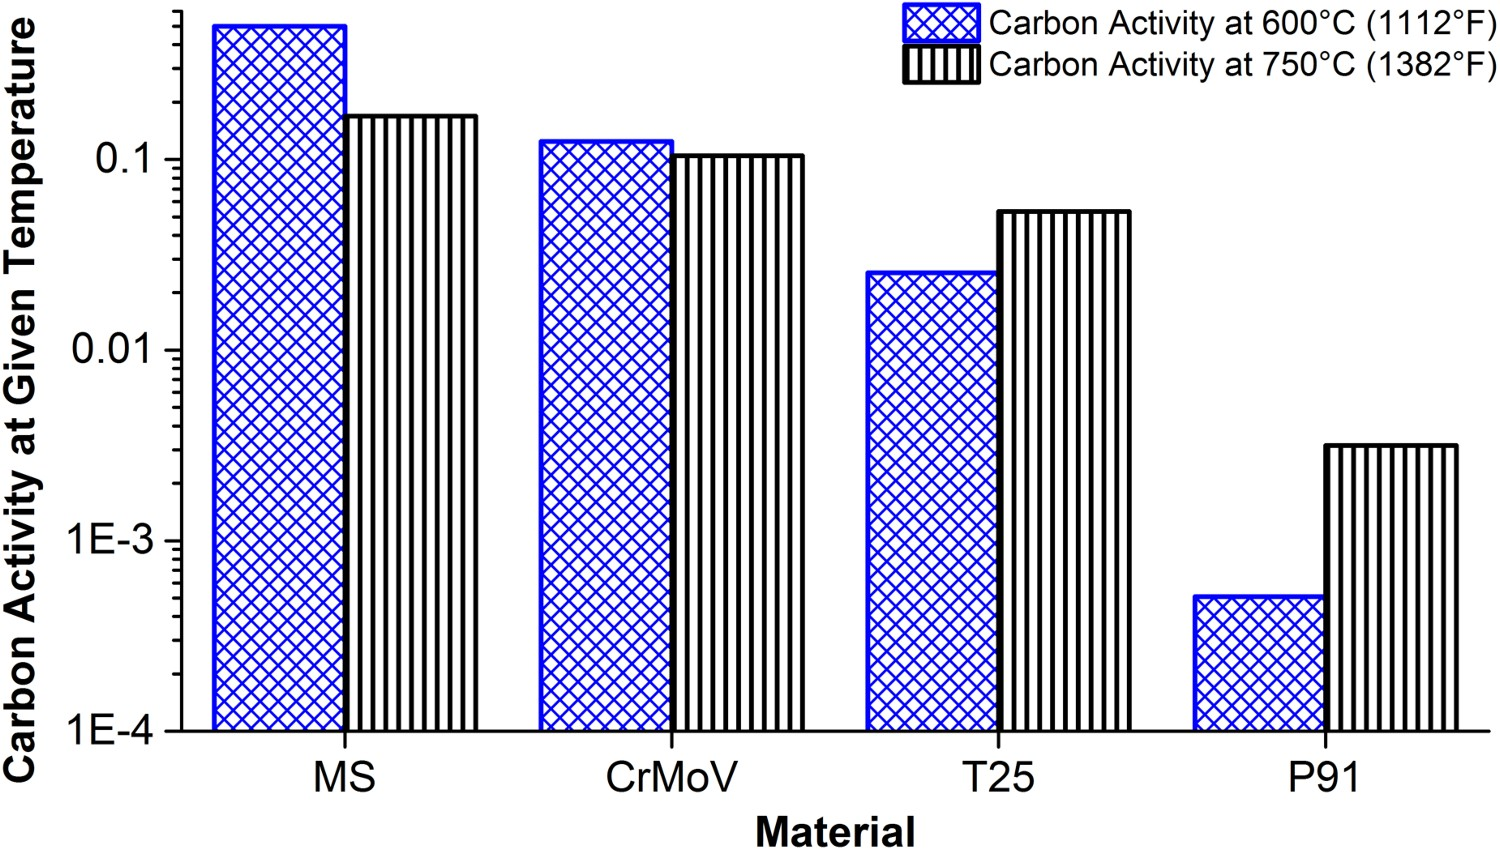
In some instances, the effect of PWHT may not be as great as that of service exposure and vice versa due to the potential for phase transformations within the PWHT range (such as for MS and CrMoV). In cases where the material does not transform to austenite at the stated PWHT temperature, such as for P91, the carbon activity is changed by ∼an order of magnitude at the stated PWHT temperature of 750°C (1382°F).
The influence of the alloying content including chromium and carbide formers on the carbon activity at 600°C (1112°F) is plotted in Figure 34 [68]. Calculated carbon activity values for carbon, low alloy and CSEF steels and at a service temperature of 600°C (1112°F) [68].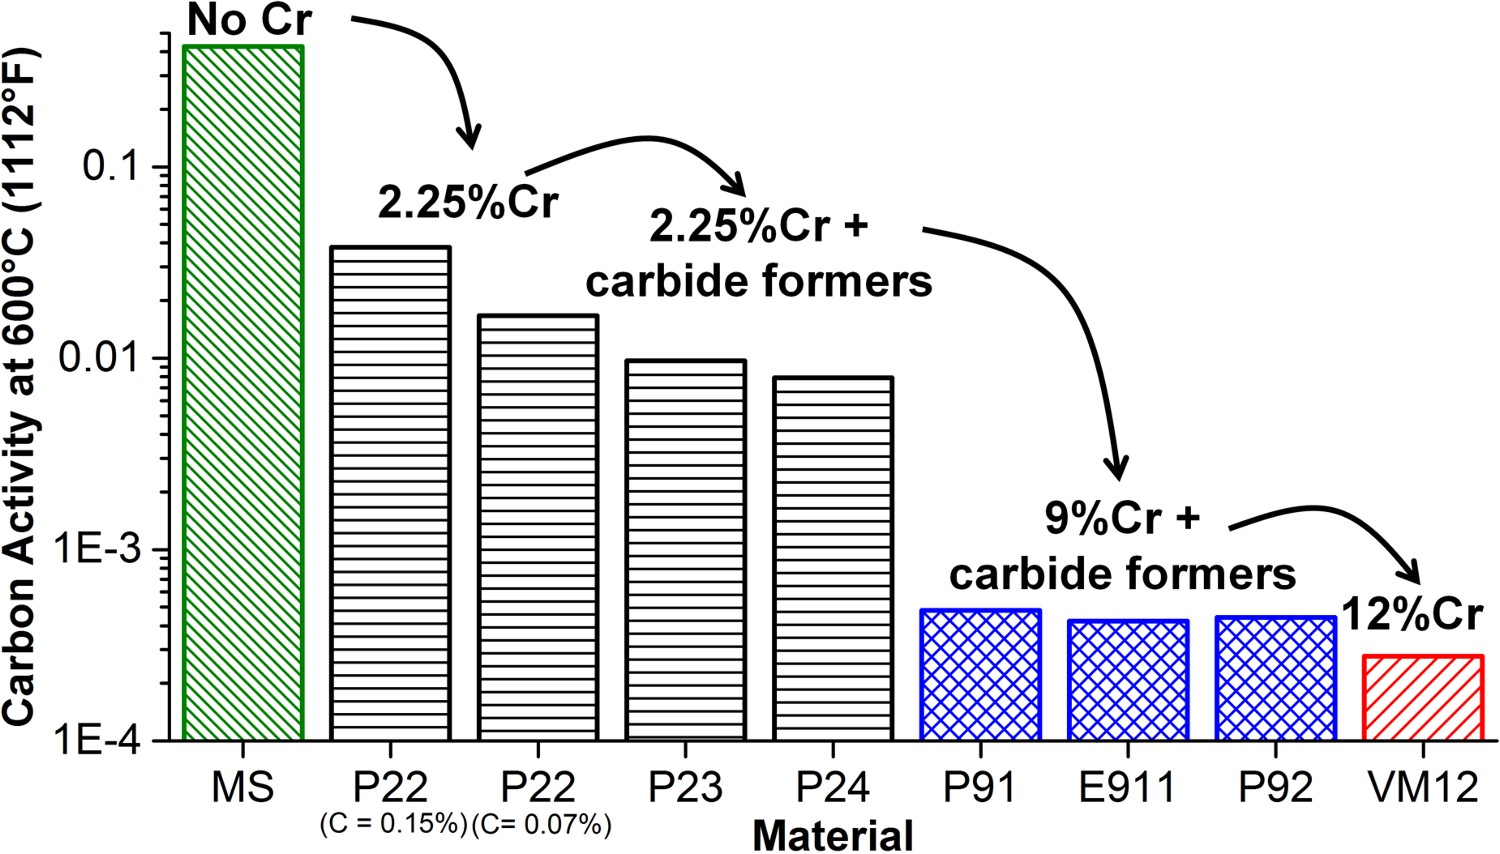
Notably, the carbon activity decreases with either decreasing carbon content and/or the presence of carbide-forming elements in the matrix. In the case of P22, the influence of carbon content is notable in that a carbon increase of ∼2X (from 0.07 to 0.15 wt-%) increases the carbon activity by a similar factor. Furthermore, the addition of carbide formers to the P22 such as in compositions consistent with P23 (Nb and V) and P24 (Ti and V) reduces the carbon activity by ∼50%.
To show the effect of chromium on behaviour, the authors examined a composition for Grade 91 steel and only varied the chromium content from 2.5 to 8.5 wt-%weight percent, Figure 35 [68]. Calculated carbon activity values for a P91 steel composition with variation only in the chromium content and at a service temperature of 600°C (1112°F) [68].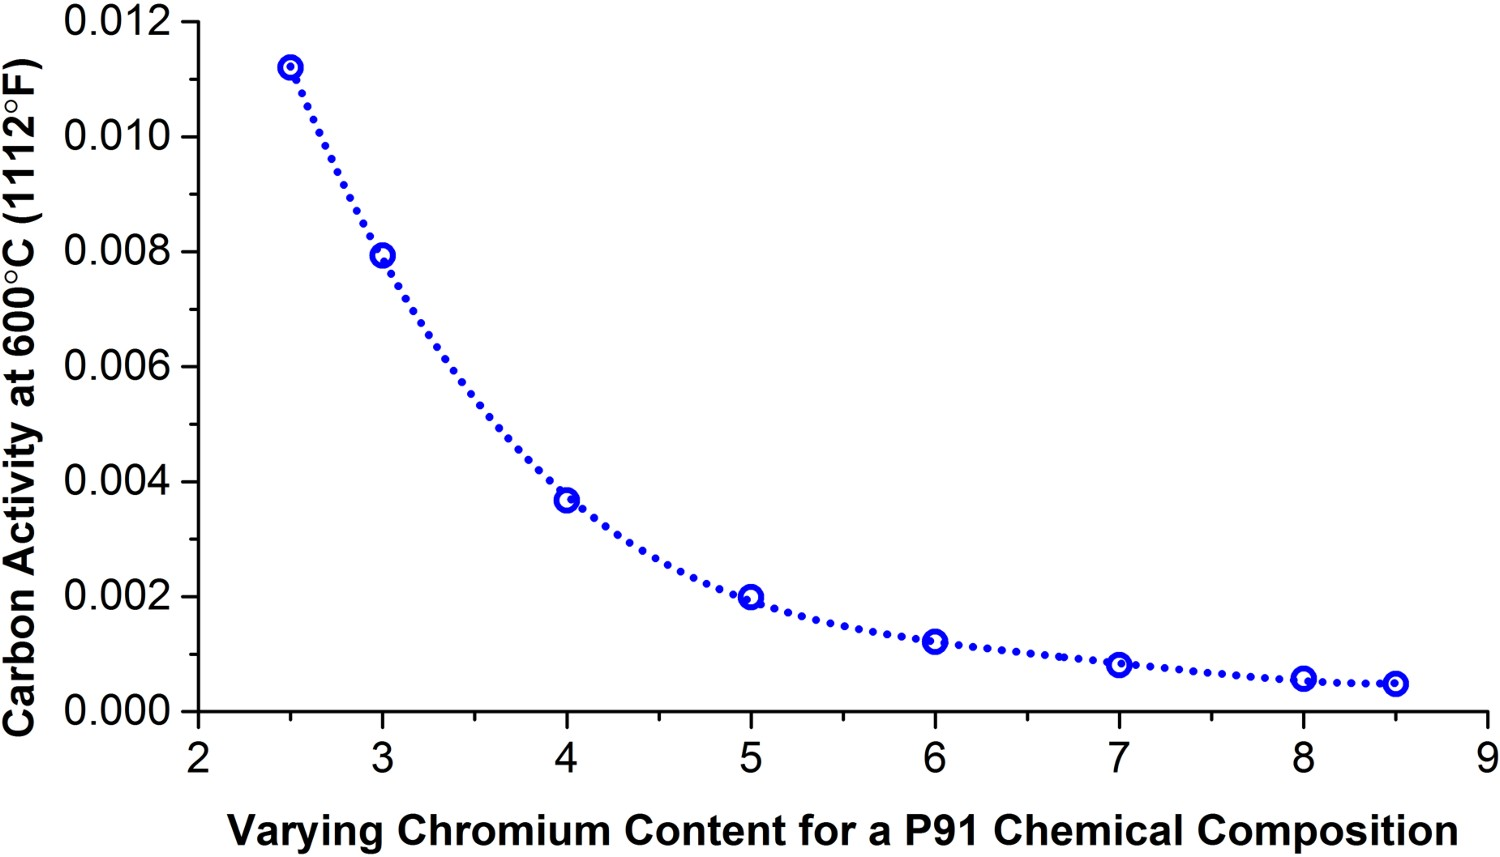
Within this range, the carbon activity at 600°C (1112°F) was changed by at least an order of magnitude. The formation of deleterious regions in a ferritic to ferritic DMW is a continued trend irrespective of the materials of interest. In summary, the carbon activity is affected by a function of no less than four key variables: Alloying content such as the difference in chromium and carbo-nitride forming elements; Number of thermal cycles during welding; PWHT temperature and time at PWHT; Service temperature and time in service.
High-temperature performance in creep
In simple uniaxial creep tests, the performance of a given DMW is generally controlled by the rate or extent of carbon migration in the composite structure and the constraint provided by the filler material. In two separate studies, the effect of the weld metal strength was examined in the performance of Grade 22 to Grade 91 and of Grade 23 to Grade 91 DMWs [72–74], Figures 36 and 37.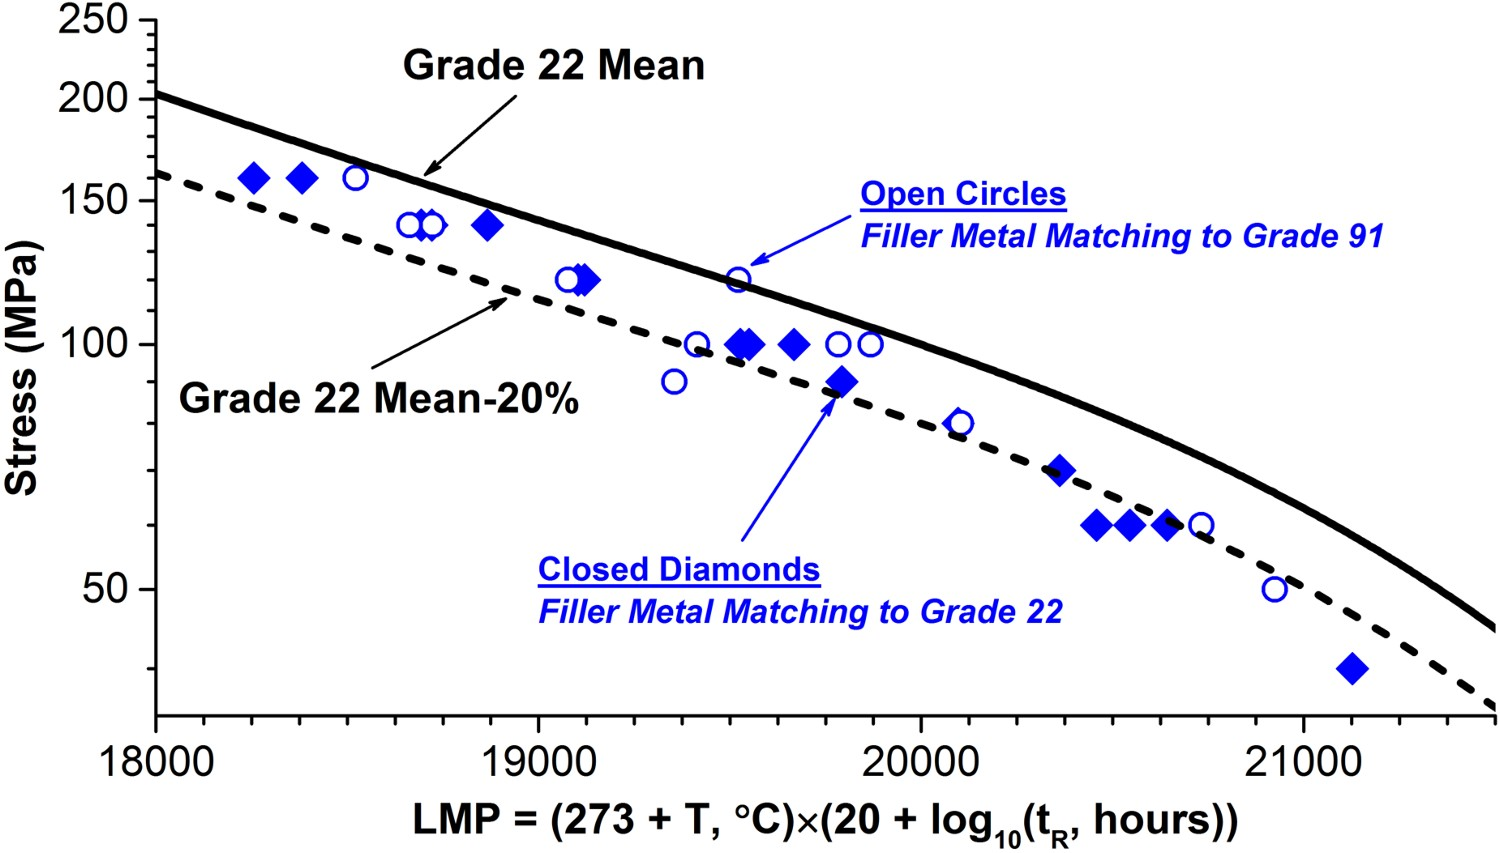
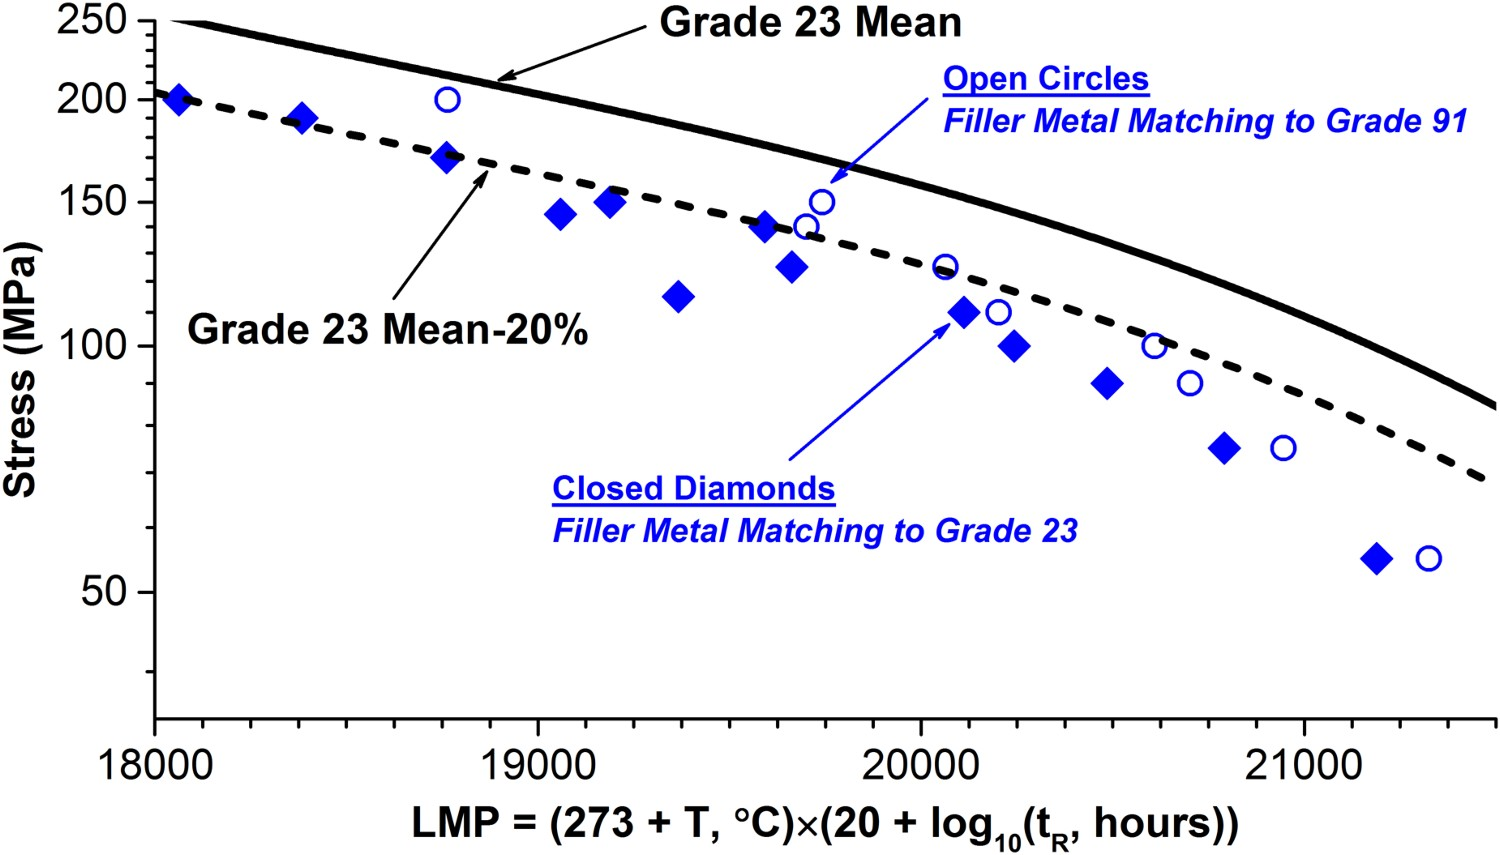
In these studies, the life of the DMW was increased through the use of the higher strength filler metal (i.e. matching to Grade 91). This increase in behaviour can be explained by the increased constraint that the stronger filler material provides. The use of a weaker filler material allows for more uniform stress distribution and has the effect of shortening the life of the weldment.
The influence of PWHT on the performance of DMWs can be shown in the data provided in Figures 38 and 39 and Table 5. Note: Descriptions accompany Figures 39 and 40.
aThe ‘A’ series welds were fabricated in ex-service Grade 91 steel material. The ‘B’ series welds were fabricated in the same Grade 91 steel material following a normalisation and tempering heat treatment.
bMethod A involved a three-layer technique in accordance with [77,78] and the shielded metal arc welding (SMAW) process, where the electrode size was increased for each of the butter layers against the weld excavation. Thus, the electrode diameters were as follows; layer 1 used 2.5 mm (3/32 in.), layer 2 used 3.2 mm (1/8 in.) and layer 3 used 4.0 mm (5/32 in.). The fill passes were performed using 4.0 mm (5/32 in.) electrodes.
cNormal procedure, the welding procedure was performed using the SMAW process with no specific guidance beyond normal ‘good practice’ including 3.2 mm (1/8 in.) in root and 4.0 mm (5/32 in.) for remaining fill) to the guidance in Ref. [79].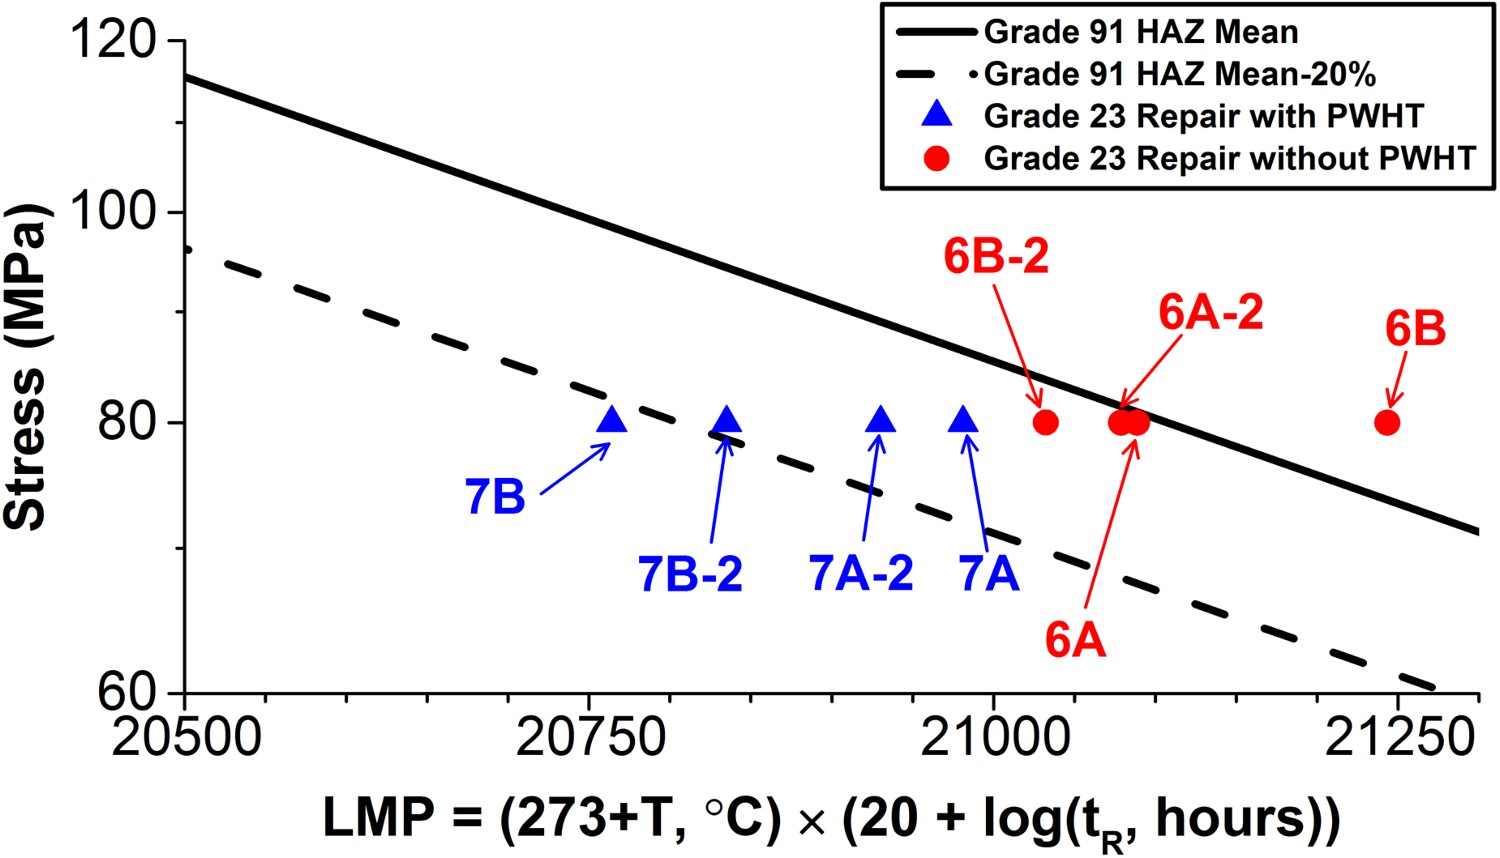
Relevant and potential DMW combinations where grade 22 (2.25Cr–1Mo) and Grade 91 (9Cr–1Mo–VNbN) must be welded [41].
The application of a PWHT at 746°C (1375°F) for 2 h had a significant influence in the failure time and failure location of a ferritic DMW where a weld repair was performed in a P91 component using a E9015-G (Grade 23) filler metal [33]. The triangles in Figure 38 are data for the weldment given a PWHT while the circles are data for the weldment in the as-welded state. It can be observed that the tests which were not given a PWHT always exceeded the life of those where PWHT was applied. This behaviour was true for creep tests at both 600 and 625°C (1112 and 1157°F) and for times up to ∼15,000 h.
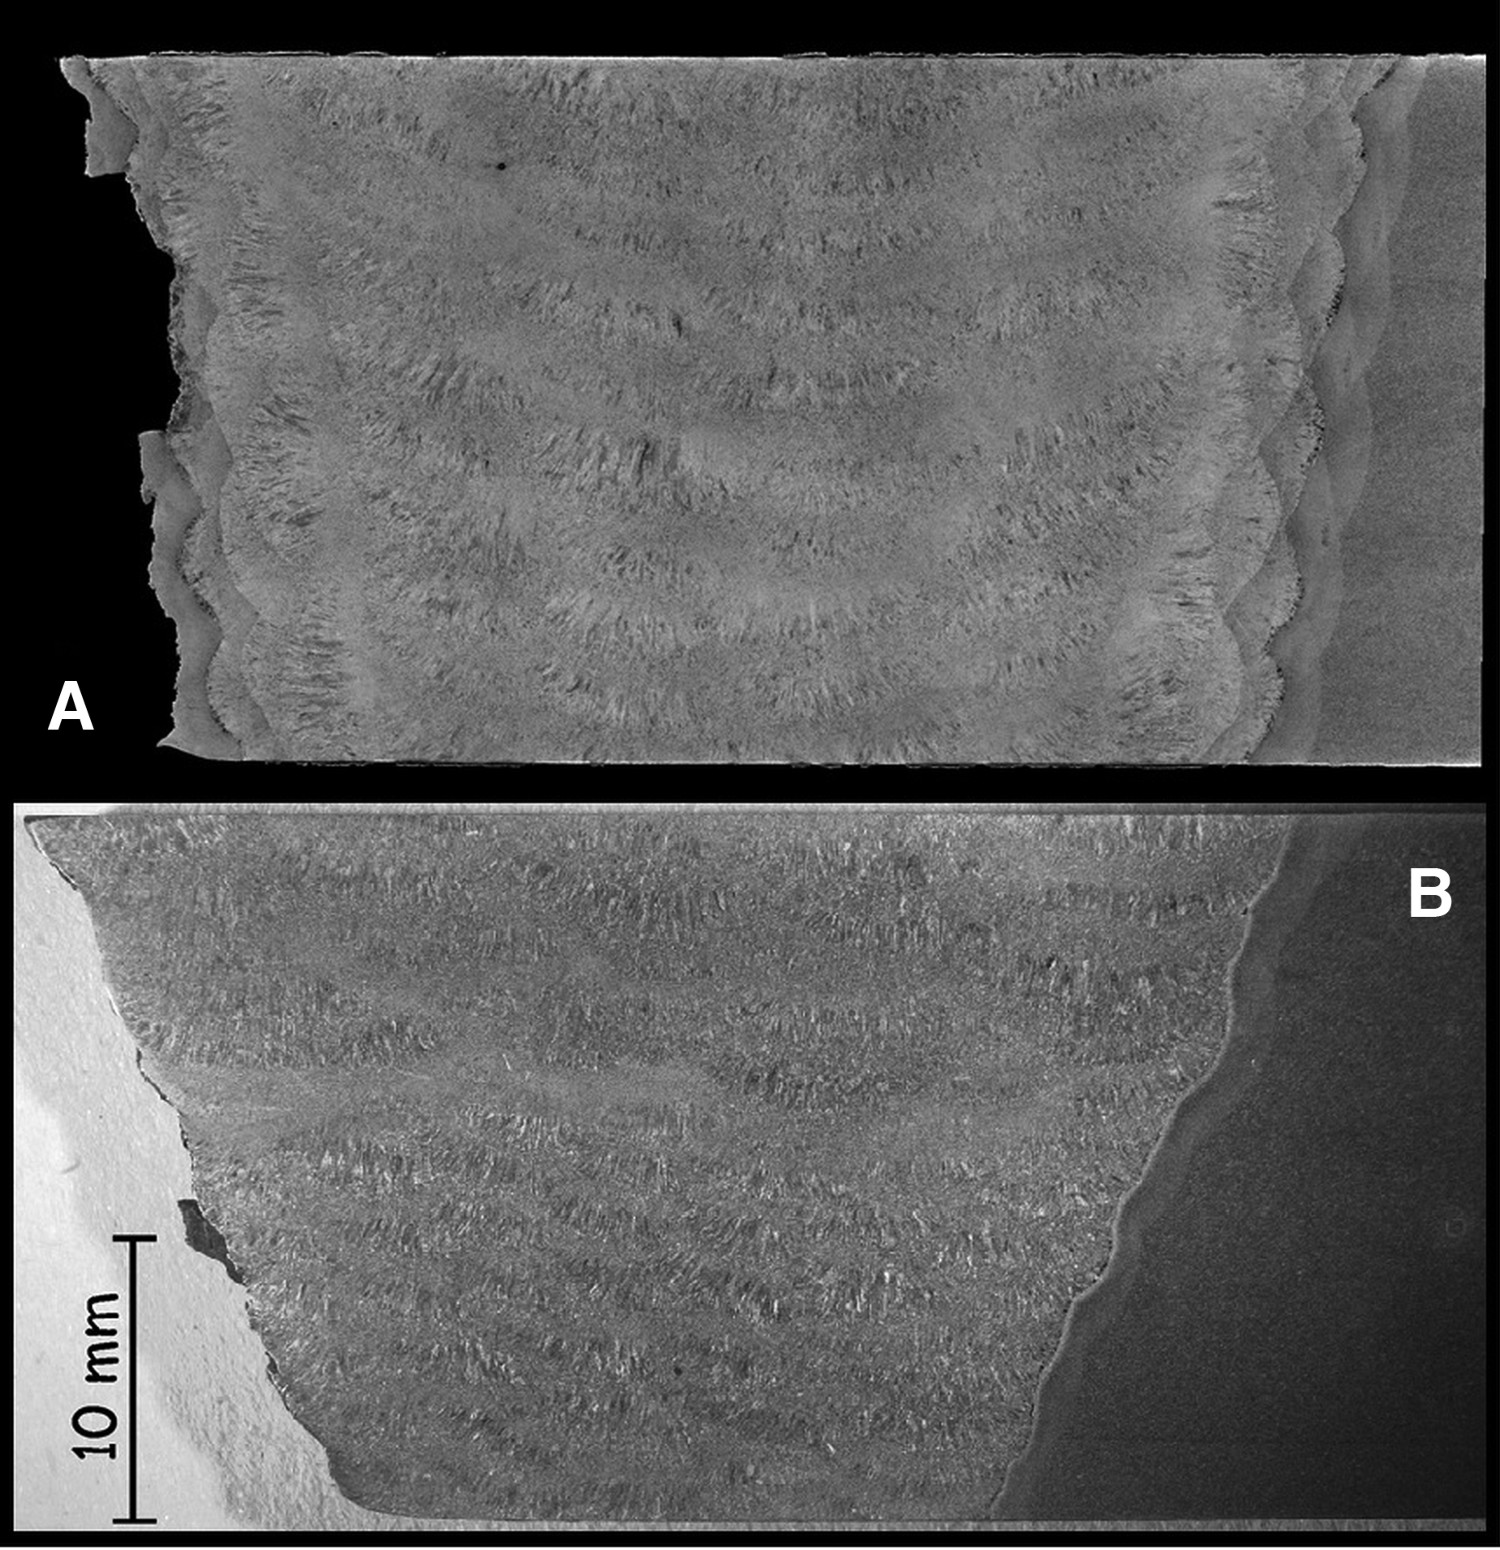
Furthermore, and as shown in Figure 39, the behaviour in the cross-weld creep failure supports this observation as the samples given PWHT failed always at the fusion line (Figure 39(B)) while the samples test in the as-welded condition exhibited damage in both the Grade 91 HAZ and at the fusion line between the Grade 91 parent metal and E9015-G filler metal. This behaviour is best depicted by the mixed-mode failure through the fusion line and the Grade 91 HAZ in Figure 39(A). The behaviour in Figure 39(A) suggests that the damage mechanisms responsible for failure are in direct competition where PWHT is not purposely applied (such as in a weld repair scenario). Damage in DMWs is often reported as being in the CDZ [2]. In some cases, and as depicted in Figure 40, maximum damage is adjacent to the CDZ. Example of damage in a dissimilar repair weld made in Grade 91 steel using E9015-G (Grade 23) filler metal [41]. See Table 5 for test conditions and results. (A) Macro image of failed creep specimen 6A-1; (B) image of fusion line failure; (C) image of damage at the unfailed fusion line. Note that the maximum level of damage is adjacent to the visible carbon-denuded zone and not within the carbon-denuded zone.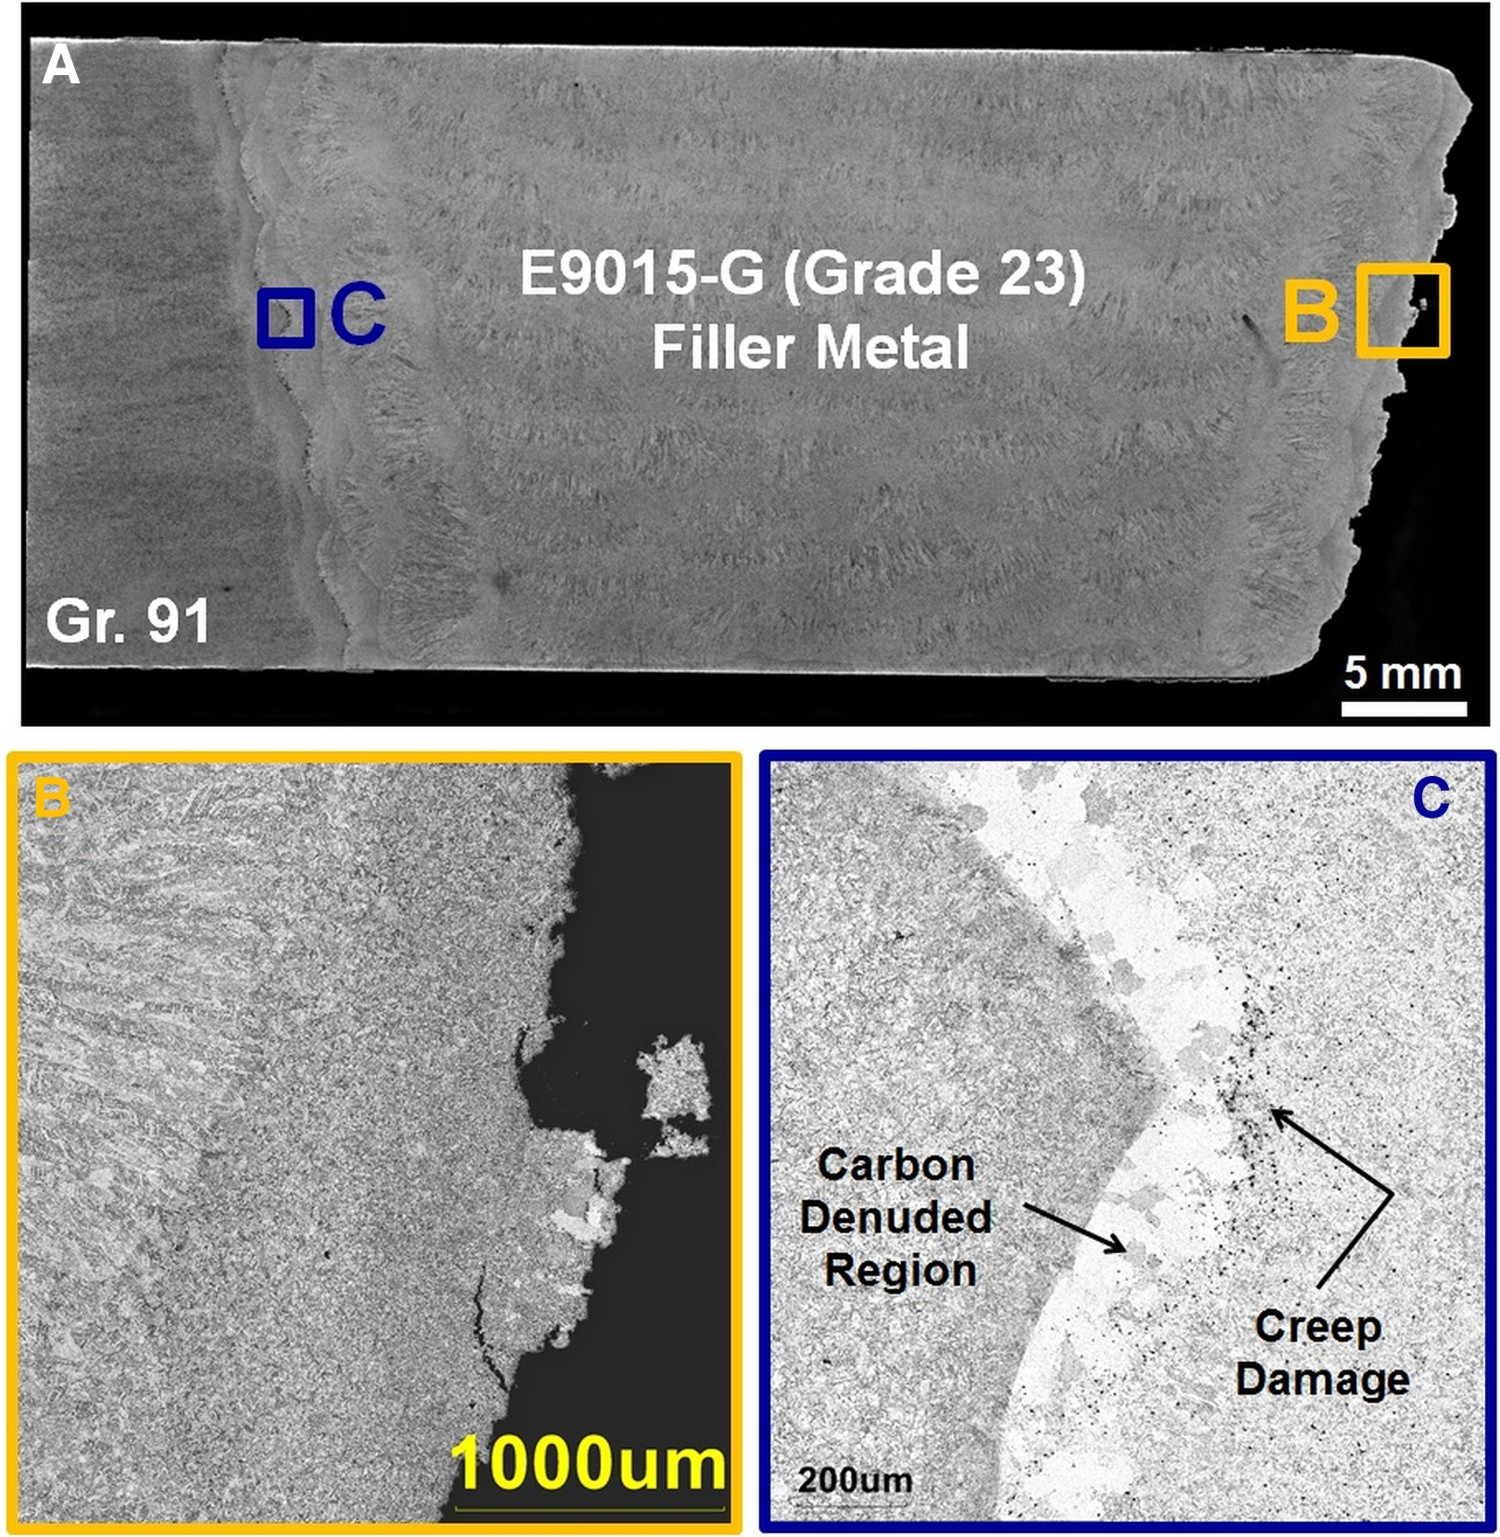
Tearing at the end of uniaxial tests or in the case of a component failure mask this behaviour since it can be difficult to identify the exact crack path or examine advanced stages of creep damage before failure occurs. In uniaxial crossweld tests where only one fusion line is examined (either as a consequence of a small gauge length or a multi-component weldment), it is impossible to evaluate the evolution of damage unless interrupted tests are conducted. In the case of Figure 40, the observation of damage in a region adjacent to the CDZ introduces a second important consideration in the performance of steels at high temperature – damage tolerance.
The issue of damage tolerance is most easily discussed in the context of creep ductility. In the case of the CDZ, and although it exhibits a significantly reduced strength, it possesses very high creep ductility. Since it is supported by surrounding parent or filler material, it sheds strain to the adjacent microstructure. Although the adjacent microstructure is stronger in creep, it is less ductile and the strain is accommodated by the formation of creep cavities. Eventually the cavitation becomes widespread through the thickness of the weld and micro-cracks are able to easily link and cause a rapid failure.
Performance of DMWs in service
Design recommendations do not typically take into account the type or nature of the weldments present in the component or system. Thus, it is normally assumed that provided weldment fabrication is carried out to accepted procedures and properties similar to those of the parent will be achieved. This assumption is rarely if ever valid since, even in situations where the composition of the welding consumables matches that of the parent, the thermal cycles associated with weld manufacture will lead to a heat affected zone in the parent metal. The specific microstructural regions developed within the HAZ will depend on the alloys involved, details of the time and peak temperature and the subsequent cooling rate. Weld metals are normally selected to overmatch the room temperature strength of the parent metal(s) being welded. This simplistic view does not take into account the modification of the parent material in the HAZ by the welding thermal cycle, let alone consider the more complex scenario imposed by dissimilar parent materials and/or weld metal.
Failure in DMWs (in both ferritic to ferritic and ferritic to austenitic examples) often occurs as a consequence of design which does not properly take into account cyclic operation. Indeed, the specifics of design and operation have caused different cracking modes in thick section piping welds in ½Cr½Mo¼V steel made with 2.25Cr–1Mo. These issues will be detailed below where the DMW either directly affected or did not affect the final failure mode. This is important because it highlights the need to implement well-engineered solutions and to consider the end-use application in any design that requires a ferritic to ferritic DMW.
Damage classified as Type IV cracking has been identified in service weldments for more than 20 years. It is apparent that existing weldments manufactured from creep resistant low-alloy steels are susceptible to this problem. Thus, most utilities have introduced assessment programmes involving plant inspection to monitor weld condition. The identification of creep cavitation and cracking then frequently necessitates repair of service welds. Recent information regarding the performance of ½Cr½Mo¼V steel weldments in UK power plant highlights the continuing need for on-going repair strategies.
Classically, Type IV cracking develops as a consequence of creep cavitation initiated in the ICHAZ and as provided in Figure 41(A,B). The circumferential nature of the damage indicates that significant axial stresses must be present since creep damage occurs preferentially in orientations perpendicular to the principle stress direction. Thus, initially welds at greatest risk of failure were located at terminal joints since at these positions significant bending or tensile stresses could be developed for example due to problems with piping supports. Example of heat affected zone cracking attributed to type IV failure mechanism in a CrMoV weld made with 2.25Cr–1Mo filler metal [80]. (A) Macrograph of failure; (B) micrograph of failure location (not in the same weldment); (C) example of damage morphology in the heat affected zone.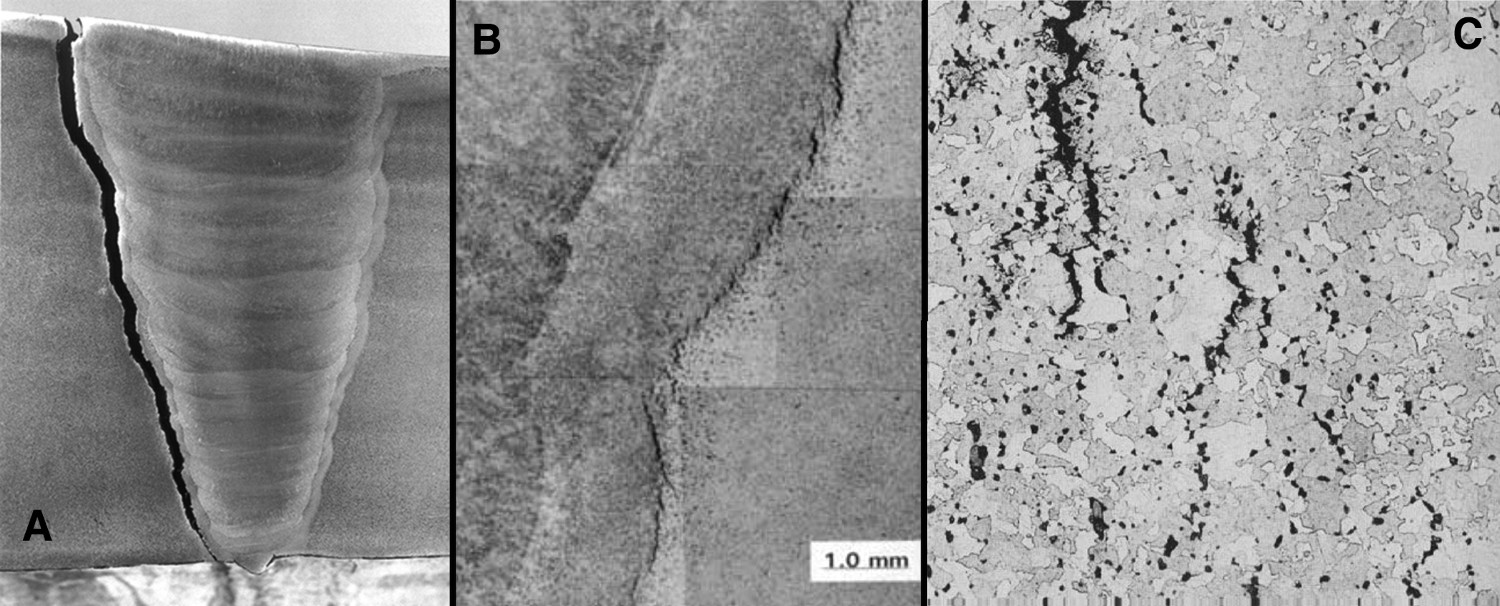
The cracking shown in Figure 42 was initiated at the inside surface of a ½Cr½Mo¼V steel main steam pipe. This damage is a consequence of a thick (up to 150 mm) structure that is at a uniformly low temperature suddenly experiencing a rapid temperature increase. This is an ‘upshock’ thermal transient. If the thermal event is large enough, the surface in contact with the steam is forced into compression as it attempts to expand against the colder steel in the remainder of the wall thickness. Continued heating will result in a gradual increase in the component temperature. As the temperature gradient reduces, the whole system expands, taking the inside surface into tension. During a period of steady operation at high temperature, this residual tensile stress relaxes by creep. In the ½Cr½Mo¼V steel shown, the location of lowest creep strength is in the weld heat affected zone and the stress relaxation induces Type IV intergranular cracking. Characteristic features of this process are a distinctive shallow ‘skin’ of creep cavitation along the inside surface of the pipe, and some cavitation immediately alongside the crack path itself [81]. Although this form of damage has not been widely reported there have been approximately 100 weld joints affected in power plants in the UK, with the deepest crack extending to around 50% of the wall thickness [81]. Example of cracking caused by an ‘Upshock’ thermal transient in a ferritic to ferritic DMW in a CrMoV weld made with 2.25Cr–1Mo filler metal [74].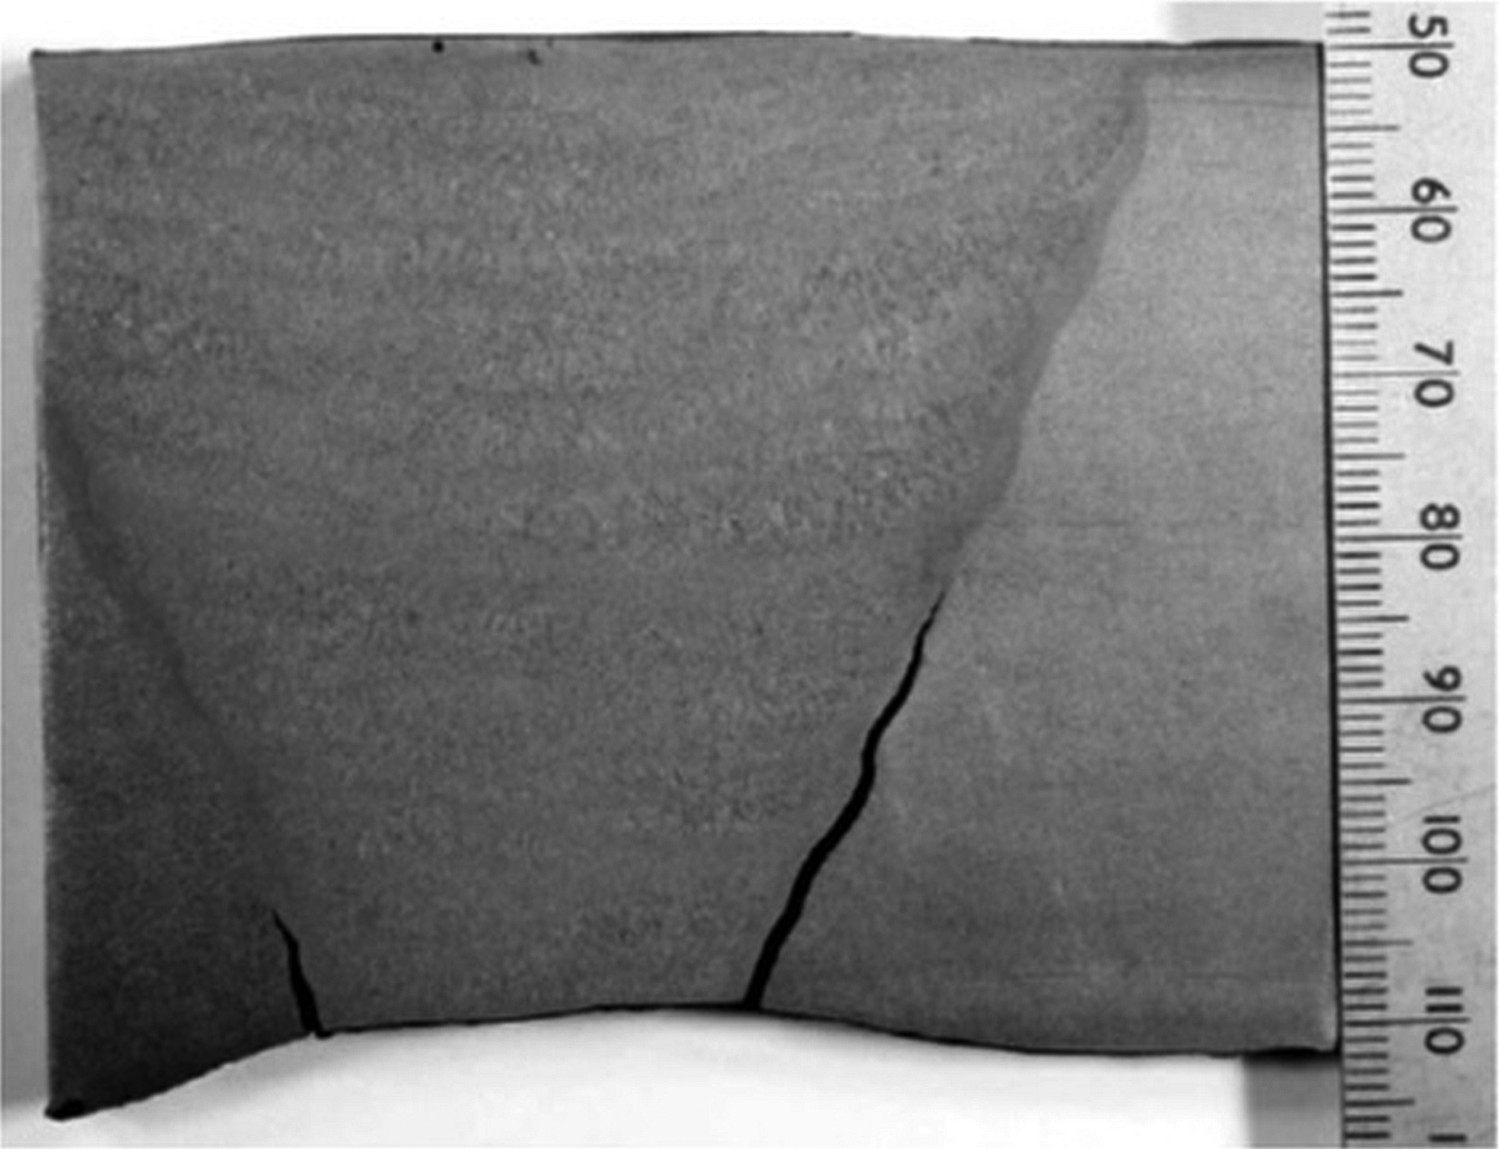
Cyclic creep relaxation damage is different to the thermal fatigue which arises as a result of cold down shocks in a relatively hot pipe. It was shown in [81] that fatigue cracking was present at the inside surface of piping welds in more than half the large coal-fired stations in the UK (600–700 welds), Figure 43. Example of cyclic creep relaxation cracking a ferritic to ferritic DMW in a CrMoV weld made with 2.25Cr–1Mo filler metal [74].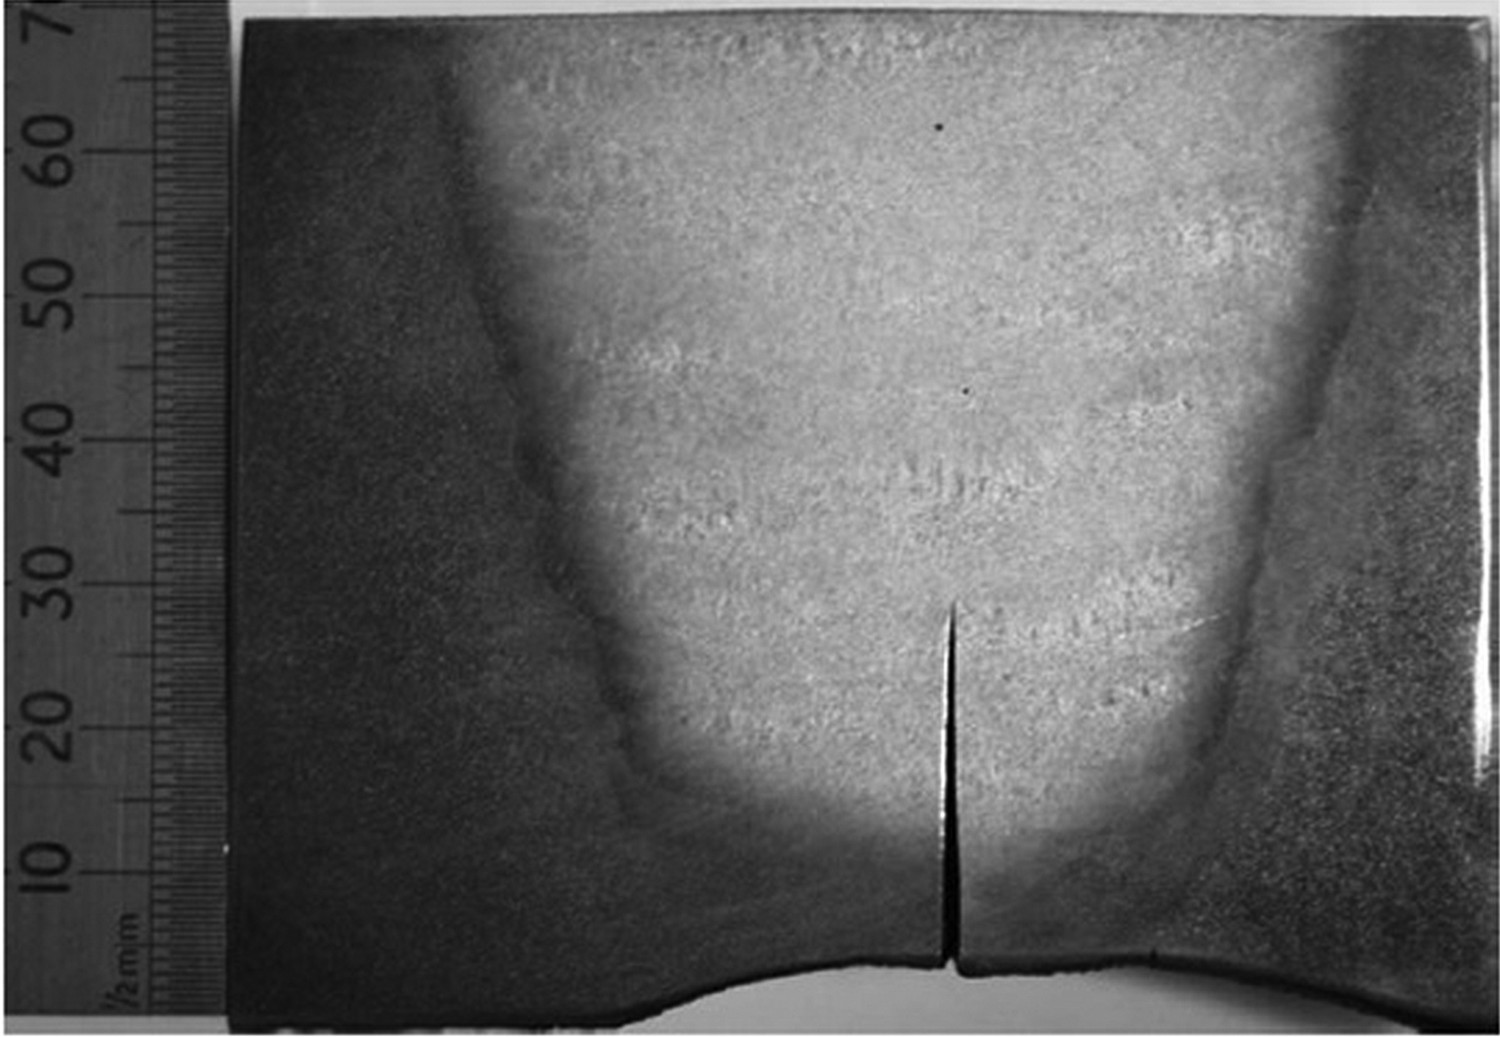
This problem was not directly linked to the fact that the joints used had DMWs. The cracks tended to be fully circumferential and the deepest found approached half wall thickness. In piping systems where cracks were found there was a tendency for the damage to be more severe at the boiler end of the piping system. The fatigue cracks were a consequence of rapid steam chilling events. The thermal gradient between the cooler inside surface and the hotter outside surface created a transitory tensile stress on the inner surface at each chilling event. The cracks initiated at local stress concentrations at weld roots or at internal changes of section at counterbores. As is usual with thermal fatigue, cracking is driven by stress and is independent of local microstructure. Because steam cooling is required to produce the necessary thermal stresses, crack tip growth may take place below normal operating temperature [81].
More recently, damage has been identified in pipe weldments and in locations that would be expected to be subjected to lower system loads. These observations could then be interpreted in terms of the stress level present during creep. In general, lower deformation rates and longer lives would be expected at lower values of applied stress. However, there are many examples exist of apparently similar joints, operating under similar conditions, exhibiting different behaviour. This is to say that some welds operating at nominally the same pressure and temperature developed cracks while others were defect-free. Moreover, in welds with a high degree of HAZ refinement, cracking adjacent to the fusion boundary has been observed, Figure 44(A–C) [82]. Example of dissimilar weld metal cracking at the fusion line in a CrMoV weld made with 2.25Cr–1Mo filler metal [75]. (A) Macrograph of failure; (B) micrograph of failure location (not in the same weldment); (C) example of damage morphology in the coarse-grained heat affected zone and directly adjacent to the fusion line.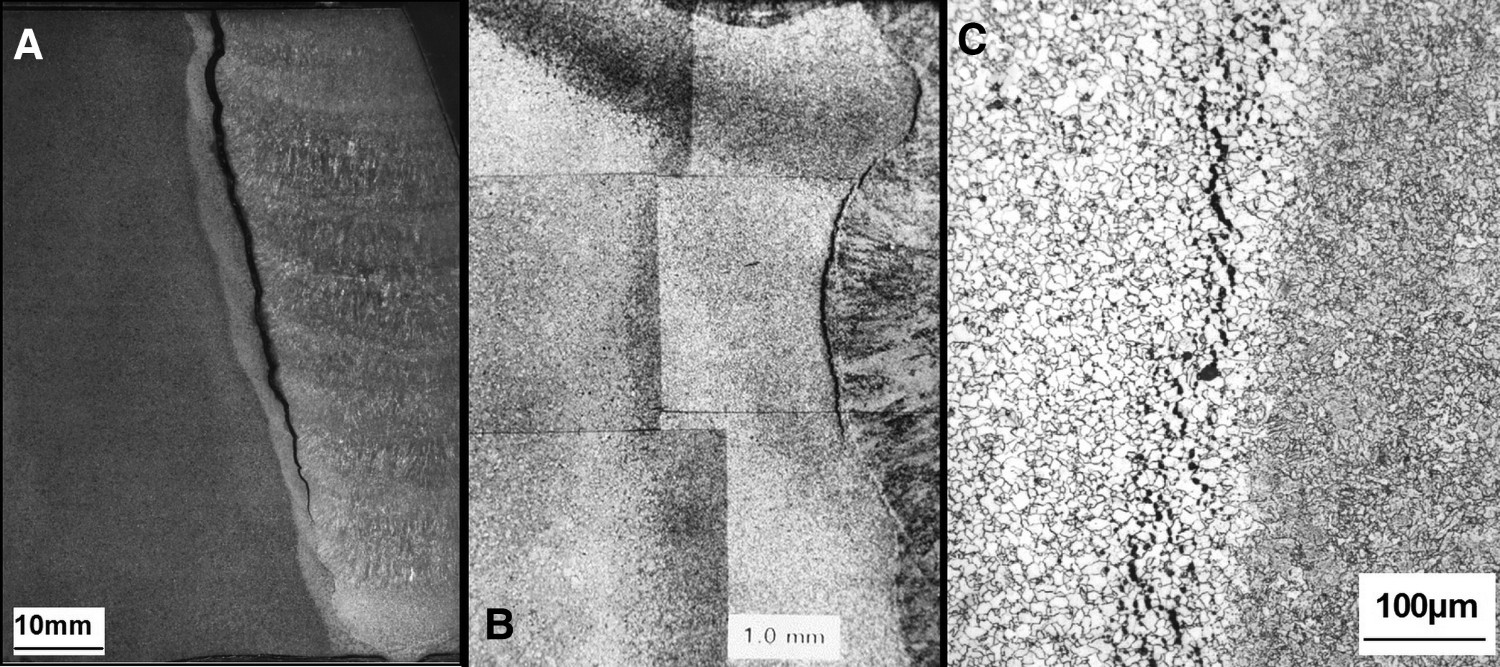
This damage, classified as Type IIIa, appears to be related to time-dependent carbon diffusion which reduces the creep strength in the HAZ adjacent to the fusion boundary. The cracking detailed in these images is a directed consequence of the instability at the fusion line that is induced by the ferritic to ferritic weldment. It is thus apparent that the local stress state, rather than simply the applied stress level, is the important factor governing component performance.
A classic example of poor practice is provided in [80] where a CrMoV stop/control valve (1.25Cr–1Mo–0.25V) was welded to a Grade 91 main steam line using a Grade 22 consumable (E9018-B3). In this failure, the valve was machined to a wall thickness of nominally 76 mm (3 in.) and the Grade 91 pipe was 40 mm (1.56 in.) in thickness, Figure 45. The operating conditions of the heat recovery steam generator in which this DMW was installed were 565°C (1050°F) and 12.4 MPa (1800 psi). The failure occurred after <5000 h of operation. Schematic of the welded ferritic to ferritic DMW between a P91 main steam pipe and a turbine control/stop value made of 1.25Cr–1Mo–0.25V. This failure occurred in <5000 h in a combined cycle natural gas plant operating at 565°C (1050°F) and 12.4 MPa (1800 psi) [83].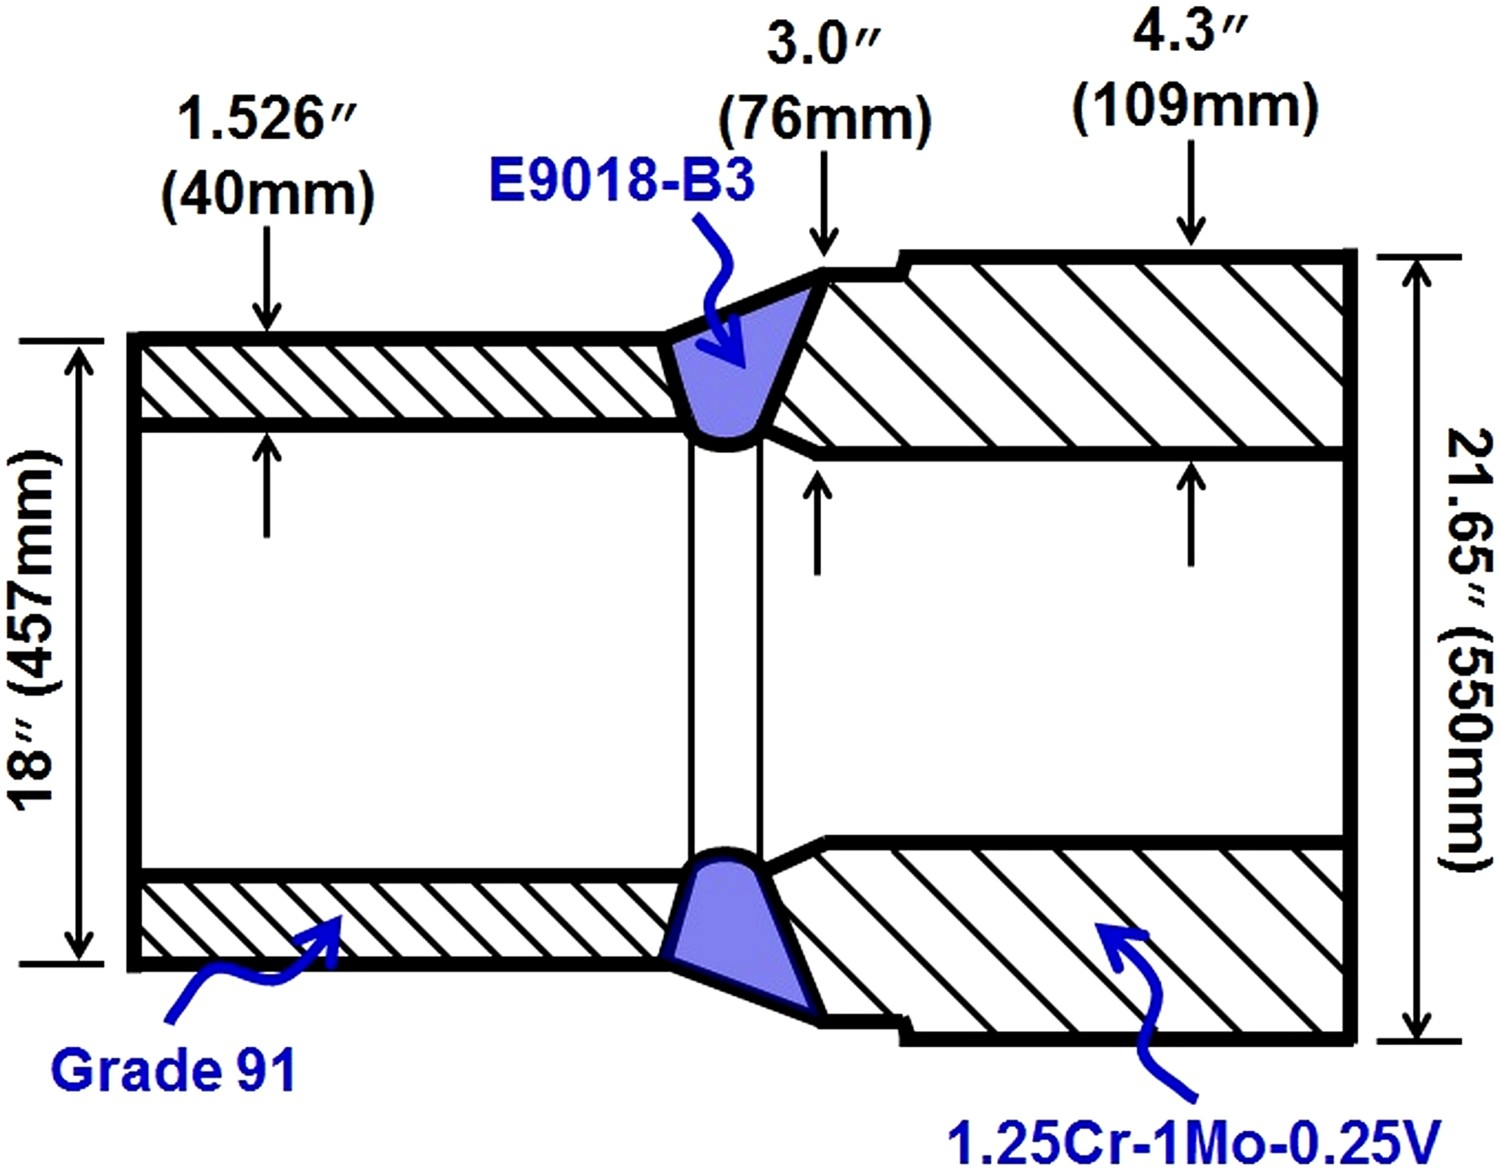
As shown in Figure 46, the failure occurred along the fusion line between the Grade 91 and Grade 22 filler metal in the failure detailed in Figure 45. Macro image of the cracked DMW between a P91 main steam pipe and a turbine control/stop value made of 1.25Cr–1Mo–0.25V. This weldment was fabricated using 2.25Cr–1Mo filler metal [83]. (A) Macro sample; (B) micro-cracking ahead of the main body of the crack tip; (C) appearance of the main body of the crack.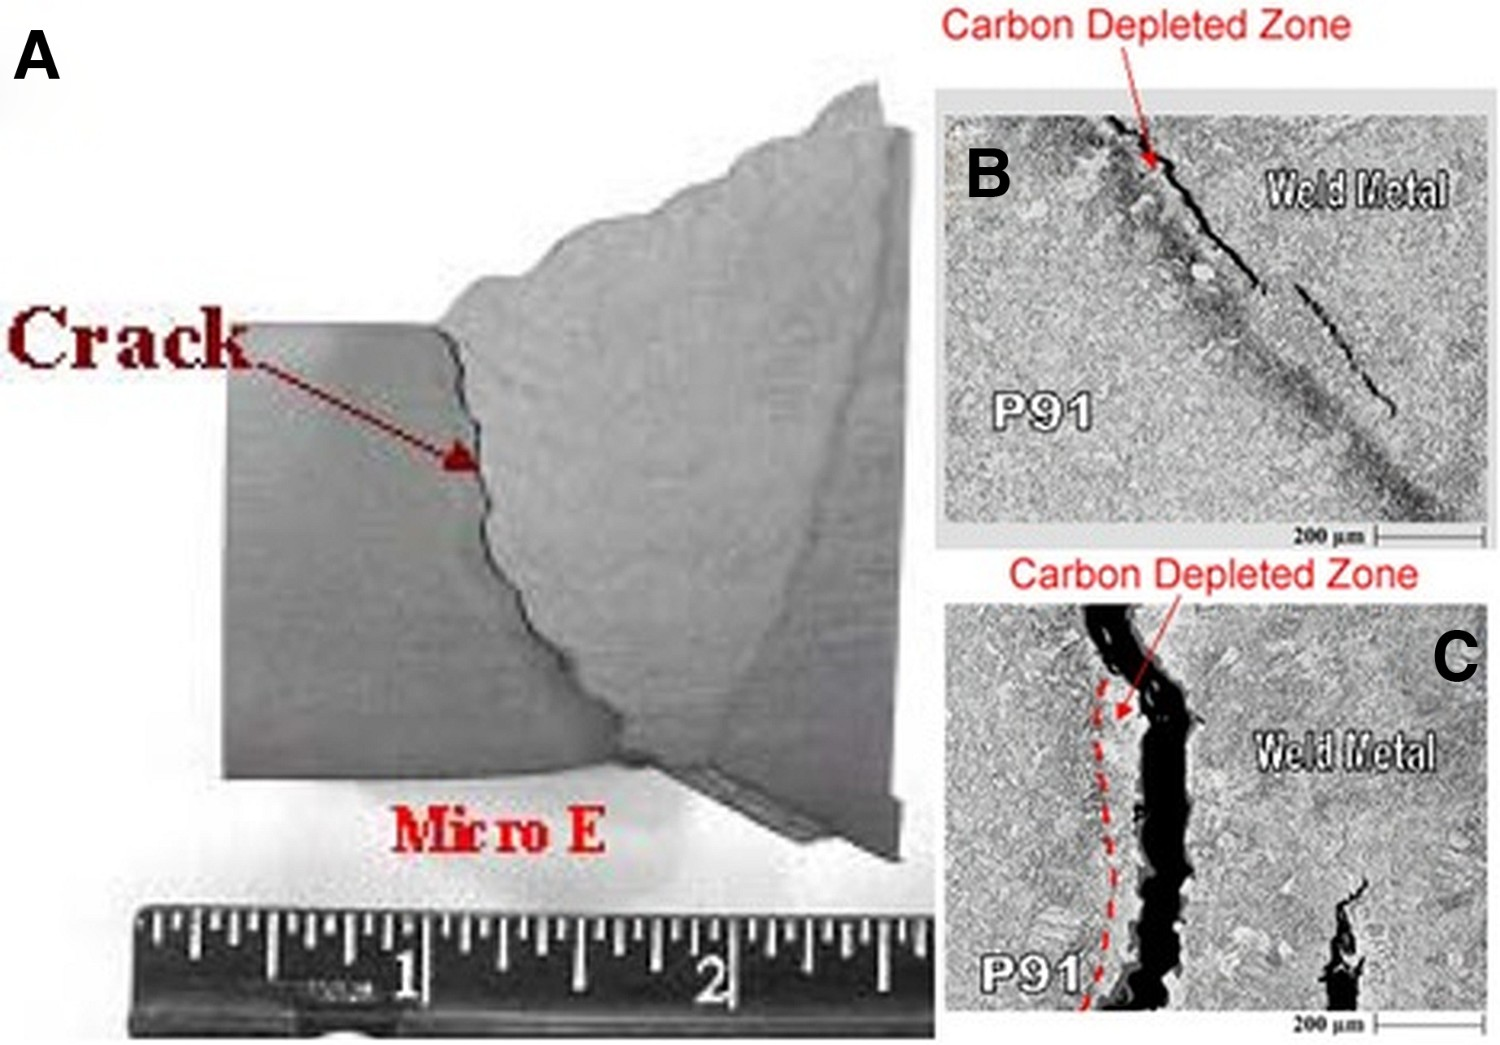
This is not unexpected, as carbon will migrate from the Grade 22 to the Grade 91 pipe and create a local CDZ in the Grade 22 filler metal at the fusion line and where failure occurred. In this example, the failure was clearly exacerbated by the poor design whereby the Grade 22 was utilised as the filler material to the thinner Grade 91 pipe. The best design is one that utilises a transition piece, as shown in Figure 47. In cases where this is unfeasible, the secondary option would be to utilise a filler material matching to the thinner material (in this case E9015-B9, matching to Grade 91) so that the CDZ is placed in the thicker material and subjected to a lower operating stress. Note that for the provided pipe dimensions and operating conditions, the expected operating stress on the CrMoV side of the DMW is at least 50% lower than that of the P91 side of the joint. Schematic of a proper design for DMWs where transitions in thickness are necessary. Note that the use of a Grade 91 transition piece places the DMW in the thicker component and therefore at a much lower operational stress.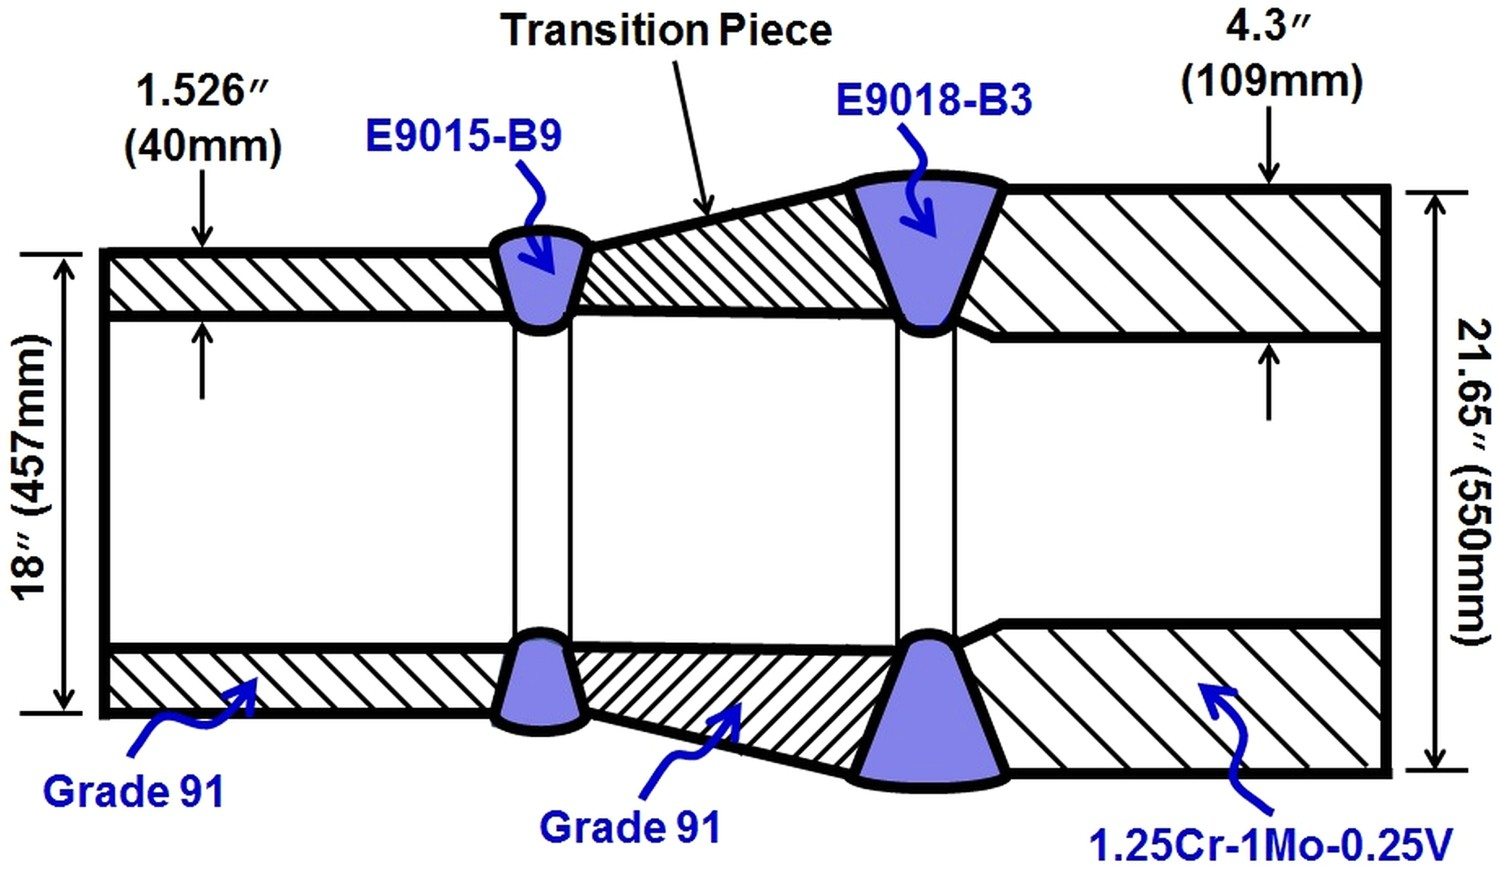
Conclusions
A continued increase in the demand for more efficient power generation is necessitating the need to manufacture power plants, which can meet these aggressive demands and naturally require the joining of dissimilar materials. The joining of DMWs introduces a complexity of fabrication issues, which must address the carbon migration that may take place during welding, PWHT and service. Despite the challenges that exist in properly fabricating and operating ferritic to ferritic DMWs, it should be emphasised that root cause is not always directly linked to the evolution of the carbon-denuded region on the lower alloyed steel side.
The performance of a structure is predicated on addressing factors, which affect design, operation, fabrication and metallurgy. For application-dependent scenarios, there may be clear solutions for thin-section components (such as tubing) which are different from the recommendations made for thick-section vessels including pipe or header constructions. Service conditions, which require cycling, may require more innovative approaches than those, which only mandate design for a baseload, constant load power plant. The variation in parent materials, which must be joined, may mandate an approach, which attempts to optimise the balance of performance between the various material constituents.
It is often the case that in service failures occur as a result of a compounding set of circumstances in the design, operation, fabrication and metallurgy of DMWs. For example, DMWs are often located at thickness transitions, locations of higher in service stress such as terminal points in piping and often fabricated in the field using less rigorous controls on either quality or inspection or both. These issues are often overlooked due to design calculations that may suggest a welded connection should possess an infinite life when in reality this simplistic approach should never be regarded as acceptable for in service performance of DMWs. In this regard, there is a need to embrace concepts, which can predict not only when the DMW will fail, but also how the DMW might fail in operation (e.g. emphasis on leak before break).
There exists a continued need to assess the behaviour of DMWs with respect to metallurgical evaluation, mechanical testing and simulation (structural and metallurgical). Little detail in the literature is available which describes the metallurgical evaluation of DMWs with respect to interrupted behaviour and for the combined effect that temperature, time and strain can have on carbide dissolution and carbon migration. Mechanical testing is needed with respect to structural, feature-type and/or vessel tests, which provide relevant information regarding component failure. Simple uniaxial cross-weld creep tests, and particularly with regard to small diameter round bar geometries, are not sufficient to establish how a weldment might fail in service. Structural simulation needs to address how to properly model the influence of an assumed weak, carbon-denuded region of material (and size) might have on component behaviour. Finally, and with regard to metallurgical simulation, there is a need to improve the quality of databases for thermodynamic and kinetic simulations. Especially with newer alloys containing small amounts of elements like boron, with a dedicated influence on diffusion of elements and therefore microstructural stability, databases need to be updated. As the number of developed materials continues to increase and therefore the number of potential material couples similarly evolves it is important to consider how these dissimilar materials behave under the influence of operational and structural circumstances.