
Abstract
This article reviews critically selected recent literature on electrochemical energy storage (EES) technologies, focusing on supercapacitor and also supercapattery which is a generic term for various hybrid devices combining the merits of rechargeable battery and supercapacitor. Fundamentals of EES are explained, aiming at clarification of some literature confusions such as the differences between capacitive and non-capacitive Faradaic charge storage mechanisms, and between cathode and positive electrode (positrode), and between anode and negative electrode (negatrode). In particular, the concept and origin of pseudocapacitance are qualitatively correlated with the band model for semiconductors. Strategies for design and construction of supercapattery are discussed in terms of both the materials structures and device engineering. Selection of materials, including electrolytes, is another topic reviewed selectively. Graphenes and carbon nanotubes are the favourable choice to composite with both capacitive and non-capacitive redox materials for improved kinetics of charge storage processes and charge–discharge cycling stability. Organoaqueous electrolytes show a great potential to enable EES to work at sub-zero temperatures, while solid ion conducting membranes and ionic liquids can help develop high voltage (>4.0 V) and hence high energy supercapatteries.
Introduction
Harvesting energy from the unlimited but intermittent renewable sources such as sunlight, wind and tide demands efficient and affordable energy storage technologies. The diversity of energy forms and applications also means that development of such technologies must take an approach with multiple vectors. Electrochemical energy storage (EES) technologies together with materials development are currently playing leading and promising roles in the global effort to tackle the challenges to sustain energy supply [1,2]. In particular, materials and technological innovations based on electrochemical reactions and capacitance are being increasingly recognised and utilised to develop, respectively, rechargeable batteries with high energy capacity, and supercapacitors (also known as electrochemical capacitors) with high power capability and long cycle life measured against the common ground [3,4]. The past two decades have seen significant progresses in both rechargeable battery and supercapacitor research, although each alone is still unsatisfactory according to commercial views that have been formed on consumption of fossil fuels. This situation calls for innovative changes in the research and development of EES technologies, leading to the proposal and preliminary demonstration of several hybrid devices that combines both the rechargeable battery and supercapacitor characteristics into one device, namely supercapattery whose behaviour is similar to that of a supercapacitor with a greater energy capacity, and supercabattery which performs more like a rechargeable battery but higher power capability and/or longer charge–discharge durability [5–8].
This article intends to offer a critical review of the research development in the past two decades in relation to understanding and improvement of supercapacitors, and of the very recently proposed hybrids of rechargeable battery and supercapacitor, particularly supercapattery. The focus will be on supercapacitor and supercapattery, and the associated nanostructured, redox active, and semiconductor materials such as electronically conducting polymers (ECPs) and transition metal oxides (TMOs). As a new EES device, supercapattery aims to achieve comparable performance to supercapacitor in power capability and cycle life, and to battery in energy capacity. It can be achieved by hybridisation of either materials or electrodes in the same device. The material approach emphasises on the design and synthesis of hybrid or composite of a supercapacitor electrode material and a battery electrode material, and the use of such a hybrid material to make the electrode for use in the EES device. For example, the hybrid material of carbon nanotubes (CNTs) (which can be used alone as a supercapacitor electrode material) and manganese dioxide (which is a classic electrode material for battery) offers much higher specific charge capacity (or capacitance) than CNTs, and significantly greater specific power and longer cycle life than manganese dioxide. At the device level, combination of a supercapacitor electrode with a battery electrode in the same EES device can also be effective for gaining performance improvement. This approach is simpler in concept, but challenging in practice in terms of matching the dissimilar performances of the two electrodes. In comparison with the material approach, only a few very successful laboratory studies have been reported recently via the device approach [5–8].
It is worth pointing out that several terms are used in the literature to describe hybrid EES devices, such as ‘redox capacitors’, and ‘Li-ion capacitors', ‘pseudocapacitors’ [9–14]. In an industrial EES project initiated in 2007, the author and collaborators proposed to design and build the supercapattery as a third generation EES device [5]. This project and a few others under different names as mentioned above progressed concurrently, targeting on similar goals: development of more advanced hybrid EES devices from combination of the merits of supercapacitors and rechargeable batteries. In the past decade, many review articles have discussed investigations on hybrid materials, but few accounted for device designs and engineering. Also, research progresses from different angles have come to the point calling for a unified generic term to describe these hybrid devices that are different from either supercapacitors or batteries in terms of fundamental principles and technological prospects.
With both the terms of supercapacitor and supercapattery in the title, this review aims to present and discuss a number of relevant issues, including fundamentals of interfacial (or electric double layer (EDL)) capacitance and pseudocapacitance, synthesis of nanostructured hybrid (or composite) materials, charge transfer reactions at nanometre scales, selection of electrolytes in terms of storage needs. In addition, the importance of electrode and device engineering is highlighted with several examples in which the specific energy and power of the supercapattery have matched with or gone over that of the lithium ion battery. The prospects of supercapattery development are speculated based on materials and engineering advantages, highlighting the theoretical and practical feasibilities of using this new EES device to complement, or even replace in some cases, rechargeable battery and supercapacitor.
Basics of EES
The term of ‘electrochemical energy storage’ (EES) has been popular in the literature since more than a decade ago, and it is comparable with, but not identical to the traditional term of ‘electrochemical energy conversion and storage’ which emphasises ‘conversion between electrical and chemical energy’. This is because currently popular EES technologies include three main types: (1) rechargeable batteries, including redox flow batteries, (2) electrochemical capacitors which are more widely known as supercapacitors, and (3) various hybrids of battery and supercapacitor which are called supercapattery and supercabattery in this article. One type of supercapacitors called ‘electrical double layer capacitor’ (EDLC) can in principle directly store electrical energy. The charge storage occurs via electrostatic adsorption of ions at the interface between the electrode and electrolyte under an applied cell voltage, and proceeds simultaneously on both the positive and negative electrodes, but no chemical reaction occurs. Thus, electrical energy storage in the EDLC is widely considered to be physical in nature. Nevertheless, ions are always solvated in the bulk electrolyte solution, but less so when adsorbed at the ‘electrode | electrolyte’ interface (or in the EDL) as illustrated in Figure 1(a and b) for a porous carbon negative electrode in contact with an aqueous electrolyte. (Note: Many schematic illustrations of the EDL on a planar electrode surface exist in the literature, such as that given in Bard and Faulkner [15], while Figure 1(a) is for the EDL on a porous carbon negative electrode.) Therefore, charge storage in the EDLC still involves changes in chemical bonding, and hence is not purely physical, nor solely chemical. Schematic representations of (a) the EDL structure (cross-section) of the interface between a porous carbon negative electrode and an aqueous electrolyte; (b) explanations of symbols in (a); (c) potential distribution in the electrolyte solution between the negative and positive electrodes in an electrolysis cell. In (a, c), E
N, E
P and E
S are respectively the potentials of the negative and positive electrodes, and the electrolyte sufficiently farther away from the electrode surface [15].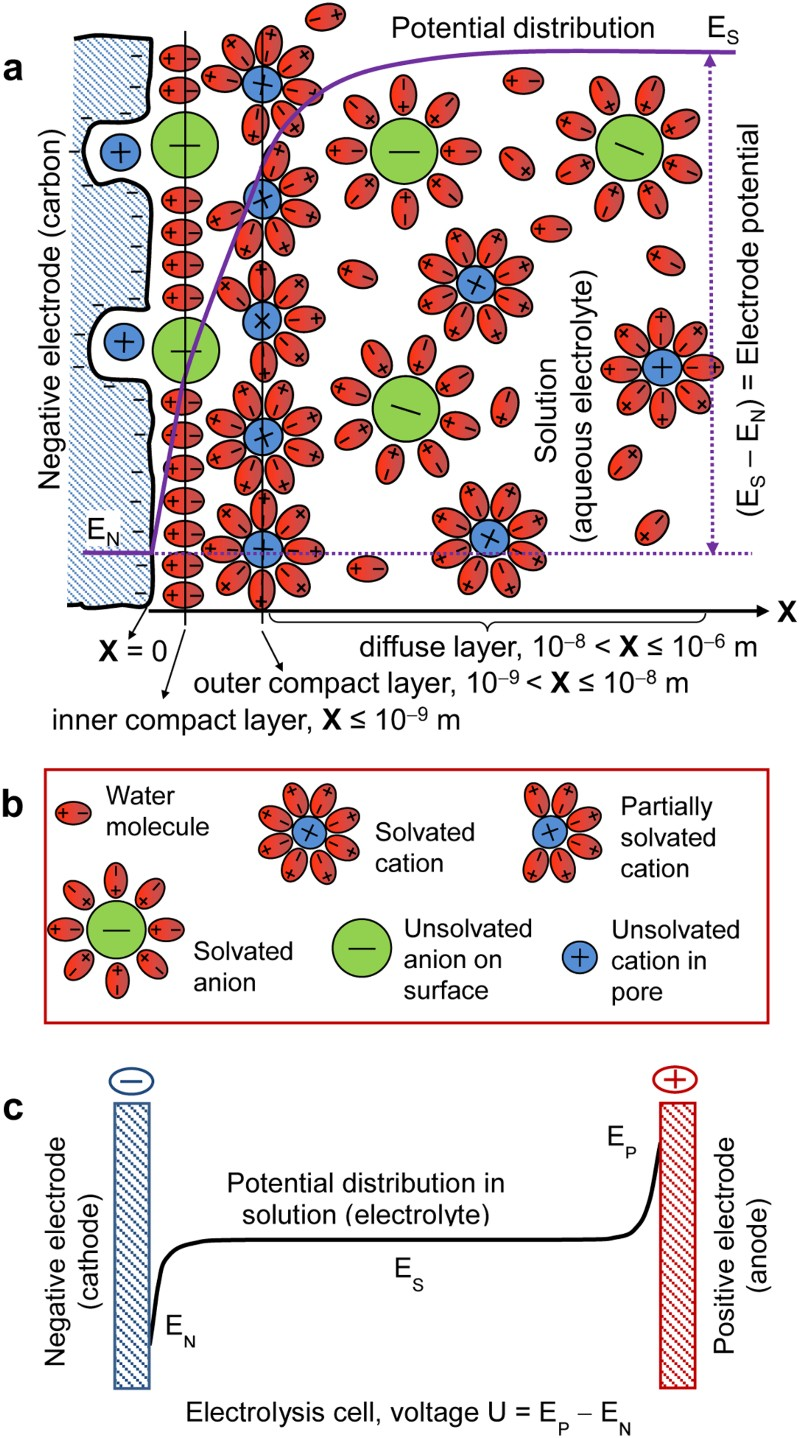
The EDL has in fact a multi-layer structure, including the inner compact layer, outer compact layer and diffuse layer which is next to the bulk electrolyte solution (not shown in Figure 1(a)). Both cations and anions are solvated (or hydrated) in the diffuse layer (and bulk solution), but as shown in Figure 1(a), in the compact layers, the anions are unsolvated and specifically adsorbed on the surface of the negative electrode. Also, some cations are partially solvated or unsolvated due to interactions with the anions and the electrode surface and pores. It is worth pointing out that because of the close packing of ions on the electrode surface, the potential distributions in the inner and outer compact layers are both linear but different in gradient (or slope). In the diffuse layer, ion concentration and hence the potential profiles are deviating from linearity and reaching a plateau at the end next to the bulk solution. The potential profile of the whole cell is schematically shown in Figure 1(c). Note that the potential, E S, in the bulk electrolyte remains almost constant because of the high mobility of ions. Also, in Figure 1(c), the potential profiles near the two electrodes are a little exaggerated to highlight the potential variation.
All EES devices are composed of a positive electrode, a negative electrode and an electrolyte separator, as illustrated in Figure 2(a). These components are packed in one or another way in a cell (i.e. the EES device). The electrolyte separator, which is the separator membrane in Figure 2(a), can be a liquid (typically the sulphuric acid solution in lead-acid battery), a solid (such as the sodium ion conducting beta-alumina membrane in the ZEBRA battery), or more commonly a porous membrane filled with a liquid electrolyte (for example, the glass fibre or gel membrane in supercapacitors). The positive and negative electrodes are made of materials of high electronic conductivity, including various metals, carbons, ceramics and their composites with polymers. The electrodes are used in two ways in EES devices. First, the electronic conductor is used mainly for loading an active material for charge storage by coating or another method. This case applies to both rechargeable batteries and supercapacitors, and the electronically conducting substrate is called current collector which should be chemically and electrochemically inert in the cell environment. The other use of electrode is to conduct electrons from or into the redox active ions or molecules in the electrolyte and this case is common in redox flow batteries. Schematic illustrations of (a) a single cell of typical EES devices. (1,2) CVs of positrode and negatrode in a three electrode cell, and (3) GCDs of the two electrode cell of (b) rechargeable battery, (c) supercapacitor, or (d) supercapattery. U
max and U
min: maximum and minimum cell voltages that can be reached during charging and discharging, respectively, without causing irreversible changes in the cell. U
dis: average discharging voltage. τ and t: end times of the first charging and discharging cycle, τ ≥ (t − τ). 2τ and 2t: end times of the second charging and discharging cycle, but not necessarily twice of τ and t [3,5,6].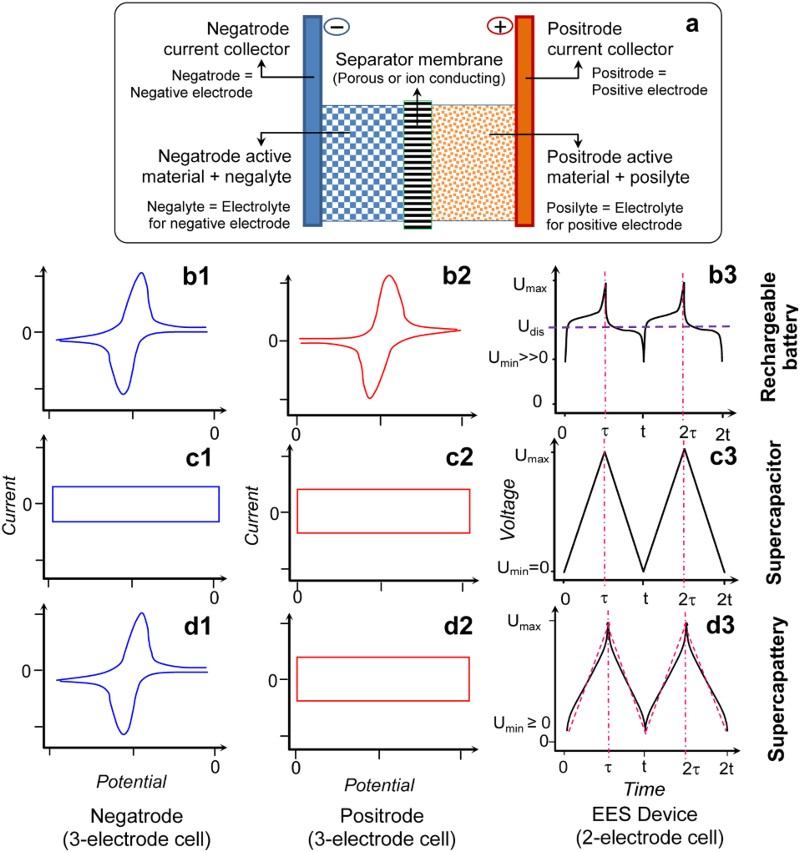
In quite many publications on EES, the positive electrode is also called as the cathode, while the negative electrode as the anode [1,2,14,16]. Figure 3 shows an example. Such uses of the cathode and anode terminology in any EES devices deviate from both electrical and electrochemical principles and also the device manufacturer’s instruction, and hence can be confusing or misleading. Positive and negative electrodes are based on their electrical polarities, i.e. the positive electrode always has a higher (or more positive) potential than the negative electrode. The current always flows from the positive to the negative electrode via the external circuit, and the electrons flow in the opposite direction. However, cathode and anode are defined, respectively, by the electrode reaction being reduction (i.e. the active material or molecule accepts electrons from the current collector) or oxidation (the active material or molecule losses electrons to the current collector). By calling an electrode as the cathode, it is impossible to know if its potential is higher or lower than that of the anode. The use of the cathode and anode notions in EES literature may be related with primary battery studies which have emphasised on the discharging behaviour. These notions may be thus followed in the early days of secondary battery research when discharging performance was more important than the efficiency of energy storage. It is also possible that the one-word terms (i.e. cathode and anode) are more convenient to write than the two-word terms (i.e. positive electrode and negative electrode). Schematic illustration of the solid-oxide redox flow battery (a) the discharge and (b) charge modes. Note the use of the anode and cathode notions can lead to the correct description of the electrode reactions from (a), but the incorrect association of reduction with anode and oxidation with cathode from (b), which is against the definitions of anode and cathode [16]. (Redrawn and reprinted with permission from Springer).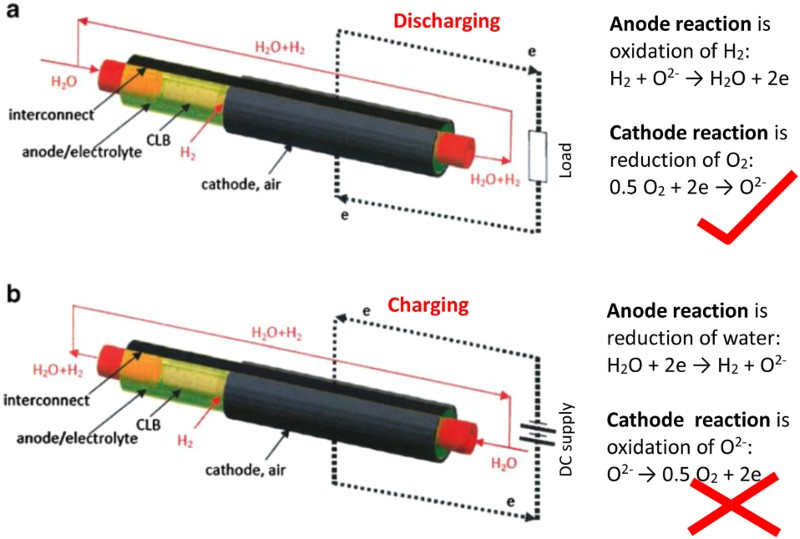
However, both charging and discharge performances are crucial in the present global effort to develop efficient EES technologies and, for example, it is obviously confusing and inappropriate to describe the charging process of the lithium ion battery by stating the following: ‘During charging of the cell, Li+ ion reduction on the anode of carbon enclosed silicon nanowires caused less volume expansion’. Figure 3(b) explains another erroneous derivation from using the anode and cathode terminology. Many other similar problems exist, but all can be avoided by using the notions of positive and negative electrodes. It is interesting to mention that in ESS literature published in China in Chinese, positive and negative electrodes ( and
and  ) are always the terms used, but the same Chinese authors often use cathode and anode (which are
  and
and  in Chinese) in their English publications [2,17].
There are similar confusions when electrolytes are concerned. In some EES, such as the redox flow battery, the electrolytes are different for the positive electrode and negative electrode. These are currently called in literature as catholyte and anolyte in line with the cathode and anode notions, which can fall into the same scenario when, for example, oxidation occurs in the catholyte and reduction in the anolyte during charging.
To avoid confusions to newcomers of the EES community and other researchers who are experienced in, for example, materials science but unfamiliar with electrochemical terms, the author proposes positrode and negatrode in places of positive electrode and negative electrode, respectively, as shown in Figure 2(a). Similarly, posilyte and negalyte are proposed for the two separated (e.g. by a membrane) and different electrolytes in contact with the positrode and negatrode, respectively, to avoid confusion with catholyte and anolyte that describe the two separated and different electrolytes in contact with the cathode and anode in an electrolysis cell, respectively. The author also hopes that these one-word terms are convenient to write so that cathode and anode will not be misused for EES. In the following text, these new terms will be used.
In contrast to EDLCs, electrical energy is first converted to chemical energy which is then stored in a rechargeable battery. The chemical reactions are driven by the applied cell voltage and take place on both the positrode and negatrode in the cell, involving electron transfer. Here, electron transfer refers to that between the electrode substrate (or current collector) and the active material on the electrodes in a rechargeable battery, or between the electrode substrate and the redox active ions or molecules in the electrolytes in a redox flow battery. In other words, in the field of EES, electron transfer reactions always refers to those occurring at the boundary connecting two or more phases (solid, liquid and gas). The boundary is an interface between two phases, e.g. ‘electrode | electrolyte’ and ‘current collector | active material’, but an interline (or point) between three (or more) phases, such as ‘CO | Pt | electrolyte’ and ‘AgCl | Ag | electrolyte’ [18–20]. Such charge transfer reactions are known as Faradaic reactions or processes, so that they are differentiated from those charge transfer reactions, which are often called chemical redox (reduction and oxidation) reactions, between oxidant and reductant molecules occurring in the same liquid solution or at the boundary between two or more phases. The difference is that the transferred electrons in a Faradaic process can be withdrawn from or inject into the electrodes via the external circuit, while in a chemical redox reaction, the electrons are always transferred from the reductant to the oxidant, but not in the reverse direction.
In line with the definition mentioned above, Faradaic reactions are always present and play major roles in energy storage in rechargeable batteries or redox flow batteries, but not in EDLCs. Because of this difference, the minimum voltage for discharging (i.e. U min in Figure 2) can decrease to zero in supercapacitor and supercapattery, but not in rechargeable battery because of possible irreversible changes in the cell when the cell voltage is lower than U min.
The link between Faradaic reactions and supercapacitors has been established on the so called pseudocapacitance. This concept was initially associated with the behaviour of adsorbed or deposited monolayer species on electrode in early 1960s [21,22]. Ruthenium dioxide, RuO2, was possibly the first redox active material that was reported in 1971 to be able to exhibit rectangular cyclic voltammograms (CVs) like a capacitor [23]. Similar voltammetric observations were reported for both the ECPs [24–26] and other TMOs [27–30]. However, the early findings of TMOs and ECPs being capable of capacitive storage of charge were not associated with supercapacitors for energy storage until early 1990s [23–25,27]. Because these redox active materials store charge in the capacitive way (i.e. rectangular CVs and linear Galvanostatic charging and discharging plots (GCDs)) that is also Faradaic in nature, but different from that in the EDLC, the concept of pseudocapacitance has also been used.
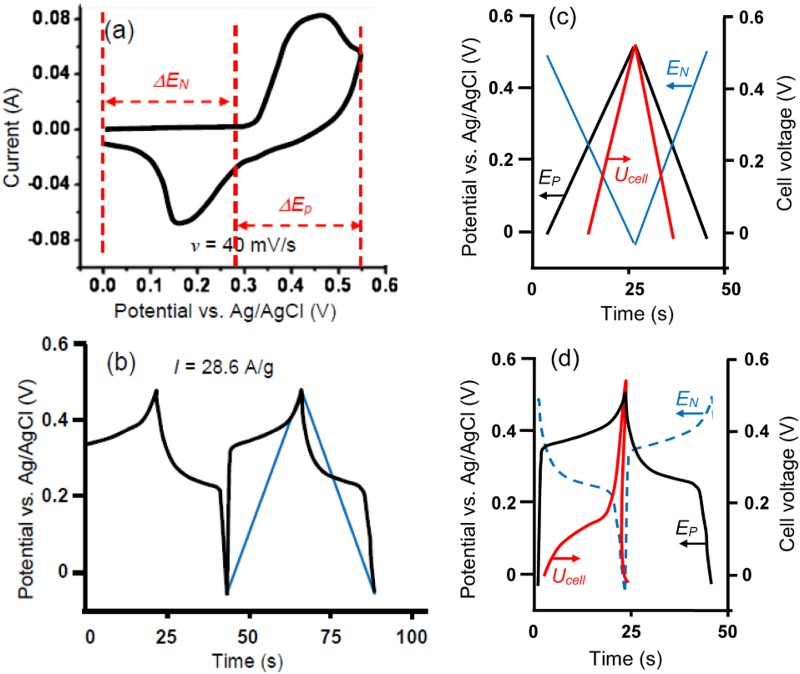
It is worth mentioning that by convention, a Faradaic process should follow the Nernst equation to produce peak-shaped CVs and non-linear GCDs as shown in Figure 4(a and c), respectively. Such Nernstian behaviour was also observed for the earlier reported electrode reactions of adsorbed species and was attributed to pseudocapacitance [21,22]. For energy or charge storage, the obvious differences between these two types of pseudocapacitance, i.e. rectangular CVs vs. peak-shaped CVs, were long recognised, but the explanation to the differences was based on numerical analysis, instead of a physicochemical attribution [32]. Unfortunately, these important differences have been ignored by quite many authors in recent years. By focusing on the linkage between Faradaic reactions and pseudocapacitance, these authors have applied the concept on some new but battery type materials. As a result, deceptively high specific capacitance values have been claimed, and used in calculation of specific energy [33–36]. (a) CVs derived from equation (1) at indicated potential scan rates, and (c) GCD plots derived from equation (3) at indicated constant currents of i, i/2, i/3 for a reversible Faradaic-Nernstian reaction with localised electron transfer to and from isolated redox sites on the electrode. (b) CVs at indicated voltage scan rates, and (d) GCD plots at indicated constant currents as derived from equation (2) for a capacitor of C = 50 mF with U
max = 5 V. In the GCD plots in (d), t
max = U
max
C/i [3,31].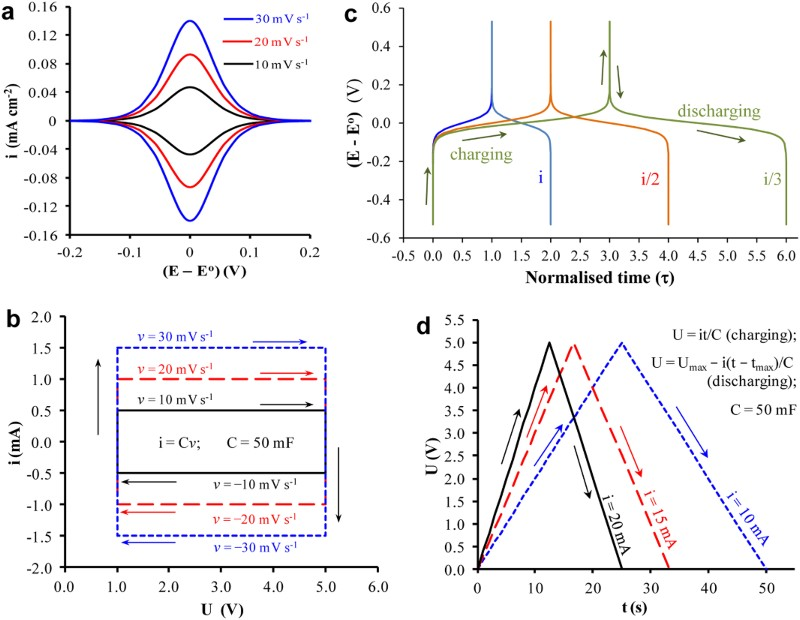
The confusion over the concept of pseudocapacitance needs clarification. When it is used to describe the behaviour of adsorbed species and, as a matter of fact, the thin layer coating of a redox active material on the electrode, the current response towards the linear potential change can be expressed as equation (1) below [15]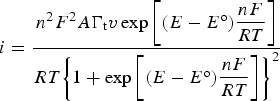
For comparison, the CVs of an ideal capacitor of 50 mF in capacitance are presented in Figure 4(b) as derived from the definition of capacitance, i.e. equation (2),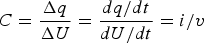
The two sets of CVs in Figure 4(a and b) look very different in shape, but they do share two common features, i.e. (1) the proportionality between current and potential or voltage scan rate, and (2) the switch of current polarity with the scan direction. It was these common features (and other related or derived properties) that had led to the concept of pseudocapacitance in the early literature on adsorption [15,21,22,32]. It should be mentioned that equation (1) describes an equilibrium situation, while slow kinetics of electrode reactions can lead to distortion of the CV shape, mostly the separation of the oxidation and reduction current peak potentials [15,32]. However, the i/v ratio and also the Δq/ΔE ratio in Figure 4(a) are a potential or voltage dependent variable, but these ratios remain independent of potential or as a constant in Figure 4(b) and equal to the capacitance, C.
The GCDs for a capacitor can also be derived from equation (2) as shown in Figure 4(d). For adsorbed species or thin layer coating of a redox active (non-capacitive) material on the electrode, the GCDs, see Figure 4(c), follow equation (3) which is a unique form of the Nernst equation [15].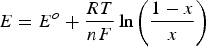


The obvious differences between Figure 4(c and d) highlight the inappropriateness of using non-linear GCDs for capacitance analysis, and this point is further discussed below.
Similar but less reversible behaviour is commonplace in testing of battery electrode materials. In these cases, the peak potential of oxidation on the CV would shift positively and that of reduction negatively. On the GCD, charging would cause deviation of potential rising upward with time from the plateau, while discharging would decrease the potential downward. Figure 2(b1–b3) depict the expected deviations on CVs and GCDs for a battery and its electrodes. Such behaviour is largely responsible for the relatively low energy efficiency of a battery.
Confusion arises when some authors attempt to use the overall Δq/ΔE ratio (or the Δq/ΔU ratio for a two electrode cell) of a peak-shaped CV or a non-linear GCD similar to those in Figures 2 and 3 as the capacitance. Although these authors may not be incorrect to describe their peak-shaped CVs as showing pseudocapacitance in line with the early literature on adsorption [21,22,32] they should have not used the Δq/ΔE (or Δq/ΔU) ratio as capacitance for energy calculation by the following equation [33–36].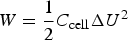
When U is a linear function of t, equation (6) leads to equation (5). In other words, equation (5) cannot be applied for a non-linear GCD. Second, CVs and GCDs are often recorded from a single electrode (in the three electrode cell). In such cases, charge storage can be achieved, which can then be used for calculation of specific charge capacity (peak-shaped CVs and non-linear GCDs) or specific capacitance (rectangular CVs and linear GCDs). However, energy storage and release can only be realised in a two electrode cell, but not from a single electrode. For calculation, the exception is the symmetrical supercapacitor in which the specific capacitance of the electrode material, C
sp, is simply four-fold of the cell specific capacitance, C
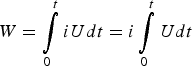
sp,cell, and can therefore be used for calculation of specific energy, W
sp. In such cases, the electrode potential window, ΔE
, measured in the three electrode cell can be the same as the maximum cell voltage, ΔU, measured in the two electrode cell.
To calculate the specific energy W
sp of an asymmetrical supercapacitor (or a rechargeable battery), the total mass of both the positrode and negatrode should be used with equation (5) if C and ΔU are measured from the GCD plot of the asymmetrical supercapacitor (not individual electrodes) [or with equation (6) if W is derived from the GCD of the battery]. For designing an asymmetrical supercapacitor, assuming C
sp+ and C
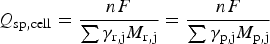
sp− to be the specific capacitances, m+ and m− the masses of the positrode and negatrode materials, respectively, the cell specific capacitance, C
sp,cell, can be calculated as follow.
Mechanisms of charge transfer and storage in materials
Reversible storage (charging) and release (discharging) of electric charge is the basis for all successful EES devices, although the charging–discharging mechanisms differ significantly, depending on where and how the charge is stored. EDL storage occurs at the interface between the electrode and electrolyte and is two dimensional in nature. It may be argued that when the electrode is sufficiently porous and contains a significant portion of well distributed micro-pores, EDL storage also becomes three dimensional. However, when inspected at molecular scale, EDL storage still remains two dimensional. In contrast, Faradaic storage proceeds inside the material and is intrinsically three dimensional at both macroscopic and molecular scales, giving rise to significantly higher specific charge capacity (mAh g−1) or specific capacitance (F/g) compared with EDL storage. Figure 5 illustrates schematically the charge storage mechanisms in (a) a carbon powder electrode via EDL capacitance and (b) a conducting polymer electrode via pseudocapacitance. The definition equation of capacitance, C = ε
0
εA/d, is shown inside the enlarged carbon particle in Figure 5(a) with A being the interfacial area, d the thickness of the EDL, ε the dielectric constant (or relative permittivity), and e
0 the vacuum permittivity (=8.854 × 10⁻¹² F/m). In Figure 5(b), charge storage is achieved via pseudocapacitance, i.e. the electro-oxidation of polyaniline that generates positive charges along individual polymer chains. Counter anions (A− = Cl−, (a, b) Schematic views of the cross-sections of (a) a carbon powder electrode and (b) a polyaniline electrode. The enlarge view below (a) shows charge storage on a single carbon particle via ion adsorption at the carbon | electrolyte interface, i.e. the EDL capacitance [37]. (c, d) CVs of (c) activated carbon [38] (2.5 mg) in 0.3 mol L−1 K2SO4 at 5 mV s−1 and (d) electrodeposited polyaniline [39] (10 mC) in 1.0 mol L−1 HCl at 20 mV s−1 in different potential ranges.
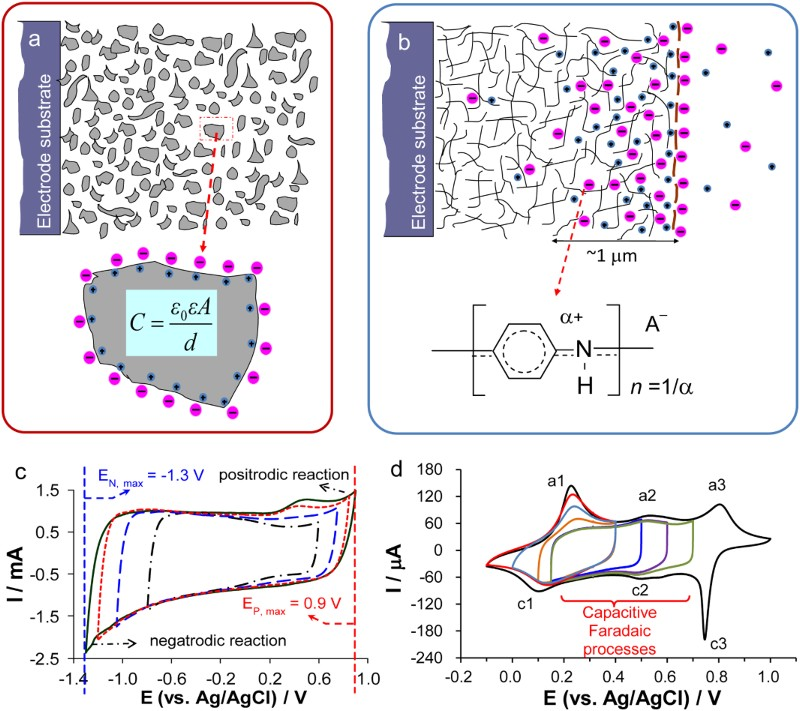
Faradaic processes can offer either capacitive or non-capacitive behaviour, but both involve electron transfer processes (or redox reactions). Non-capacitive Faradaic processes are governed broadly by the Nernst equation and hence can also be called Nernstian processes. On performance, Nernstian processes are featured by peak-shaped CVs and non-linear GCDs with one or more potential plateaux. These features are fundamentally related to the fact that the electron transfer reaction in a Nernstian process occurs when the electrode potential reaches at and beyond the unique equilibrium potential, E o, which is a constant for a given reaction at the working temperature. For a capacitive Faradaic process which is the basis of pseudocapacitance in the context of supercapacitors, rectangular CVs and linear GCDs are the common features which cannot be explained simply or easily by the Nernst equation. Note that there were many claims of high values of specific pseudocapacitance derived from peak-shaped CVs or non-linear GCDs [33–36] but these are misleading and excluded from discussion here because of reasons as discussed above and highlighted in both earlier and recent literature [3,5,32,40,41].
It has been proposed that the rectangular CV of a TMO based pseudocapacitive material is the result of ‘multiple surface successive redox reactions' which involves sub-stoichiometric variation in the electrode material and electro-adsorption of proton or cations. These reactions can be described below similarly for ruthenium oxides, Ru (IV-II), and manganese oxides Mn (IV-III) [42].

Note that the chemical formulae in both (10) and (11) can be written in other forms such as RuO2·xH2O, RuO2−x (OH) x and Li z MnO x (OH) y which are more complex, but do emphasise the hydrous nature of these oxides [42–44]. There are other TMOs that can offer capacitive Faradaic charge storage reactions similar to reactions (10) and (11), such as V2O5, SnO2 and Fe2O3 [36,40,45]. The proposal of ‘multiple surface successive redox reactions' however needs to answer some further questions. For example, why do these reactions only occur at the surface, and why do they not proceed with one full electron and one full cation?
In fact, in addition to TMOs, ECPs, such as polypyrrole (PPy), polyaniline (PAn) and poly 3,4-ethylene-dioxythiophene (PEDOT), can also exhibit capacitive Faradaic behaviour [24–27,39,46]. It should be mentioned that activated carbon retains capacitive performance, i.e. the rectangular CVs, over the whole potential window of the aqueous electrolyte. This is exemplified in Figure 5(c) by the CVs recorded in different potential ranges [38]. It can be seen that when the potential range is gradually extended, a reduction reaction (cathodic or negatrodic reaction as labelled in Figure 5(c)) appears at −1.1 V vs. Ag/AgCl. This reaction corresponds to H+ + e = Had, and the produced Had in the micro-pores of the activated carbon is re-oxidised when the potential is scanned back to around 0.5 V which is evident by the small re-oxidation peak. Beyond this small re-oxidation peak, a further oxidation current (anodic or positrodic reaction) appears at potentials beyond 0.8 V. This is likely due to oxidation of water, 2H2O = O2 + 4H+ + 4e−, and/or oxidation of carbon, C + 2H2O = CO2 + 4H+ + 4e−. Between these two limits, the activated carbon exhibited satisfactory capacitive currents on both the positive and negative potential scans.
In Figure 5(d), however, the CVs show that polyaniline only exhibits capacitive performance in a limited potential range between 0.1 and 0.8 V [39]. Widening the potential range leads to current peaks near both the positive and negative ends of the potential scan. Similar behaviour has been observed for PPy and PEDOT [47]. Because ECPs become insulating when they are reduced, the current peaks at less positive potentials are known to be linked with the oxidation induced doping (by anions) and reduction induced de-doping. Doping and de-doping of the polymer is accompanied by the conversion between the insulating and conducing phases of the polymer. For polyaniline, the current peaks at more positive potentials are due to formation of other forms of the polymer which are also less conducting [39,47]. For PPy, PAn and PEDOT, the rectangular CVs can be achieved by maintaining the polymer in the doped and partially doped states, i.e. in the potential range where complete reduction of the polymer is avoided. In other words, as long as the polymer remains sufficiently conducting, it will behave in the capacitive way.
Interestingly, although both RuO2 and MnO2 are widely studied for their pseudocapacitance, changing experimental conditions can also cause current peaks appearing on their CVs [48–50]. Figure 6 compares the CVs recorded in two different potential ranges on a graphite disc electrode whose surface contained trenches in which was filled the powder of the composite of MnO2 and CNTs [50]. The CVs recorded in the wider potential range (−0.8–0.9 V vs. Ag/AgCl) show a clearer couple of current peaks, see Figure 6(a), which can be attributed to the redox couple of Mn (III/II) and responsible for the fairly fast decay of the current on the CVs during only 100 potential cycles [50,51]. However, by positively shifting the negative potential end to avoid the reduction to the Mn (II) state which is soluble in aqueous solution [51] the CV becomes more rectangular and stable as shown in Figure 6(b). CVs of MnO
x
/CNTs composites in 0.5 mol L−1 KCl at 10 mV s−1 recorded during continuous potential cycling in the potential ranges of (a) −0.80 to 0.90 V (Inset: photo of a trenched graphite disk electrode) and (b) 0.0–0.85 V (Inset: plot of the relative capacitance against the number of potential cycles) [50].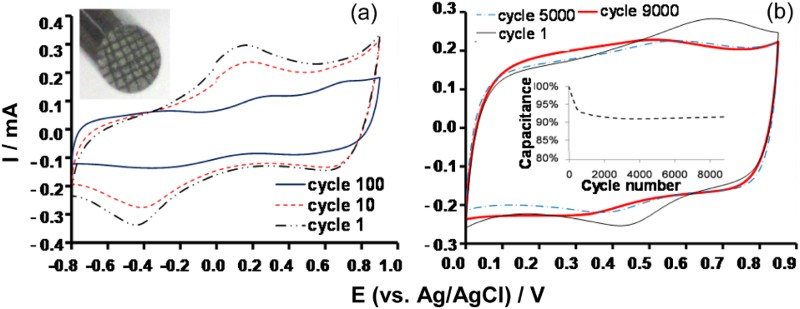
The influence of potential range on the CV shape as shown in Figure 5(d) and Figure 6 suggests that the origin of pseudocapacitance is likely related with a unique state of the material in terms of doping level, valence and/or conductivity. In this state, there is not a fixed equilibrium potential for the Faradaic (or electron transfer) reaction, but the potential has a continuous and constant influence in a noticeable potential range. Such capacitive behaviour cannot be explained by the Nernst equation, but it follows well with the semiconductor band model as explained in more details below.
When prepared in an appropriate form, both TMOs and ECPs can possess semi-conductivity which can be explained in relation with energy level of valence electrons in the material by the band model for chemical bonding as illustrated in Figure 7 [32,52]. Using metals as an example, the evolution of energy levels is presented from that of individual and separated atoms to that in clusters of 2, 5, 20 and 1020 atoms. Schematic illustrations of the band model for chemical bonding [15] (a) between metal atoms that are (i) separated and non-interactive, and (ii – v) forming clusters of (ii) 2, (iii) 5, (iv) 20 and (v) 1020 atoms, [52] and (b) the corresponding energy levels of the valence electrons as a function of the degree (or zone size) of delocalisation of valence electrons in the cluster of metal atoms [15].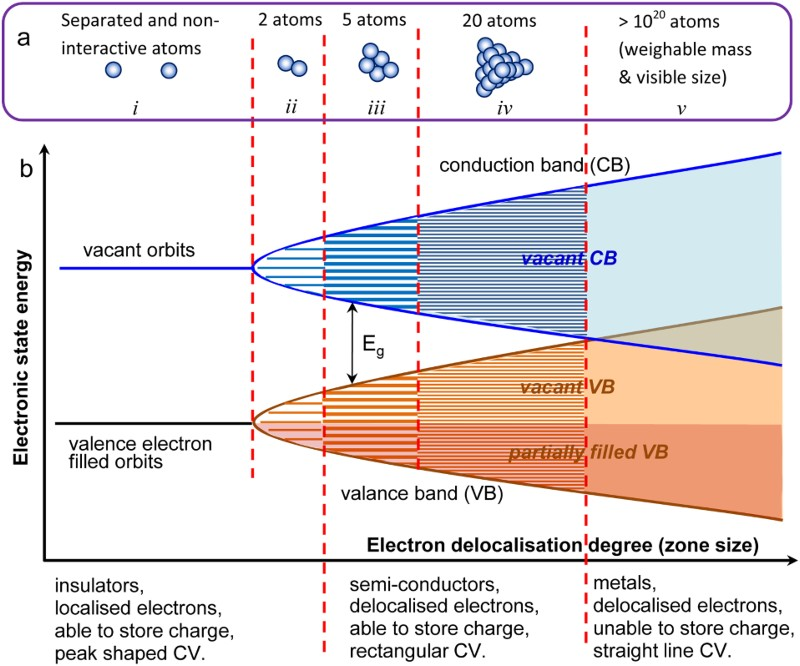
On the left side of Figure 7 is shown the energy levels of two orbits for non-interactive atoms (or atomic ions). The orbit of lower energy is filled with valance electrons, and the higher energy orbit is empty. Such valence electrons are fixed at a unique energy level, and hence referred as localised valence electrons. When two atoms are bonded, the original orbits of the atoms are split into more sub-orbits of different energy levels, and the number of sub-orbits depends on if the valence electrons are on the s, p, d or f orbits. Because the number of valence electrons remains the same before and after bonding, some of the sub-orbits at lower energy levels will be occupied, but the others are vacant.
Bonding more atoms into a cluster increases the number of sub-orbits in a multiple manner, while the gap between neighbouring energy levels of sub-orbits becomes smaller. Again, all the valence electrons occupy the sub-orbits at lower energy levels, leaving other sub-orbits unoccupied at higher energy levels. The sub-orbits are separated into two groups by a unique energy gap, E g, between the lowest energy level of the higher energy group, and the highest energy level of the lower energy group. By further increasing the number of atoms in bonding, the difference between neighbouring energy levels within the same group becomes so small that the energy change becomes continuous to form an energy band. The higher energy group is known as the conduction band (CB), but it is vacant in absence of any external effect (e.g. light). The lower energy group is given the name of valance band (VB). In most cases, the VB is partially occupied by valence electrons because the original atomic orbits are not fully occupied by valence electrons. As a result, valence electrons are able to move between the occupied and unoccupied orbits easily within the VB, offering different levels of semi-conductivity. In other words, the valence electrons are delocalised in the VB. Obviously, when more atoms are added in the cluster, the number of energy levels and also the degree or zone size of delocalisation increase, but the gap between neighbouring energy levels decreases. Eventually, the number of atoms in the cluster is so large (e.g. 1020) that the VB and CB are merged, leading to complete delocalisation of the valence electrons and fully metallic conductivity. Note that the drawing in Figure 7(b) is actually equally applicable to other semiconductor materials in which delocalisation of valence electrons occurs to different degrees and zone sizes, depending on, for example, the crystallinity of the material. Also, delocalisation can be either one, two or three dimensional as in the individual chains of polypyrrole, graphene or manganese dioxide, respectively.
In line with the band model, the Nernstian behaviour corresponds to electron transfer to or from isolated redox centres, such as those in a solid insulator or liquid electrolyte, where the valence electrons are localised. In other words, all the electrons transferred will enter or leave the orbits of the same energy level (of different redox centres) as shown on the far left side of Figure 7. This in turn means that the Faradaic reaction proceeds at potentials of a narrow range around the equilibrium potential, E o, and hence the current peaks on CV, or the potential plateau on GCD.
In the semiconductor region, there are many more orbits of very close energy levels over a wide range or a band. Thus, the potentials at which electron transfer take place also range widely but very close to each other, i.e. every small change in potential can cause an electron transfer, leading to a constant current flow in the capacitive way with a linearly varying potential, or a linearly varying potential under a constant current. This capacitive Faradaic process is the origin of the pseudocapacitance in the context of supercapacitors, which was however not recognised until recently [3,31,37].
An important nature of the band model is that each electron is transferred to a particular energy level that is shared by many atoms. Consequently, there is no longer a fixed stoichiometry between the number of electrons transferred and the number of atoms involved. In other words, the reaction stoichiometry becomes fractional as exemplified by reactions (10) and (11). Such fractional stoichiometry makes it challenging to derive the theoretical specific charge capacity and hence specific capacitance if the potential range is given, for pseudocapacitive materials.
One may argue that an integer number of electrons transferred in reactions (10) or (11) can be used for calculation of the theoretical specific charge capacity. However, caution must be applied when deriving specific capacitance because in the potential range for a full electron transfer per atom, the electrode reaction may cause a peak-shaped CV which invalidates capacitive analysis. Figure 8(a) shows clearly the peak-shaped CV of the composite of Ni(OH)2 and graphene in concentrated aqueous KOH solution in a potential range of 0–0.55 V [34]. Non-linear GCDs were also recorded from this material as shown in Figure 8(b). Based on these data, it can be confirmed that the specific charge capacity of the composite is close to the theoretical value of Q
sp = nF/M
Ni(OH)2 = 1040.94 C/g (289.15 mAh g−1) for the one-electron oxidation of Ni(OH)2. However, the specific charge capacity data were brought into equation (2) (C = Δq/ΔE) to claim high specific capacitance values (1335 F/g and 935 F/g against the mass of Ni(OH)2 only and of total sample, respectively, at 2.8 A/g). Surprisingly and incorrectly, such obtained specific capacitance values were brought into equation (5), instead of equation (7), to derive meaningless ‘energy density’ values (37–53 Wh kg−1. Here, energy density is mistaken for specific energy). The worse scenario appears when this Ni(OH)2–graphene composite is considered for making a symmetrical supercapacitor as explained below. (a) Peak-shaped CV and (b) non-linear GCD of nanoparticles of Ni(OH2 grown on graphene sheets in a 6 mol L−1 KOH aqueous electrolyte (redrawn from Wang et al. [34]). The blue line superimposed in (b) represents the GCD of an ideal capacitive electrode with the same ΔQ/ΔE ratio (ΔQ: charge = current × time; ΔE: potential difference) as that of the non-linear GCD of the Ni(OH)2-graphene composite (black line). (c) and (d) show the GCDs of hypothetical symmetrical cells (red line, U
cell = EP
− EN
) constructed respectively using the same (c) capacitive material and (d) Ni(OH)2-graphene composite as the positrode (black line, EP
) and negatrode (blue dashed line, EN
).
Apparently, a careful look at the CV in Figure 8(a) reveals that to make a symmetrical supercapacitor using this Ni(OH)2–graphene composite, the cell voltage would be the same as the potential range of the CV. Further, the potential ranges of the positrode and negatrode should be those marked as ΔEP and ΔEN , respectively, in Figure 8(a). However, the CV shows that in ΔEP oxidation can occur, but there is little reduction, and in ΔEN reduction can occur but no oxidation is possible. This means that a symmetrical supercapacitor of this composite would not be charged or discharged. This conclusion can also be derived from the GCD in Figure 8(b). For a true capacitive material with a specific capacitance of 1335 F/g in the potential range of 0.55 V, the GCDs of the positrode (EP ) and negatrode (EN ), and the symmetrical cell (U cell = EP − EN ) would look like those shown in Figure 8(c). Using the plot in Figure 8(b), the GCD of the positrode and negatrode and the symmetrical cell can be derived as shown in Figure 8(d). Clearly, the U cell curve in Figure 8(d) shows a charging process but no discharging, which agrees with the above analysis of the CV.
Because their charge storage and release processes are reversible, all capacitive materials can be applied in symmetrical supercapacitors. Thus, the Ni(OH)2–graphene composite discussed above is obviously not a capacitive material in a relatively wide potential range (>0.5 V). On the other hand, this nanostructured composite did show good charging–discharging rates and very stable behaviour in over 2000 charging–discharging cycles. Similar properties were reported for other nanostructured composite materials that exhibit peak-shaped CVs and non-linear GCDs. These non-capacitive faradaic properties make it worthwhile to pair such a composite with a capacitive material in a supercapattery. It should be emphasised that if a non-capacitive faradaic material undergoes reversible charging and discharging, i.e. the CV looks like that in Figure 4(a), it can also be made into a symmetrical device, although the cell voltage may be relatively small. More discussion will be given later in this article.
It must be highlighted that the capacitive Faradaic charge transfer (storage or release) in all known materials can only occur in a limited range of potentials, although this range could be wider than 1.0 V. This capacitive potential range is an intrinsic and characteristic property of the material, but it is also significantly affected by the electrolyte used. For example, MnO2 exhibits pseudocapacitance in a fairly wide potential range, −0.10 to 0.85 V vs. Ag/AgCl, in a neutral aqueous electrolyte, e.g. KCl. However, the material behaves more like a battery electrode material when the negative end of potential scan is extended to a more negative potential, e.g. −0.8 V as shown in Figure 6(a) [50]. In fact, MnO2 has been long studied in alkaline electrolytes and peak-shaped CVs were obtained in relatively wide potential windows, e.g. −1.1 to 0.5 V vs. Hg/HgO [53]. In a narrower potential window from −0.3 to 0.6 V vs. Hg/HgO, fairly rectangular CVs were also obtained [54]. Another example is NiO (or Ni(OH)2) which is also a long studied electrode material for charge storage [55,56]. A strong couple of current peaks appear on the CVs in the potential range of −0.3 to 0.8 V vs. Hg/HgO in concentrated KOH solutions (cf. Figure 8(a)) [55]. Similar observations were reported in more dilute KOH (3 wt-%), but the CV became almost ideally rectangular when the potential range was narrowed to 0–0.35 V vs. SCE [56]. In this narrow potential window, the specific capacitance of NiO as derived from the rectangular CVs could be over 100 F/g. This finding is in contrast with a recent comment that NiO is not a pseudocapacitive material by nature [40].
On the other hand, as discussed above, in the potential window where peak-shaped CVs are observed, Ni(OH)2 (or NiO and similarly nanostructured materials) can exhibit satisfactorily high specific charge capacity and also very stable charge–discharge cycling behaviour. Thus, such nanostructured materials are still good candidates for EES devices, such as supercapattery and supercabattery. They should just not be chased as capacitive or pseudocapacitive materials, and all their previously reported high specific capacitance values based on peak-shaped CVs and/or non-linear GCDs should be disregarded.
In the region of complete delocalisation of valence electrons as in metals, charge storage is not possible because the electrons will flow freely to the surface or out of the material even when a small polarisation is applied. As a result, metals can only offer limited capacitive charge storage via the EDLC mechanism. However, because it is difficult to prepare metallic samples with high specific area in comparison with activated porous carbon and other porous materials with nanostructures, metals are mostly used as the electrode substrate (current collector). Nevertheless, porous metals, such as the widely used nickel foam, can still be useful in fabrication of EES devices, functioning as excellent electrode substrate for loading of powdery active materials.
In summary, electrochemical charge (and energy) storage can proceed in three different mechanisms, i.e. EDLC, capacitive faradaic processes (pseudocapacitance), and non-capacitive faradaic processes (Nernstian behaviour). Of these three mechanisms, the concept of EDL as shown in Figure 1(a), and the Nernst equation (3) are well described in classic textbooks of electrochemistry. Although pseudocapacitance was initially proposed to account for some adsorption phenomena, its definition and meaning in the context of supercapacitor have evolved to an emphasis of the capacitive nature against the commonly observed Nernstian behaviour of many adsorbents on electrode.
Rechargeable battery vs. supercapacitor and their hybrid: supercapattery
In their early development and commercial production, EES devices, particularly rechargeable batteries, have been used predominantly as the power source in various portable devices. These include lighting in dark and remote areas, electrical and electronic appliances, and ignition for internal combustion engines. Power supply as backup for short period, and for vehicles travelling in short distances are also common, while large scale and long duration energy needs are mainly based on fossil fuels, which are now expected to be replaced at least to a significant part by renewables. This development is inevitable and greatly needed, but it faces a primary challenge in terms of specific energy (Wh kg−1) or energy density (Wh L−1). Fossil fuels typically contain 10–20 kWh kg−1 in specific energy as can be derived from enthalpy changes of the following two combustion reactions with carbon (coal) and methane (natural gas) as examples. Note that the room temperature of 25°C is applied in calculation of the enthalpy change, ΔH
o, so that the values can be compared with those discussed later for battery reactions.

The specific enthalpy, 
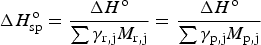

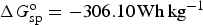
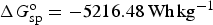
The specific Gibbs free energy changes of reactions (12) and (13) can then be calculated, taking into account only the mass of the fuel, to be −9.13 and −14.20 kWh kg−1, respectively. Note that the entropy change is positive for reaction (12) but negative for (13).
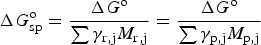
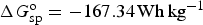
Similar calculations can be applied to battery reactions, but in such cases, it is the Gibbs free energy change, i.e. ΔG
o, that matters. For the classic lead-acid battery and alkaline zinc-manganese dioxide battery, and the more advanced lithium-air battery, the cell reactions are as follow.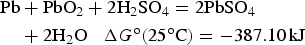


Similar to equation (14), specific Gibbs free energy, 
Not all battery reactions can be found in available thermodynamic databases, but it is still possible to derive their 

It is well established that the discharging cell voltage is 3.5 V on average for this lithium ion battery, which in turns gives rise to 552.2 Wh kg−1 in the cell specific energy. Note that the cell voltage can be linked to ΔG
o by equation (22) below.
For supercapacitors, calculation of the theoretical specific energy of the cell needs to be carried out according to the charge storage mechanism. For a symmetrical EDLC, charge storage involves no chemical reaction in theory. Thus, the cell specific energy is then directly derived from the maximum cell voltage, U
cell, which is usually the decomposition voltage of the electrolyte used, and the specific capacitance, C
sp, of the electrode material according to equation (7). The value of C
sp is in principle the product of the double layer capacitance, C
d (cf. Figure 1(a)), and the specific area, A
sp, of the material in contact with the electrolyte used, i.e.
Interestingly, a recent study has claimed that in nitrogen doped carbon prepared from pyrolysis of nitrogen rich polymers, there are abundant ‘ultramicropores’ (<0.5 nm) that are not detectable by the N2 adsorption, but can be accessed by CO2 and small ions (e.g. K+ and OH−). Consequently, the measured C
sp = 151 F/g was claimed to be still EDLC in nature because the specific surface area measured from N2 adsorption (A
sp = 60 m2 g−1 and C
d = 252 μF cm−2) was far smaller than that from CO2 adsorption (A
sp
= 587 m2 g−1 and C
d = 26 μF cm−2). This finding challenges the widely perceived pseudocapacitance resulting from the redox chemistry of the doping atoms [62]. In another recent study of a commercial activated carbon, argon was used as the adsorption gas, revealing an average pore size of 0.9 nm with 92% of the pores being <2 nm. In situ NMR and electrochemical quartz microbalance (EQCM) were applied to study the relatively larger ions, i.e. the tetraethylammonium cation 

Although pseudocapacitance studies in modified or doped carbon materials are inconsistent as discussed above, it is clearer for some TMOs and ECPs. Electrochemical properties, particularly redox chemistry, of these materials were studied long before their use in supercapacitors. Such knowledge has been used in predicting the theoretical specific capacitance of these materials by the ratio of specific charge, Q
sp, and the potential window, ΔE, of the material calculated according to equation (24).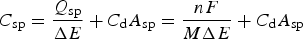
For MnO2, the formula mass M = 86.937 and n = 1 for reaction (11) with x = 1 and y = 0. ΔE is experimentally determined from CVs and it is 0.85 V in Figure 6(b). Without consideration of the EDLC, the theoretical value of C sp can then be calculated to be 1305.68 F/g with F = 96 485 C mol−1. Note that the result from equation (24) depends on ΔE which can vary between 0.8 and 1.0 V depending on materials and measurement conditions, which is possibly why different theoretical values of C sp for MnO2, such as 1100 and 1370 F/g, have been reported [64,65].
Similarly, the theoretical C
sp value can be calculated for ECPs, as explained by the following electron transfer reaction for polyaniline [39,66]
Although equation (24) links the specific capacitance with the formula mass, the number of electrons in the Faradaic reaction, and the potential window, determination of these parameters is not always straightforward as exemplified by the polyaniline example. For example, if one compares the CVs of the MnO2–CNT composite in Figure 6, it is clear that the charge transferred for either oxidation or reduction in the narrow potential range is about a half of that in the wide potential range. Thus, if the CVs in the wide potential range (which is 1.65 V in Figure 6(a)) corresponded to a one electron transfer reaction, it must have been a fractional number of electrons involved in the Faradaic reaction in the narrow potential range (0.85 V in Figure 6(b)). However, in the wide potential range, the CVs are peak-shaped and show poor reversibility and hence should not be used for capacitance analysis. More importantly, as discussed before, the peaked shaped CV is due to the change of Mn(III) to Mn(II), which means n = 2 in the wider potential range.
It is acknowledged that several publications have claimed specific capacitance well over 1300 F/g in potential ranges narrower than 1.0 V for variously prepared MnO2 samples [67–69]. However, it is also noticed that these claims were made against measurements of extremely low loading of the MnO2 sample (<10 μg cm−2) on a flat electrode substrate, or loading the MnO2 sample on highly porous electrode substrate (e.g. the nickel foam). Consequently, these measurements would have inevitably included the EDL contribution from the electrode substrate.
Supercapacitors, either the EDLC or pseudocapacitor, are widely perceived to have high power capability, but low energy capacity in comparison with rechargeable batteries. However, if one considers equation (7) with a specific capacitance, C sp, of 800 F/g, and a maximum voltage of 3.0 V for a symmetrical cell, the specific energy, W sp, would be 250 Wh kg−1. This calculation obviously includes assumptions that are individually correct, but may not be realistic when they are considered in one device based on current literature. Specific capacitance higher than 800 F/g has been often reported for nanostructured pseudocapacitive materials, but the potential windows are rarely wider than 1.0 V, disregarding the electrolyte used. Thus, the asymmetrical design is a necessity to achieve higher voltages.
There are two main designs of asymmetrical devices. The first design is the so called asymmetrical supercapacitors in which both the positrode and negatrode are still capable of capacitive charge storage, but the combination can be (1) an EDLC electrode and a pseudocapacitance electrode (E||P), (2) two different EDLC electrodes (E1||E2), or (3) two different pseudocapacitance electrodes (P1||P2). The E1||E2 combination, such as ‘activated carbon (−) || graphite (+)’, is rarely reported in the literature [70] while the E||P and P1||P2 combinations are more popular, including ‘activated carbon (−) || polypyrrole-CNT (+)’ and ‘SnO2-CNT (−) || MnO2-CNT (+)’ [11,54,71,72]. In most reported cases, increased charge capacity or cell voltage or both were achieved, leading to increased energy capacity. The use of composites of CNTs individually coated with either an ECP or TMO in supercapacitors is worth highlighting.
The achievements in production of various nanostructured materials are one of the important factors contributing to the fast expansion of supercapacitor research in recent years. Among all nanomaterials used for making electrodes in supercapacitors, CNTs are unique and non-replaceable for their great structural, mechanical, electrical and chemical properties. CNTs are ideal for construction of porous structures with both micro- and nanometre sized and interconnected pores that are needed for passage of charge balancing ions. The high electrical conductivity of CNTs is also beneficial to fast movement of electrons within the electrode. Both the improved ionic and electronic conductivities are crucial for more complete utilisation of the active materials on the electrode in high speed charging and discharging. CNTs are mechanically very strong, which helps the redox active material coated on individual CNTs to withstand stress and fatigue caused by repeated intercalation and depletion of ions. This in turn prolongs the cycle life of the electrode materials. In terms of chemical properties, CNTs offer high stability towards various chemical and electrochemical attacks. However, they can undergo controllable partial chemical oxidation under acidic conditions. Such acid treated CNTs possess various surface oxygen containing functional groups that can help uniform dispersion of CNTs in an appropriate aqueous or organoaqueous solution up to or over 1 wt-% in concentration. The CNT suspension can then be introduced in various reaction media for coating with the desirable redox active materials.
Figure 9 presents electron microscopic images of as received CNTs and their composites with different redox active materials prepared by electrochemical co-deposition [47,73] redox deposition [44,74] and chemical precipitation [72]. Specifically, the progression of redox deposition of MnO2 on the CNT is illustrated in Figure 10. This chemical method has received particular attention recently because of the fast growing interest in preparation and application of composites of various metal oxides and carbon-based nanomaterials, e.g. CNTs, graphenes and silicon carbide [74–77]. Illustration of redox deposition of MnO2 on CNT external and internal surfaces in two stages. (a) Stage 1: direct electron transfer reaction between 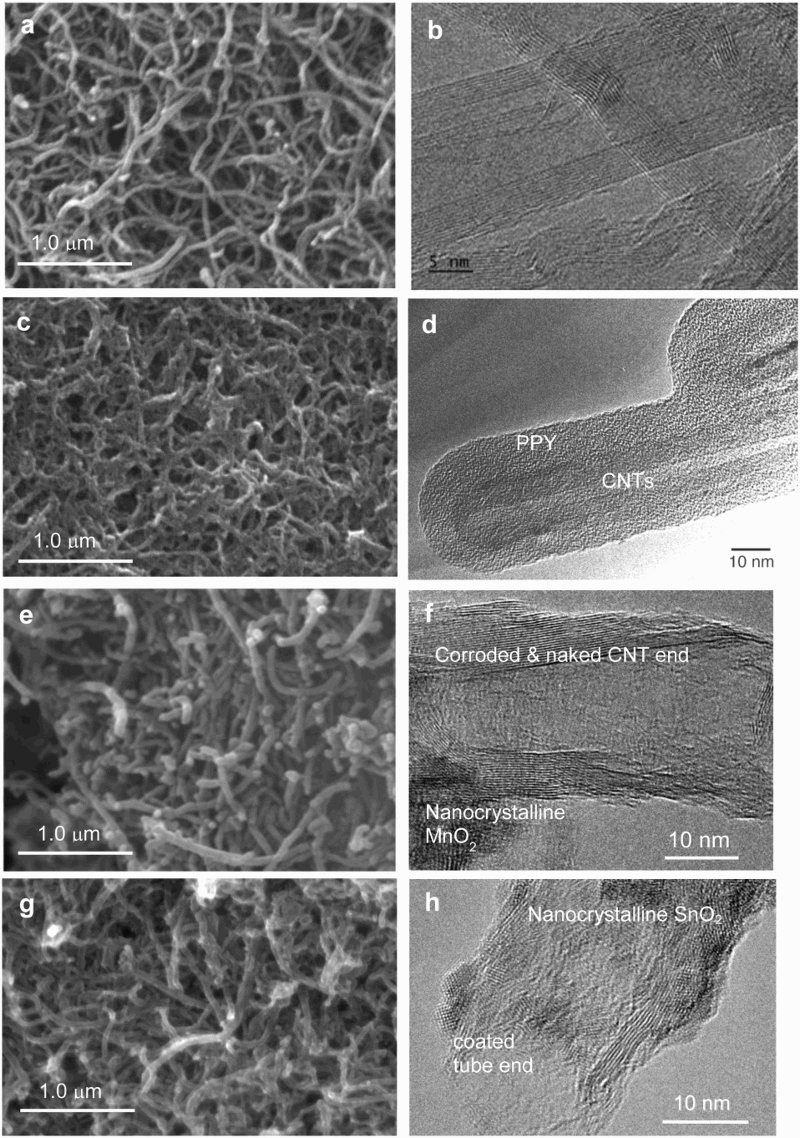


The second design of asymmetrical devices is more dramatic by combining a supercapacitor electrode and a battery electrode into one device, although such devices have been reported under different names, mainly reflecting the different electrode materials used [9–14]. Clearly, using a unified approach, such as supercapattery (or supercabattery) is desirable for development in research and commercial applications. The principle of supercapattery is schematically illustrated in Figure 2(d), but the advantage can be quantified further. As discussed above, it may be feasible to obtain a pseudocapacitive material with a specific capacitance value of 800 F/g, but it would be difficult to make a symmetrical supercapacitor from such a material to reach a cell voltage of 3.0 V or higher.
Now, consider a supercapattery with a lithium (Li) metal negatrode and an activated carbon positrode. It is possible to predict the behaviour of the electrodes and the cell as shown by the GCDs in Figure 11(a). Obviously the cell behaviour is highly capacitive, and can therefore be dealt with using the capacitor equations, such as equation (5). It can be seen in Figure 11(a) that the minimum potential of the carbon electrode is 0.5 V vs. Li/Li+, instead of zero. This is to prevent the carbon electrode from undergoing any lithiation during discharging. Calculated electrode potential (black and blue lines) and cell voltage (red dashed lines) as a function of normalised time for galvanostatic charging and discharging of three types of supercapattery with (a) a negatrode of lithium metal or lithiated carbon and a positive positrode of activated carbon, (b) a negatrode of lithium metal or lithiated carbon and a pseudocapacitive positrode, and (c) a negatrode of the typical battery type and a pseudocapacitive positrode [3,5,6,78].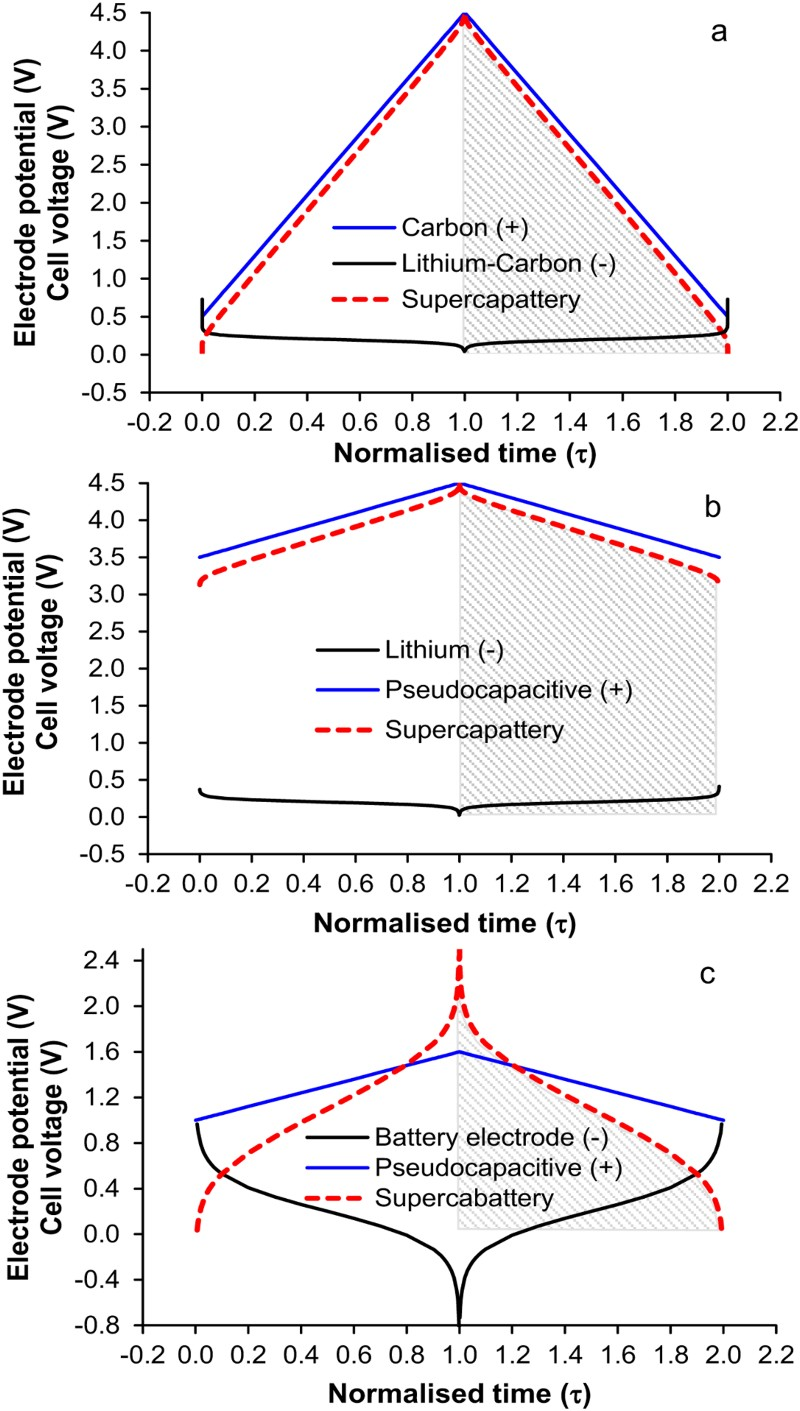
To achieve the capacitive performance shown in Figure 11(a), the balance of the masses and hence charges of the positrode and negatrode is important. In a supercapattery cell with a battery negatrode and capacitor positrode, the charge passed through both electrodes must be the same, which in turn fixes the positrode to negatrode mass ratio.
For a lithium negatrode, Q
sp,Li = nF/M
Li = 13 900 C/g = 3861 mAh g−1 (M
Li = 6.941, n = 1). For the activated carbon positrode with C
sp,C = 200 F/g and ΔE = 4.0 V, Q
sp,C = C
sp,CΔE. The positrode to negatrode mass ratio is m
C/m
Li = Q
sp,Li/(C
sp,CΔE) = 13 900/(200*4.0) = 17.375 As a result, the total mass of lithium metal used to build the supercapattery is negligible compared to that of the activated carbon. The specific energy of such a lithium-carbon supercapattery can be calculated using equation (5) in which C
cell ≈ m
C
C
sp,C. As mentioned above, to avoid lithiation of the carbon positrode, discharging the lithium-carbon supercapattery can only reach a minimum voltage, U
min, instead of zero. Thus, equation (5) needs to be modified to equation (27) below.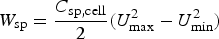
For a LiC6 – C supercapattery, i.e. replacing the Li metal negatrode with a lithiated carbon (LiC x , x ≥ 6) negatrode, the theoretical specific charge capacity of LiC6 is 1340 C/g. Thus, the positrode to negatrode mass ratio is m C/m LiC6 = Q sp,LiC6/(C sp,CΔE) = 1340/(200*4.0)=1.675 which means that the mass of the LiC6 negatrode is not negligible. Because the cell still behaves in the capacitive way as shown in Figure 11(a), it is practically appropriate to estimate an apparent specific capacitance of the LiC6 electrode. Since the potential change of the LiC6 electrode is smaller than 50 mV along the potential plateau, the apparent specific capacitance should be larger than 1340/0.05 = 2680 F/g, which is over 16 times of that of the carbon positrode. Consequently, the cell capacitance is approximately the same as that of the carbon positrode. Assuming 1.00 g for the mass of the LiC6 negatrode, the carbon positrode mass would be 1.675 g. It can then be derived that the specific cell capacitance is C sp,cell = 1.675 × 200/(1.675 + 1.00) = 125.0 F/g. Thus, for U max = 4.5 V and U min = 0.5 V, from equation (27), the specific energy of the LiC6 – carbon supercapattery can be calculated to be W sp = 347.2 Wh kg−1.
In the two examples of supercapattery discussed above, the positrode is of the EDLC type with a relatively low specific capacitance but it has a wide potential range. If a positrode of the pseudocapacitive type is used with a higher specific capacitance (e.g. C
sp+ = 500 F/g), but a narrower potential range (3.5–4.5 V) as shown by the GCDs in Figure 11(b), the positrode to negatrode mass ratio m
pseudo/m
Li = Q
sp,Li/(C
sp,pseudoΔE) = 13 900/(500*1.0) = 27.8 which is again large enough to neglect the lithium negatrode mass. Then, the specific energy can be calculated from equation (27) to be W
sp = 500 × (4.52−3.52)/(2 × 3.6) = 555.6 Wh kg−1. Replacing Li metal by LiC6 will lead to m
pseudo/m
LiC6 = Q
sp,LiC6/(C
sp,pseudoΔE) = 1340/(500 × 1.0) = 2.68, C
sp,cell = 2.68 × 500/(1 + 2.68) = 364.1 F/g, and W
sp = 364.1 × (4.52−3.52)/(2 × 3.6) = 404.6 Wh kg−1. These calculated results for cases as represented by Figure 11(b) compare very well with recent studies of the Li – MnO2 cell as shown by the GCD in Figure 12(a), and also the Li-activated carbon and Li – RuO2 cells with combined solid and aqueous electrolytes [7,8]. Experimental demonstration of supercapatteries with GCDs from (a) (−) Li | solid electrolyte | aqueous electrolyte | MnO2 (+) (0.255 mA cm−2) [7] and (b) (−) Li | ionic liquid | activated carbon (+) (1 mA cm−2) [79]. Inset in (a) is a photograph of the fabricated pouched cell [8]. (Redrawn and reprinted with permission from the Royal Society of Chemistry and Elsevier).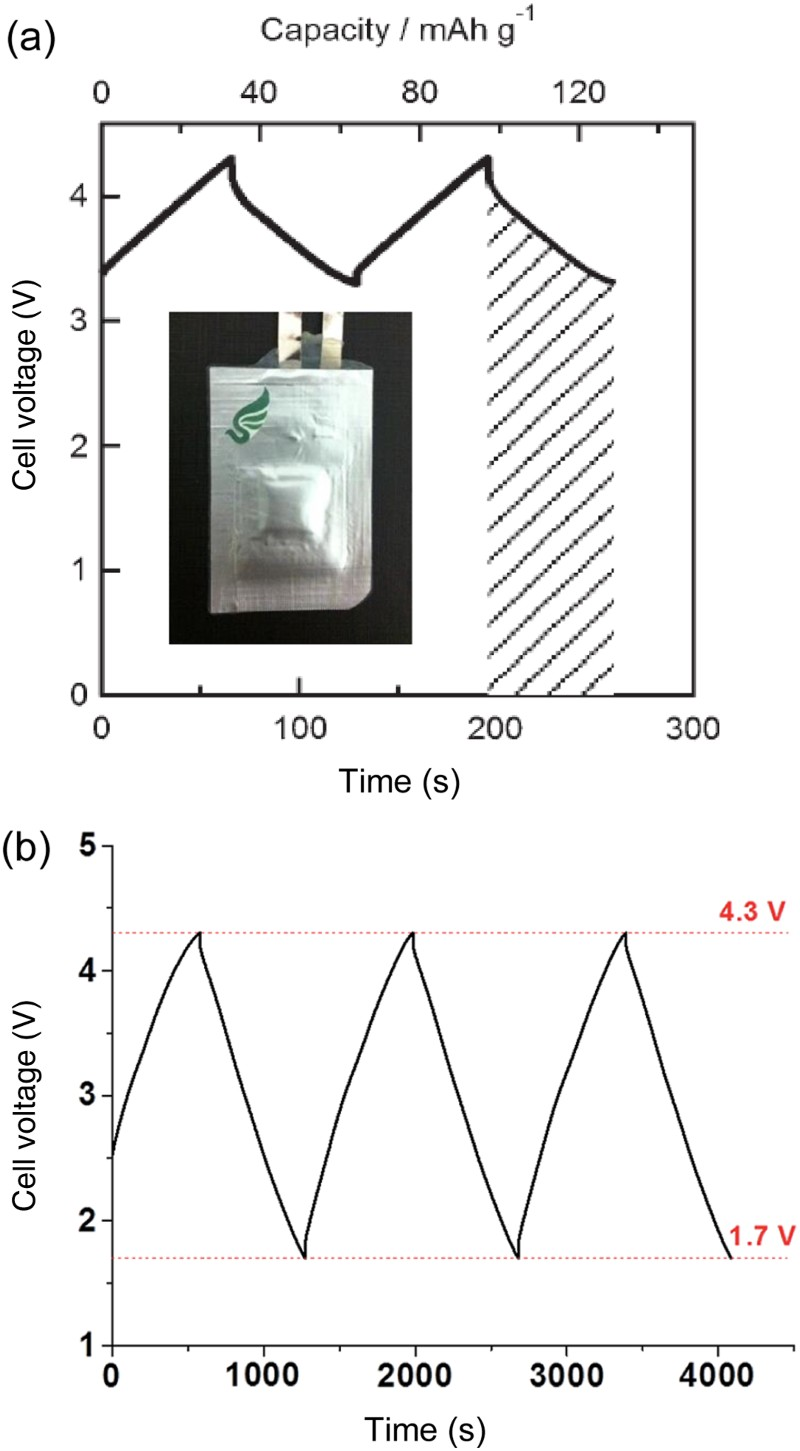
In reality, most battery electrodes work at potentials much more positive than those of the Li metal or LiC6 compound negatrodes, and the respective CVs or GCD plots are often observed to be much more sluggish [6,36,80]. As a result, the capacitor concept and equations should not be applied. Figure 11(c) shows the calculated GCDs of the electrode potential and cell voltage against the charging and discharging times. In this case, because of the sluggish GCD of the battery negatrode, and also the pseudocapacitive electrode potential being not very much more positive than those of the negatrode, the GCD of the cell is non-linear. In such cases, the energy capacity of the cell should be obtained by integration of the GCD of the cell. Graphically, the energy capacity is proportional to the area under the discharging branch of the GCD. Obviously, the GCDs in Figure 11(c) are more similar to those of batteries than supercapacitors. Therefore, it may be worth calling these devices as supercabattery to differentiate from supercapattery which behaves more like a supercapacitor.
In summary, the combination of battery and supercapacitor electrode materials into one EES devices can result in behaviour that can be either apparently the same as that of a capacitor showing the linear voltage variation with time as displayed in Figure 11(a and b), or very much comparable to that of a battery with the voltage-time relation being non-linear. In each of these cases, the shaded area under the discharging branch of the GCD of the cell is proportional to the energy discharged. Equations (5) or (27) can be applied to the cases of linear GCDs, but not to the non-linear ones. Integration of the non-linear plot is the only way to obtain the energy value. Such hybrid devices are not the same as either the conventional supercapacitor or battery in terms of charge storage mechanisms but capable of improved technical performances. The number of such hybrid devices is growing exponentially and hence deserve new names in collection which is why supercapattery and supercabattery have been proposed.
Materials for supercapattery
The EES literature is largely filled with research findings from synthesis of new electrode materials and/or tests of these in a particular EES environment or directly in an EES device, while most recent efforts have been devoted to construction of various nanostructures [10,11,13,14,16,17,23–31,34–39,44–51,53–58,60–62,64–70,72–77,80]. These efforts have undoubtedly contributed to the progress in EES research and development, but it is still necessary to link material design, synthesis and selection with the needs to promote electrode processes and reactions for charge and energy storage.
Technically, all EES devices should consider three important factors, i.e. energy capacity, charging and discharging speed (or power capability) and cycle life. The above discussion has focused mainly on energy capacity, which is more intrinsically determined by the material properties that are closely related to thermodynamics, e.g. equations (19) and (22). In practice, the realisation of thermodynamic energy capacity, particularly in a repeated manner, is strongly dependent on the electrode kinetics of the charging and discharging processes or reactions.
Electrode kinetics studies firstly the transfer of charges (electrons and/or ions) at the boundary (interface or interline) between the electrode (electronic conductor) and one or more condensed phases (semiconductor and ionic conductor) connected to the electrode (e.g. the ‘metal (electrode) | electrolyte’ interface, or the ‘carbon | metal oxide | electrolyte’ interline), and secondly the transport of charges (and the associated masses) through one or more of the condensed phases (e.g. transport of anions in the aqueous electrolyte of a porous polypyrrole electrode). In practice, charge transfer and transport processes are always correlated (to satisfy the neutrality requirement) and often mutually influential. However, some variables (e.g. chemical nature of material and electrode potential) affect more on charge transfer, and the others (e.g. porous structure of material and temperature) exert more impact on charge transport.
Manipulation of charge transfer kinetics can be achieved by selection of the electrode active material. For example, direct use of Li metal as the negatrode is based on electron transfer between the Li metal and Li+ in the electrolyte, accompanied by deposition and dissolution of the Li metal. The same occurs on the lead (Pb) metal negatrode. In absence of deposition and dissolution, many TMOs and ECPs can enable electron transfer in capacitive and non-capacitive Faradaic charge storage, while carbons of different porous and nano structures affect mainly ion transfer in capacitive non-Faradaic charge storage. For TMOs, except for single or few atomic or molecular layers, electron transfer occurs at the ‘current collector | TMO’ interface and it is always accompanied by ion transfer at the ‘TMO | electrolyte’ interface to maintain the electrical neutrality inside the electrode active material. A similar picture can also be seen in cases of various ECPs. Obviously, between these two interfaces electron and ion can transport inside the active material to maintain electric neutrality.
In all EES devices, except for metal deposition and dissolution, and ultrathin layers (single and few atomic or molecular layers), charge transport kinetics is far more relevant to ion transport than to electron transport. The kinetics depends more strongly on ion movement inside the active material on the electrode than in the bulk electrolyte. Because ion movement in a solid phase is far slower than in a liquid electrolyte phase, porous and nanostructured materials are preferred so that the depth of ion transport inside the solid phase is minimised. It is worth mentioning that RuO2 is a rare example as a good conductor of both electrons and ions (protons), but this is not the case for most TMOs and ECPs. Thus, formation of a composite of the TMO or ECP with an electronically conducting support that can also help construction of a porous structure is an efficient approach. For such purposes, nanostructured carbon materials, such as CNTs and graphenes, are the popular support materials, as exemplified in Figure 9 for composites of CNTs and TMOs or ECPs. Synthesis of these composite materials is also relatively simple. A good example is redox deposition for preparation of composites of CNTs and MnO2 as illustrated in Figure 10.
It should be emphasised that although porous nanostructures facilitate significantly ion transport kinetics, they may not necessarily help improve the material stability for repeated charging and discharging cycles. Theoretically, all electrode active materials for Faradaic charge storage will suffer from fatigue damages due to repeated ingression and egression of ions. The effective way to mitigate this intrinsic problem is to support the active material as a thin coating on electrochemically inert nanoparticulates. Again, CNTs and graphenes are ideal candidates for loading both TMOs and ECPs [64–66,72–77]. There are also attempts to support the active materials on other inorganic nanomaterials to help not only ion transport kinetics and material stability, but also to exert desired chemical interactions with the active material [81,82]. A fairly successful example was recently reported for coating MnO2 on nanowires of CeO2 and the test of the MnO2–CeO2 composite positrode in an asymmetrical supercapacitor with an oxidised graphene negatrode in an aqueous electrolyte of 1.0 mol L−1 Na2SO4 [81]. However, such approaches often suffer from the poor electronic conductivity of these inorganic nanomaterials.
In EES technologies, not only the solid electrode materials are important, but also the liquid electrolytes which are mainly aqueous, organic and IL electrolytes. Aqueous electrolytes are advantageous in their high conductivity and heat capacity, and low cost and environmental impact. The low decomposition voltage of water (ca. 1.2 V) is often quoted to discourage application of aqueous electrolytes. This perception is unfortunate because it is actually possible to extend the cell voltage of aqueous supercapacitors by employing electrode materials with high overpotentials for evolution of either or both hydrogen and oxygen gases. The classic lead-acid battery contains an aqueous electrolyte (concentrated H2SO4) but works at a voltage of ca. 2.2 V, while recent reports also show cell voltages around 2.0 V for supercapacitors with carbon-based negatrode and MnO2 based positrodes in neutral aqueous electrolytes, such as Na2SO4 [38,81,83,84]. It should be pointed out that using electrode materials with high oxygen and hydrogen overpotentials does not necessarily mean a high supercapacitor voltage would definitely be achieved. The capacitance ratio or mass ratio of the positrode to negatrode of the supercapacitor must also be adjusted properly so that the potential ranges of the negatrode and positrodes can be fully utilised [38,83–86]. Another perception is that water freezes at 0°C, and hence aqueous electrolytes could not be used at low temperatures. In fact, many inorganic salts can help decrease the freezing temperature of water significantly, as shown in Figure 13(a) [87]. The CVs in Figure 13(b and c) demonstrate a CNT electrode retaining its capacitive charge storage ability at temperatures below −60°C in an organoaqueous electrolyte of CaCl2 [88].
Organic electrolytes, such as tetraethylammonium tetrafluoroborate dissolved in acetonitrile or propylene carbonate, are currently used in commercial supercapacitors with activated carbon electrodes [89–91]. They offer wide potential and temperature windows (up to 3.5 V, from −50 to 70°C). Cost of organic electrolytes is not low but affordable for commercial purposes. Nonetheless, organic solvent based electrolytes are usually highly flammable, which causes safety concerns, particularly when the EES device is to work at high charging currents and high cell voltages. Problems with organic electrolyte based Li-ion batteries are often reported [92,93], and the same or similar situations are expected for supercapacitors with organic electrolytes.
To enable safe operation at cell voltages higher than 4.0 V, the use of solid ion conducting membranes together with aqueous electrolytes has been demonstrated [7,8]. This approach will progress further if the ionic conductivity, mechanical stability, and manufacturing flexibility and cost of the solid ion conducting membrane can be significantly improved. In fact, the technically more desirable choices to achieve high cell voltages are perhaps ionic liquids (ILs) which have promised potential windows of 4–6 V and also low evaporability and flammability [94–99]. ILs have long been investigated for electrochemical applications for both materials and energy purposes. Tests of ILs in lithium ion batteries have revealed promising results [99] but ILs are in fact and incidentally better for supercapacitors and supercapatteries. This is because, in principle, the cell voltage of a rechargeable battery is fixed by the potential difference between the two electrode reactions, but it is by the decomposition voltage of the electrolyte in a supercapacitor or supercapattery. In line with this understanding, a symmetrical supercapacitor with electrodes of curved graphene sheets and an IL electrolyte of 1-ethyl-3-methylimidazolium tetrafluoroborate was tested to a cell voltage of 4.5 V. The specific energy was reported to be 90 Wh kg−1 at room temperature but increase to 136 Wh kg−1 at 80°C [100]. Note that this temperature assisted increase in specific energy is a reflection of the drawback of ILs: they are often highly viscous at room temperature and their component ions are slow moving and unable to access all the internal surfaces of the graphene electrode.
Application of ILs in supercapattery is still rare in the literature, but it can be expected to benefit from the accumulated knowledge of lithium ion battery research. In the author's laboratory, preliminary tests of a supercapattery with a lithium negatrode, an activated carbon positrode (110 F/g) and an IL electrolyte of LiClO4 revealed a maximum cell voltage of 4.2 V with the minimum discharging voltage being 1.7 V. The GCD of this IL supercapattery is shown in Figure 12(b) from which it was derived that the specific energy reached beyond 230 Wh kg−1 [79]. It can be anticipated that if the specific capacitance of the positrode may be increased to over 400 F/g by using a pseudocapacitive material, the specific energy of the IL based supercapattery can be even higher as already discussed above in relation with Figure 11(b).
Apart from the above discussed electrode materials and electrolytes which play active roles in EES devices, there are other materials as illustrated in Figure 2, including the separator, current collector and packaging materials [37]. These materials do not in principle participate in the charging and discharging processes, but their presence in the EES devices enable and even can in some cases enhance the performance of the active materials. Nevertheless, because of their relatively inert nature, enabling materials are selected more because of their commercial availability and costs, and hence have attracted little research attention. Fortunately, these enabling materials perform similarly in, and can be shared between different types of EES devices. For example, in the author’s laboratory, it was found that supercapattery could use the same porous polymeric separators (membranes) for supercapacitor with either an aqueous or organic electrolyte. These separators include common laboratory filter papers [71] and commercial membranes such as the Celgard products [50] which are originally produced for use in Li-ion batteries. Ion selective membranes are rarely used in supercapacitor or supercapattery because they are far more resistive than the conventional porous polymer membranes. However, to enable the use of Li metal as the negatrode in aqueous EES devices, solid Li+ ion conductor remains the preferred choice [7,8]. The current collector materials used in rechargeable batteries, e.g. carbon plate, aluminium foil and nickel foam, find good applications in supercapacitors and supercapatteries. The author and co-workers found that titanium foils performed very well in chloride based aqueous electrolytes [50,71] but could suffer from passivation in sulphate containing electrolytes. Last but not the least, packaging materials not only support the structure of EES devices, but also isolate the EES device from its environment to avoid solvent evaporation and prevent moisture from entering the cell. Thermal lamination with thermoplastic films is an effective way to seal off relatively small EES devices. However, for large devices, particularly those stacks of multiple cells, more sophisticated designs and constructions are necessary. An attempt made in the author's laboratory is discussed in detail in the next section.
Prospects and challenges
Investigation and application of EES devices are experiencing unprecedented innovation and development opportunities, thanks to the urgent need to mitigate the detrimental impact of anthropogenic CO2 emission, and to utilise renewable sources in places of the fossil resources. In this line, because electricity is not a naturally available form of energy, EES development needs to suit both traditional and new electricity generation and transfer technologies, such as coal fired and nuclear power plants, and photovoltaic and wind farms. Even for storage, EES can be competitive with, but more often complementary to mechanical (pumped hydro, compressed air) and thermal (phase change materials, molten salts) energy storage. In comparison with other storage methods, EES devices are unique for their modular nature and hence applicable at both small and large scales and for both stationary and mobile purposes.
As discussed in previous sections, a great many past efforts have focused on increasing the energy and power densities of individual EES cells, which is mostly driven by the need for mobile or transport applications. In this line, supercapattery offers great promises by combining the merits of supercapacitor and rechargeable battery. Based on the current literature and the research progressing in the author's laboratory, schematic Ragone plots are drawn in Figure 14, showing the relative position of supercapattery in relevance to several EES devices and internal combustion engine. Note that Figure 14 reflects practically achieved energy and power correlations, at least in laboratory. This is well reflected by the position of internal combustion engine being far away from those of the EES devices presented. In principle, the specific energy of battery can reach that of internal combustion engine. This can be shown straightaway by the following two reactions and the related specific enthalpy changes. A schematic Ragone plot showing the position of supercapattery relative to other energy technologies [46].

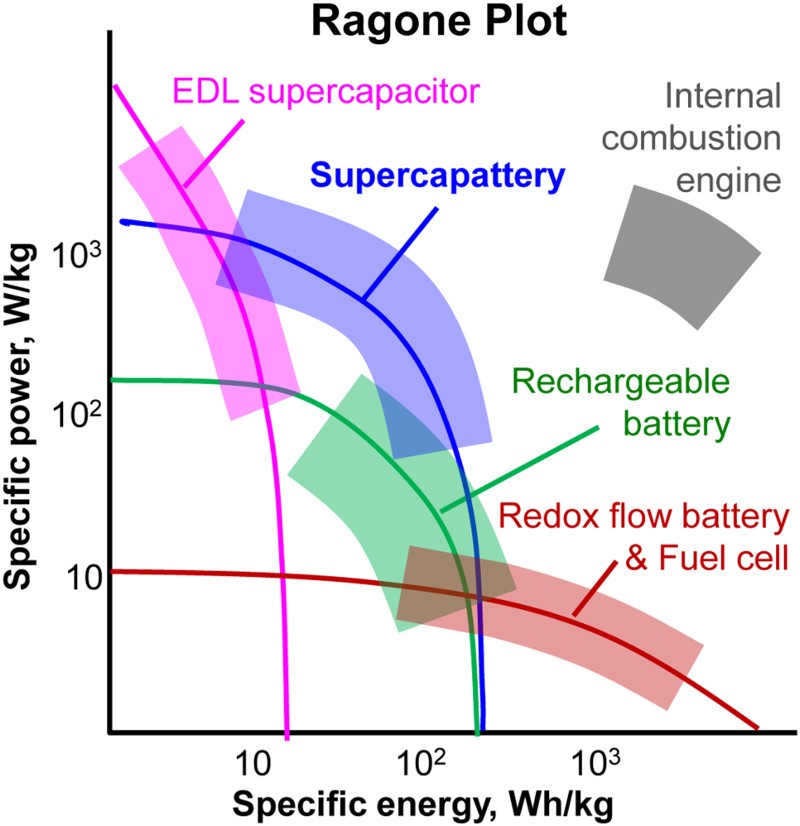
Reaction (28) occurs in the coal fired power plant, while reaction (29) in the lithium metal – air battery. (Reactions (28) and (29) are the same as reactions (12) and (18), but are shown here for discussion convenience at a different temperature.)
In reality, the energy released from both reactions cannot be fully utilised to do work because of the Carnot cycle restriction for reaction (28), and various polarisation losses for reaction (29). Note that reaction (28) can be utilised to build a carbon-air battery which is the same as the so called direct carbon fuel cell [101]. Therefore, one may electrochemically reverse both reactions (28) and (29), which is equivalent to charging the respective battery. In such a charging process, further energy losses are inevitable due to various polarisations. As a result, the specific energy of a rechargeable battery is lower than that of the primary battery, and much lower than the thermodynamic prediction.
However, the above analysis does not mean that current EES technologies have no room for improvement. This is typically demonstrated in the significantly improved lithium metal – air battery that used a graphene oxide electrode, LiI as the redox mediator to prevent over charging, and the solvent dimethoxyethane to help reversible formation and removal of crystalline LiOH during charge and discharge [102]. An energy efficiency of over 93% was claimed together with an energy capacity of 5760 Wh kg−1 (cf. discussion relevant to reaction (18) and equation (19)), while the number of charge–discharge cycles reached over 2000 at the rate of 1 A/g-carbon. On contrary to previous efforts that emphasise avoidance of moisture in experiments involving lithium metal, the formation and removal of LiOH was assisted by presence of moisture in the solvent.
Continuous innovation in electrolyte, such as solid lithium (or sodium) ion conducting membranes, task-specific ILs and organoaqueous solutions of low freezing temperatures, promises new EES devices and improved performances, as discussed above. In these cases, the challenges remain to increase the ion conductivity of the solid ion conducting membrane and ILs, and to increase the potential window of the organoaqueous solutions.
Undoubtedly, the use of nanostructured materials in EES devices has helped significant progresses in terms of storage capacity, power capability and cycling stability. A special credit goes to CNTs and graphenes which are perhaps the most studied nanomaterials for EES, either used alone or, more often, formed composites with redox active materials, such as ECPs and TMOs. In these composites, CNTs and graphenes play very similar electrical, chemical and mechanical roles, but they may differ significantly in terms of structural effects. When CNTs and their composites are made into an electrode, it is impossible to compact very much these nanofibrils, which is beneficial to formation of a porous electrode. This is clearly shown in Figure 9. In fact, in the author’s laboratory, CNT-PPy discs of a few millimetres in thickness have been successfully tested for capacitive charge storage.[103] For graphenes, these two dimensional nanosheets can pack into a dense structure via face-to-face stacking, which would not be helpful to ion conduction. This prediction has found evidence as shown in Figure 15 which is discussed in more detail below. (a) Schematic illustration of cutting rolled film of graphene oxide with 5 wt-% SWNTs as spacer into thin discs that can be thermally reduced and made into electrodes with vertically aligned reduced graphene oxide (VArGO). (b) CVs of VArGO (black line), rGOpowder (red line) and rGOfilm (reduced graphene oxide powder and film) in the 6 mol L−1 KOH solution. (c, d) Cartoons of interactions of ions with (c) horizontally stacked (rGOfilm) or (d) vertically aligned VArGO graphene layers on electrode. (e, f) SEM images of (e) rGOfilm and VArGO [104]. (Redrawn and reprinted with permission from American Chemical Society).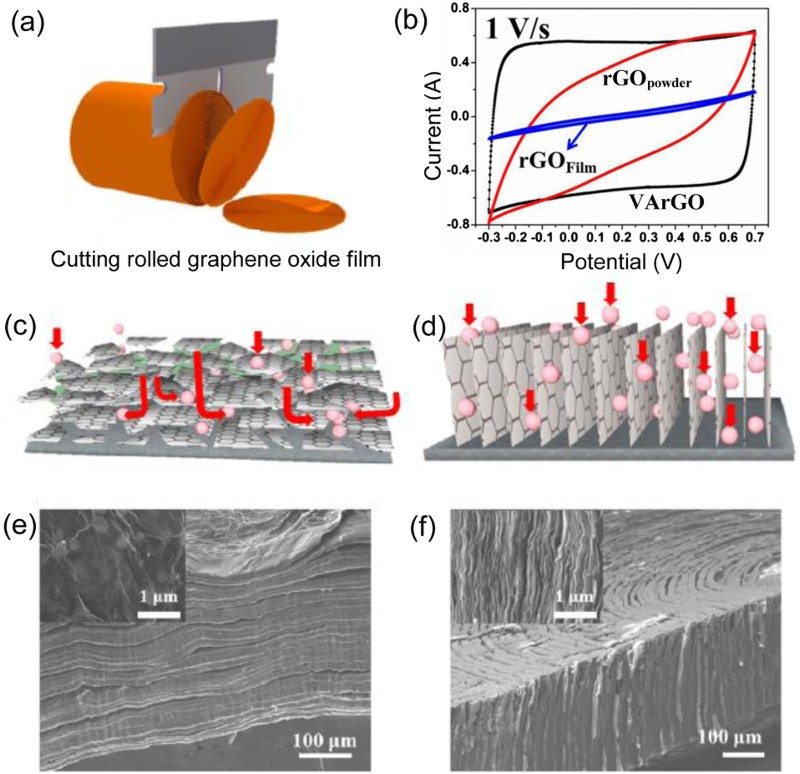
In response to the concern on the stacking of graphene sheets, an elegant design and successful experimental tests were reported recently in which films with graphene oxide sheets packed densely in parallel were obtained from drying concentrated suspensions [104]. Such obtained films were then rolled into cylinders as shown in Figure 15(a). The cylinder was then cut into thin discs at −40°C with a rotary cryomicrotome to avoid damage to the cross-section during cutting. The graphene oxide discs were then reduced at elevated temperatures up to 1000°C, which removed the oxygen atoms and left sufficient gaps between the parallel graphene sheets. After reduction, the graphene disc was attached to the surface of the electrode (current collector), creating vertically aligned graphenes on the electrode surface. Such an electrode structure is desirable for both electron and ion conduction. Consequently, rectangular CVs were recorded at high potential scan rates, up to 20 V s−1. In comparison, horizontally stacked graphene sheets suffered from much inferior electrochemical performances as shown in Figure 15(b). Such a huge difference can be attributed to, as predicted above, the vertically aligned graphenes being friendly to ion transport, in contrast to the horizontally stacked graphenes making it difficult for ion ingression. Figure 15(c) offers schematic illustration of this understanding which is further confirmed by the SEM images of the two electrodes with differently oriented graphene layers. It should be mentioned that in this work, 5% single walled CNTs were mixed with the graphene oxide to prevent unwanted close stacking between graphene sheets and also to help improve conductivity. There are nontheless technical questions, such as how practical this rolling and cutting method can be for commercial application.
Further, innovation in device design and engineering is another area for technology growth. It is in this line that supercapattery (or in other names) has been proposed and demonstrated in the past decade or so. The two examples mentioned above in combining the Li metal negatrode and a capacitor positrode into a supercapattery is promising in technical terms, but resources for Li are restricted. Alternatively, many nanostructured materials, such as the Ni(OH)2–graphene composite mentioned above, were incorrectly claimed to possess high specific capacitance. However, these new battery electrode materials indeed presented much improved charge transfer and transport kinetics and also cycling durability and stability. Combination of such a nanostructured battery type electrode with a capacitor electrode is another approach for supercapattery design, and the current literature offers many choices. For example, the design of a new supercapattery can be based on Figure 16(a) which shows the CV of a negatrode of chitosan derived nitrogen doped activated carbon (N-AC) [105] together with that of the Ni(OH)2-graphene positrode [42] in concentrated KOH electrolytes. The specific capacitance of N-AC was reported to be as high as 252 F/g in a potential range of 0 to −1.0 V, and the specific charge capacity of Ni(OH)2-graphene could be derived to be about 730 C/g. According to the same principle of equation (26), it can be derived that the positrode to negatrode mass ratio of the new supercapattery should be m
+/m− = C
sp−
*ΔE−
/Q
sp+ = 252*1.0/730 = 0.35. This mass ratio would enable the cell voltage to reach the sum (1.55 V) of the potential ranges of the two electrodes as shown in Figure 16(a). It has been discussed above that the strategy of unequalisation of electrode capacitances can significantly increase cell voltage and hence the energy capacity of supercapacitor and also supercapattery [38,85,86]. In Figure 16(a), the potential range of N-AC may still be extended negatively. If so, it is possible to reduce the mass loading of N-AC on the negatrode to increase the supercapattery voltage beyond 1.55 V. (a) CVs of the Ni(OH)2-graphene composite (black line) [34] and the chitosan derived nitrogen doped activated carbon [105] in concentrated aqueous KOH electrolyte (Redrawn from refs. 34 and 105). (b) Ways of pairing the same or different electrode materials into supercapacitor, battery, supercapattery or supercabattery [78].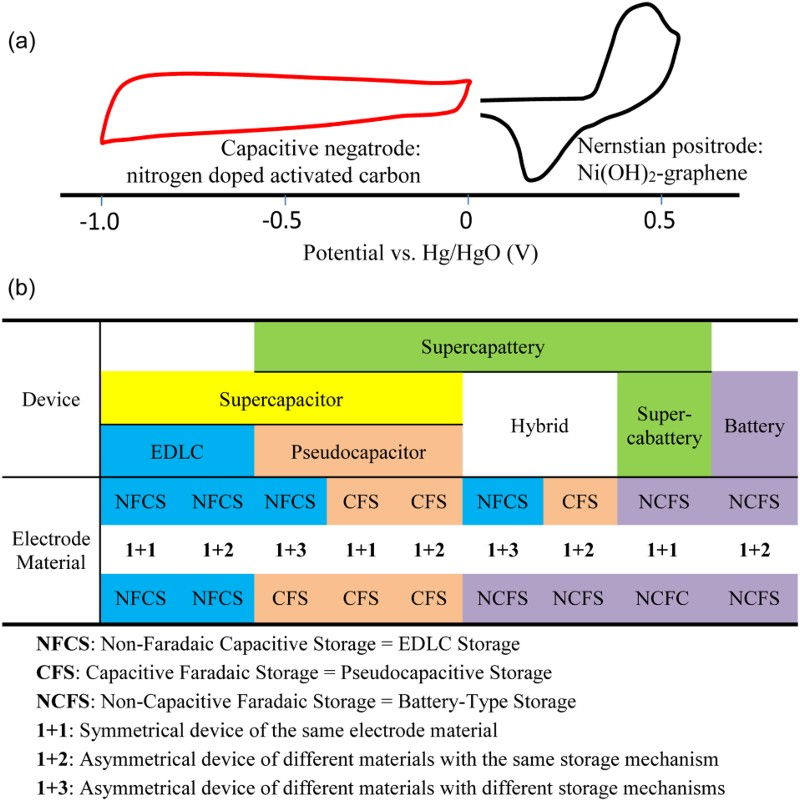
Obviously, there are many other choices from the current literature for selection of materials, pairing of electrodes and design of supercapattery, and the general strategy is summarised in Figure 16(b). In comparison with Figure 2(d), more options for construction of supercapattery are presented in Figure 16(b), including both asymmetrical and symmetrical designs. Of these, an interesting and rarely studied design is the symmetrical device with materials capable of non-capacitive Faradaic charge storage or simply Nernstian storage. Such a symmetrical device can be achievable and working if the electrode reaction is sufficiently reversible, unlike the example given in Figure 8. Because Nernstian storage occurs in a relatively narrow potential window, the symmetrical device with a Nernstian electrode material would also have a relatively small cell voltage. Alternatively, the symmetrical device may be built with a material capable of oxidative and reductive charge storage, respectively, at well separated positive and negative potentials. In this line, a recent study of the hierarchically nanostructured composite of NiO (micro-flower) and In2O3 (nano-rod) in the aqueous electrolyte of 3 mol L−1 KOH revealed very satisfactory charge storage capacity (213 mAh g−1 at 5 A/g), good rate capability (79 mAh g−1 at 30 A/g), and desirable cycle stability (21% capacity loss after 50 000 cycles at 10 A/g) [106].
An interesting result from this study is the construction of a symmetrical supercapattery using the NiO–In2O3 composite [106]. In a potential window of −0.2 to 0.6 V, the composite exhibited CVs, as shown in Figure 17(a) which was recorded in a three electrode cell, that are fairly comparable to that in Figure 8(a). It can be seen that the oxidation and reduction peaks are well separated, which is indicative of low reversibility and implies that the composite would not be suitable for construction of a symmetrical device. However, when assembled into a two electrode symmetrical cell, the cell voltage could be surprisingly scanned between 0 and 1.5 V and the CVs were of a very different shape as shown in Figure 17(b). The GCDs in the same voltage range in Figure 17(c) also suggest different electrode reactions from those shown in Figure 17(a). A further study of the NiO–In2O3 composite revealed interesting charge storage reactions at both the positive (0–0.6 V) and negative (0 to −1.3 V) potentials, see Figure 17(d). While this finding explains the differences between the CVs in Figure 17(a and b), the NiO–In2O3 composite represents a rare example of oxide based materials capable of charge storage at both and well separated positive and negative potentials. Similar properties have been long known for various polythiophenes which form symmetrical cells with the cell voltage exceeding 3 V in organic electrolytes. Unfortunately, these polymers alone are unstable in long term cycling [26]. Another point worth noting is that such symmetrical devices could be discharged to 0 V (cf. Figure 17(b and c)), which is a main feature of supercapacitor and supercapattery, but it is absent among conventional rechargeable batteries. CVs of (a) a single electrode and (b) a symmetrical cell of the NiO-In2O3 composite at the indicated scan rates. (c) GCDs of the symmetrical cell. (d) CVs of the negatrode (EN
) and positrode (EP
) in the symmetrical cell measured in different potential ranges with a reference electrode. Electrolyte: 3.0 mol L−1 KOH [106]. (Redrawn and reprinted with permission from the Royal Society of Chemistry).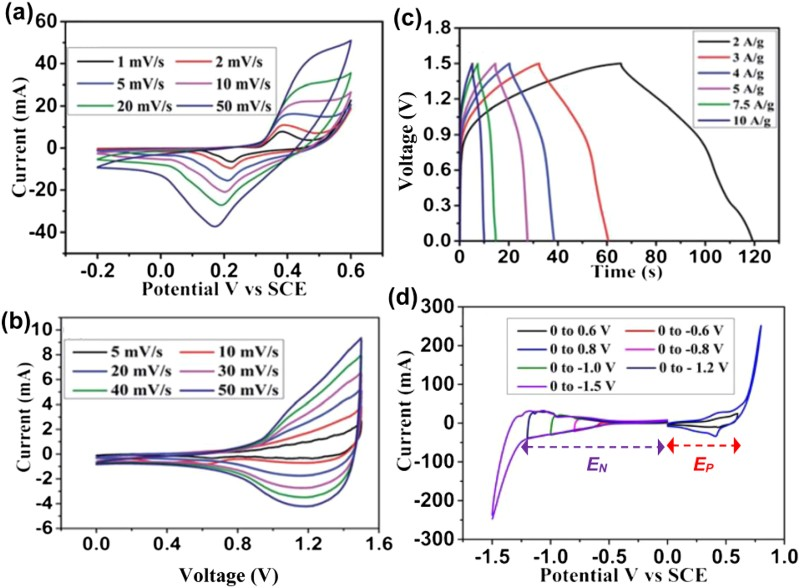
Another engineering approach is shown in Figure 18(a), illustrating the application of bipolar plates (current collectors) in assembly of two individual EES cells, particularly supercapacitors or supercapatteries, via internal serial connections [50,71]. An important component not shown in Figure 18(a) is the sealing ring between each pair of the bipolar current collector plates. In principle, multiple cells can also be serially stacked via the bipolar plates. While such a multiple cell stack is able to output a much higher voltage than a single cell, it is also a low cost way to increase the specific energy (or energy density) of the EES device. This can be explained as follow. To connect N cells in series, the number of current collectors is 2 × N for external connection, but it is N + 1 if the cells are connected internally via bipolar plates. Obviously, when N is sufficiently large (≥10), the weight of the N cells with bipolar connection will be significantly lower than that of externally connected N cells, leading to increased specific energy. (a) Expanded schematic illustration of a stack of two ‘CNT-PPy | electrolyte | activated carbon’ cells (supercapacitors or supercapatteries) internally connected by a bi-polar plate (current collector) which is part of the positive electrode of the cell on the right, and part of the negative electrode of the cell on the left. CNT-PPy: composite of CNTs and polypyrrole. (b) CVs at indicated scan rates and (c) GCDs at indicated currents, and (d) ac impedance spectrum recorded on a supercapacitor stack of 19 ‘CNT-PPy | KCl (aqueous) | activated carbon’ cells that were internally connected in series with 18 bipolar and 2 end titanium plates [71].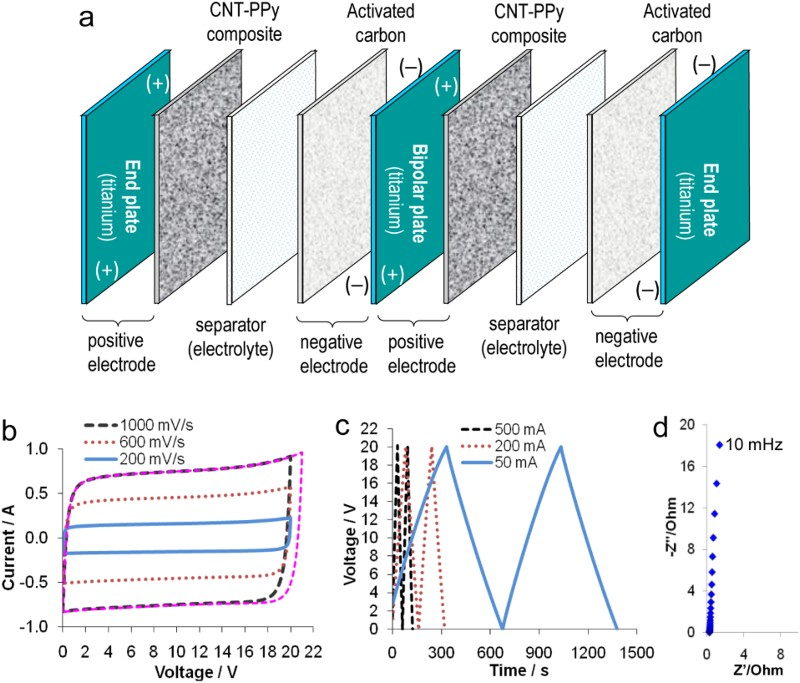
A concern on such a stack of multiple cells internally connected in series is that if one of the cells is malfunctioning, the whole stack may malfunction as well. This seems a valid concern, but it needs practical justification. On the contrary, in the author’s laboratory, measurements of a stack of 19 supercapacitor cells with internal bipolar connections revealed ideal capacitive CVs and GCDs as shown in Figure 18(b and c). Further, although this 19 cell stack was manually fabricated, its equivalent series resistance (ESR) is as low as 0.3 ohm, as determined by electrochemical impedance spectroscopy, see Figure 18(d). This corresponds to a maximum power [=U 2/(4 × ESR)] of 333 W, or 24 kW kg−1 against the total material mass on all electrodes. Obviously, these ideal capacitive performances manifest the absence of any malfunctioning cell in the stack. In commercial practice, because each component in the stack is simply planar in shape, as shown in Figure 18(a), good manufacturing reproducibility can be conveniently achieved in modern production lines.
Summary
This article has given a critical review of recent progresses in research and development of EES technologies, focusing on supercapacitor and supercapattery as a generic term for all designs combining the merits of rechargeable battery and supercapacitor. In addition to a brief introduction of the electrochemical basics for EES, common terminologies used in EES literature are explained to help clarify some confusion in relation with the use of cathode and anode in places of positive and negative electrodes, and to a minor degree, the use of catholyte and anolyte in places of electrolytes for the positive and negative electrodes, respectively. Four acronyms, namely, positrode (=positive electrode) and negatrode (=negative electrode), and posilyte (=electrolyte for positive electrode) and negalyte (=electrolyte for positive electrode) are proposed to promote proper and correct description of these components in EES devices. Different charge storage mechanisms are described and compared, aiming to account for the respective performance features of charge storage, particularly CVs and GCDs. These include electric double layer capacitance, pseudocapacitance (or capacitive Faradaic charge storage), and Nernstian charge storage (or non-capacitive Faradaic charge storage). In particular, the semiconductor band model has been applied to account for pseudocapacitance. Several examples are presented and discussed in relation with the synthesis, properties and charge storage performance of composites of CNTs and redox active materials, and design, fabrication and tests of devices for supercapattery. The advantages and challenges in using aqueous, organic, IL and solid ion conducting electrolytes are also analysed and compared. It is apparent that the solid ion conductors and ILs are promising for high voltage applications and hence suit supercapattery better, although their commercial use still needs further reduction in manufacturing cost. Last, but not the least, this article has provided an extended and more comprehensive definition of supercapattery.