
Abstract
Since the start of the ‘nuclear age’ graphite has been employed as a moderator in around 100 nuclear reactors, and today there are still some 30 graphite-moderated reactors operating and there are plans for new Generation IV high-temperature reactors. Many of the graphite moderator reactors now producing power are operating beyond their original design life. Therefore in some cases, to aid the reactor operators and designers, the existing graphite irradiation databases need to be extended either to a higher temperature or higher neutron fluence. Furthermore, data are needed for the different grades of graphite that are available at present. This can either be achieved by expensive, time consuming irradiation programmes or by improving the understanding of the mechanisms and processes which lead to irradiation-induced dimensional and property changes in the graphite core components. This review looks at three of the most important graphite properties which change with exposure to irradiation, namely dimensional change, irradiation creep and thermal expansion. The behaviour of UK AGR, Magnox and an experimental grade of German reactor graphite are explored in some detail. First graphite reactor core design is briefly discussed, giving examples of typical graphite components and core arrangements. Issues related to aging graphite component and core behaviour are illustrated through examples of component internal and thermal stress generation, and issues related to whole core behaviour are also outlined. Second the manufacture and microstructure of different nuclear graphite grades are discussed, highlighting how the choice of raw materials and manufacturing technique influences the graphite properties. Third the coefficient of thermal expansion, dimensional change and irradiation creep are analysed using microstructural and averaging methods which are used to relate crystal to bulk properties by accounting for graphite crystal orientation and porosity. These techniques, which were first applied to nuclear graphite in the 1960s, are extended and discussed with the aim of trying to lend some understanding to the role the microstructural crystallite and porosity distributions play in defining the dimensional stability and properties of virgin graphite, irradiated graphite and stressed graphite.
Introduction
The ‘Nuclear Age’ started with the use of graphite as a moderator to sustain a chain reaction in the Chicago Piles. 1 Since this world changing event, graphite has been used as a moderator in over 100 nuclear reactors, many of which are still operating and producing a significant amount of power in the UK (15 reactors, 2015) and Russia (11 reactors, 2015). In recent years, the Generation IV initiative has generated interest in the use of graphite as a moderator in the USA, Japan, China and Europe. Two types of graphite-moderated Generation IV reactors are under development. First there is the high-temperature, helium-cooled, graphite-moderated reactor that is capable of producing gas output temperatures of ∼1000°C. Second there is the molten salt reactor which has high thermodynamic efficiency, while operating at low pressure thus giving enhanced safety. These designs lead to the possibility of directly producing hydrogen fuel efficiently for a ‘carbon free’ future, and in the case of helium cooling, giving the possibility of generating electrical power via a gas-turbine. 2
Moderator elemental nuclear cross-sections 3
A suitable moderator requires a high neutron scattering cross-section and a very low neutron absorption cross-section. Thus for the first reactors, which used natural uranium metal as a fuel, the use of hydrogen (in the form of light water) with its excellent high scattering cross-section was not possible because it also has a relatively high absorption cross-section. Light water only became a viable moderator later when enriched fuel became available. Deuterium in the form of heavy water is an excellent moderator, but it is expensive to produce and was, at first, not available in large quantities. However, graphite, in its pure form, has a relatively high scattering cross-section and a low absorption cross-section, was readily available and relatively cheap. Graphite could also be machined into intricate shapes to provide channels for the fuel and the coolant, as illustrated in Fig. 1. Typical graphite moderator components. a Calder Hall, Magnox brick and tiles. In the Calder Hall and Chapelcross reactors graphite components similar to these formed a 24-sided polygon, 11-m diameter, 8-m high with a 0.75-m reflector. There were 1696 channels, 1140 tonnes of graphite, 14 044 graphite bricks and in total 58 140 graphite components. Typical power output was 270 MW thermal. Later, other physically larger Magnox reactors such as Wylfa produced up to 1875 MW thermal. b The core of an advanced gas-cooled reactor under construction showing the arrangement of graphite fuel channel bricks typically 460 mm across flats. The bore of each fuel channel is about 265-mm diameter and there are about 300 fuel channels. Square interstitial bricks are placed between the fuel channel bricks and form the control rod channels. Note that in this image, the interstitial bricks have yet to be inserted. A typical AGR core is about 9-m diameter by 8-m high surrounded by a 0.5-m thick reflector. Typical power output is 1500 MW thermal. c Lower core of the pebble-bed HTR-10 test reactor (Tsinghua, China) while under construction. The internal core diameter is about 1.8 m by about 1.9-m high. Some pebble fuel can be seen in the centre, the core will be eventually filled completely with around 27 000 fuel pebbles. The holes in the reflector surrounding the core provide channel for coolant gas, control rods and a boron ball secondary shut-down system. The power output is 10 MW thermal. d A prismatic block (left) for the high-temperature test reactor HTTR (JAEA, Japan). Each block is 360 mm across flats by 580-mm high. The many holes provide location and coolant channels for the graphite fuel elements (two are shown in place). The prismatic block on the right provides channels for control rods. These blocks are stacked into 30 columns making an active core 2.3-m diameter by 2.9-m high surrounded by removable and permanent reflectors. The power output is 30 MW thermal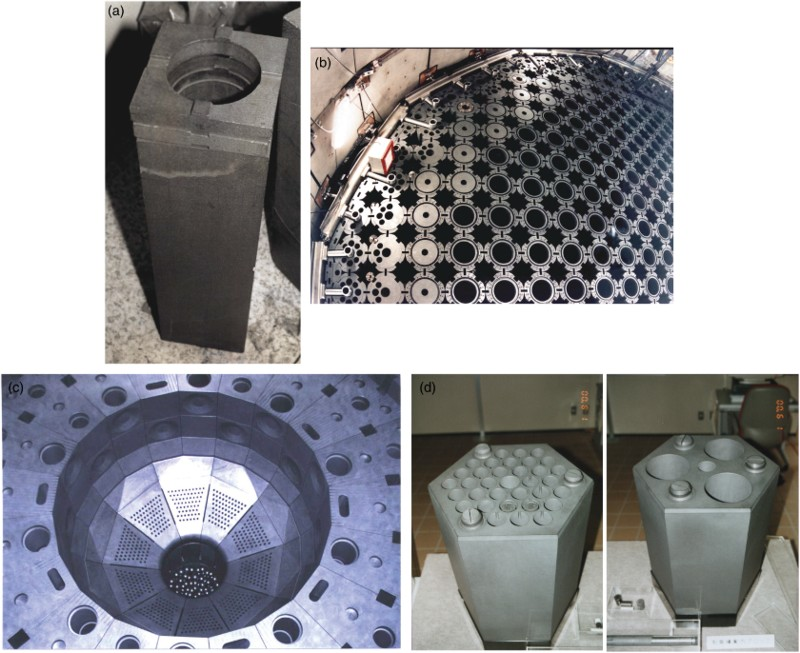
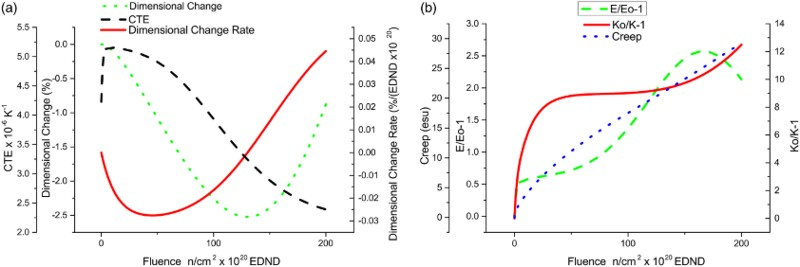
When graphite components are irradiated in a reactor, significant changes to their dimensions and properties occur, as illustrated in Fig. 2. The graphite dimensional and properties changes are a function of fast neutron irradiation, temperature and load and must be accounted for by the reactor designer and operator. The unit of irradiation exposure EDND used in Fig. 2 is particular to nuclear graphite technology. Equivalent DIDO Nickel Dose and Equivalent DIDO Nickel Flux (EDND and EDNF, respectively) are defined as the equivalent nickel activation at a standard position in the DIDO reactor at Harwell defined as follows: Typical dimensional and property changes in an isotropic graphite irradiated at ∼500°C
4
. a Dimensional change, dimensional change rate and coefficient of thermal expansion (CTE) as a function of fast neutron fluence. b Factorial change in Young's modulus (E/E
o − 1) and thermal conductivity (K
o/K − 1) and irradiation creep (elastic strain units or esu) as a function of fast neutron fluence
Thus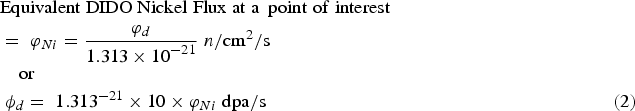
EDND is the time integral of EDNF
Other units of graphite damage fluence the reader may find in the literature are energies above 0.18 MeV; calder equivalent dose MWd/t.
Conversion of various graphite damage units into EDND 4
From Fig. 2 it can be seen that there are complex correlations between the dimensional and property changes, which are still not well understood. This review discusses the present state-of-the-art understanding of this behaviour in relation to three of the most important topics in nuclear graphite technology: the coefficient of thermal expansion (CTE), irradiation-induced dimensional change, and irradiation creep.
Before discussing these topics, it is necessary to give a review outlining the general effects of irradiation on graphite properties and stress development, followed by a description of the manufacture of and microstructure of nuclear graphite. The averaging methods used to relate crystal to bulk properties first applied to nuclear graphite in the 1960s are reviewed and extended; illustrating the need to account for porosity and orientation.
Empirical material test reactor data
Graphite reactor core design has to account for significant irradiation-induced dimensional changes and material properties changes. Most graphite core lifetime assessments are based on finite element analysis using empirical data obtained from material test reactor (MTR) programmes as illustrated later in this review using the case of AGR and Magnox reactor graphite grades as typical examples.
Linear (as opposed to volumetric) dimensional change data obtained on AGR Gilsocarbon graphite samples irradiated at various temperatures between 430°C and 1430°C are shown in Fig. 3. Within this temperature range, the higher the temperature the sooner ‘turnaround’ from shrinkage to swelling occurs. This behaviour is typical for most semi-isotropic, medium and fine-grained graphite grades, although the magnitude of the changes varies from grade to grade. Irradiation-induced dimensional changes in semi-isotropic Gilsocarbon irradiated at various temperatures
4
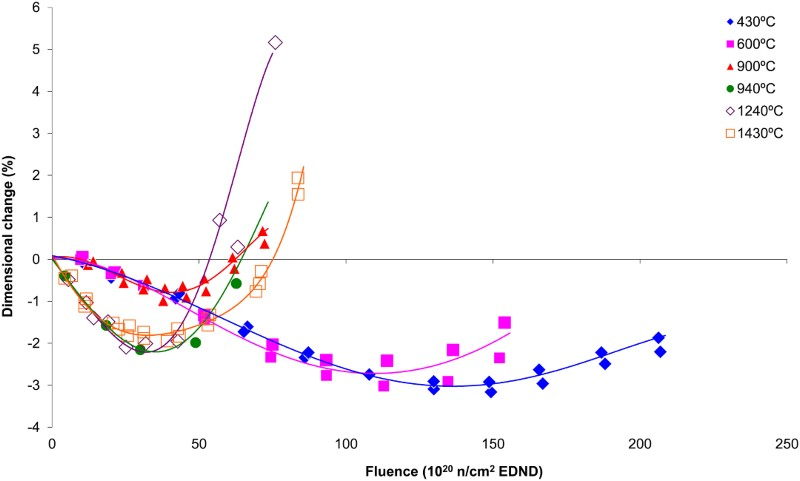
Dimensional changes at low temperature (below ∼650°C) in semi-isotropic graphite sometimes exhibit a low fluence delay in shrinkage and even some swelling. This is the case with Gilsocarbon and other nuclear graphite grades in which initially there is a small increase in volume between zero fluence and about ∼10 × 1020 n cm−2 EDND, 5 see Fig. 3. The reason for this initial delay/swelling is unclear, but it has been attributed to machining stresses. 6 However there are no microstructural observations or other evidence to validate this postulation and this behaviour does not appear to be prevalent in semi-isotropic graphite irradiated at higher temperatures.
Linear dimensional changes in Magnox Pile Grade A (PGA) graphite are shown in Fig. 4 at various temperatures between 150°C and 650°C. This graphite grade is highly anisotropic due to the method of manufacture and the raw materials used, as discussed later in this review. The data do not extend as far as turnaround in this case. Anisotropic graphite is not recommended for modern reactor design. However it is worth noting that the structural integrity of the graphite components used in the Magnox reactors was maintained for over 40 years in some cases. Irradiation-induced dimensional changes in anisotropic PGA irradiated at various temperatures.
4
a Perpendicular to extrusion. b Parallel to extrusion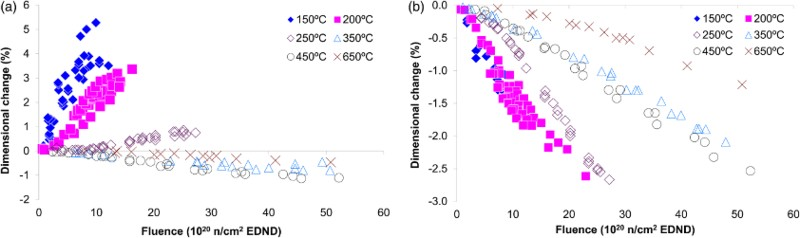
If graphite is irradiated under load the dimensional change data are modified. The difference between loaded and unloaded dimensional change is referred to as irradiation creep. The dimensional changes are increased under compression and reduced under tension. Unfortunately there are no irradiation creep data for Gilsocarbon or PGA graphite with fluence greater than ∼60 × 1020 n cm−2 EDND.
4
However, there are reasonable data for medium-grained graphite, namely ATR-2E. For ATR-2E graphite there are data in tension and compression up to ∼200 × 1020n cm−2 EDND, see Fig. 5
a and b. The creep strain is defined as the difference between the strain in the unloaded (control) specimen subtracted from the strain in the loaded specimen as shown in Fig. 5
c. With increasing fluence the creep strain increases fairly linearly at first, and then the rate reduces before finally increasing. If compressive creep is considered positive, the creep behaviour is similar in tension and compression, certainly within the data scatter. However, tensile and compressive behaviour appear to diverge at high fluence. The reason for including the ATR-2E data in this review is that it is later used to explore the creep behaviour in nuclear graphite. Irradiation creep in loaded and unloaded ATR-2E Graphite, irradiated at 550°C.
7
a Compression loading (5MPa). b Tension loading (5MPa). c Irradiation creep strain in ATR-2E graphite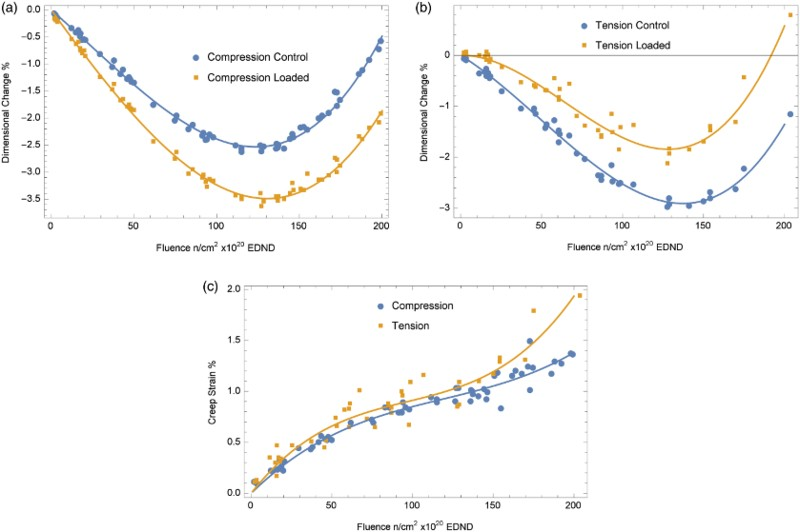
Irradiated Young's modulus and CTE property changes for both PGA and Gilsocarbon at various temperatures are given in Fig. 6 and it is clear from these figures that the behaviour is complex and differs between anisotropic and semi-isotropic grades. For example in the case of PGA, CTE keeps increasing with increasing fluence whereas the CTE of Gilsocarbon first increases then reduces. Coefficient of thermal expansion and fractional change in Young's modulus in PGA and Gilsocarbon graphites as a function of irradiation.
4
WG – With Grain, AG – Against Grain. a CTE PGA. b CTE Gilsocarbon. c Fractional change in Young's modulus PGA. d Fractional change in Young's modulus Gilsocarbon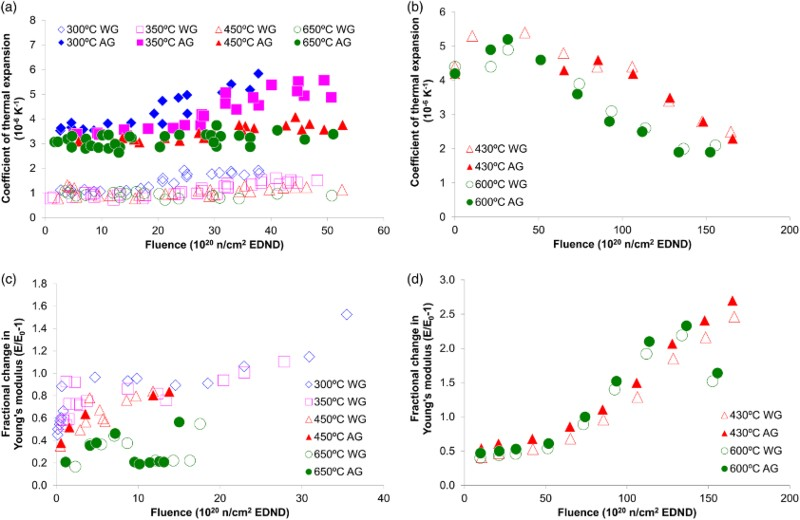
In the case of Young's modulus there is a significant initial increase in modulus, followed by a secondary increase with increasing fluence. If the graphite is irradiated through turnaround and past the initial volume, significant degradation occurs and the modulus starts to reduce. This behaviour is illustrated for Gilsocarbon irradiated at 600°C in Fig. 6 d.
Radiolytic oxidation
The topic of radiolytic oxidation is complex and a detailed discussion of the topic is beyond the scope of this particular review; however a brief expansion of the phenomenon is given here as weight loss is referred to in passing later in the text.
When graphite is irradiated in carbon dioxide, as is the case in AGR and Magnox reactors, ionising irradiation dissociates the gas into carbon monoxide and an oxidising species. 8 Within the graphite porous structure carbon atoms combine with the active species resulting in significant component weight loss; over 40% in some regions of a higher powered plant. Because the loss of carbon occurs within the graphite open porosity, visual inspection of a graphite component or sample alone will show no indication of the loss of mass.
Weight loss significantly reduces Young's modulus, strength and thermal conductivity; 4,9 in the case of Young's modulus by about 50% at 20% weight loss. To a lesser extent weight loss influences thermal expansion and dimensional change. Irradiation creep in graphite is modified through the change in modulus with weight loss. 10
Radiolytic oxidation is not an issue for Generation IV helium-cooled reactors systems such as high-temperature reactors (HTRs) or the molten salt graphite-moderated reactors.
Implication of dimensional and property change on graphite component life
As illustrated in Fig. 1 graphite-moderated nuclear reactors have many fuel and control rod channels. As the graphite structure provides channels for fuel, fuel-cooling and control rod entry, the structural integrity of the graphite components is important from safety and lifetime considerations. Throughout reactor life component stresses develop which have to be accounted for by the reactor designer and assessor. As an example, a typical analysis of an AGR graphite brick is presented below. This analysis has been carried out by the authors and is purely illustrative and should not be taken as representative of any particular reactor.
A peak rated AGR graphite fuel brick is considered in Fig. 7. Locally the high irradiation intensity of the fuel within the channel results in the neutron flux (and hence fluence) exposure to the graphite component being higher at the inside than at the outside, see Fig. 7. In addition there is a temperature difference between the inside and the outside of the brick. Finite element mesh of typical AGR graphite brick illustrating fluence and temperature gradients. a Typical fluence distribution. b Typical temperature distribution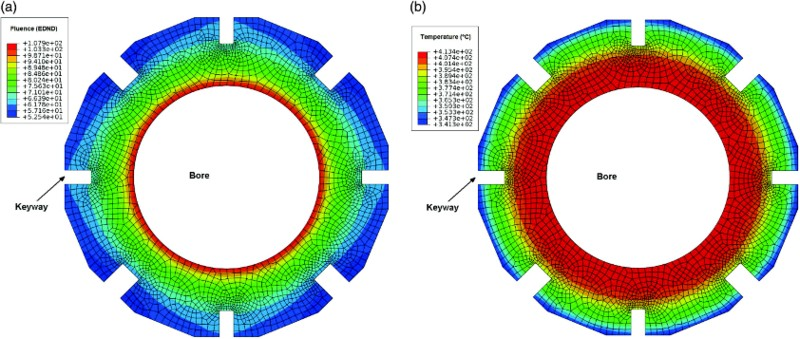
As the graphite component dimensional and property changes are a function of both irradiation fluence and temperature, the brick will at first shrink faster at bore than at the outside and there will be an accompanying variation in properties across the brick. The main properties of concern being Young's modulus, strength, CTE and irradiation creep. Over time graphite brick internal shrinkage and thermal stresses are generated; first tensile at the bore and compressive at the outside, and then reversing in sign towards the end of reactor life. Fortunately much of this stress is reduced by irradiation creep. In addition, the difference in CTE between the bore and the outside of the brick, coupled with the influence of irradiation creep, causes the stresses to significantly change when the reactor is shut-down and the graphite cools from operating to ambient temperature. This behaviour is illustrated by the finite element stress analysis results plotted against full power years (fpy) in Fig. 8; both bore and keyway-base stresses are presented at power and at 2 year shut-downs. The change in stress at shut-down is mainly due to the temperature difference across the brick at power. This temperature difference leads to the generation of thermal stresses which creep out during reactor operation. These stresses return in the opposite sense at shut-down leading to the spikes in stress as shown in Fig. 8. Also at shut-down there is a component of stress associated with the irradiation-induced change in CTE coupled with a change in CTE due to irradiation creep strain.
11
Normalised through-life stresses in a typical AGR graphite moderator brick. The change stress every 2 fpy is caused by thermal stress at shut-down, see text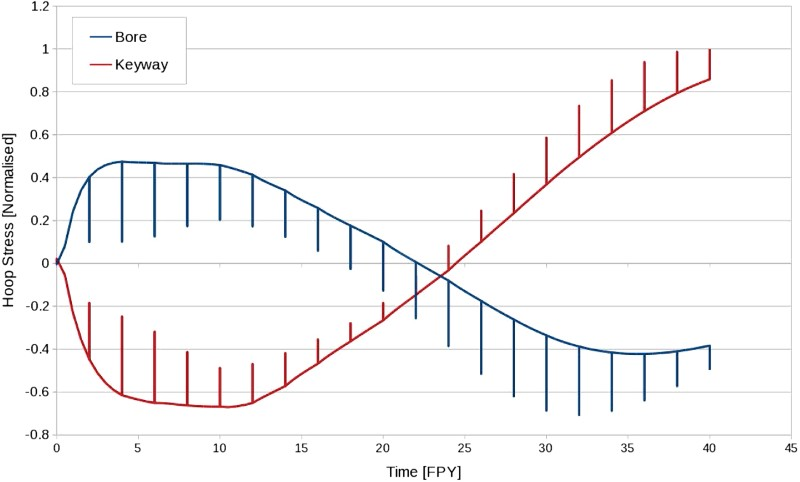
Although the design of the pebble and prismatic HTRs are somewhat different from an AGR or Magnox reactor, stresses will also be generated in their graphite components due to similar fluence and temperature gradients. It is therefore important that the reactor designer has the graphite data available for the particular design to assess the core safety and lifetime. For further detail on graphite component stress analysis detailed information is available in reference. 11
In addition to considering the generation of internal thermal and shrinkage stresses it can be seen from Fig. 3 that the dimensional changes are significant and ∼3% shrinkage can be achieved in parts of the core. As graphite-moderated cores are large in size and there is a neutron flux gradient across the diameter and along the height of the core, components will tend to bow at the core periphery. In the case of channel-type graphite reactors such as AGR, Magnox and RBMK reactors, the core rests on steel, or steel and concrete, structures and are restrained around the periphery by steel components so there will be differential movement at start-up and shut-down due to the difference in the CTE of steel compared to graphite; the expansion coefficient of steel could be about five times that of graphite. It is therefore important that the reactor designer accounts for component interactions during: normal operation, thermal transients and fault conditions (including seismic). This is achieved using large computer codes and various scale experimental models; readers interested in this aspect of graphite-moderated design can find more information in references. 12–14
Nuclear graphite manufacture and microstructure
In this section the microstructure of PGA and Gilsocarbon are discussed in some detail. In the case of ATR-2E some limited information on manufacture is given by Haag, 7 but unfortunately the authors are not aware of any microstructural images or detailed microstructural studies of ATR-2E graphite. This is unfortunate as the ATR-2E dataset is the only reasonable source of graphite irradiation creep data irradiated to a high fluence.
Graphite crystal structure
The most thermodynamically stable form of graphite is a structure in which the carbon atoms in the basal planes are bound by sp2 hybridisation in a planar network to three equidistant nearest neighbours, 120° apart in a given plane to form the hexagonal graphene structure. Strong in-plane covalent double bonds of both σ-type and π-type are present.
15
However, these sheets of tightly bonded hexagonal lattice sheets are only weakly bound together with van der Waals type bonds in an ABAB stacking sequence with an interlayer spacing of 3.35 Å, as shown in Fig. 9. The basal plane spacing between atoms is 1.415 Å, which gives unit cell dimensions for c and a of 6.7 Å and 2.5 Å, respectively. This configuration has a theoretical density of 2.266 g cm−3. Graphite crystal lattice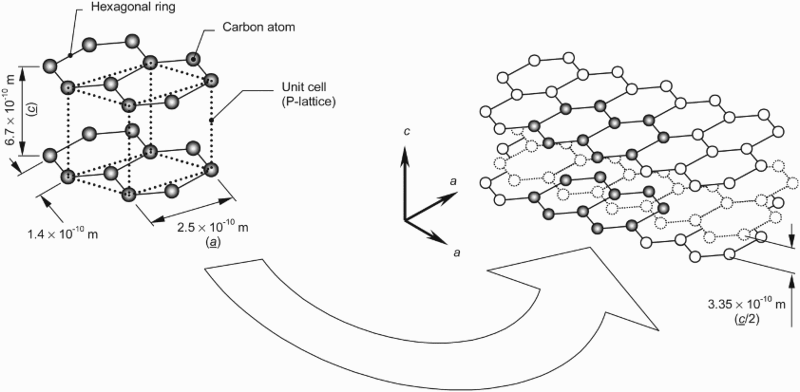
This lattice structure results in highly anisotropic crystal properties, for example the CTE in the range 20–120°C is ∼27.5 × 10⁻⁶ K−1 in the ‘c’-axis, but approximately −1.5 × 10⁻⁶ in the ‘a’-axis. 16 The elastic modulus parallel and perpendicular to the basal planes are C 11 = 106 × 1010 N m−2 and C 33 = 3.46 × 10¹⁰ N m−2, respectively, while C 12 = 18 × 1010 N m−2 and C 13 = 1.5 × 10¹⁰ N m−2, with a basal plane shear modulus of C 44 = 0.45 × 10¹⁰ N m−2. 16
These extreme property values parallel and perpendicular to the basal planes strongly influence the properties of artificially produced polycrystalline graphite as discussed below.
Artificial polycrystalline graphite
Artificially produced graphite is used in many industries, including the nuclear industry. Petroleum- or pitch-based filler coke is crushed, blended and then mixed with a binder and formed into blocks. The blocks are first baked and then finally graphitised. 16 In a nuclear reactor, the graphite properties are changed by fast neutron fluence, which modifies the graphite microstructure. In addition, graphite properties can be altered by loading due to the influence of microscopic strain. To understand the factors that define graphite properties and irradiation-induced changes, it is necessary to understand the microstructural changes that occur from the nano-metre through to the bulk scale.
The microstructure of the raw materials and manufacturing process determines: the crystal orientation, the porosity and the structural features which together determine the material properties of the final product. The main raw material used in graphite manufacture is filler coke, of which there are various types. Petroleum coke is a carbonaceous solid formed in oil refinery coker units or in other cracking processes, whereas pitch coke is produced from coal tar during coke production. 17,18 In the case of Gilsocarbon graphite a naturally occurring pitch was used. 18 The morphology of the filler coke particles arises during the refining process; it is determined by the mixing and flow as the liquid passes through an intermediate liquid crystal phase (mesophase), during which spherules and other shapes form at the nano to bulk scales. These spherules harden, establishing the principal features of a lamella-form graphitisable coke morphology containing many fissures, cracks and folds. 19,20 It is the selection, by the graphite manufacturer, of the particular structure of the filler coke to be used, that is the main contribution to the properties of the final graphite product.
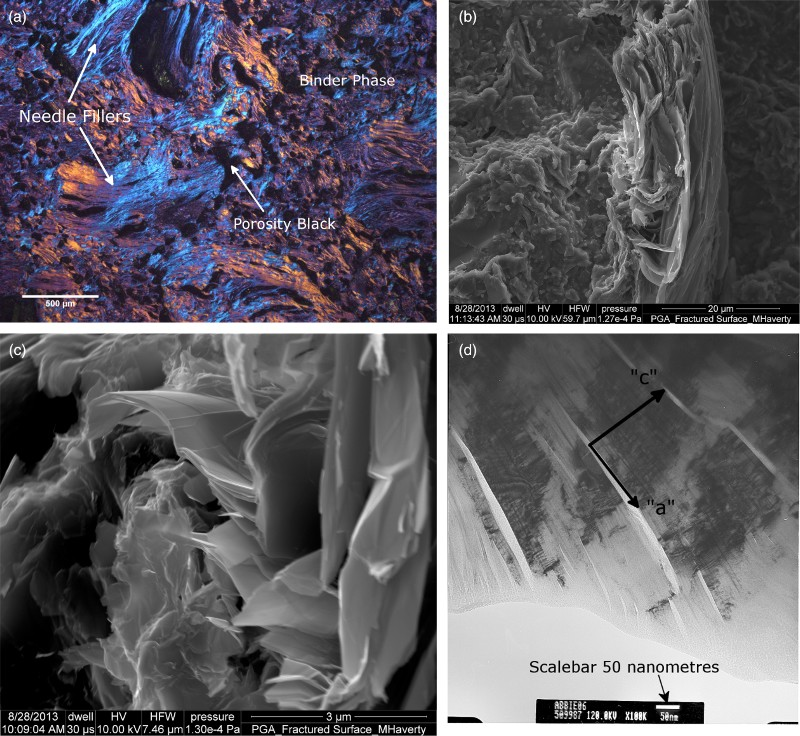
Two very different examples of coke are the needle-shaped particles and the spherical particles used for the production of two nuclear graphite grades, PGA and Gilsocarbon. Each raw coke particle contains many lenticular cracks running parallel to the basal planes as illustrated in Figs. 10 and 11. The Mrozowski cracks
21
which are a few 10s of nano-metres in width by several micro-metres in length, illustrated in Figs. 10
d and 11
d, are formed during manufacture on cooling from graphitisation (∼2800°C) temperature due to the large difference in the CTE between the crystallite c-axis and a-axis; in the final product these nano-metre wide cracks provide accommodation for thermal expansion and irradiation-induced crystallite dimensional changes. Optical, SEM and TEM images of unirradiated nuclear graphite (Gilsocarbon) microstructure. a Polarised optical image of Gilsocarbon showing the general orientation of the crystallite. Note the lenticular porosity in the filler and globular porosity in the binder (porosity is shown as black). The general radial orientation of the crystallite ‘c’-axis within in the filler particle is radially outwards from the centre. b SEM image of a fissure in a Gilsocarbon filler particle showing that although the general direction of the crystallites is radial, in the finer structure the geometry is more complex and is made up of many folded graphite plate structures. c SEM image of Gilsocarbon at a larger scale showing the many thousands of folded graphitic sheets. d TEM image of Mrozowski cracks in Gilsocarbon, parallel to the basal planes (inside the individual folded graphitic sheets, nano-metres in width and micro-metres in length, and providing accommodation porosity) Optical, SEM and TEM images of unirradiated nuclear graphite (PGA) microstructure. a Polarised optical image of PGA showing needle-like filler particles. b SEM image of PGA filler particle. c SEM image looking ‘end-on’ at needle coke, clearly showing the Mrozowski cracks between the graphitic sheets. d TEM image of Mrozowski cracks in PGA which provide accommodation porosity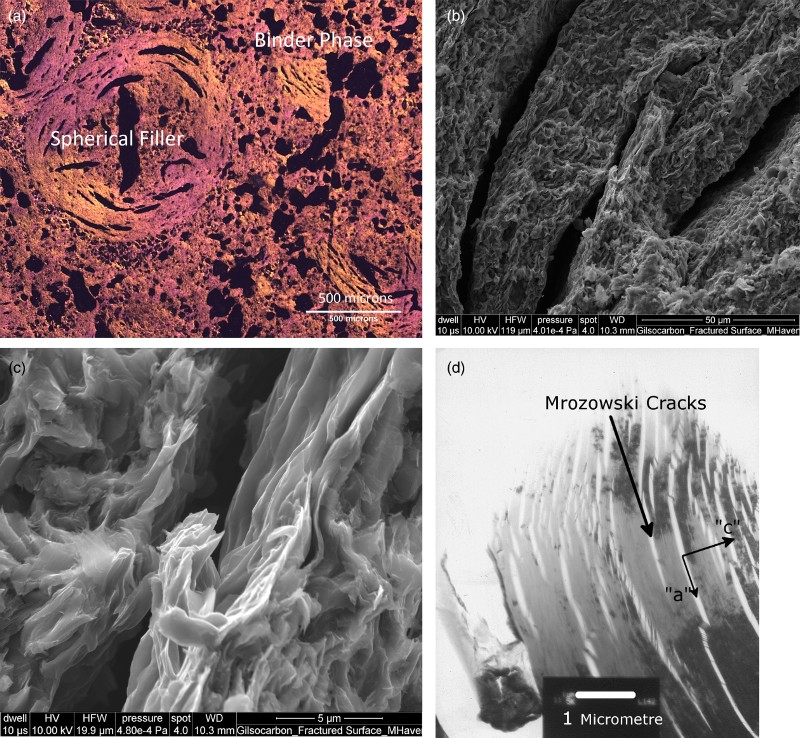
Coke supplies can vary over time as the original source maybe discontinued, for example the cokes used to produce Gilsocarbon and PGA are no longer available. Changes in coke supply can significantly change both the virgin and irradiated graphite properties. Thus, when new grades of nuclear graphite are put forward a new irradiation programme will be necessary. However, the size, scope and cost of such a programme can be significantly reduced through understanding the relationships between the graphite microstructure and properties.
During manufacture, the coke is crushed and graded into the required particle size, hot-mixed with a pitch-binder, and formed into billets known as the ‘green-article’. As the pitch-binder is mixed and cooled, it also passes through a mesophase forming graphitisable structures, binding the filler coke particles together. Gas evolved during a subsequent baking stage (∼800°C) leads to the generation of further porosity within the binder phase. To improve the final properties, there may be subsequent impregnations under vacuum using a lighter liquid pitch followed by re-baking. The final step is graphitisation, which is conducted at around 2800°C. 17
The resulting product is a porous polycrystalline artefact. 4 The microstructure of the filler coke and the method used for forming the blocks largely determines the thermo-mechanical properties of the final product, such as Young's modulus, strength, thermal conductivity, and CTE. Producing the blocks by extrusion can result in a highly anisotropic (orthotropic) product, whereas with the appropriate choice of filler coke along with forming techniques such as pressing (vibration moulding) can result in a semi-isotropic graphitic product 22 as is the case of vibration-moulded Gilsocarbon graphite. As illustrated in the high-resolution micrographs in Figs. 10 and 11, both the binder and filler phases in the resultant polycrystalline product consist of crystallite structures containing many lenticular Mrozowski cracks a few nano-metres wide and micro-metres in length. 21
The polarised optical image in Fig. 10 a clearly shows the well-defined crystal orientation of a filler particle in Gilsocarbon as opposed to the more chaotic distribution in the binder. In addition, the lenticular cracks within the filler and the more globular porosity in the binder are also clearly shown. The optical polarised and SEM images shown in Fig. 11 a, b and c illustrate the typical needle coke filler particles found in PGA. The difference in nature of the needle coke particle when viewed longitudinally compared to the view ‘end-on’ is clearly shown, as is the porosity within the folds given in Fig. 11 b and c. Longitudinally, the needle filler particle microstructure is relatively stiff due to the covalent bonding, giving strength to the relatively flat basal planes. Transversely, the folded porous structure can be more easily elastically deformed on loading. At the nano-scale the Mrozowski cracks are shown in Figs. 10 d and Figs 11 d; these cracks offer space to accommodate either thermal or irradiation-induced crystallite growth (or both).
It is the summation of the thermally driven crystallite expansion (or irradiation-induced dimensional change, swelling and/or shrinkage) of the folded graphitic structure that governs the bulk thermal expansion and dimensional change observed in a graphite component. However, it is clear there is considerable scope for the c-axis expansion to be accommodated by Mrozowski cracks and larger lenticular cracks between the folded graphitic sheets. 23 In addition, there is the possibility of shear between graphitic sheet structures as well as ‘kinking’ and ‘twinning’ of the structures themselves, as observed by other authors. 24 Compacting or stretching areas of the microstructure may also influence the contribution of the a-axis thermal or irradiation shrinkage on the bulk behaviour. It is also the case that due to the complexity of the microstructure, tensile loading will lead to both tensile and compressive forces in the graphitic sheet-like structures, depending on their orientation and connectivity with the surrounding microstructure. Similarly, both tensile and compressive crystallite forces will also result from compressive loading. These forces will have the potential of opening and closing Mrozowski cracks and reorienting the graphite crystallite structures.
During manufacture, the method used to form the graphite billets leads to a bias in the alignment of the filler particles. 22 With Grain (WG) is used to define the direction in the billet in which the direction of most of the crystals ‘a’-axes are aligned and Against Grain (AG) is the direction in the billet in which most of the crystallite ‘c’-axes are aligned. This bias defines the bulk material anisotropy in graphite components. For example in the case of the UK graphite grades, forming billets of PGA by extrusion lead to a highly anisotropic graphite, as the needle-shaped grains tend to be align in the direction of extrusion, i.e. the extrusion direction is WG. In case of Gilsocarbon, forming the blocks using pressing (vibration moulding) tended to align the ‘c’ crystal axes at 90° to the pressing direction which is 90° to the brick axis. However this bias (and hence anisotropy) is much less pronounced in Gilsocarbon than in PGA.
It is clear from the images in Figs. 10 and 11 that the lenticular features within the folded graphitic sheet structures are reflected through to the larger scales within filler structures, while the binder phase contains many globular gas-evolution pores. The two types of porosity constitute about 20% of the bulk volume in typical polycrystalline graphite; porosity which is accessible to the atmosphere is defined as ‘open’, that which is not, ‘closed’. 9 Thus, typical polycrystalline graphite can be considered to be a porous polycrystalline material with crystallites at many orientations biased by the filler coke structure and the method used to form the graphite billet during manufacture, bound together by a more randomly orientated binder phase. There will be a considerable amount of porosity, particularly the smaller lenticular (Mrozowski) porosity lying parallel to the crystallite c-axis, together with other porosity having no particular orientation relative to the crystallite or fabrication process.
The final product grain size is defined in ASTM D7219 and C709-9
25,26
as: coarse grained — containing grains in the starting mix that are substantially greater than 4 mm in size. fine grained — containing grains in the starting mix that are generally less than 100 μm in size. medium grained, — containing grains in the starting mix that are generally less than 4 mm in size.
Nuclear graphite generally falls into one of the latter two definitions.
Also defined by the same two standards 25,26 is the isotropic ratio, which the ratio of a given property value in the against-grain direction to its corresponding value in the with-grain direction. Isotropic nuclear graphite is graphite in which the isotropy ratio based on the CTE measured over the range (25–500°C) is 1.00–1.10. Near-isotropic nuclear graphite is graphite in which the isotropy based on the CTE measured over the range (25–500°C) is 1.10–1.15.
Modern nuclear graphite strives to meet the first definition of isotropy ratio. Some of the earlier graphite grades such as PGA are anisotropic in nature with high isotropic ratios.
Averaging methods
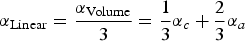
If the effect of porosity is ignored, the linear CTE of orthotropic polycrystalline material with a hexagonal crystal structure (such as graphite or zirconium), can be described by:
29
Both αc
and αa
vary with temperature as shown in the experimental data given in Fig. 12. Temperature dependence of graphite crystal coefficient of thermal expansion. Modified from data given by Kelly
16
. a ‘a’-direction. b ‘c’-direction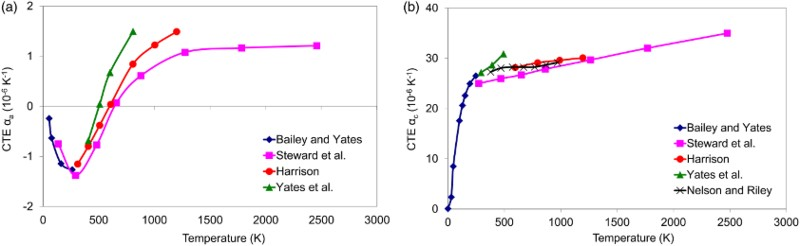
Thus if the crystallites were randomly orientated and there were no porosity a graphite would be expected to have a CTE of ∼8 × 10⁻⁶ K−1 at ambient temperature. However, most artificial polycrystalline graphite is orthotropic with a lower bulk CTE, ∼1 × 10⁻⁶ K−1 to ∼4 × 10⁻⁶ K−1 at room temperature. 22 The reason for this is that in general, the crystallites are not randomly orientated and much of the lenticular porosity can absorb the large crystal c-axis expansion. A more useful relationship which accounts for orientation can be derived (Nye, 30 Tempest 29 ).
For an individual hexagonal crystal the magnitude of a property M in direction x at angle φ with respect to the (0002) basal plane can be defined by:
where Ma and Mc are the single crystal properties in the crystal a- and c-directions, respectively.
Assuming that the crystallite contribute to a bulk property of the polycrystalline structure can be defined in proportion to their volume fraction, Vi
, then for crystals oriented with their [0002] pole c-axis at angle φ
i
to the reference direction, their contribution to the bulk property can be written as:
where Vi is the volume fraction of M in the ith direction
Summing over the total volume: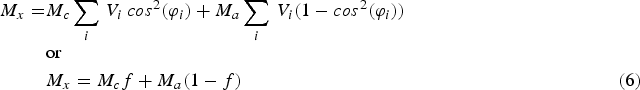
where f is a temperature, strain and irradiation-dependent function, which defines the crystal orientation distribution of the crystallite and the probability of the individual crystal properties in either the a- or c-direction, contributing to the overall bulk property.
In the case of graphite it is therefore assumed that all parts of the structure contribute equally. That is, the binder phase (which we have called randomly oriented) contributes equally as much as the filler. A corollary to this is that if the binder is truly random, it will not contribute to the texture but just give background intensity.
The summation above assumes all the properties can be added in series (constant stress) and is often referred to as the Reuss approximation. 31 Other authors 32 have investigated summing the properties in parallel (constant strain) and in a combination of both parallel and series 32 often referred to as the Voigt approximation. 33
This leads to the following ‘plane strain’ expression (i.e. the contribution of the crystallites summed in parallel) for bulk CTE: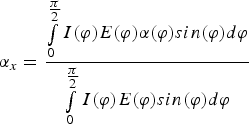
Thus, in applying ‘plane strain’ it is necessary to relate crystallite modulus to bulk, macroscopic properties. This poses a difficulty as Young's modulus is not only a function of the magnitude and orientation of the crystal direction and shear moduli but also the associated crystal accommodation porosity. 34 Bulk graphite modulus is also strongly related to the larger and more globular porosity. 35 In addition, if the theoretical values for the crystal moduli are used, unrealistically high values for bulk modulus are obtained. 35 This probably indicates that equation (6) is sensitive to reduction in moduli due to crystallite imperfections or perhaps deformation of the slender crystallite structures interspersed with Mrozowski cracks. Slagle however, presented calculated plane strain and plane stress values of bulk CTE and modulus and compared them to experimental data. 32 He also presented a hybrid model that combined plane strain assumptions and plane stress assumptions with reasonable success, but the exact detail of these calculations were not made clear enough in his review to repeat them here.
It was suggested by Hill 36 that the approach proposed by Voigt 37 and Reuss 31 should be further averaged to give a better estimate of the mean value of the property. In recent years the effect of texture or crystallographic orientation may be considered using Orientation Distribution Functions (ODFs). 38 ODFs are functions which describe the texture of a sample; it is a measure of the volume fraction of crystallites having a particular orientation. 39 Voigt, Reuss and Hill methods are available in open source software used to estimate properties from diffraction texture measurements 40 but it should be noted that these techniques do not account for inter-crystalline porosity, such as that in nuclear graphite. Recently other authors 41,42 investigated the elastic properties of graphite under hydrostatic pressure and presented a self-consistent method based on averaging methods with some success. Similar methods have been applied to the analysis of the effect of porosity on the modulus, strength and thermal conductivity at The University of Manchester 34,35,43–45 and at present these techniques are being further investigated by one of the authors of this review (Haverty). Certainly care must be taken when applying these averaging techniques to modulus. However, in this review the methodologies based on the proposal by Bacon 46 are applied to the analysis of CTE and dimensional change behaviour as discussed below.
The relationship given in equation (6) has been shown to work very well for zirconium, a hexagonally closed packed metal which normally exhibits strong texture. Kearns 47 showed that for Zircaloy-2 and Zircaloy-4 there is a linear relationship between CTE and f. However due to the porosity and complex microstructure of graphite, application of this relationship is not straightforward, as discussed below. In addition, the validity of equation (6) relies on Mc and Ma being able to act independently. Considering the folded plate structures interspersed with Mrozowski cracks shown in Figs. 10 a, b, and Fig. 11 a and b, it can be seen that connectivity is mainly along the a-axis while there is little connectivity along the crystal c-axis. Thus this gives significant scope for independence of Mc and Ma particularly at low crystal strains at which crystallite deformation can be accommodated.
Several authors have defined the CTE in polycrystalline graphite using various averaging techniques based on the above relationships through a variety of ‘porosity and structure factors’ mostly stemming from the work of Bacon: 46 Sutton and Howard 48 took account of porosity in defining relationships for CTE in PGA, Slagle 32 developed constant stress and constant strain models for Young's modulus and CTE, Morgan 49 proposed a two-phase model, Simmons 50 developed models derived from first principals for CTE and dimensional changes, and Bokros et al. 51,52 developed models for CTE and dimensional change for HTR application. Averaging techniques have also been used to devise methodologies which are used to predict the change in CTE as a function of temperature. 53,54
It has also been observed that under load the CTE of graphite changes significantly, from ∼4 × 10⁻⁶ K−1 to ∼8 × 10⁻⁶ K−1 in Gilsocarbon graphite; 55–57 increasing with compressive loading and decreasing with tensile loading. In addition, changes to CTE of the same order also take place when graphite is irradiated under load. 58
Fast neutron damage significantly changes the CTE, and in semi-isotropic graphite such as Gilsocarbon, with increased fluence the CTE first rapidly increases, 59,60 remains constant for a short period and then decreases. The behaviour is more complex in highly orthotropic graphite, such as PGA 4 where with increasing irradiation the CTE increases, plateaus and then increases again.
This review revisits one of the main averaging methods often referred to in the literature, highlights some deficiencies, proposes a new variation to the relationship and then explores the influence this has on CTE versus temperature methodologies and the change in CTE with load. The methodology is then successfully applied to irradiation-induced dimensional change and irradiation creep in graphite.
The graphite grades investigated are two UK nuclear grades, PGA and Gilsocarbon, which are used as moderators in the Magnox reactors and the Advanced Gas-cooled Reactors, respectively. However, due to the lack of high fluence UK data for irradiation creep, German ATR-2E graphite is examined.
Averaging porosity and orientation relationships
One of the most important texts on this subject is considered to be that of Sutton and Howard 48 who used graphite orientation factors as defined by Bacon 46 to predict CTE in extruded anisotropic PGA graphite (both WG and AG).
The methodology proposed by Bacon 46 determines the intensity of the crystal [0002] poles in a graphite sample using XRD. This was done using transmission XRD, although modern equipment is mostly based on reflective XRD; the main difference is that the former technique samples a volume of material whereas the latter is a surface sampling technique. Also, the analysis of XRD data for this purpose has become easier via the use of pole figure techniques. 61
To help the reader understand the basis of the Bacon 46 techniques used by Sutton and Howard 48 the experimental technique is briefly outlined below. However the reader is encouraged to refer to a recent paper by Campbell 62 which describes the experimental technique and method of analysis in detail.
A thin specimen is mounted with its extrusion (WG) axis positioned as shown in Fig. 13
a, which sets the preferred (0001) plane as a sample reference with direction as indicated by [0002] in the diagram. The incident x-ray beam enters the rectangular specimen from the right. The Bragg diffraction ring pattern giving the [0002] pole intensity is shown on the left of the figure suspended by the Bragg angle Experimental setup and typical output used to determine the Bacon Anisotropy Factor (BAF) in graphite. a Transmission XRD experimental set up due to Campbell.
62
b Typical [0002] pole intensity data for PGA graphite, 0–90o shown as a function of dispersion angle 


Using pole intensity data such as that shown in Fig. 13
b, Sutton and Howard
48
defined the relationship between bulk CTE and crystal CTE using the following relationship: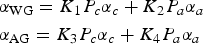
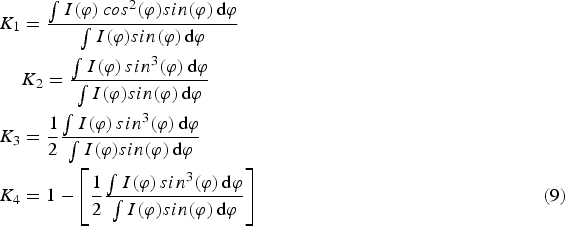
The BAF is defined as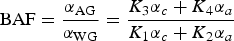
Examination of equation (10) shows that due to the crystallite CTE temperature dependence, BAF must also be temperature dependent varying from ∼2.2 at 100°C to ∼1.9 at 600°C. However BAF is usually quoted at ∼400°C where αa
= 0
16
thus: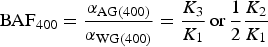
Sutton and Howard 48 introduced the factors Pc and Pa to account for accommodation porosity aligned with the crystal c- and a-directions. A value of unity implies zero porosity, and a positive value allows crystal growth due to an increase in temperature to be accommodated by Mrozowski cracks 21 in the c-axis direction. Presumably a negative value allows for crystallites to shrink as at low temperatures (below 400°C), the CTE in the a-axis is negative.
The Bacon
46
relationships were also simplified by Sutton and Howard
48
using a single orientation factor ‘x’ as: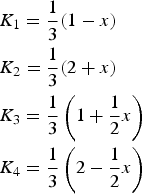
Hence the BAF at 400°C is given by: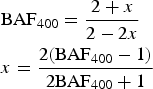
However, unlike the BAF, the orientation factor, ‘x’ is invariant with temperature, thus is a more useful measure of anisotropy.
Therefore solution of equation (8) becomes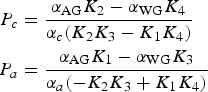
Sutton and Howard
48
also noted that as αa
is zero at approximately 400°C, both x and Pc
could be calculated at this temperature as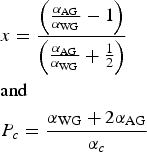
Sutton and Howard 48 measured αWG and αAG as a function of temperature on two samples of PGA and used values for graphite crystal CTE α c and αa due to Nelson and Riley 63 to calculate Pc and Pa by solving equation (8), as given in Table 3.
The present authors used the orientation function given in Fig. 2 of reference
48
along with equation (12) to recalculate K
1, K
2, K
3 and K
4 as 0.206, 0.794, 0.397 and 0.603, respectively, which are identical to those in previous reference;
48
these values lead to a BAF
400 = 1.92. Solving equation (8) at different temperatures results in the accommodation factors Pa
and Pc
, see Table 5 and Fig. 14. Accommodation factors; original Sutton and Howard and revisited calculation. Note that the original and new Pc
values overlap each other. The ‘new’ data refers to the revised approach as discussed later in this paper *Denotes calculated values that approach infinity.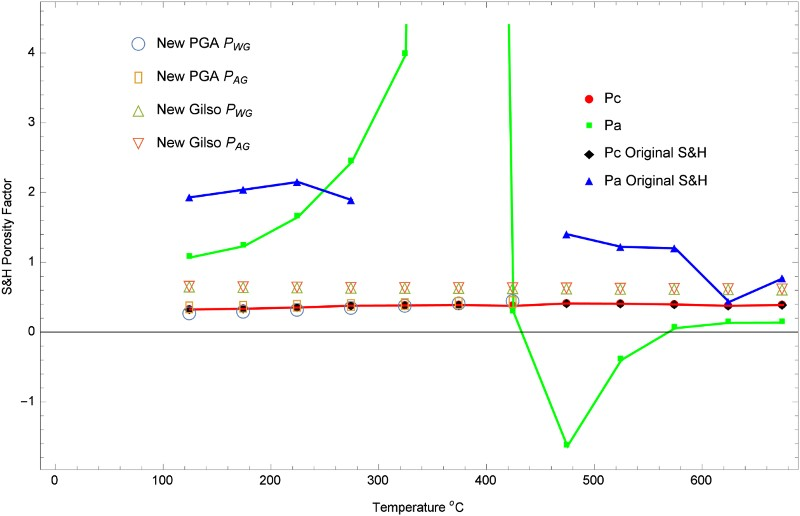
Re-calculation of porosity factors from reference
48
The reason for the discrepancy in results is due to a singularity in equation (8) at ∼400°C as αa approaches zero, see Fig. 12. Sutton and Howard 48 make no reference to the singularity in their paper, other than not giving values of Pa near to 400°C. It is also unclear why their other values of Pa do not tie in with those calculated by the author. Clearly a discussion on this difficulty in solving their equations is an important omission from their paper.
From the low value of Pc
it is clear that the porosity between the microstructural folded graphitic plate structures significantly reduces the influence of the relatively large crystal c-axis expansion, whereas the solution for the porosity in the a-direction is clearly unsatisfactory. An alternative approach proposed by Reynolds
64
and applied by Price and Brokos
52
is to only apply a porosity factor in the c-direction. The justification for this given by Price and Brokos
52
is that the contribution to the bulk CTE from the crystal a-direction is small compared to that from the crystal c-direction. However, the present authors have taken an alternative approach by associating the porosity factor ‘P’ with the crystal c-axis and ‘1-P’ with the crystal a-axis. It can be argued that the assumption of linking the contributions cannot be strictly justified, but it is later shown that the application of this method results in linear small variations of P with temperature and loading which are similar in trend for Gilsocarbon and PGA, graphite grades with very different microstructures. Another advantage of this approach is that a well-behaved set of equations are derived that can be solved for both P and also for x if it is unknown. Thus equation (8) becomes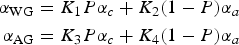
It should be noted that P does not represent the total graphite porosity as measured by helium pycnometry or some similar method, but is the combined accommodation and microstructural requirements to account for crystallite thermal growth and shrinkage in the bulk graphite, and hence the probability that the c-axis CTE contributes to the bulk CTE. It is also important to note that some porosity, particularly the globular porosity in the binder, will not play a part in the relationship given in equation (16).
Solving equation (16) gives two possibilities for P dependent on grain direction: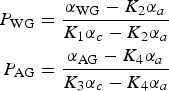
and thus, the problem of the singularity has been removed.
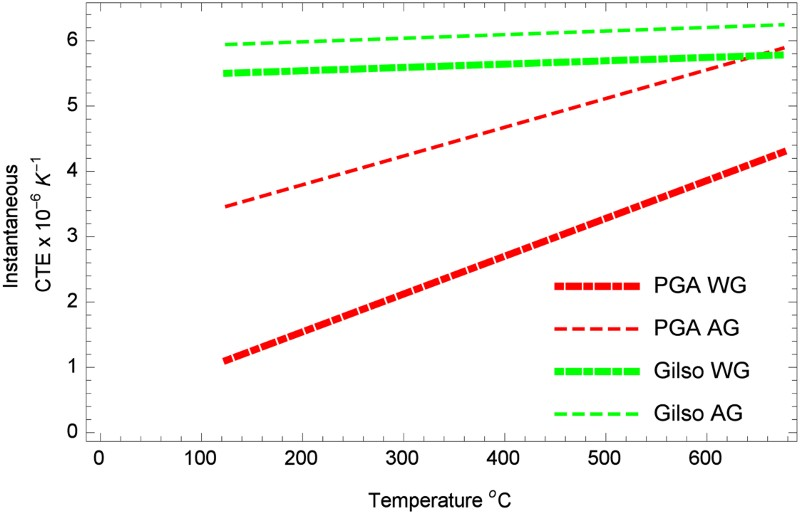
To investigate the relationship given in equation (16) the instantaneous CTE of both PGA and Gilsocarbon were measured using a Netzsch Dilatometer DIL 402C, following the procedure suggested by British Standard BS EN-821-1.
65
Mean curves were obtained from twelve measurements taken from four Gilsocarbon samples and twenty PGA samples, as shown in Fig. 15. The reference standard used was well-characterised Al2O3, supplied by the dilatometer manufacturer. The criterion for acceptance of the results was that the standard deviation of the run was less than the accuracy of the technique: 0.1 × 10⁻⁶ K−1. The instantaneous CTE was used to solve the equations for PWG
and PAG
, see Fig. 14. Values of ‘x’ for Gilsocarbon and PGA were calculated from pole figure data obtained using reflective XRD in a Philips X'Pert-1 Texture XRD in Instantaneous CTE curves for Gilsocarbon and PGA Graphite Typical PGA and Gilsocarbon XRD pole figures (The images are of regenerated pole figures of the [0002] peak). The colour scale used for each is the same (0.5–2.5 multiples of random distribution or m.r.d). a PGA (AG). b Gilsocarbon
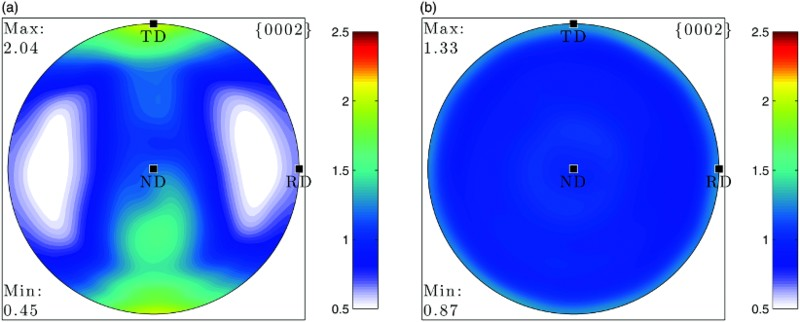
The calculated values for PWG and PAG are plotted in Fig. 14. As Gilsocarbon is almost isotropic the WG and AG P values are almost the same in magnitude slightly higher than the Sutton and Howard 48 values for Pc ; whereas for PGA the values of P in the two directions are similar in magnitude and almost the same in value as Pc .
Methodology for calculating CTE over various temperature ranges
The methodology used for calculating CTE over various temperatures ranges
54,57
is similar to that given in equation (6), but is based on a thermodynamically based derivation due to Simmons
50
and Hall et al.
66
as given below for isotropic graphite.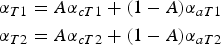
Rearranging equation (18) gives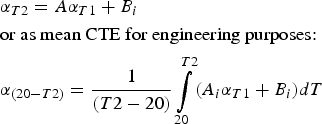
In nuclear graphite assessments T1 is usually taken as 70°C and mean CTE data are tabulated over the range 20–120°C, although measurements of CTE made over this low and small temperature range are not recommended as the accuracy obtained can be poor. 67
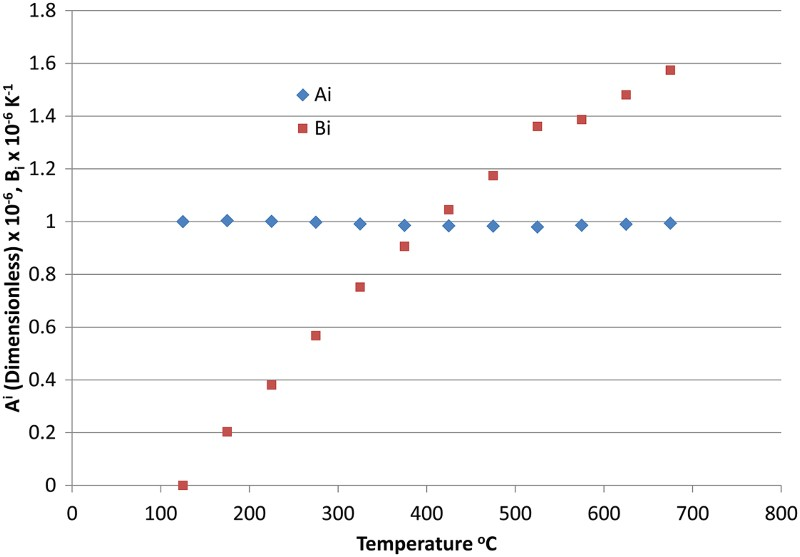
Using the crystal data given in,
48
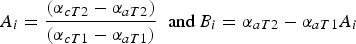
Ai
and Bi
have been plotted in Fig. 17. As α
a << α
c, Ai
approaches 1.0 × 10⁻⁶ K−1. However, Bi
is a strong function of temperature indicating that graphite temperature dependence is a strong function of α
a only. The reason for this may be attributed to the significant relative change in crystal αa
compared with the smaller relative change in αc
between T1 and T2.
Ai
and Bi
values based on crystal data taken from
48
Applying these equations, the instantaneous CTE for a polycrystalline graphite at any temperature can be obtained from a measurement made at only one temperature using the crystal α
c and α
a data available from the literature.
16
This methodology works well for all graphite grades
22
and can even be applied to irradiated, radiolytically oxidised graphite as shown in Fig. 18 below (the curves are normalised to 4 × 10⁻⁶ K−1 at 120°C). The data given in Fig. 18 was obtained from measurements made on virgin, medium fluence and very high fluence irradiated Gilsocarbon graphite samples, including some highly radiolytically oxidised samples irradiated at NRG Petten in a recent Materials Test Reactor programme. The MTR CTE data are compared to the theoretical CTE calculated using equation (19) and the graphite crystal data given in Fig. 12. Considering the scatter in the crystal CTE data and the extreme irradiation conditions the mean temperature-dependent CTE relationship is adequate for reactor graphite structural integrity assessments. However, in the case of highly anisotropic PGA larger discrepancies have been reported
68
which merit further investigation. Mean CTE temperature dependence in irradiated Gilsocarbon graphite, normalised to 4 × 10⁻⁶ × K−1 at 120°C.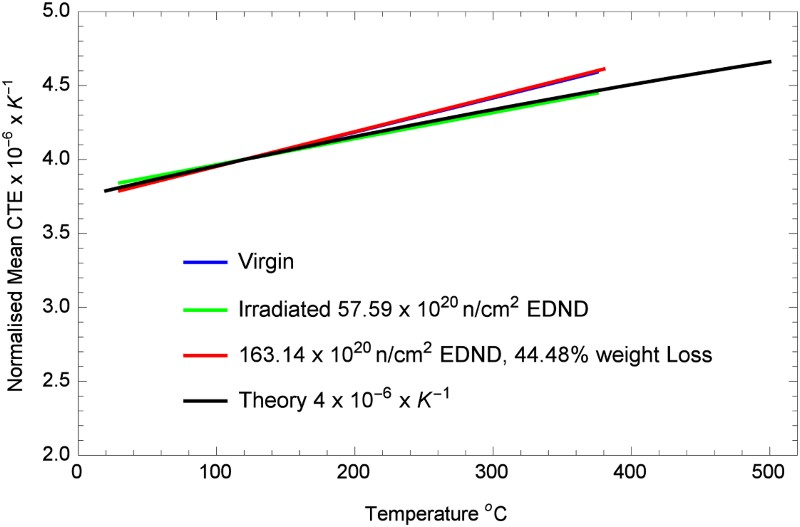
The observation that the temperature dependence of irradiated and well-oxidised graphite is not changed suggests that the crystallite connectivity remains largely intact despite the loss of carbon, in this case ∼ 45% weight loss. It also indicated that crystallite CTE is not changed with increasing fast neutron fluence confirming measurements made by Kelly et al. 69 at irradiation temperatures above 300°C.
The effect of strain on CTE
In virgin graphite a significant change in CTE can be produced due to loading. 57,70 Whereas uniform change in temperature may not be expected to significantly change crystal orientation in unrestrained graphite, the application of stress or strain may change CTE as reported by Oku et al. 71 on stressed graphite and Zukas et al. 72 on thermally crept graphite, as discussed later.
Figure 19
a shows the change in CTE in Gilsocarbon as a function of load taken from Preston and Marsden.
57
Recently Marrow et al.
73
measured the change of the lattice ‘d’ with load. Taking the maximum change in the ‘d’ given in Fig. 10 of their paper implies a crystal strain of ∼284με. The crystal modulus, c
33 in this direction is ∼36 GPa
16
which implies a pressure on the basal plane of ∼10MPa. From this the change in c-axis CTE can be calculated using the methodology described by Kelly
74
which is about 0.2 × 10⁻⁶ K−1 or 1% which would not explain the large changes in CTE given in Fig. 19
a. Change in CTE, orientation factor and porosity factor in virgin Gilsocarbon graphite as a function of stress. CTE data taken from reference,
57
measurements taken at room temperature. The average unloaded CTEs were 5.34 and 5.17 × 10⁻⁶ K−1 in the loaded and unloaded directions, respectively. a Change in CTE due to loading. b Orientation factor ‘x’ and porosity factor ‘P’ as a function of load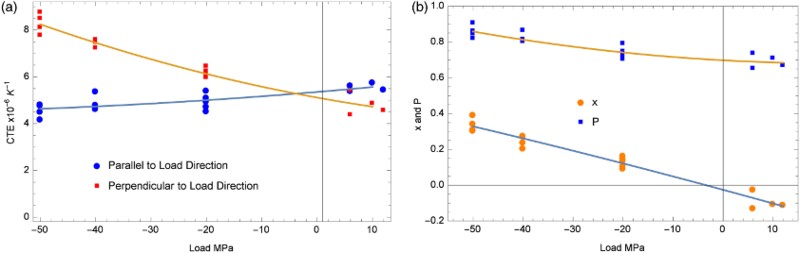
Figure 19 b shows the orientation factor x and the factor P for the data as a function of load calculated using equation (16).
Both the change in orientation and porosity factor are predicted to increase with increasing compressive load and decrease with tensile load, although there is significant scatter in the tensile data, see Fig. 19 b.
This would indicate that under at least compressive loading, both changes in porosity and orientation influence CTE. Preston et al. 57 did not measure the change in either porosity or orientation as a function of load. However the implication of the significance of the changes given in Figs. 19 a and b can be investigated by comparison with the change in porosity factor P due to temperature and by investigating the change in crystal orientation required to account for the large change in CTE due to compressive load, as described below.
Comparison of the changes in CTE with thermal or stress loading
Second, in order to explore the change in crystal orientation required to achieve large changes in CTE of −50MPa and 12MPa, theoretical pole density distributions as a function of the dispersion angle φ have been calculated using equation (9) and are shown in Fig. 20. Such changes in orientation distributions are certainly achievable as can be seen from the measurements reported by Oku et al.
71
They used XRD to measure the BAF in pre-stressed graphite, in samples both compressed at room temperature (25°C) and also compressed at 2010°C, a temperature at which thermal creep is significant in graphite. On removal of the loading they obtained BAF values for isotropic IG-430 graphite of 1.06, 1.45 and 2.52 for as received, compressed at room temperature, and compressed at 2010°C respectively.
75
These results are remarkable in that the orientation factor more than doubled on compression at 2010°C. Unfortunately, they did not measure the resultant CTE on these specimens. Predicted change in [0002] pole intensity due to loading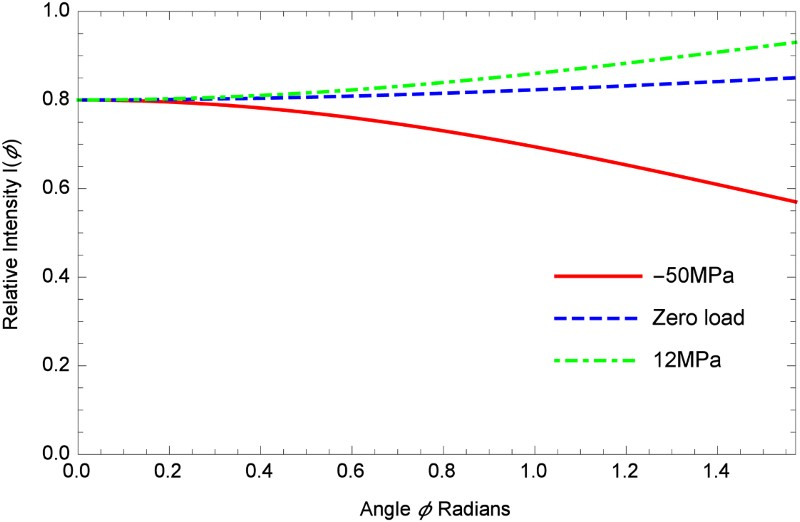
The capacity for graphite to re-orient is illustrated by the SEM image of raw Gilsocarbon coke in Fig. 21
a showing the tortuous arrangement of folded graphitic sheets with significant porosity available for reorientation under loading. This structure is very obvious in the raw coke but is still maintained in the final graphitised product, as shown in Fig. 21
b. SEM images of Gilsonite coke and Gilsocarbon graphite. a Gilsonite coke. b Gilsocarbon graphite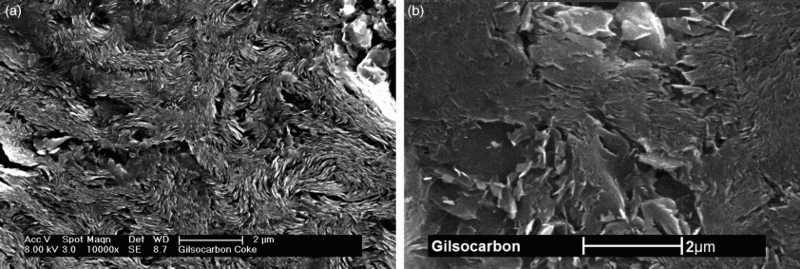
While these images show that polycrystalline graphite can accommodate strain the exact mechanism by which this is achieved require further study using techniques such as tomography.
This ability for polycrystalline graphite microstructure to deform and recover under loading has recently been illustrated at the University of Manchester
76
by subjecting graphite samples to very high hydrostatic pressure. The samples were compressed to around 80% of their original volume thus utilising most of the internal porosity. Incredibly the samples recovered almost completely after the hydrostatic pressure was removed, as shown in Fig. 22. However, it is interesting to note that if deviatoric pressure was applied the samples exhibited significant permanent set. Volumetric strain in PGA graphite subject to very high hydrostatic pressure.
76
The original volume was almost completely recovered on unloading (load path shown by arrows)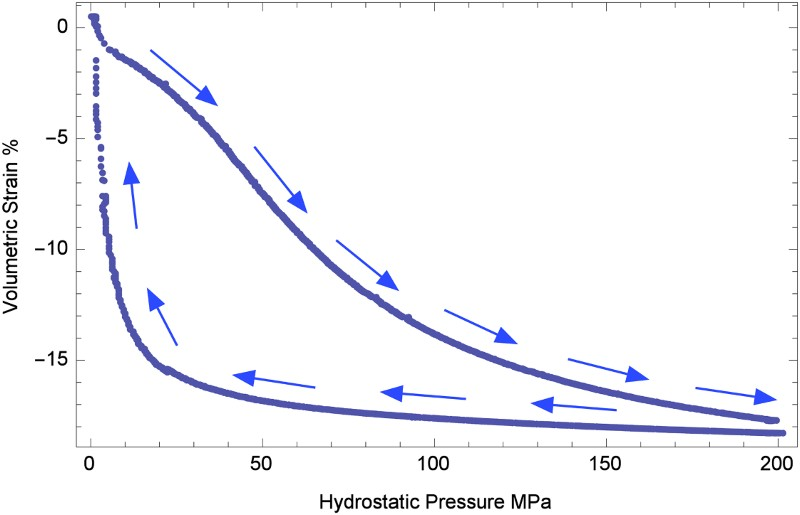
The reason graphite has this ability to deform and recover is probably related to the ability of the graphite sheets to twin and kink 24 allowing many millions of graphitic sheets to rearrange under external loading resulting in closure of porosity and crystal reorientation. The work of Oku et al. discussed previously gives some credibility to this possibility. 71 In addition Zukas et al. 72 thermally crept semi-isotropic POCO graphite to 54.3% of the original length resulting in a change in BAF from 1.0 to 2.88. Unfortunately, again they did not measure the change in CTE. As well as recoverable deformation, kinking, and twinning, there is the possibility that the compression applied by Oku et al. 71 or the creep deformation of Zukas et al. 72 might have damaged graphite crystals in some orientations (e.g. by plastic deformation), which would affect their scattering intensity. The investigation of this possibility is important as it would also affect the pole figure intensities.
It is clear that further investigation of crystal orientation distribution due to loading is required and at present, orientation factor change due to thermal and irradiation creep is one of the main themes being undertaken at within the Nuclear Graphite Research Group at the University of Manchester.
Observations on the effect of neutron irradiation on graphite crystal and polycrystalline CTE
Measurements of crystal CTE of irradiated Highly Orientated Pyrolytic Graphite (HOPG) imply that α
c and αa
between 300 and 650°C can be considered to be invariant to fluence, up to a fluence of 300 × 1020 n cm−2 EDND (Fig. 23).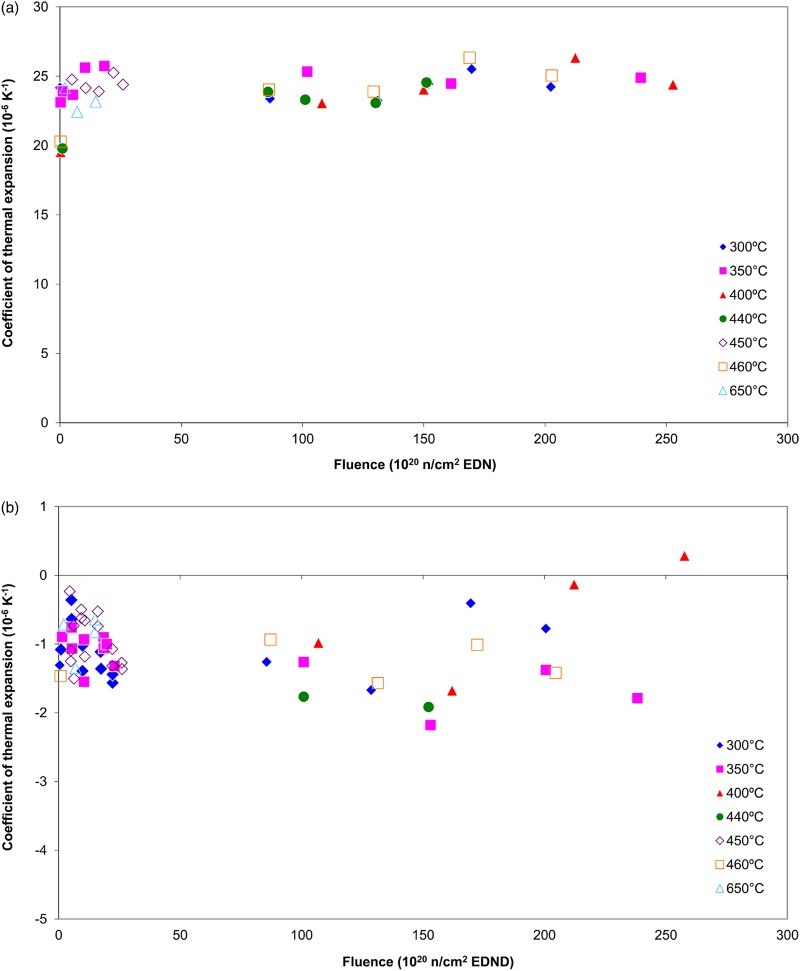
The irradiation-induced changes in CTE of polycrystalline PGA and Gilsocarbon graphite are given in Fig. 6 a and b in the temperature range 300–650°C. The CTE of PGA increases slightly with irradiation; the increase is more significant AG at the lower temperatures, but at the higher temperatures 450°C and above, the CTE both WG and AG is considered to be invariant to fast neutron fluence for practical purposes. The reasons for this may be the relatively large inter-crystalline accommodation in the PGA filler particles.
The CTE behaviour of Gilsocarbon, and other semi-isotropic graphite grades, is more complex as there is an initial increase followed by a decrease to around half the unirradiated value. A recent detailed statistical analysis of this and other CTE data 59,60 has shown the initial rise to be almost instantaneous.
It may be expected that an increase in CTE would be correlated to a decrease in Young's modulus. 78 However in both PGA and Gilsocarbon, fast neutron irradiation causes an initial increase in modulus and CTE, see Fig. 6. In the case of Gilsocarbon, after this initial increase in CTE and modulus, the modulus starts to rapidly rise again and there is a fall in CTE which does appear to be correlated with modulus as expected. At very high fluence as the structure of the graphite degenerates, the modulus falls and the CTE stabilises at a value of about half the initial CTE. In the case of PGA, over the data range available the modulus continues to increase but there is significant scatter in the data. It may be inferred that as there are no driving forces to significantly change the crystal orientation and there is an observed invariance of crystal CTE to fast neutron fluence, see Fig. 23, the changes in CTE in polycrystalline graphite are mainly related to porosity changes due to crystal dimensional changes as discussed below.
Analysis of irradiation-induced dimensional change
Using the same considerations as given by equation (6) the linear dimensional change dl/l in an orthotropic material should be given by: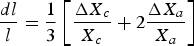
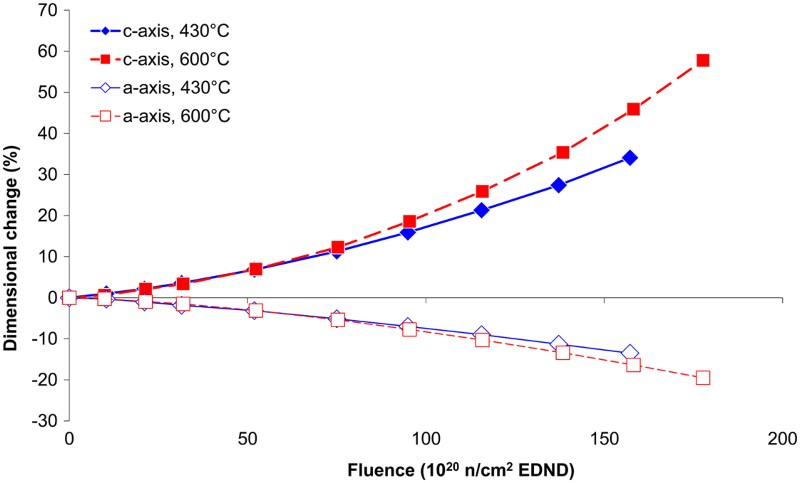
Fortunately, a good set of irradiation data on crystal dimensional change has been obtained by irradiating HOPG
79
at 430°C and 600°C as given in Fig. 24. Experimental dimensional change data measured on HOPG samples irradiated at 430°C and 600°C
79
Applying equation (21) directly predicts constant expansion as the significant c-axis growth dominates, see the red curve in Fig. 25
a. Application of averaging models to MTR Gilsocarbon graphite data, irradiated at 400°C and 600°C.
80
a Prediction using equation (21). b Prediction allowing for crack closure at 30 × 1020 n/cm2 EDND. (Experimental data at 600°C shown in blue
80
). c Prediction using equation (22). Fit defined using the exact function and a simplified version of ‘F’, along with the experimental irradiation data at 600°C.
80
d Prediction using equation (22). Fit defined using the exact and a simplified version of ‘F’ along with the experimental irradiation data at 430°C
80
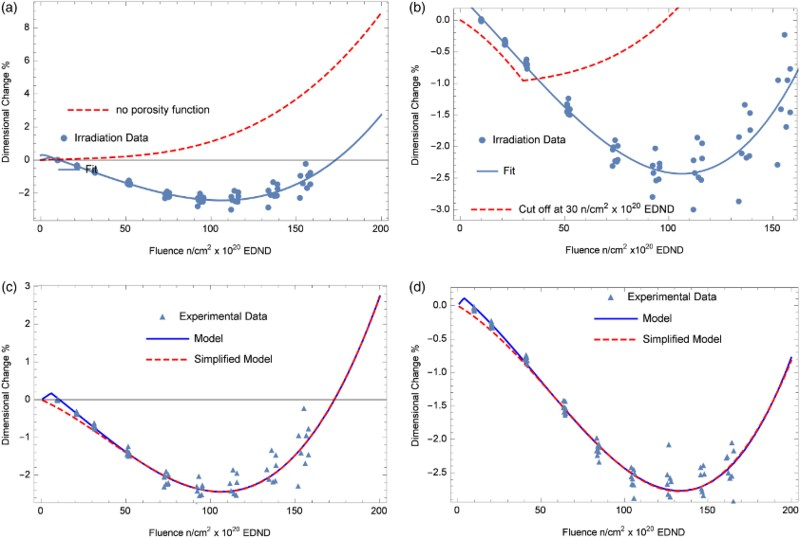
Assuming instant crack closure at the dimensional change inflection point (∼30 × 1020 n cm−2 EDND) gives the prediction in Fig. 25 b. This underestimates the fluence at turnaround and overestimates the dimensional change after turnaround, as well as giving a step change in dimensional change rate.
From microstructural observation
81
and the use of small angle neutron scattering (SANs)
82
it is known that there is a distribution of lenticular cracks from the nano-scale through to the micro-scale capable of accommodating c-axis expansion. This is believed to be confirmation of the presence of Mrozowski
21
cracks. In addition, mercury porosimetry appears to indicate that it is changes to the small pores, less than ∼1μm, that influence volumetric change in irradiated graphite.
83
The cumulative closure of this accommodation plus other structure effects will enhance the influence of the crystal c-axis dimensional changes. Thus equation (21) has been modified by the inclusion of an influence function ‘F’ (a function of both fluence and temperature) to give: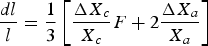
The function F has been obtained by fitting curves to the Gilsocarbon irradiation data 80 and the appropriate HOPG experimental data 79 and then iterating between equation (22) and a statistical fit made to the experimental dimensional change irradiation data. At low values of fluence the iteration produces unrealistically high values, and therefore back extrapolation was used to determine the F function below a fluence of ∼30 × 1020 n cm−2 EDND.
The resulting prediction of the irradiation-induced dimensional change in Gilsocarbon graphite irradiated at 600°C compared to actual irradiation data 80 is given in Fig. 25 c. A similar prediction for Gilsocarbon irradiated at 430°C is given in Fig. 25 d.
The influence functions F for Gilsocarbon are plotted in Fig. 26 along with fits to data for two creep control ATR-2E specimens irradiated at ∼500°C in HFR Petten.
7
The F function for Gilsocarbon at 600°C tends to zero at zero fluence, whereas the Gilsocarbon 430°C specimen at zero fluence has a finite value, indicating that c-axis crystal swelling needs to be accounted for at the lower temperature.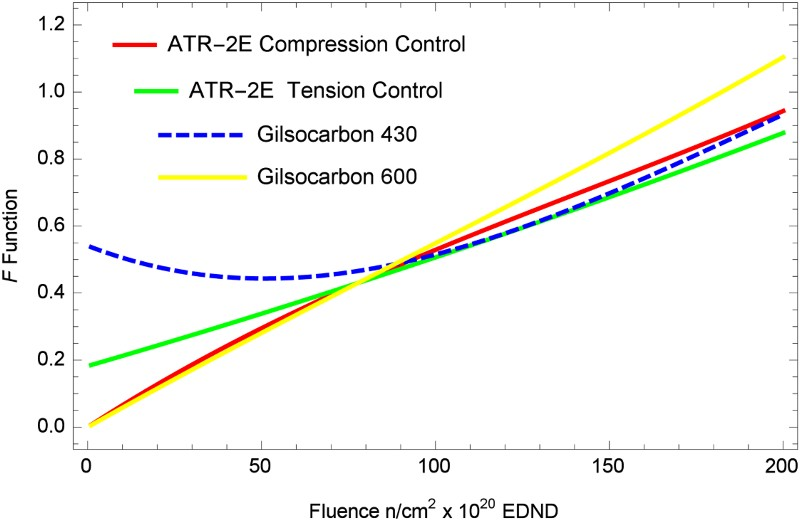
The shape of the F function for the ATR-2E compression control specimen is similar to the Gilsocarbon 600°C at low fluence but diverges slightly at high fluence. However, the ATR-2E tension control specimen at low fluence has a finite value, which implies that the ATR-2E tension control was irradiated at a lower temperature than the compression control. This creep experiment was not properly reported due to the closure of the German HTR reactor programme so it is not possible to check if this was the case. The function F tends to unity at very high fluence implying the influence of the c-axis expansion dominates.
From equation (21) and examination of Fig. 25 it can be observed that the initial dimensional change rate in isotropic Gilsocarbon graphite is approximately one-third of the crystal a-axis dimensional change rate (as defined by irradiating HOPG) which explains the reasonable fits obtained before ‘turnaround’. 52 The c-axis crystal expansion progressively increases with increased fluence, but has not reached unity in the extent of the polycrystalline data.
The same approach was applied to anisotropic PGA graphite. The 430°C and 600°C functions for ‘F’ used are those obtained for Gilsocarbon, a very different microstructure to PGA. However, the model fits correspond remarkably well to the MTR data,
80
see Fig. 27. The orientation factor ‘x’ was taken as 0.4 and was obtained using XRD pole data. Prediction of dimensional change in PGA graphite irradiated at 600°C and 430°C, using equation (22), compared to the PGA experimental irradiation data.
80
a 600°C. b 430°C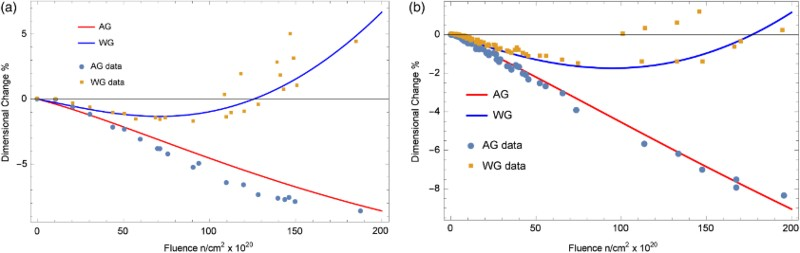
An important conclusion may be drawn from this analysis of PGA, i.e. the analysis indicates that similar ‘F’ functions are appropriate for both Gilsocarbon and PGA graphite implying that in both cases the amount of porosity associated with crystal c-axes is similar in volume.
Implications for irradiation creep in graphite
Irradiation creep in graphite is defined as the difference in dimensional change in a loaded specimen compared to the dimensional change in an unloaded specimen irradiated under the same conditions. Irradiation creep is very important in graphite-moderated reactor design because it relieves significant thermal and shrinkage stresses that would lead to component failure after a few years operation without the presence of irradiation creep. 11 Irradiation creep has been attributed to basal plane slide due to pining and un-pinning of dislocations in the crystal basal planes, 84 but as yet there is no convincing microstructural evidence of this mechanism.
The analysis of CTE and dimensional change discussed above has reflected the strong geometric anisotropy of the graphite crystal structure with weak bonding perpendicular and strong bonding parallel to the basal planes that leads to significant anisotropy in properties and crystal behaviour, both in the virgin and irradiated condition. In addition, the microstructure of the polycrystalline graphite provides significant porosity associated with the crystal c-axis which is available to accommodate both thermally- and irradiation-induced c-axis expansion, thus allowing properties associated with the crystallite a- and c-axes to be considered to be largely independent of each other in averaging crystal properties to derive bulk properties. The approach used for dimensional change is taken one step further below to examine irradiation creep.
Irradiation creep per unit elastic strain in graphite was defined by Kelly and Brocklehurst
10
by the following relationship:
The first term in equation (23) accounts for short term non-linear transient recoverable creep which is one elastic deflection and the second term is linear non-recoverable creep.
The creep modulus is defined as

Up to a fast neutron fluence of ∼60 × 1020 n cm−2 EDND, which is the extent of the UK Gilsocarbon and PGA creep data, this equation was found to be independent of loading direction, i.e. tension or compression, and applicable to many grades of nuclear graphite. 10 However, at higher fluence the equation did not fit irradiation data for other non-UK graphite grades. Other authors 85 modified equation (23) using dimensional change instead of modulus. More recently equation (23) was modified by Davies and Bradford 86 who added an extra term to account for data that inferred the presence of high-fluence, recoverable creep.
It had also been observed that in irradiated graphite CTE was modified by creep strain
58
(Fig. 28
a). The magnitude of this change in CTE was of the same order as that observed by Preston et al.
57
in loaded virgin graphite, but the magnitude of creep strain leading to the change in CTE in irradiated graphite was much larger than the elastic strain in virgin graphite, see Fig. 28
a. However when both sets of data are plotted against elastic strain, both the irradiation and virgin data are reconciled, see Fig. 28
b. Note that although Davies and Bradford
86
include recovery strain as well as elastic strain, only elastic strain is considered here. Difference between loaded and unloaded CTE in for irradiation creep data and data on virgin graphite under stress. a Data plotted against irradiation creep strain and for virgin graphite against elastic strain. b Data plotted against elastic strain only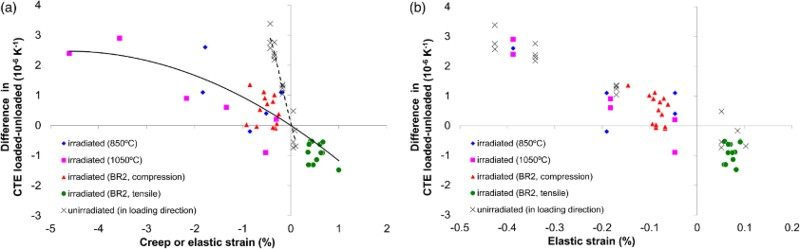
It has been previously demonstrated in this review that the change in CTE in virgin graphite measured under load may be attributed to crystal re-orientation. This re-orientation in loaded virgin graphite, along with the change in CTE, is removed on unloading apart from a small residual. 57 It is postulated here that the same mechanism occurs in irradiation crept specimens, leading to a recovery of the frozen-in primary creep and hence CTE. 58
As previously stated, unfortunately there are no irradiation creep data for Gilsocarbon or PGA graphite with fluence greater than ∼60 × 1020 n cm−2 EDND. However, there are reasonable data for another medium-grained graphite, namely ATR-2E; there are data in tension and compression up to ∼200 × 1020 n cm−2 EDND, see Fig. 5.
By examining Fig. 5 it is clear that the effect of stress is to accelerate the initial dimensional change rate, which as discussed above in unloaded graphite is set by one-third of the crystal a-axis rate. This rate has been significantly increased or decreased due to compressive or tensile loading, respectively.
Thus taking account of the independence of the a- and c-axes, the irradiation creep equation (22) can be redefined as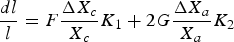
K1 and K2 are the usual anisotropy factors defined by the CTE elastic strain relationship given in Fig. 28 b, and in this case the orientation factor x defining K1 and K2 is 0.046 and −0.056 for compression and tension, respectively. It is this behaviour that may explain the difference in the compressive and tensile irradiation creep change behaviour observed in ATR-2E graphite. 7
The F function, as previously described, allows for the delay in the influence of the c-axis crystal expansion. It has been recalculated by iteration between a fit to the experimental ATR-2E unloaded control sample data, compressive and tensile, and equation (22) as described previously for Gilsocarbon graphite above. The resultant F curves are shown in Fig. 29 below. At low fluence these curves diverged because of the initial swelling and delay in shrinkage as discussed previously. Above fluences of about 60 × 1020 n cm−2 EDND the change defined by the F function is similar for both ATR-2E and Gilsocarbon in the temperature range 430–600°C.
F and G functions for tension and compression loading. a F functions. b G functions for ATR-2E Graphite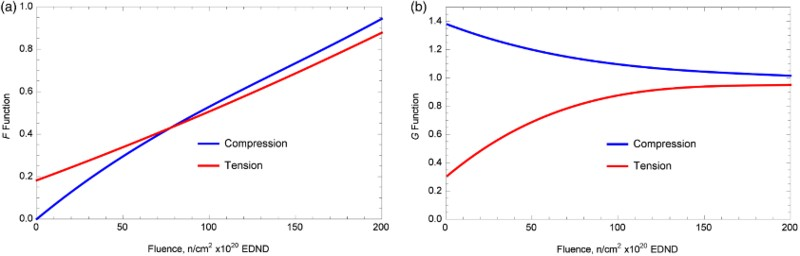
The function G is a function of load which increases the influence of the a-axis dimensional change in the loaded crystallite. The G function was obtained by iterating between equation (25) and a fit to the unloaded dimensional change curve, as with the F function the values of G, below a fluence of 30 × 1020 n cm−2 EDND were calculated using back iteration to avoid unrealistic high values.
The influence of the function G on loaded dimensional change behaviour is the greatest at low to medium fluence. Its value depends on whether the loading is tension or compression, changing from a value of ∼0.3 or ∼1.4 to a value of ∼0.9 or ∼1.1 for compression and tension, respectively, see Fig. 29
b. The resulting dimensional change behaviour for ATR-2E is shown in Fig. 30 and the irradiation creep curves are comparable to those shown in Fig. 30
b, along with the UKAEA creep law defined by equation (23). The ATR-2E creep curves given in Fig. 30 are identical to those given elsewhere.
7
Considering the simplicity of the averaging orientation equations, the similarities between the experimental and predicted irradiation creep behaviour are remarkable. Predicted and experimental irradiation dimensional change and creep curves in ATR-2E graphite. a Model predictions (solid lines) compared to the unloaded and loaded experimental dimensional change data (symbols). b Model predictions (solid lines) compared to the irradiation creep data (symbols)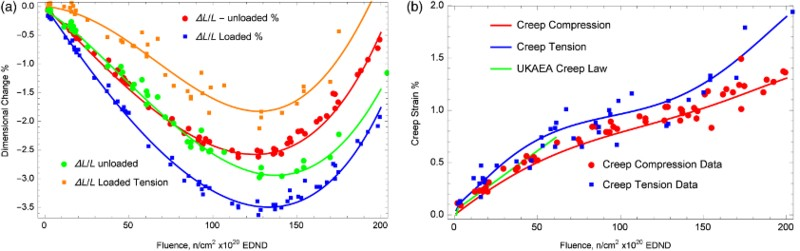
If after a certain fluence, to simulate unloading, the function G is relaxed back to unity the dimensional change returns back towards the unloaded dimensional change curve by the remaining offset, see Fig. 31
a. This behaviour can be compared with experimental data given in Fig. 31
b and may possibly be explained by the remarkable ability of graphite to recover deformation as illustrated in the high compression experiments, see Fig. 22. However, in the compression experiments the recovery was non-linear ‘elastic’ behaviour whereas in the case of irradiation, continued fast neutron fluence is required to ‘unlock’ the internal stresses that have been accumulated under load. Dimensional change predictions of loading and unloading compared to irradiation data.
87
a Unloading prediction (solid lines) compared with experimental data (symbols). b UKAEA irradiation data loading and unloading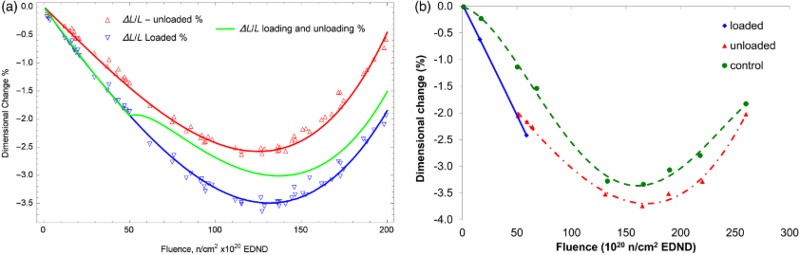
Implication of radiolytic oxidation
Both dimensional change and CTE are modified by weight loss 4 but not as much as may be expected when considering the large change in Young's modulus which can be equated to loss in section. 4 This may imply that it is changes to the finer porosity, i.e. Mrozowski cracks that are mainly associated with changes to dimensional change and CTE, while the larger globular-shaped porosity is associated with the large changes in Young's modulus due to radiolytic oxidation. However further studies are required to confirm this observation. The irradiation creep rate is increased by radiolytic oxidation but data are sparse. 10
Discussion
The highly anisotropic nature of the graphite crystal coupled with the complex porous microstructure of nuclear polycrystalline graphite gives rise to complex thermal and irradiation-induced property changes. The approach taken in this review is based on averaging methods. The applicability of these simple methods lies in the strong crystal anisotropy and the considerable porosity available to accommodate c-axis thermal and irradiation expansion. This porosity has to be accounted for when assessing thermal and irradiation-induced changes to CTE, dimensional change and creep. The thermal and irradiation-induced property changes discussed here are shown to be a primary function of crystal properties, crystal orientation and porosity associated with the c-axis.
In the case of CTE the averaging technique has been shown to be capable of accounting for changes due to temperature and loading. However, in the case of changes due to fast neutron irradiation the initial increase in both CTE and modulus is difficult to explain and requires further investigation. The analyses clearly show the influence of porosity and crystal orientation on properties; this sensitivity is probably related to the very high value of crystal CTE in the c-axis direction compared to the crystal a-axis direction.
The application of the averaging method to dimensional change clearly shows the change from the influence of crystal a-axis shrinkage to that of the c-axis expansion. One of the remarkable observations is the similarity in the accommodation function for semi-isotropic Gilsocarbon, anisotropic PGA and German ATR-2E; three graphite grades with very different microstructures. The initial dimensional change swelling observed at certain temperatures clearly merits further investigation.
The application to irradiation creep may appear, at first reading, to stretch the application of the methodology. However, if as it appears from observation of the polycrystalline graphite microstructure the crystal behaviour in the a- and c-axes can be considered independent, then the analysis is valid. The creep mechanism appears to change the initial dimensional change rate. This may be due to microstructural deformation made possible by the significant available porosity and the ability of the graphitic structure to twin, kink and recover. It is possible there may be some basal plane shear, but it is difficult to see how this mechanism would recover. It also appears that deformation, and accompanying stresses, in the presence of fast neutron irradiation may be locked-in, and will only recover on the removal of loading while still subject to irradiation. The energy input of fast neutron irradiation may provide the driving force to activate recovery mechanisms.
It is clear that further microstructural investigation of the evolution of the microstructural and property changes in irradiated nuclear graphite is desirable. Hopefully the techniques described in this review will provide a useful tool to obtain further understanding. In addition further development of the use of finite element techniques used to model irradiation-induced microstructural changes pioneered by Hall et al. 66,88 and more recently by Delannay et al. 89 using a modified crystal plasticity model may further enhance mechanistic understanding of these complex processes in respect to the properties investigated here as well as others such as modulus and thermal conductivity.
Conclusions
The influence of the microstructure of polycrystalline nuclear graphite on dimensional stability and material properties has been discussed in detail. It is shown that different choices of raw materials and manufacturing technique can lead to significant differences in graphite properties and irradiation behaviour. This is important because when raw materials are discontinued both graphite virgin and irradiated properties will change, leading to a need for the necessity of time consuming and expensive graphite irradiation programmes. However, the size, scope and cost of such programmes can be significantly reduced through a better understanding of the relationships between the graphite microstructure and properties.
It is demonstrated that dimensional and property changes to graphite core components can lead to the generation of significant internal and thermal stresses and that dimensional stability can influence whole core behaviour, thus challenging the structural integrity of the graphite core.
Examination of graphite using microscopy reveals a complex microstructure containing a significant amount of porosity. Microscopy shows sheets of graphite crystallites that form twisted structures that can deform, and recover, to a certain extent, under load. Irradiation causes the individual crystallites to swell in one direction and shrink in the other. However significant swelling and load deformation can be accommodated by porosity which extends in size from the nano-scale to the micro-scale.
The thermal expansion, dimensional change and irradiation creep are analysed using modified averaging methods accounting for graphite crystal orientation and porosity. The methods are applied to Gilsocarbon, PGA and ATR-2E nuclear graphite. The methodology accounts for crystal properties and orientation change and porosity accommodation in the crystallite c-axis. It is shown that the effect of temperature on CTE can be related to changes in the c-axis accommodation whereas changes in CTE due to loading are mainly related to changes in crystal orientation. Dimensional changes in the irradiation temperature range 400–600°C are shown to be initially driven by crystal a-axis shrinkage and later by c-axis growth, as porosity is taken up by crystallite irradiation swelling. One of the remarkable observations is the similarity in the accommodation function for semi-isotropic Gilsocarbon, anisotropic PGA and German ATR-2E; three graphite grades with very different microstructures.
Irradiating graphite under load is shown to change the influence of the a-axis shrinkage either due to microstructural deformation, or basal plain shear. However, it is unclear how the latter mechanism could be recoverable.
The main conclusion of the paper is that closure of porosity and possible reorientation of crystals can have a significant effect on the response of the material to irradiation, oxidation and stress.
It is clear that in order to verify and extend the observations in this review that there is a need for more detailed examination of irradiated graphite specimens both unloaded and crept. Characterisation of irradiated specimens is required using techniques such as XRD, tomography and the various types of microscopy available, along with property measurements made in three-orthogonal directions. In particular a well-characterised set of irradiated crept specimens along with their control specimens would lend much to understanding. Using such methods it should be possible to improve the understanding of the mechanisms and process which lead to irradiation-induced dimensional and property changes in graphite core components in order to help to extend the life of existing graphite-moderated reactors and to design high-temperature Generation IV reactors.
Footnotes
Acknowledgements
This work was made possible through funding provided by the EPSRC grant EP/I003312/1, ‘Fundamentals of current and future uses of nuclear graphite’ and the European Commission FP7-Euratom-Fission project ‘Advanced High-Temperature Reactors for Cogeneration of Heat and Electricity R&D’ (ARCHER). Project reference: 269892. The authors also acknowledge funding by the UK Office for Nuclear Regulation (ONR). Any views expressed in this review are those of the authors and not necessarily those of ONR.