
Abstract
The size distribution of iron ore sinter is critical to efficient blast furnace operation and is an optimised variable in sinter plants globally. Prompt process control response to discrepancies in sinter size is essential, and the standard sieve measurement test introduces significant delay in data acquisition. We introduce a networked optical sensor system that is shown to accurately measure size distribution within 5 s, collect data continuously at 0.5 Hz, and is well correlated to sieving measurements. This system is deployed at the end of a sinter plant, providing real-time process control data with digital image analysis performed on an integrated microprocessor. The systems performance was assessed with a 12-week validation period, showing excellent correlation with sieve data. Systems such as ours can be widely implemented in sinter plants, and in similar steelmaking applications, due to its cost-effective implementation of continuous data acquisition and the systems versatility to be adapted.
Introduction
High-quality burden material is critical for the production of high-quality iron and steel within the blast furnace ironmaking process [1,2]. The use of ideal burden material enables proper control of blast furnace operation, leading to the production of the best quality iron with minimal material, energy, and time requirements. Ore supplier processing (beneficiation) separates out the ferrous and non-ferrous material, and produces finely sized iron ore. Additional processing to agglomerate these fines is therefore required in order to produce suitable blast furnace ferrous burden material [3,4].
Efficient blast furnace operation relies on the correct material properties of burden material, where size, and distribution thereof, is especially important [5]. In the predominant agglomeration process, iron ore fines are ‘sintered’ through a process of heating; moisture control; and the addition of additives, coke, and limestone flux [6]. The sinter is screened to separate ‘return fines’, which are <5 mm in diameter and are fed back into the sinter process, ideally leaving behind particles with diameters of 5–40 mm [7]. The size of sinter produced depends on many factors, such as the additives/fluxes used; sinter stove temperature, and distribution; moisture levels; sinter crusher performance; the composition of the iron ore; the amount of return fines incorporated; and various plant conditions [8]. Incorrect sizing is thus a key indicator of process control issues.
One commonly used method of maintaining consistent ferrous burden geometry is to use pellets instead of sinter, which are processed to have a relatively uniform size and shape. However, pellets also have significant disadvantages in the form of high production costs, more stringent requirements on raw material, and potential disadvantages in blast furnace performance [9].
The iron and steel industry contributes approximately 7% of total global greenhouse emissions [10], with blast furnace operation being by far the most emitting component of the process [11]. Ensuring that upstream parameters are controlled in order to produce the most appropriately sized sinter for blast furnace loading is, therefore, a crucial component of process optimisation, which ultimately leads to a reduction in overall emissions. However, due to breakage within the process, variability in raw material, and other factors outside of operator control, some size fluctuation is inevitable. If the correct distribution of sizes is not achieved, then blast furnace efficiency and productivity will be reduced [12,13]. For instance, the blast furnace will need to operate at higher temperature, leading to reduced stove lifetime and increased energy usage. Incorrect burden permeability also alters the size and shape of the cohesive zone, leading to lower productivity, increased coke required for proper reduction, and increased heat loss [14,15]. However, by reducing the size discrepancies between product ideals and the actual sinter output, the process can be made more efficient. This leads to reduced greenhouse gas emissions, more consistent operations, and improved iron quality.
The usual method of performing size distribution assessment is for an operator to periodically take a sample of sinter and pass them through a series of sieves with decreasing hole diameter [16,17]. Given that this process may only happen twice a day, a significant period of time may elapse between tests. Several hours may have elapsed between taking of the sample and the results being presented to plant control that allow action to be taken. Automated sinter sieving systems are used in some sinter plants, but are prone to particle breakdown during measurement and typically collect samples several times per day at most. Large quantities of deficient sinter may thus be produced before control issues are identified and remedied.
The need for automated monitoring of sinter quality has been explored significantly, providing in-process measurement of chemical composition, where Prompt Gamma Neutron Activation Analysis and Pulsed Fast Thermal Neutron Activation are used to detect basicity with little control lag [18]. Both solutions minimise sample rate induced data ‘smoothing’, reduce the delay on process adjustment, and ultimately help ensure maximum sinter uniformity. There are also existing machine vision pellet size quantification systems, which demonstrate the applicability of image analysis in particle sizing. These are not directly employed in sinter applications due to the highly irregular shape of sinter, unlike the uniformly spherical pellets, causing very poor outputs with traditional square or circle-fitting algorithms [19,20].
In this work, we present a continuous measurement optical sensor system approach to measure the distribution of the sinter in-situ, with accurate size analysis performed at a data collection rate of 0.5 Hz, which is accessible within 5 s. The top surface of the sinter is imaged and sized; the key innovation is to calibrate these data to accurately represent the complete size distribution of material otherwise hidden from the camera. This continuous sinter size data can then be collated into histograms, displayed to plant operators for process control, and alerts set for improper sizing. We demonstrate the efficacy of the system within a sinter sizing application, though applications are not limited to this one use case due to the versatility of our algorithm. Our measurements are compared with data obtained at Tata Steel South Wales, which validates the efficacy of the system when in-comparison to their existing sieving method of size measurement.
Methods
Instrument
A Basler Ace acA2000-165uc area scan imaging camera (2 MP global shutter CMOS sensor, with 2040 × 1086 resolution) formed the basic image acquisition element for the system. Measurements were presented to process control at a frequency of 0.5 Hz; with the rate limited by embedded processing computational speed. A custom expander lens was designed with a field-of-view of 600 mm by 1200 mm, which occupied the full width of the belt. The lens was designed to have an f-number of f/6, which was found to be sufficient to capture reflected light from the low reflectivity sinter particles, with sufficient signal for accurate size analysis and low optical aberrations.
A Rittal Ex IP66 stainless steel enclosure was used, with suitable cable glands, designed to prevent internal contamination over a maintenance period of a year or more. A labelled and computer-aided design rendering of the system is shown in Figure 1. Computer-aided design model of the camera enclosure and system.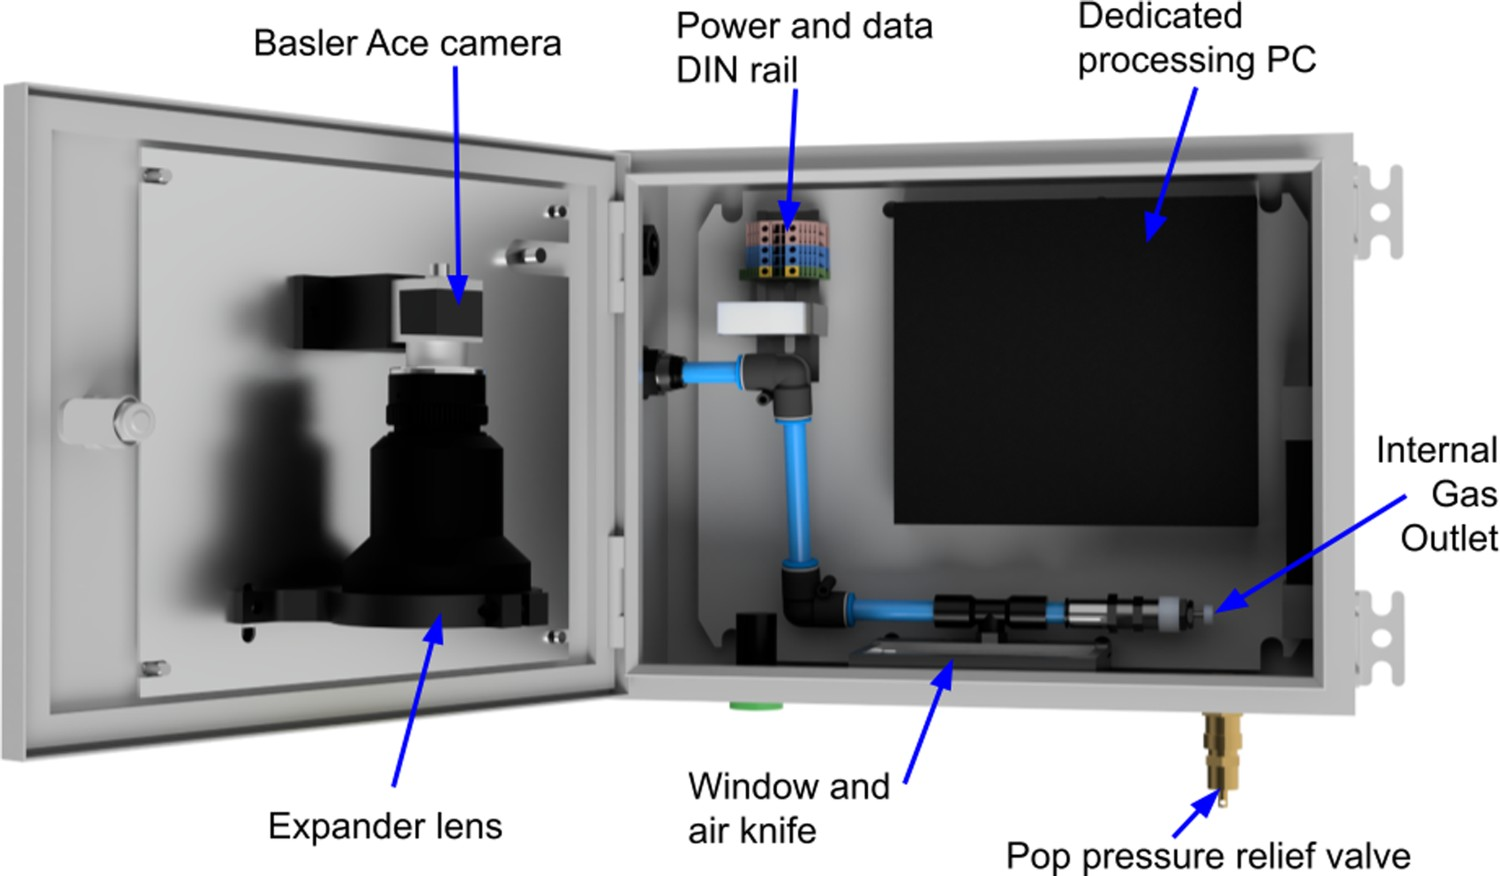
Owing to the large amount of airborne dust in the sinter plant environment, it was necessary to use an air knife [21] to keep the viewing window clear of optical contaminants via a stable laminar flow of inert gas. A custom air knife was modelled, its behaviour simulated with computational fluid dynamics and produced by computer numerical control machining. This was supplied by a filtered 1 bar nitrogen line, which was also exhausted into the enclosure interior, to create a positive internal pressure and further suppress dust ingress.
Local data processing was carried out on the dedicated computer, with data transmitted over a fixed local area network (LAN) connection: to the factory network and accessible on the site intranet. The instrument was deployed directly above the sinter output belt, with three 4750 lumen white-LED floodlights illuminating the belt, as shown in Figure 2. Power, nitrogen, and LAN were supplied by local installations, already present for other devices about the belt. Diagram showing the location, fixings and utilities of the on-site instrument location.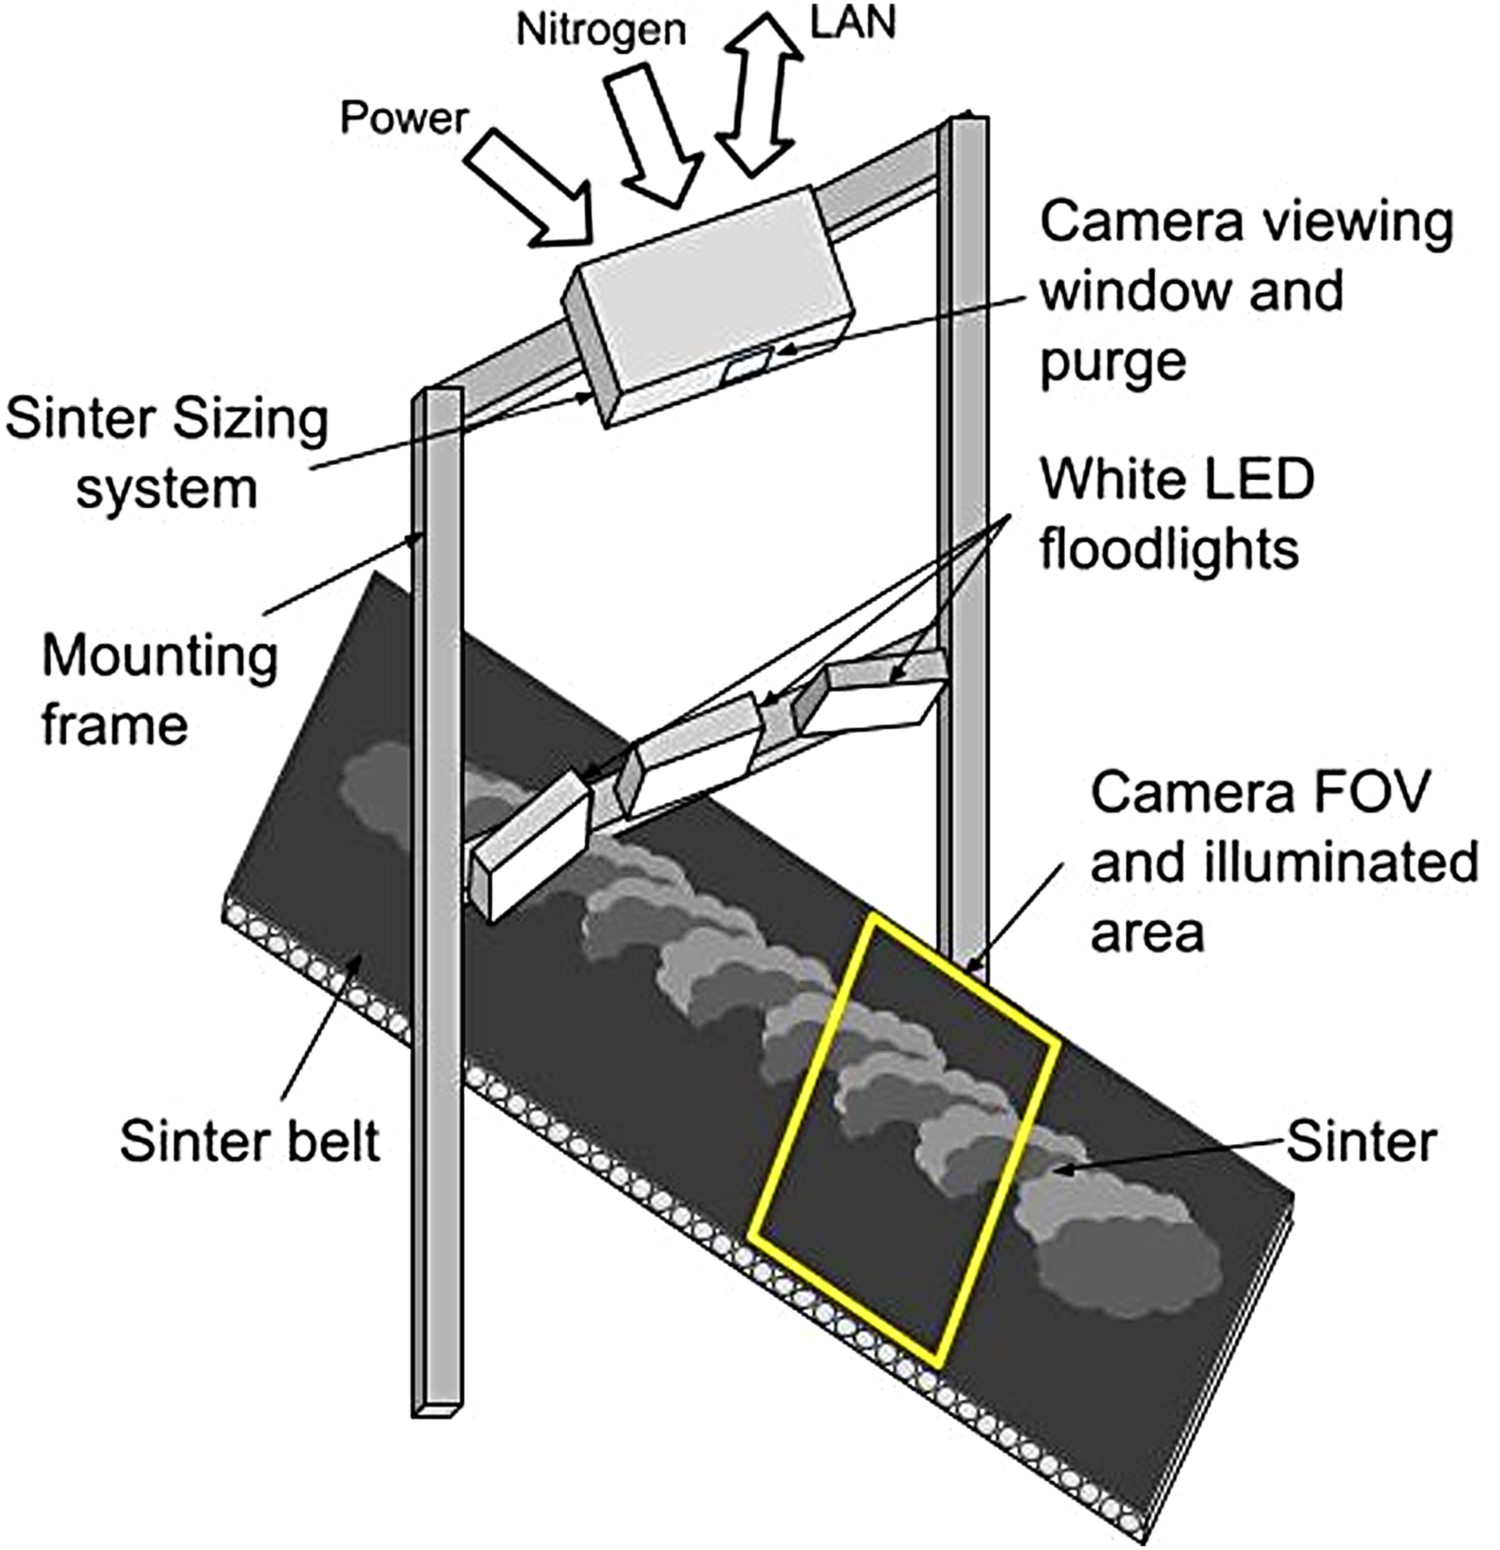
Image processing
The initial computational architecture was designed in MATLAB and transferred to C++ once successful preliminary tests were performed. This enabled a rapid and flexible prototyping stage, while ensuring a resilient product that could be deployed across a variety of systems in the future. A graphical user interface (GUI) was created using Python to allow for intuitive control and monitoring of the system.
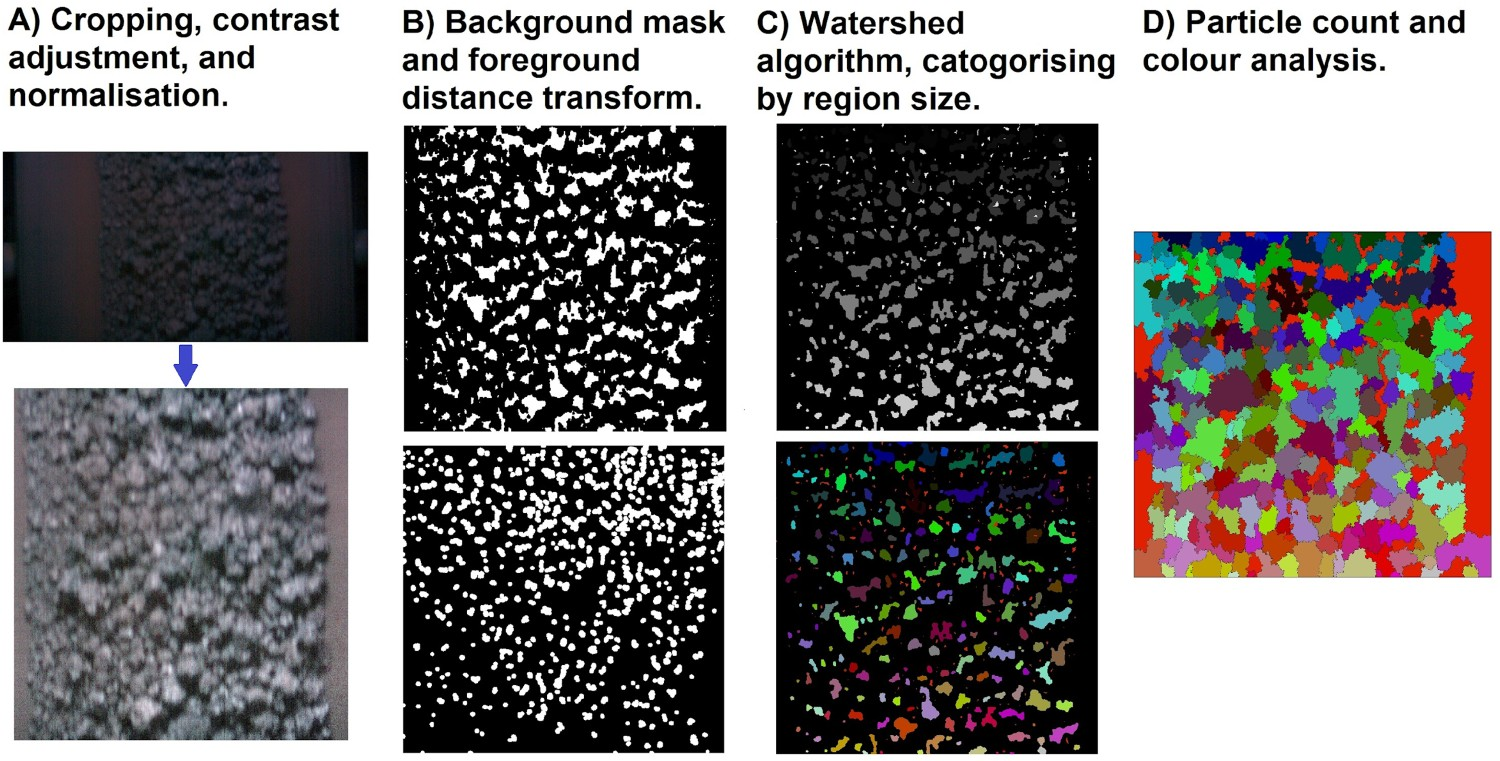
Each frame of the raw video was processed as per the following steps visualised in Figure 3: The image was cropped so that sinter occupied the full image frame. Colour space was converted from RGB to L*a*b* colour space, and the illumination source spectral bias was removed. The image was normalised to maximise the dynamic range and improve the performance of later processing. Spaces between sinter particles were detected via binerize thresholding [22]. A corresponding mask was then produced, upon which a distance transform was performed to find the lines of minimal signal. Foreground sinter particle areas in the image were detected via a series of topographical functions. A flat-maxima, which identified the shape of each sinter particle, was thus obtained. A watershed function [23] between the lines of minima and maxima regions obtained in step B was then performed, to obtain a region corresponding to the area of each foreground object. Objects were then grouped together by area and colour to form a category-of-size, for visualisation. Areas were converted from units of square-pixels to square-millimetres via distance-to-object calculations. Finally, the number of areas (particles) in each size category were exported and the average unbiased spectra of that frame was recorded. Visualisation of the image processing, corresponding to the steps described in Image Processing.
A series of 49 frames were averaged, to produce sets of measurements at a rate of 0.5 Hz; the averaging process reduced measurement noise. Results were then assembled with histogram binning imitating those produced by sieve measurement.
Calibration and characterisation
Initial testing and pre-configuration were carried out within laboratories at the University of Sheffield, using a sample of representative sinter material and the same illumination source installed at the steel mill. A series of images were captured with the sinter in a variety of randomised arrangements and then input into the processing algorithm.
While the laboratory pre-configuration provided convincing results, a calibration period was required, on-site, to refine the parameter settings: digitally removing environmental sources of error, such as the bias from non-primary light sources, and the effect of the conveyer in the image background. Furthermore, this calibration procedure plays a crucial role in correcting the effects of sample distribution in depth, which ultimately results in more representative and accurate data. The image analysis algorithm was calibrated to the Tata Steel sinter plant by halting the sinter production process and sampling particles from directly beneath the camera. This was repeated four times over the course of a day, to produce a statistically significant dataset.
This direct comparison of histograms from sieve sizing and from the camera allowed weighting of each histogram bin, to produce the most representative data. Bins corresponding to smaller sizes generally required higher weighting, due to the algorithm identifying them less readily. This bias was caused by the small pixel-value differences registered by particles imaged at or within the size of an individual pixel.
Results and discussion
Calibration
Figure 4 shows the results from on-site calibration, comparing sieve data, and laboratory calibrated camera data, for four samples. These results are from samples that were taken from directly below the camera; rather than from the usual sampling location within the process. The weighted proportion of sinter in each bin, with the camera data shown alongside the corresponding sieve results. Each subfigure (a–d) shows a different occasion where the sinter belt was stopped, with resultant percentages shown after calibration.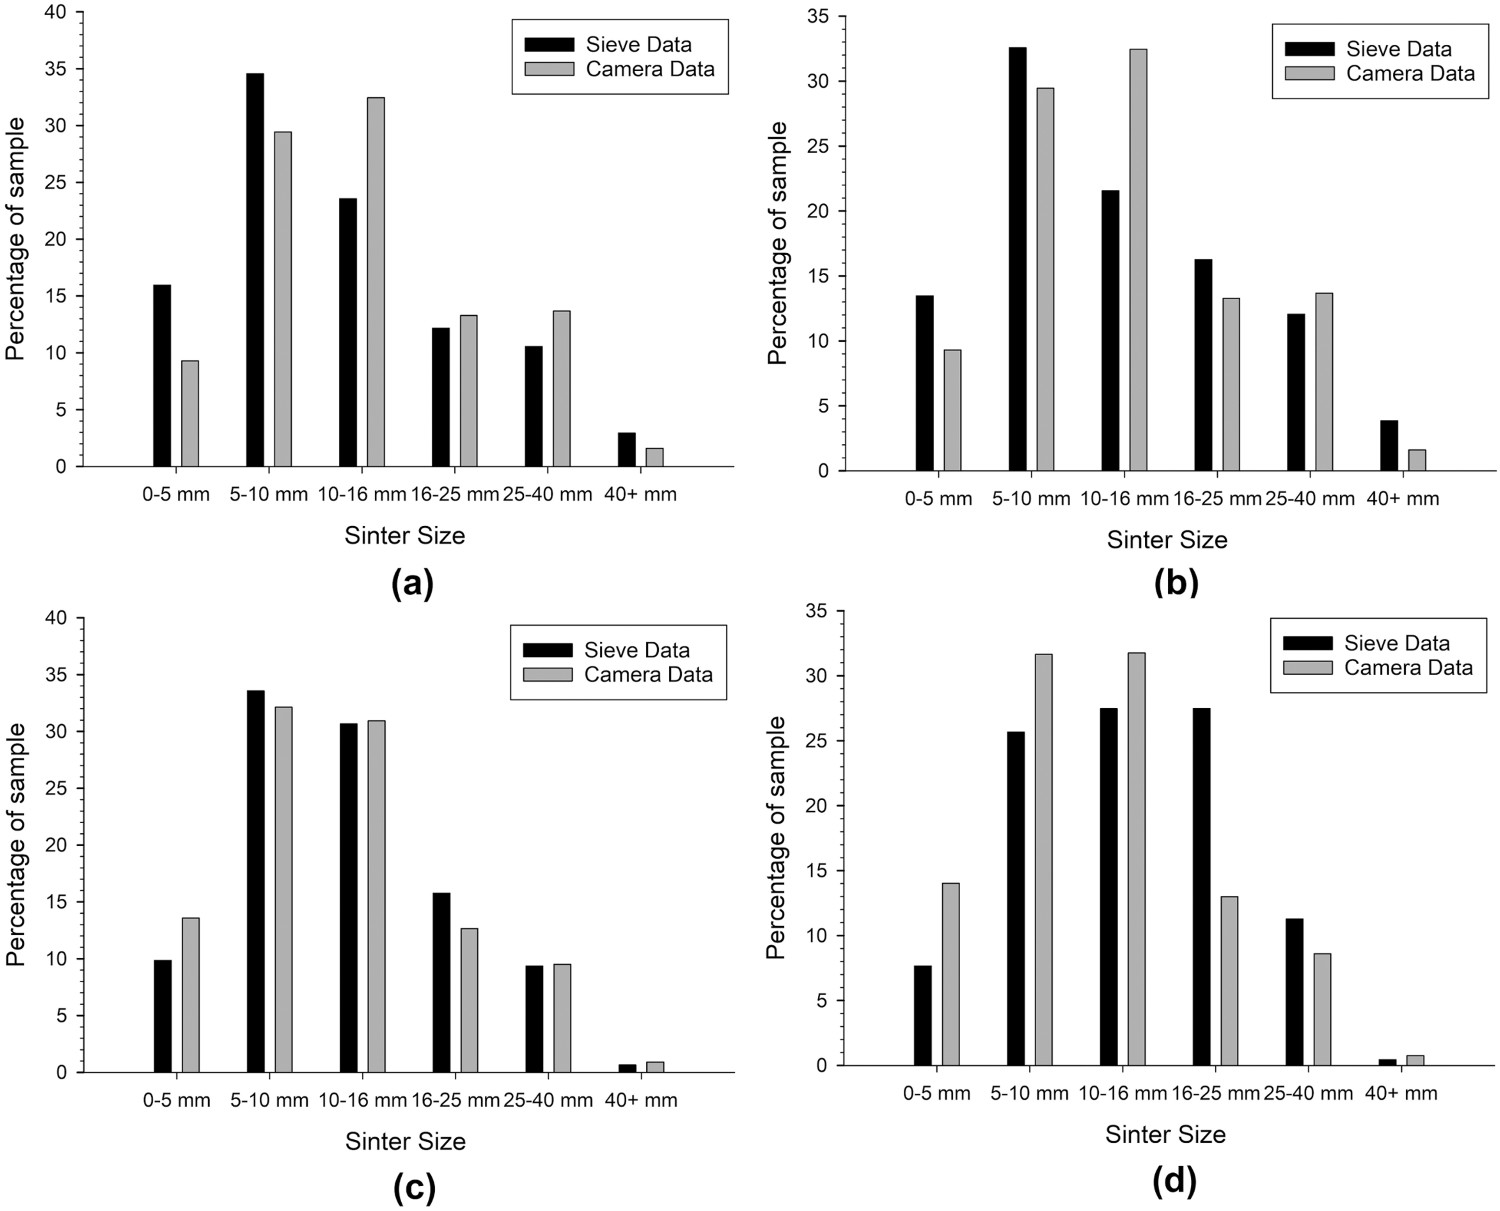
There is convincing correlation between the sieve data and the camera data for different bin sizes, for each of the four samples. The discrepancies for the 0–5, 25–40, and 40+ mm bins were attributed to a bias in the size of sinter on the top layer of the belt, via the ‘brazil nut effect’ [24]. There is also some algorithmic bias introduced, especially in the 0–5 mm bin, where smoothing induced by the topographical functions may obscure smaller areas. Sinter breakdown during sieve testing may also lead to a skewed proportion of smaller sizes measured.
Initial on-site testing
In order to assess the performance of the camera once calibrated on-site, a continuous measurement was performed over a 3-day period. Figure 5 shows the mean sinter size measured using the camera, alongside the discrete sieve measurement data points. Included within this graph are the sieve measurements taken over this period, at their approximate time of collection. The mean size obtained with the calibrated sinter sizer over three days, alongside the data obtained by manual sieve analysis at its recorded time of collection.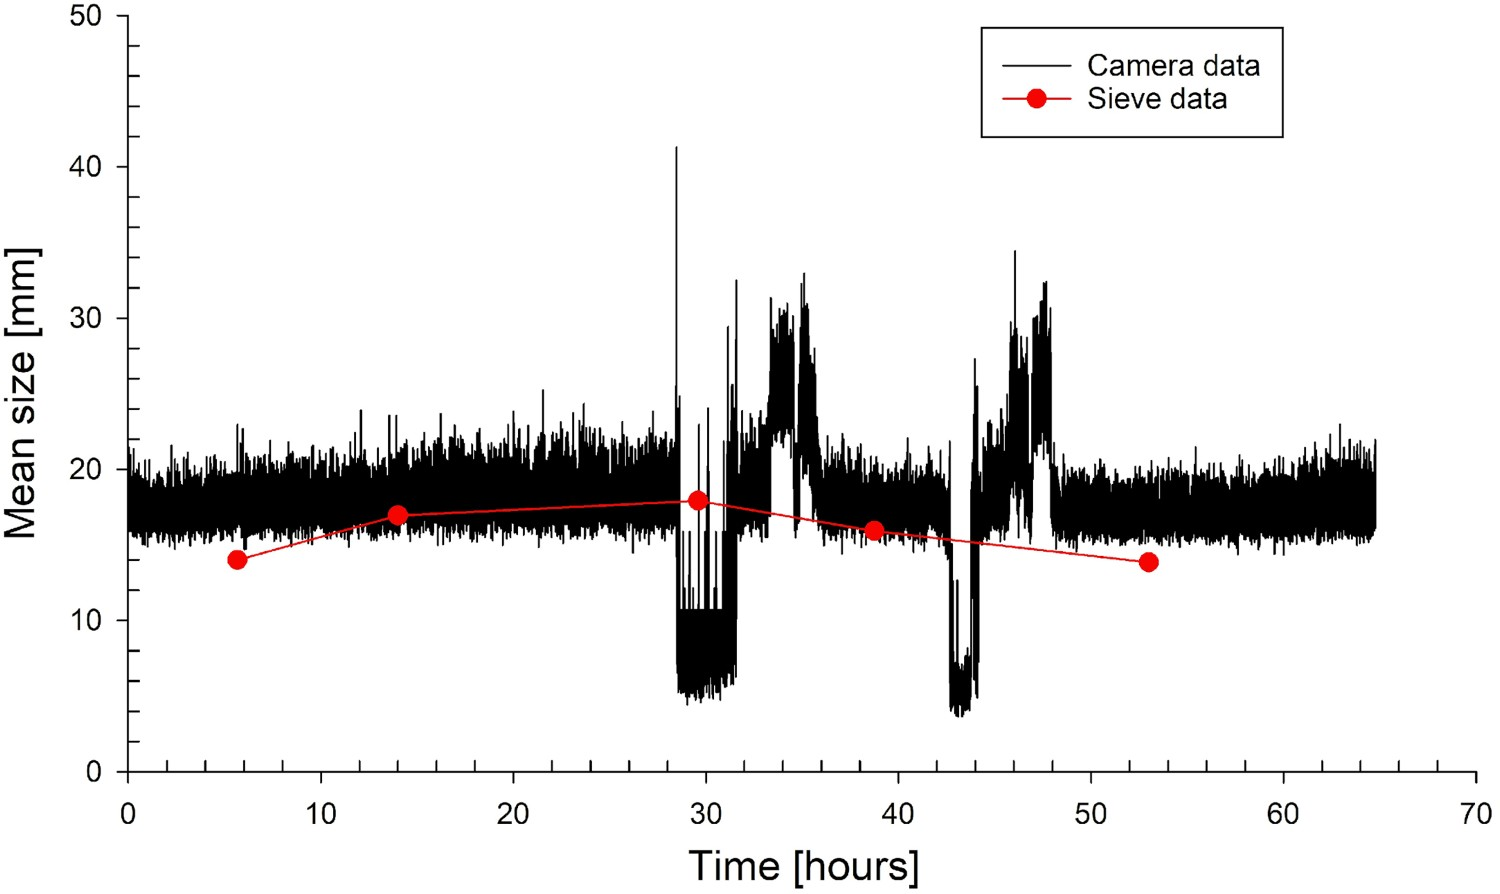
It can be observed that, while the unaveraged measurements from the camera are relatively noisy, the sieve data are largely located inside the envelope of the camera measurements with average sinter size between 12 and 18 mm. We have attributed the apparent noise in the measurement to true, rapid variations in the size of particles in the timescale of seconds. We also find that sieving measurements can sample the noise that sometimes coincides with its peaks and troughs, as can be seen in Figure 5. This measurement was verified by repeating the algorithm using the same images; the algorithm reported the same value each time.
The data shown in Figure 5 illustrate the key benefit of the sinter sizing camera approach: measurements are performed continuously. The sinter sizing camera is able to detect trends within the measurement of the sinter size, which are not detected by the low-interval discrete sieve measurements. The sparse sampling of the sieve measurements can also create false trends, as seen in the apparent curve in Figure 5. Additionally, size data can be accurately timed and the image re-analysed, whereas there is significant uncertainty as-to the exact timing and location of the sieve samples collection; operator error potentially playing a significant role. Therefore, an incorrect conclusion regarding the size of the sinter at the logged time can be made when using the sieve approach. This timing limitation is overcome by the use of the continuous measurement approach of the sinter sizing system.
The proportion of sinter in each of the size bins, for both the sinter sizer and from the sieve sampling, is shown in Figure 6. For the majority of the measurement duration, the distribution of sinter is constant in all bins, with broad agreement between both methods. The weighted and calibrated sinter sizer outputs against sieve measurement data, for each of the six bin sizes, over the initial three-day analysis period. Each subfigure (a–f) shows one of the sinter size bins used by the system.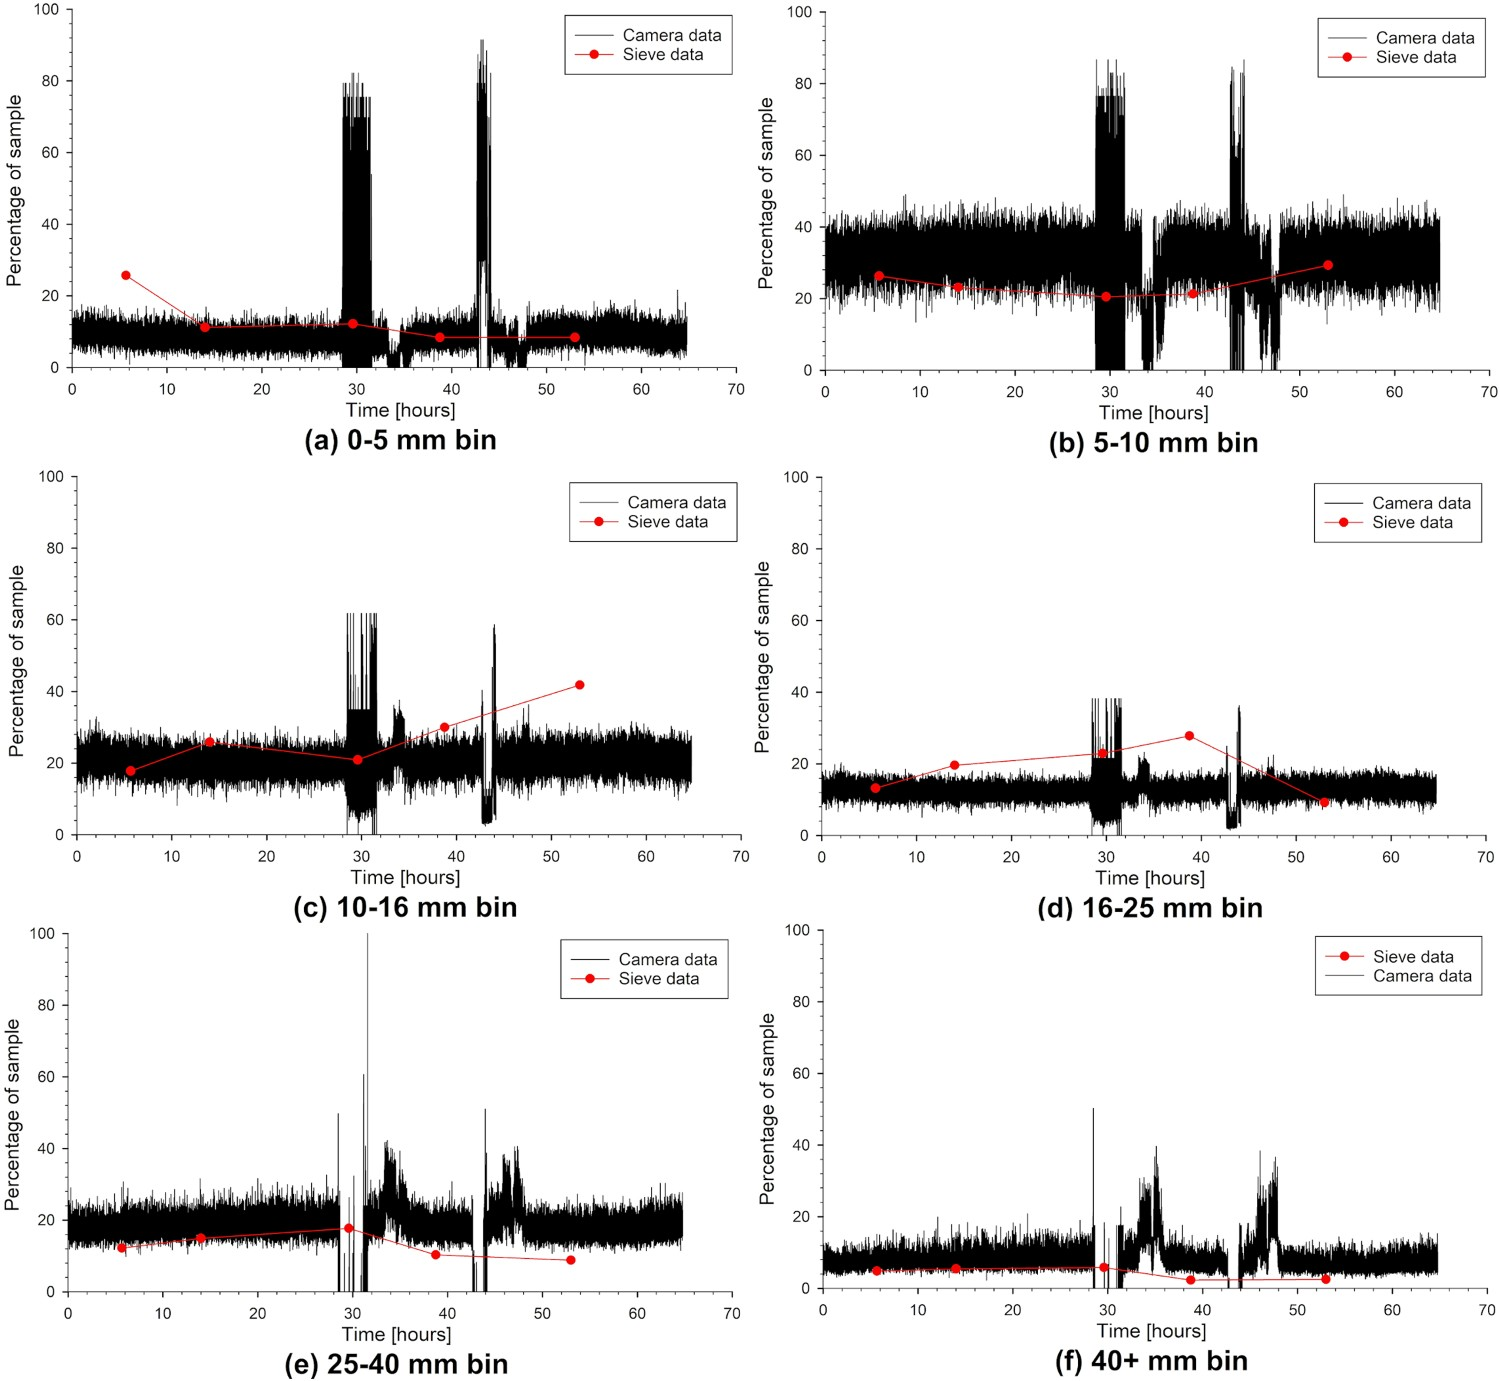
One key feature visible in the sinter sizer data, shown in Figure 6, is an inverse relationship between the proportion of small-sized sinter and that of larger-sized sinter. Over two periods around hours 30 and 45, a similar disturbance occurs in the two smallest bins, the reciprocal disturbance occurs in the two largest bins, while the data for the 10–25 mm sinter is unsettled. Since the instrument remained constant over the test period, these perturbations are likely to be due to real-world effects present in the sinter plant. The interpretation of this being that during those periods, production was affected such that the sinter size was biased to be smaller or larger. This was reinforced by the shape of the perturbations: where sinter size reduced for a period, rose significantly for a period, and then returned to a stable level. This would be explained by changes in the process control variables, with initial over-compensation before equilibrium was restored. Other possibilities include the presence of unusual levels of dust in the sinter plant; unreported technical issues; or disturbance to the distribution of sinter on the belt. Though this effect is not visible in the sieve data, this has a high likelihood of being due to no samples being collected during the periods of improper production, further highlighting the need for continuous control data.
Validation
After the initial testing and calibration period, an extended 3-month validation period was undertaken at Port Talbot, with bin-segregated data shown in Figure 7. This ensured that the system's performance was stable and accurate over a wide range of conditions, and that the mechanical design was suitable for long-term operation. Three months of sinter size validation data, showing continuous camera measurements alongside the sieve measurements taken over the same period. Each subfigure (a–f) shows one of the sinter size bins used by the system.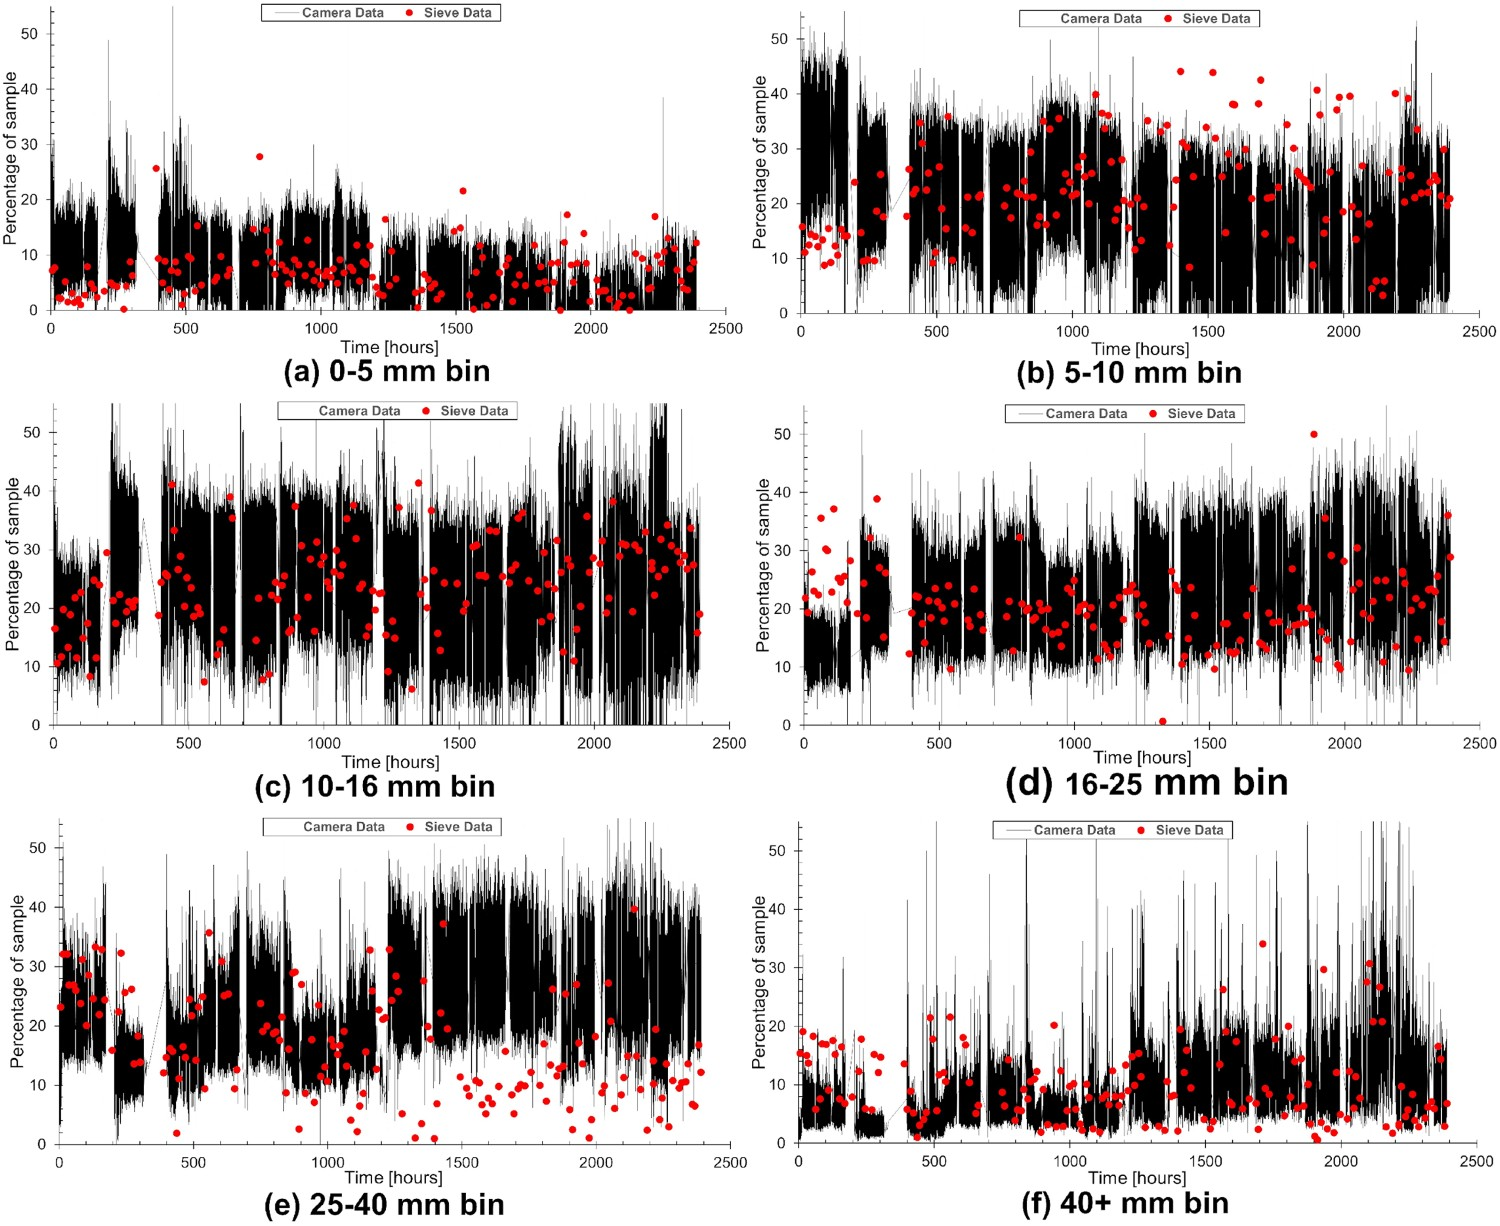
The resulting mean size of sinter, and corresponding percentage difference in measurement, is shown in Figure 8. This shows the good agreement between the sieve and camera measurements, despite the high degree of variability in mean size obtained from sieve measurement. The average percentage difference is 18.8%. Three months of sinter size validation data, showing the 49-point rolling average of the camera measurements against Tata sieve measurement data. Subfigure (a) shows the mean sinter size obtained by each method at the times of sieve sample collection. Subfigure (b) shows the percentage difference between the sieve and camera measurements, at the times of sieve sample collection.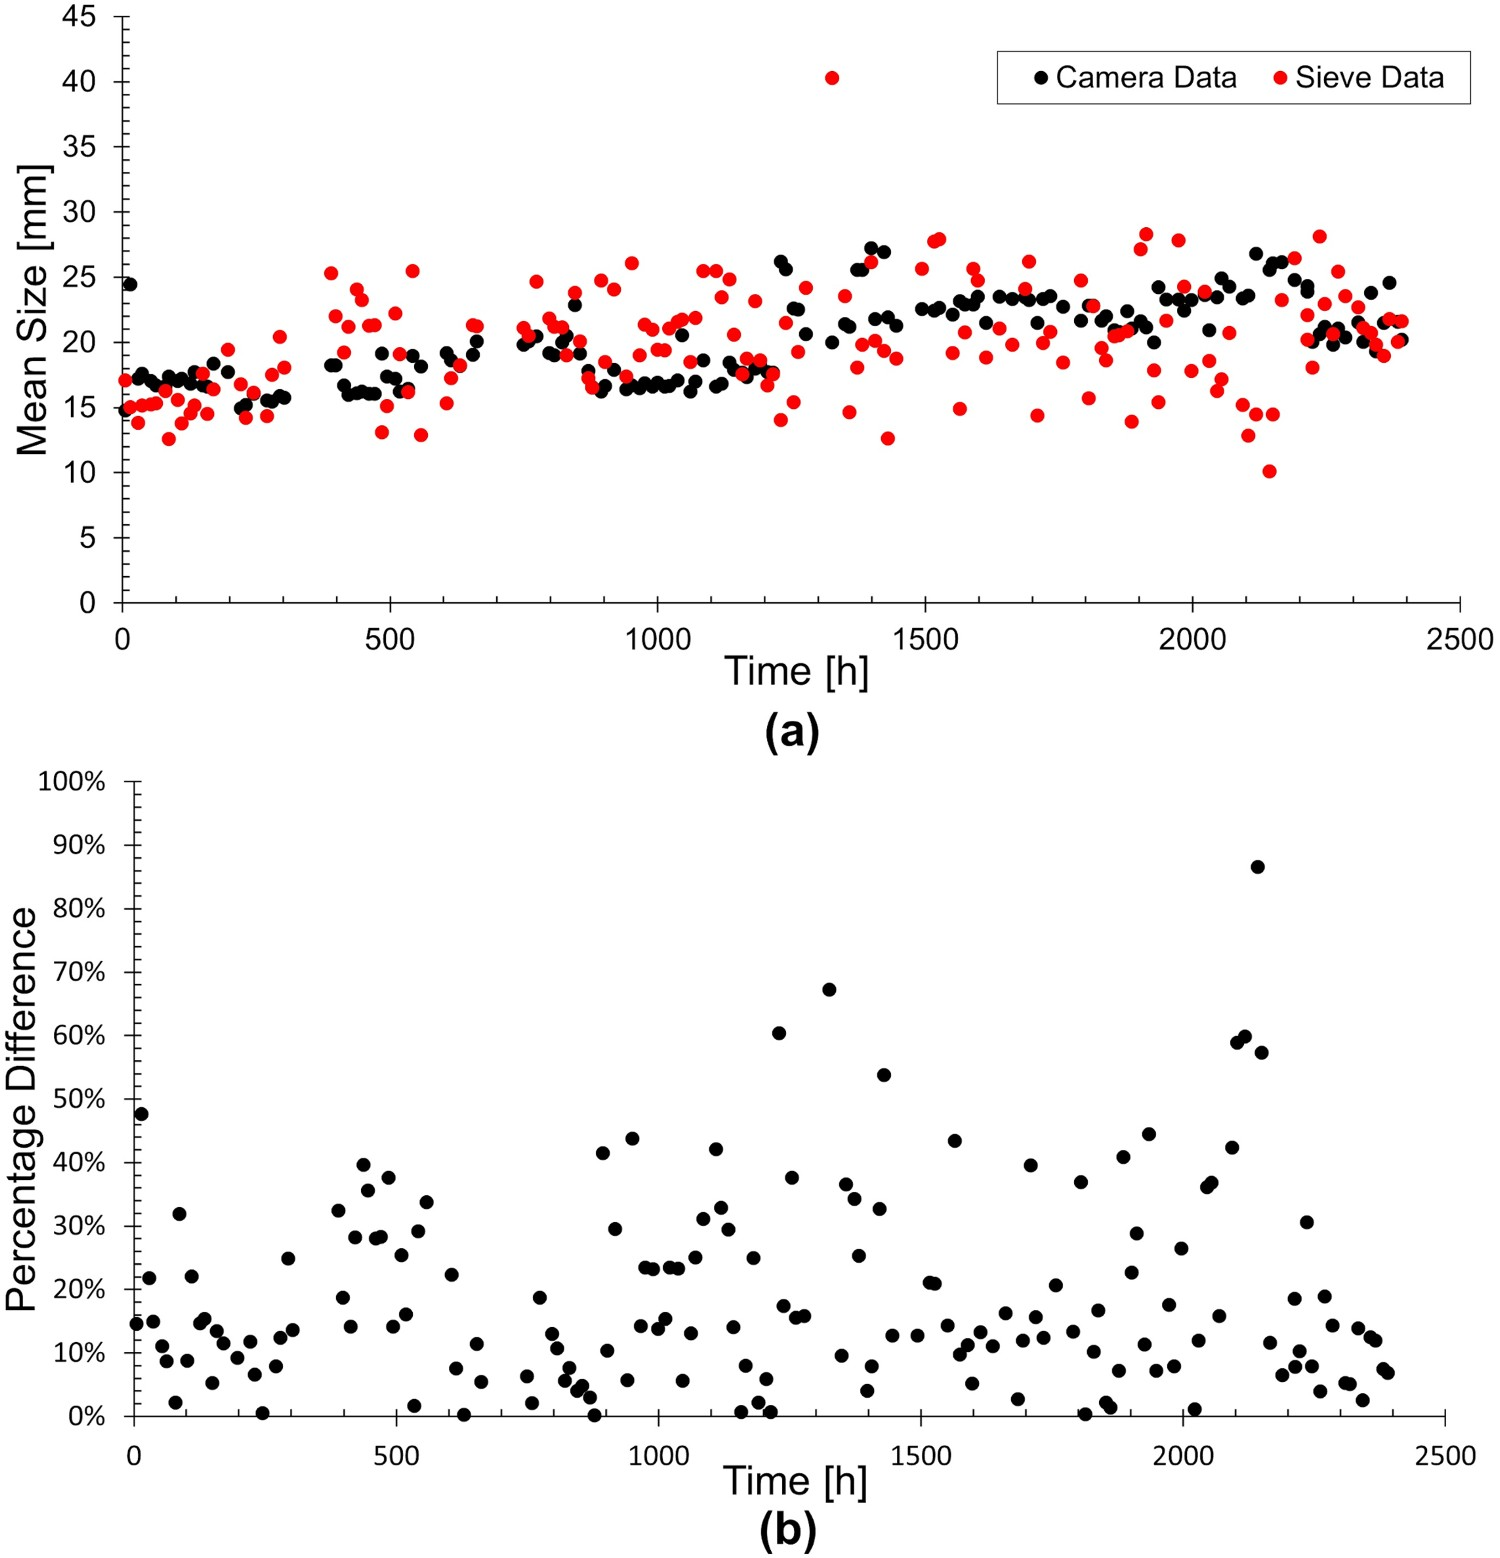
The validation period successfully demonstrated the system’s efficacy, with strong correlations between sieve and camera measurements in broad agreement at almost all times. The size distribution of the sinter over the validation period was generally constant, but there are distinctive features visible in the resulting dataset which require further analysis.
There are several periods of anomalous production where the general equilibrium in size proportions is disturbed. These are most prominent in periods where size is biased significantly towards smaller particles, and then briefly towards larger particles before equilibrium is restored. This corresponds to real fluctuations in production, as was confirmed by discussion with Tata Steel, where disturbances in supply or process control were present and required correction.
It is notable that only some of these major disturbances are visible in the sieve data, with some sieve data points timestamped as being collected during a disturbance not showing the feature, and other points showing the disturbance being chronologically offset from the camera data. This highlights the aforementioned issues with discrete size measurements, where major features can be unsampled, and also with manual sample collection which introduces significant error in time and location of data points. The use of our sinter sizing system allowed immediate response to these disruptions. Indeed, it can be seen that towards the end of the validation period, Tata began to respond to the systems output, and restored equilibrium more quickly. This will be aided in future with a software alarm notification system.
Very short period disturbances are also visible in the data, especially before averaging in Figure. 7, where proportions are widely disturbed over short periods of a few minutes. These are unlikely to be caused by process control issues, though such short-term issues can occur, and are more likely to be due to temporary anomalies in the sinter sizer systems analysis. When this raw data is smoothed with a suitable rolling average filter, these short-term fluctuations are eliminated and the resultant data correlates well with sieve data.
One notable observation, especially visible in this 3-month validation data, is that the bins for smaller sizes generally have sieve proportions higher than the camera, while the larger sizes have a smaller proportion in the sieve measurements. While the aforementioned algorithmic bias towards detection of large particles may play a role in this, it may also be indicative of the mechanical breakdown on sinter during the process of sample collection and sieve measurement.
Conclusions
We have introduced a cost-effective and networked optical sinter sizing system that provides a continuous, accurate measurement of ferrous sinter size. The collected sizing data is in good agreement with the existing sieve measurement approach, producing an average percentage difference over a 3-month period that was well within process requirements. The system operates at a sample rate of 0.5 Hz with an approximate delay of 5 s on data accessibility, providing a transformational improvement on the lab-sieving technique commonly used and the ability to respond rapidly to changes in sinter size.
The system employs both engineered and off-the-shelf parts and established algorithmic image analysis techniques, applied successfully on a functioning sinter plant for minimal cost. This novel application of machine vision, to the collection of Iron and Steel control data, also has potential elsewhere within steelmaking, such as conveyors for blast furnace burdening.
Implementation of this system in a sinter plant will allow faster process control response to mis-sized sinter, and the detection of any disturbances in size shorter than the existing sieve sample collection frequency. Plant operators can then adjust process control variables for, or perform required maintenance on, key machinery like the sinter crusher or screening beds. This will lead to improved process efficiency, improved quality of blast furnace burden, and lead to a reduction in both production cost and greenhouse gas emissions.