
Abstract
A holistic assessment of inclusions present within a cold rolled DP800 steel was performed. The assessment comprised a variety of methods including optical microscopy and image processing, alongside quantitative, statistical analysis. The ‘statistics of extreme values’ approach was applied, utilising outputs from microstructural analysis. A qualitative analysis followed via the use of SEM and EDS to determine the morphologies and compositions of inclusions within the material. This has allowed for cross-coil examination; identifying the variation in behaviour of inclusions through the width of a cold rolled strip, which can be correlated with slab solidification as well as final product performance. This understanding is also critical in informing sample extraction for microstructural characterisation and mechanical property assessments. The research has provided an accelerated methodology of inclusion analysis that can be applied to DP800 effectively, allowing for manufacture-microstructure relationships to be determined.
Introduction
Due to the composite nature of their microstructure, dual-phased steels are found to behave heterogeneously during deformation. Current research shows that the failure mechanisms found within as-rolled material often correlates with the microstructural heterogeneity and the processing defects that can arise during manufacture [6]. These defects can include micro-voids or inclusions which are generally comprised of foreign particles or segregated elements which can often be traced back to the solidification of the steel. Inclusions can be further dispersed into the material during the hot-rolling stage and can lead to the initiation of voids which can further develop into cracks [7]. When inclusions affect the production capacity, mechanical properties, or overall quality of a rolled steel to a significant extent, inclusion control must be introduced to either prevent or facilitate the removal of inclusions. Therefore, the quantification and understanding of the formation of inclusions and their influence on the microstructure is key to the optimisation of processing parameters in the production of cleaner, higher quality materials.
Inclusion formation and analysis methods
Formation of inclusions during steel processing
Non-metallic inclusions (NMI’s) provide a considerable degree of control over the microstructural features of a rolled steel [2,7]. According to their origin, inclusions may be classified as either exogeneous or endogenous. Exogenous inclusions occur by erosion/corrosion of materials associated with the steelmaking process, such as refractories, slag or glaze which become entrapped within the material during manufacture. Exogenous inclusions tend to be larger in size, containing CaO or MgO and can act as stress concentrators in the final steel product [8]. Endogenous inclusions are those which are formed during deoxidation and/or desulphurisation processes, reoxidation of the melt and due to precipitates, that form during the subsequent cooling and solidification of the melt. Here, elements with an affinity for oxygen form non-metallic deoxidation products when added to the liquid steel, leading to the formation of oxide NMI’s upon reoxidation, such as alumina or silica-based inclusions. The alternative is non-metallic sulphide inclusions, which are formed with elements having a poor solubility in iron – such as calcium and magnesium. A mixture of both oxide and sulphide inclusions are also known to form, termed complex inclusions [9]. The typical appearance of four principal inclusion types, witnessed in hot rolled steels when observed via optical microscopy, is shown in Figure 1. Here, (a) shows the formation of a ductile elongated inclusion, (b) is a brittle-broken inclusion, (c) a brittle-ductile complex inclusion, and (d) an undeformed inclusion with deformed sulphide ‘tails’ [10,11]. Types and morphologies of inclusions found within conventional rolled steels through optical microscopy. Polished, un-etched surface finish. [11].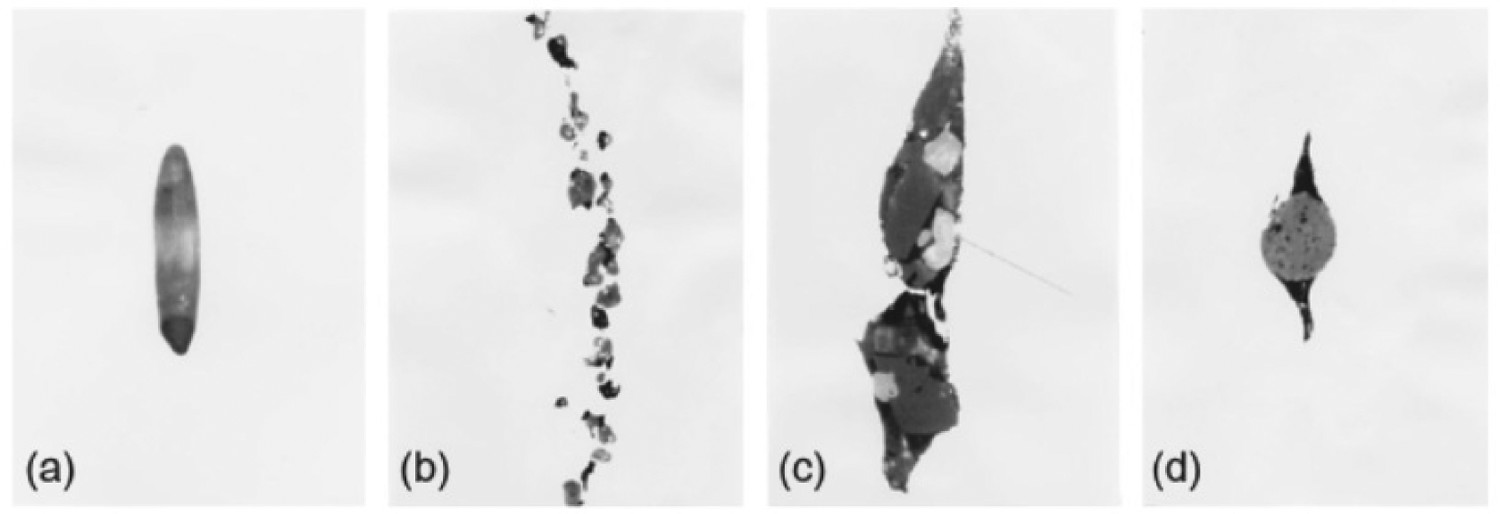
Relationships between inclusion population and mechanical properties within carbon steels have been extensively researched, with the fatigue strength, tensile properties, impact resistance and corrosion properties of many advanced high strength steels often being predicted from the inclusion morphology [12]. Parameters such as size, shape, position within the microstructure and composition can influence the fatigue strength properties of a material. Studies agree that the principal parameter in determining the fatigue strength is the characteristic inclusion length, which provides a threshold at which fatigue crack propagation occurs [12–14]. Inclusions of lengths between 50 and 100 µm have been found significantly reduce the fatigue life of carbon steels, and thus must be avoided [9]. Although length has been reported to be the dominant inclusion parameter influencing material properties, Monnot et al., proposed a ‘Harmful Index’ model, suggesting that inclusion composition is also a key contributory factor, with CaO-Al2O3 inclusions of a larger diameter (>15 μm) to be the most ‘harmful’ [13]. General agreement amongst sources claims that NMIs provide pitting sites for the initiation of corrosion. Sulphide inclusions in particular have been found to act as corrosion initiation sites in carbon steels, whereas oxides are not found to have an adverse effect in this case. Both the compositions and shapes of sulphide inclusions effect the nature of the corrosion product. Experimental studies found spherical sulphides to have a lower solubility compared to broken/elongated inclusions of the same compositions, providing an easier route for pitting [7,15,16].
In terms of processing, if the plasticity of the inclusion is less than that of the ferritic matrix, stresses develop during hot and cold rolling. Following this, possible decohesion of the inclusions and surrounding microstructure may occur, leading to crack initiation at the inclusion-matrix interface [13,15]. The plasticity of inclusions depends upon both their composition and the temperature at which rolling is performed. Manganese sulphides readily deform during the rolling of steel and form stringers, shown in Figure 1(b), which drastically reduces properties such as tensile strength of the material transversally or through-thickness, dependant on the direction of roll. This also adversely affects the ability of the material to undergo further deformation [17,18].
Analyses of inclusions
The study of inclusions within a material has been widely researched, with numerous methods proposed and utilised to assess and quantify inclusions, typically increasing in complexity as the material volume increases. Parameters such as size, shape, composition, and morphology have been assessed in various alloy systems to categorise inclusions [19,20]. The Jernkontoret system has historically been employed to visually categorise inclusions based on their appearance alone, however recent studies now demand a more holistic approach [18]. An updated, sophisticated method that classifies inclusions by their characteristic lengths into A-H groupings has been developed, which is now employed by ASTM E2283-08 [21]. Other standards, such as ASTM E-2142-01, ISO 4967: 1998, and BS EN 10247:2007 exist to characterise inclusions, ranging mainly in terms of the classification categories used. The categories differ in the influential parameter used for classification such as the maximum length, morphology and composition of the inclusions. Numerous microscopy/spectroscopy approaches may be used to conduct physical inclusion analysis, including but not limited to optical microscopy, scanning electron microscopy (SEM) and energy dispersive spectroscopy (EDS). The combination of image processing alongside microscopy techniques allows for particle data analysis of inclusions to be conducted.
Statistical approaches for inclusion analysis
Several authors agree that the greatest limitation in inclusion analysis is presented by the volume of the material, whereby the analysis of large volumes (such as those in an integrated steel plant) is non-feasible due to the significant time and resource required [19]. To overcome these drawbacks, statistical methods have been developed. The adoption of a statistical approach to determine the critical inclusion size was first introduced by Murakami [20]. Following this seminal paper, several refinements have been proposed to produce a method that is deemed accurate amongst the scientific community; this is referred to as the ‘statistics of extreme values method’ (SEV). This method allows for the maximum characteristic length of an inclusion to be determined within a large volume of material by analysing smaller polished sections. The method has since evolved, undergoing developments by Murakami and others to exploit the full potential of the method, and has been standardised via the American Society for Testing and Materials (ASTM), E2283-08 [21–25].
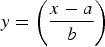
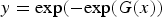
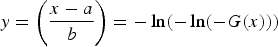
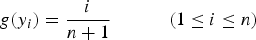
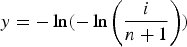
The principle of SEV is to accurately estimate the tail of a distribution, when analysing a set of independent data from an unknown distribution. In the context of inclusion analysis, the method involves measuring the maximum size of inclusions in randomly selected areas of equal unit area. The concept of the extreme value theory upon which SEV is based, is that when a fixed number of data points following a basic distribution are collated, the maxima and minima of each of these sets also follow a distribution which is different from the conventional (such as normal, exponential, logarithmic) [20]. The Gumbel distribution function is: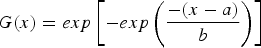


In terms of the present work, no current studies were found to explore the presence of inclusions within a dual-phase steel. In addition, whilst previous works reported the critical length of inclusions within various steel sections, none were found to investigate the inclusion distribution across the coil width of an as-rolled section of material. Correlations between process metallurgy, physical metallurgy and steelmaking processes have been reported as an essential requirement in driving future progress in steel and in influencing final product performance, and as such, this paper aims to relate the processing parameters of a cold rolled dual phase steel to present inclusion lengths and distributions. Furthermore, the output of this work is of particular interest when considering coil sample extraction for the determination of mechanical properties and the relationship between sample position within the coil and inclusion distribution. Both a quantitative and qualitative assessment will be conducted, analysing the influential inclusion parameters using experimental analysis and application of the statistical methods discussed.
Materials and methodology
Materials
Mechanical (tensile) properties of as-received cold rolled DP800.
Chemical composition of as-received cold rolled DP800 (wt%).
Prior to analysis, the sheet was first reduced to a width of 1000 mm to minimise any edge effects, and was then processed further into manageable, laboratory size samples, as illustrated in Figure 2. A central section of the coil was selected for sampling, reduced into 100 mm×100 mm sections and labelled 1–10 indexing the sample position across the coil. These sections were further divided into four sub-samples (labelled A–D) to allow for handling during surface preparations and microscopy. Only samples 1–10 ‘B’ were selected for this study, while others maintained for future research. Samples were cut using a guillotine to minimise the effect of heat, work and contamination that occur during conventional machining. Sample cutting and identification plan, from as-received full-sized sheet to individual sample geometries.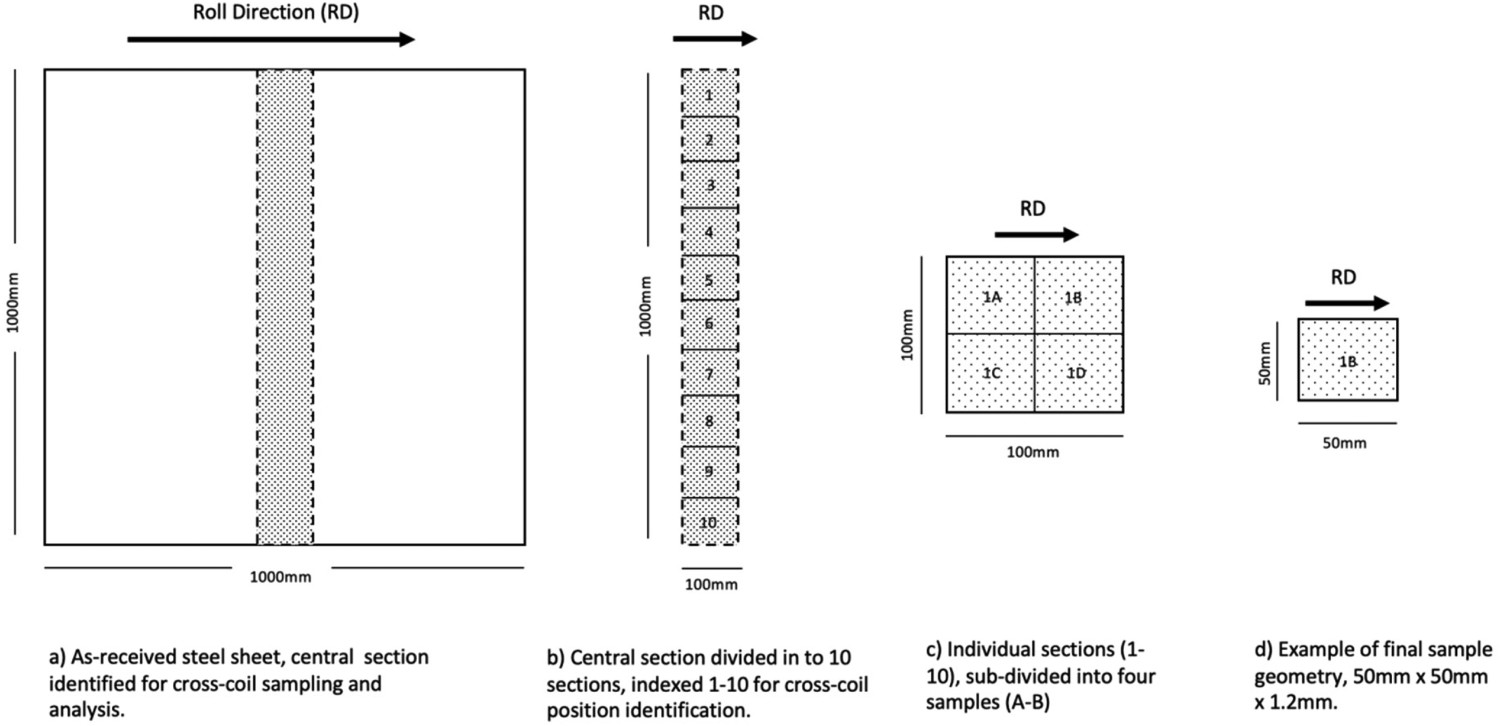
The 50 × 50 mm samples were individually ground and polished using a Struers LaboPol-5 metallurgical grinder. SiC papers were used to achieve a final grit of 1200 before being sequentially polished to a 1 
Microscopy
For inclusion analysis, optical microscopy was conducted using a ZEISS Primotech digital metallurgical microscope. All samples (1-10B) were analysed at a magnification of 5X and images captured a 25 × 25 mm surface area for subsequent image processing. To understand inclusion interaction with microstructure and phases, as well as local chemical composition, selected samples underwent higher magnification SEM analysis using a ZEISS EVO LS25 SEM, equipped with Oxford Instruments X-Max EDS detector. Imaging was conducted employing backscatter mode to provide good microstructural contrast.
Image processing and analysis
Analysis of optical images was conducted using ImageJ, a java-based image processing software, well suited to the quantification of particles such as inclusions through calculating area and pixel value statistics of user-defined selections. For each sample, images were opened within ImageJ (Figure 3(a)) and calibrated to correlate the dimensions from scale bar to pixel count by selecting the ‘Analyse → Set Scale’ command (Figure 3(b)). To allow for repeatability of analysis between samples, both directional coordinates were set to 0 (Figure 3(c)). The images were then converted to greyscale via ‘Image → Type → 8-bit’ and the scalebar was removed such that it was not incorporated into the particle analysis. The software requires the image to be in binary format to enable interpretation of features and as such ‘Image → Adjust → Threshold’ was first selected and the threshold was set such that only the features of interest (the inclusions) were visible in black (Figure 3(d)). Figure 3e shows the correct level of thresholding for a sample of this nature and this was used as a reference for the process when analysing other samples. ‘Process → Binary → Make Binary’ was then selected to finalise conversion of the image to a binary one. Finally, to perform analysis of the inclusions, ‘Analyse → Analyse Particles’ was selected and to display the results as required, the ‘Overlay’ function was selected, along with the ‘Display Results’, ‘Clear Results’ and ‘Summarise’ options checked (Figure 3(f)). Results were then displayed as shown in Figure 3(g–h), whereby data can be exported and tabulated in MS Excel (or similar) for statistical analysis. (a)-(h) – ImageJ optical microscopy image processing steps for inclusion analysis.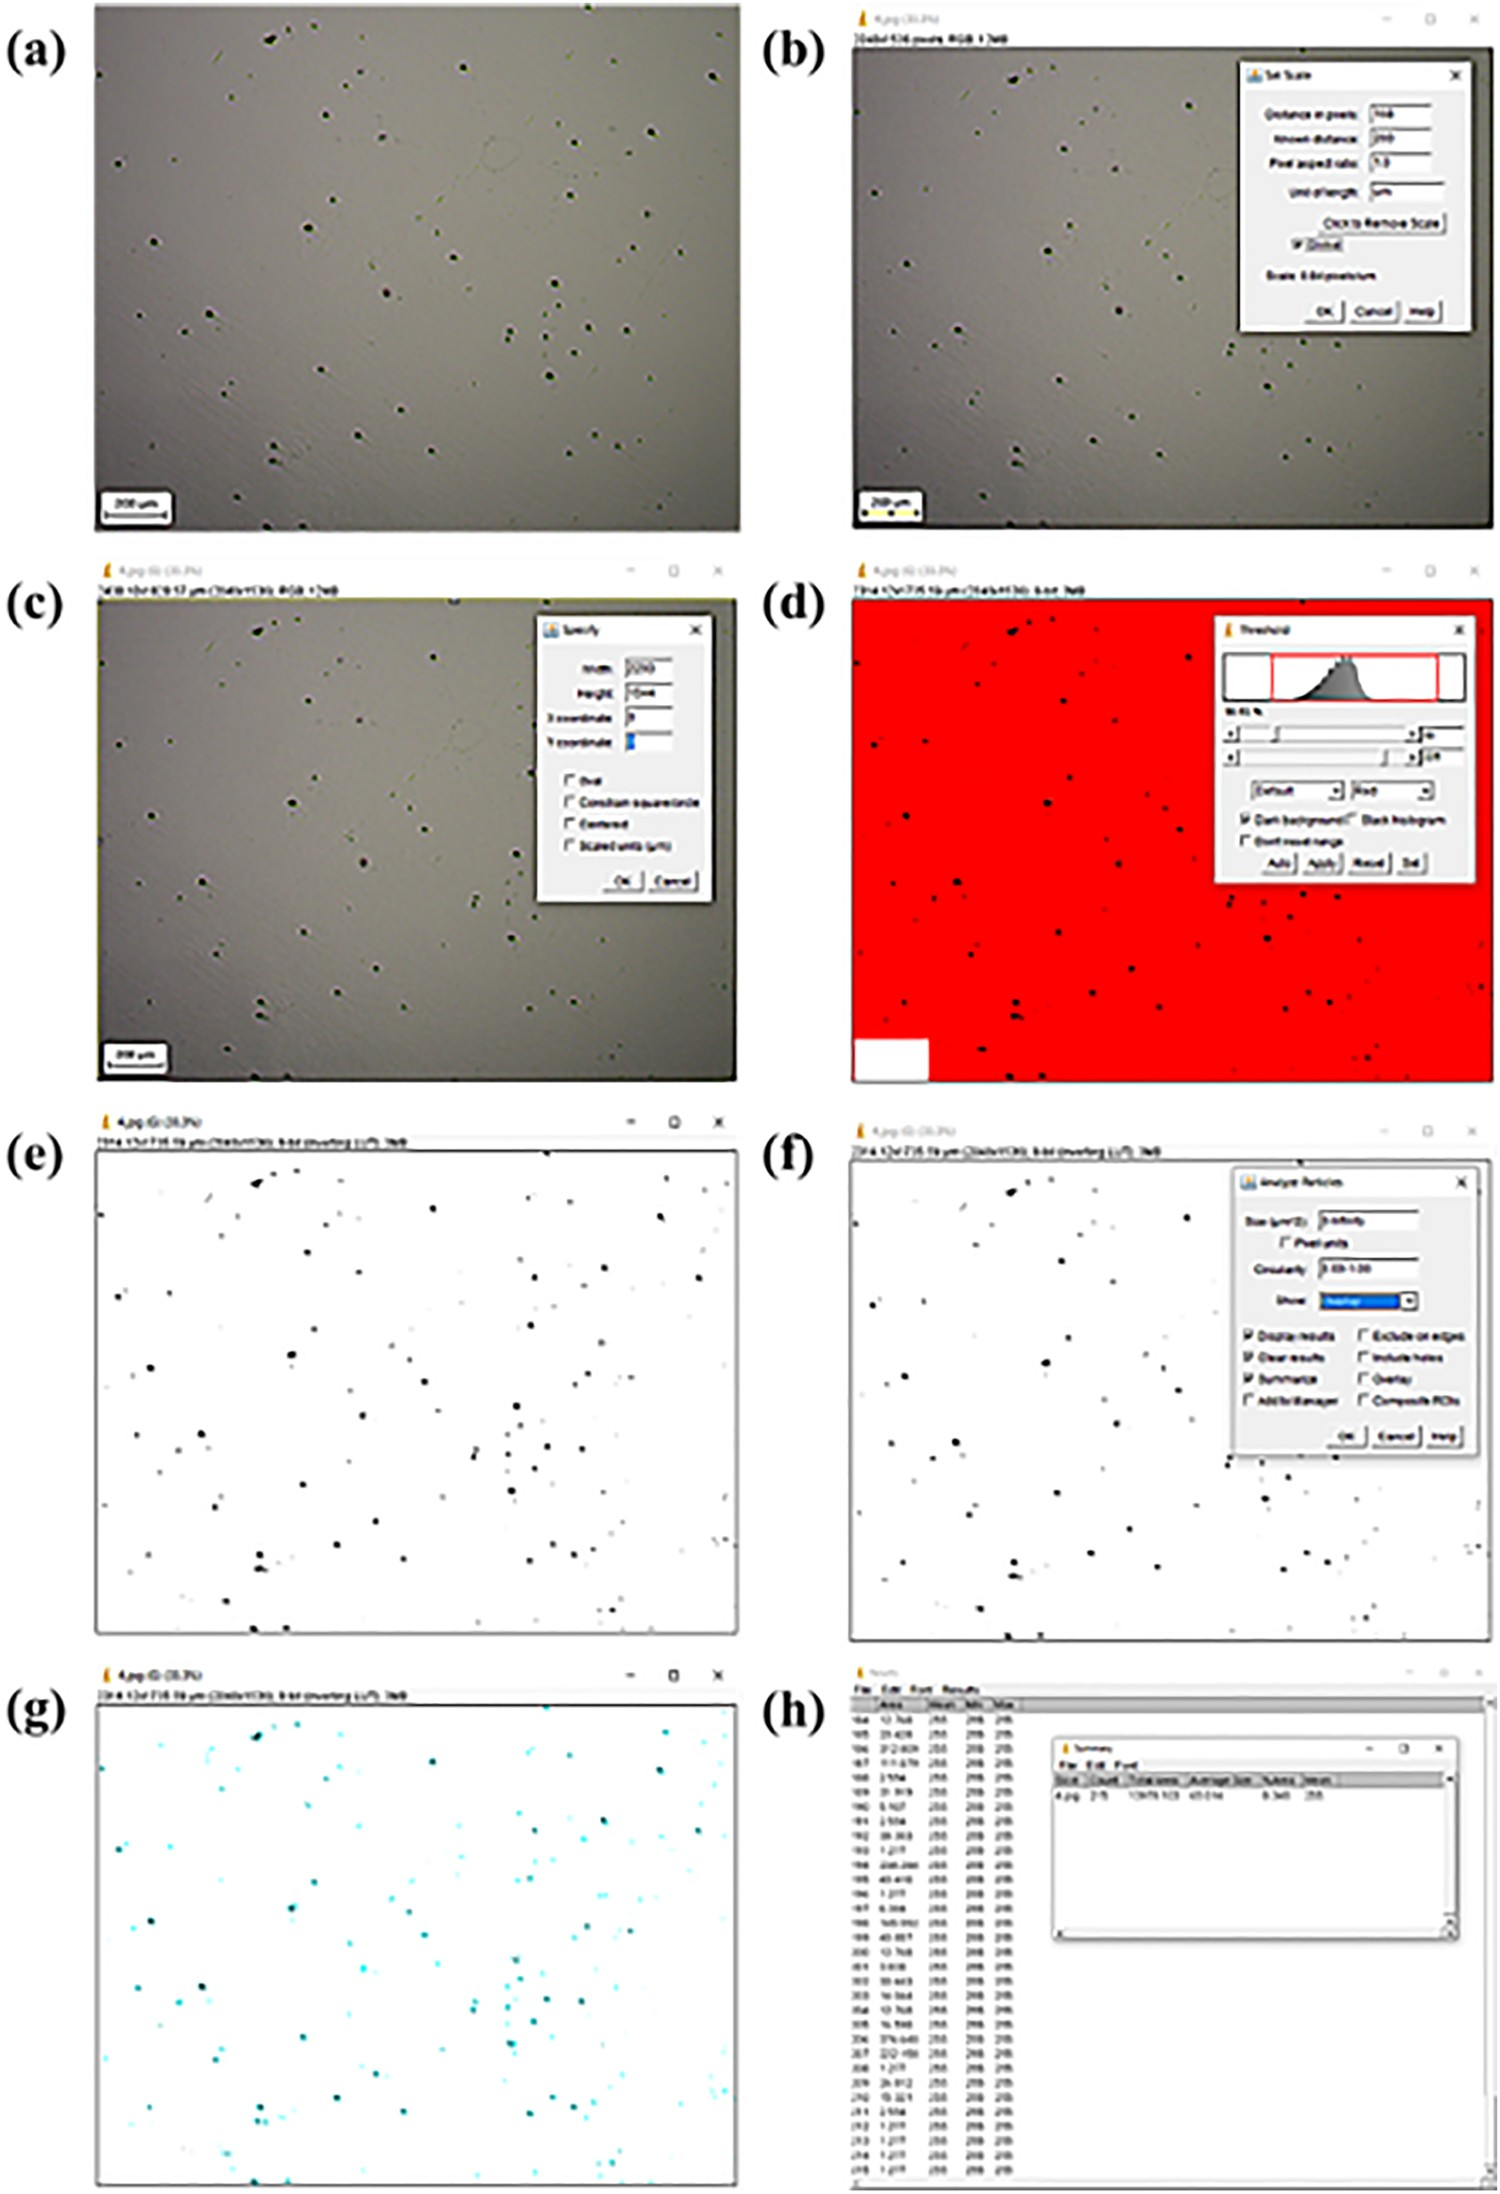
Statistics of extreme values method
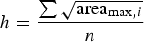
The following methodology refers to the analysis of a single sample using the SEV method. This method was repeated for all ten samples to provide information regarding the maximum inclusion lengths at ten discrete points along the material. According to Murakami’s method, the largest inclusion areas were measured via ImageJ in 60 random unit areas (of 3.53576 mm2 – equivalent to a magnification of 5x via optical microscopy). The characteristic length, determined by 


Results and discussion
Maximum inclusion lengths and distributions
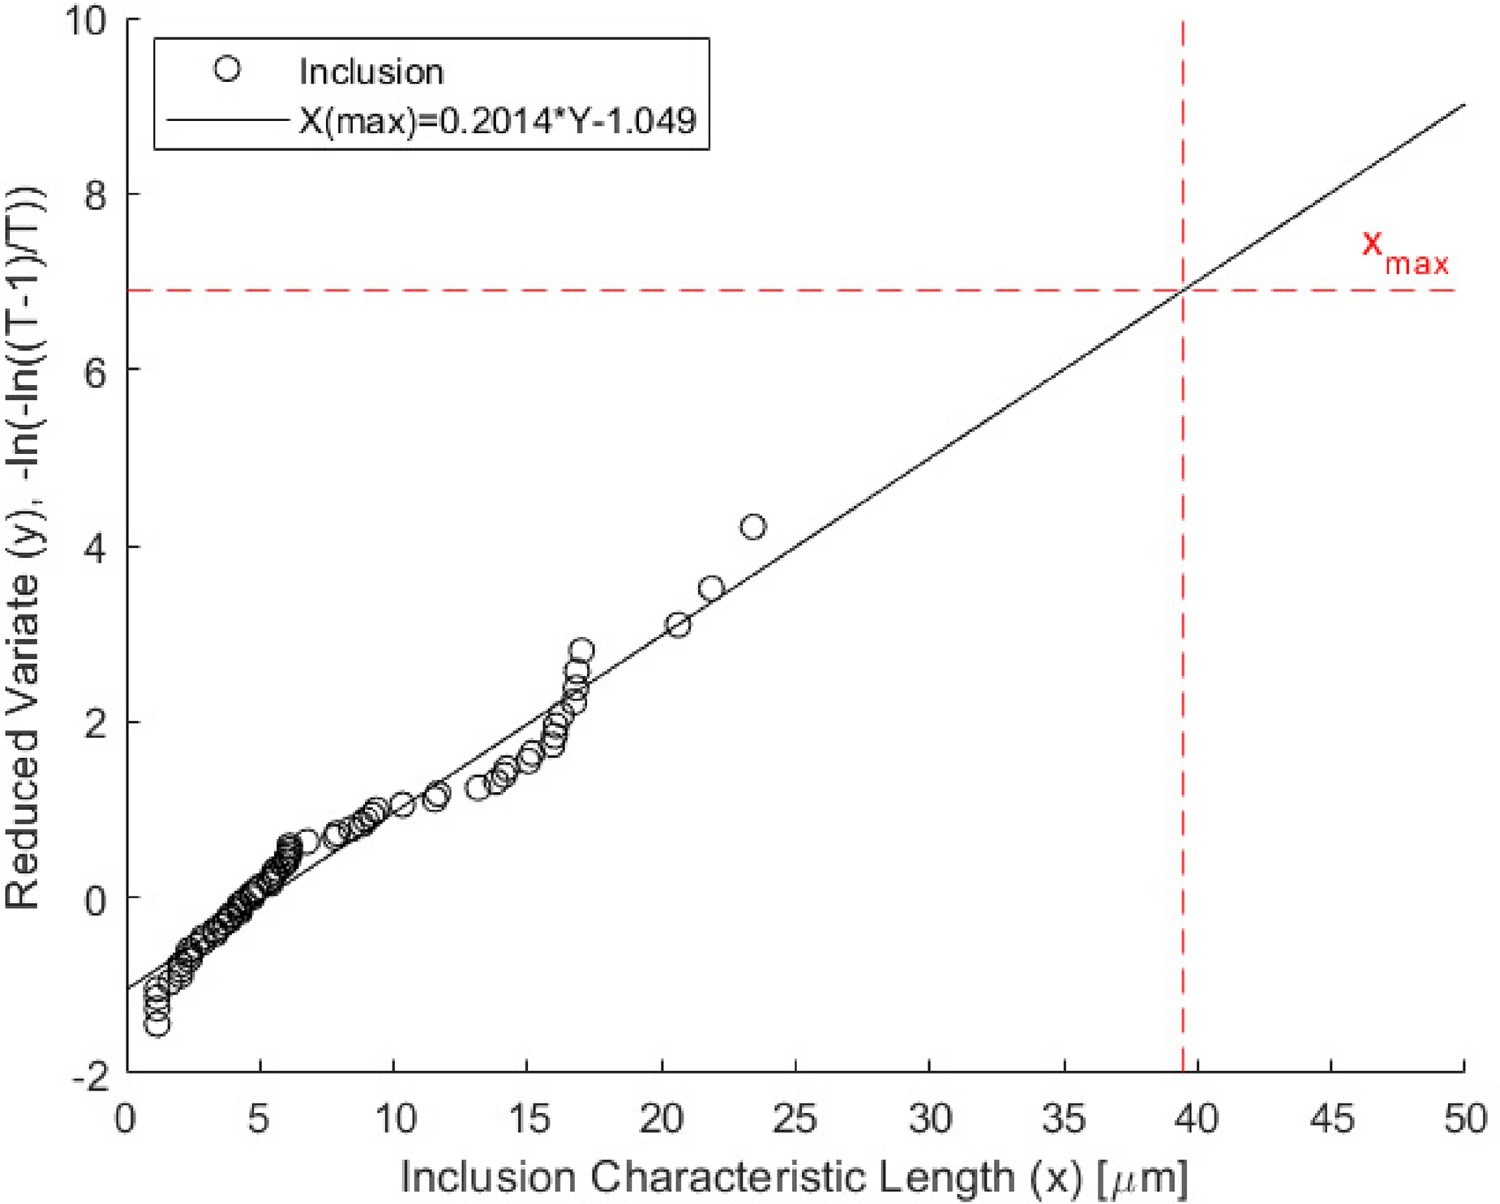
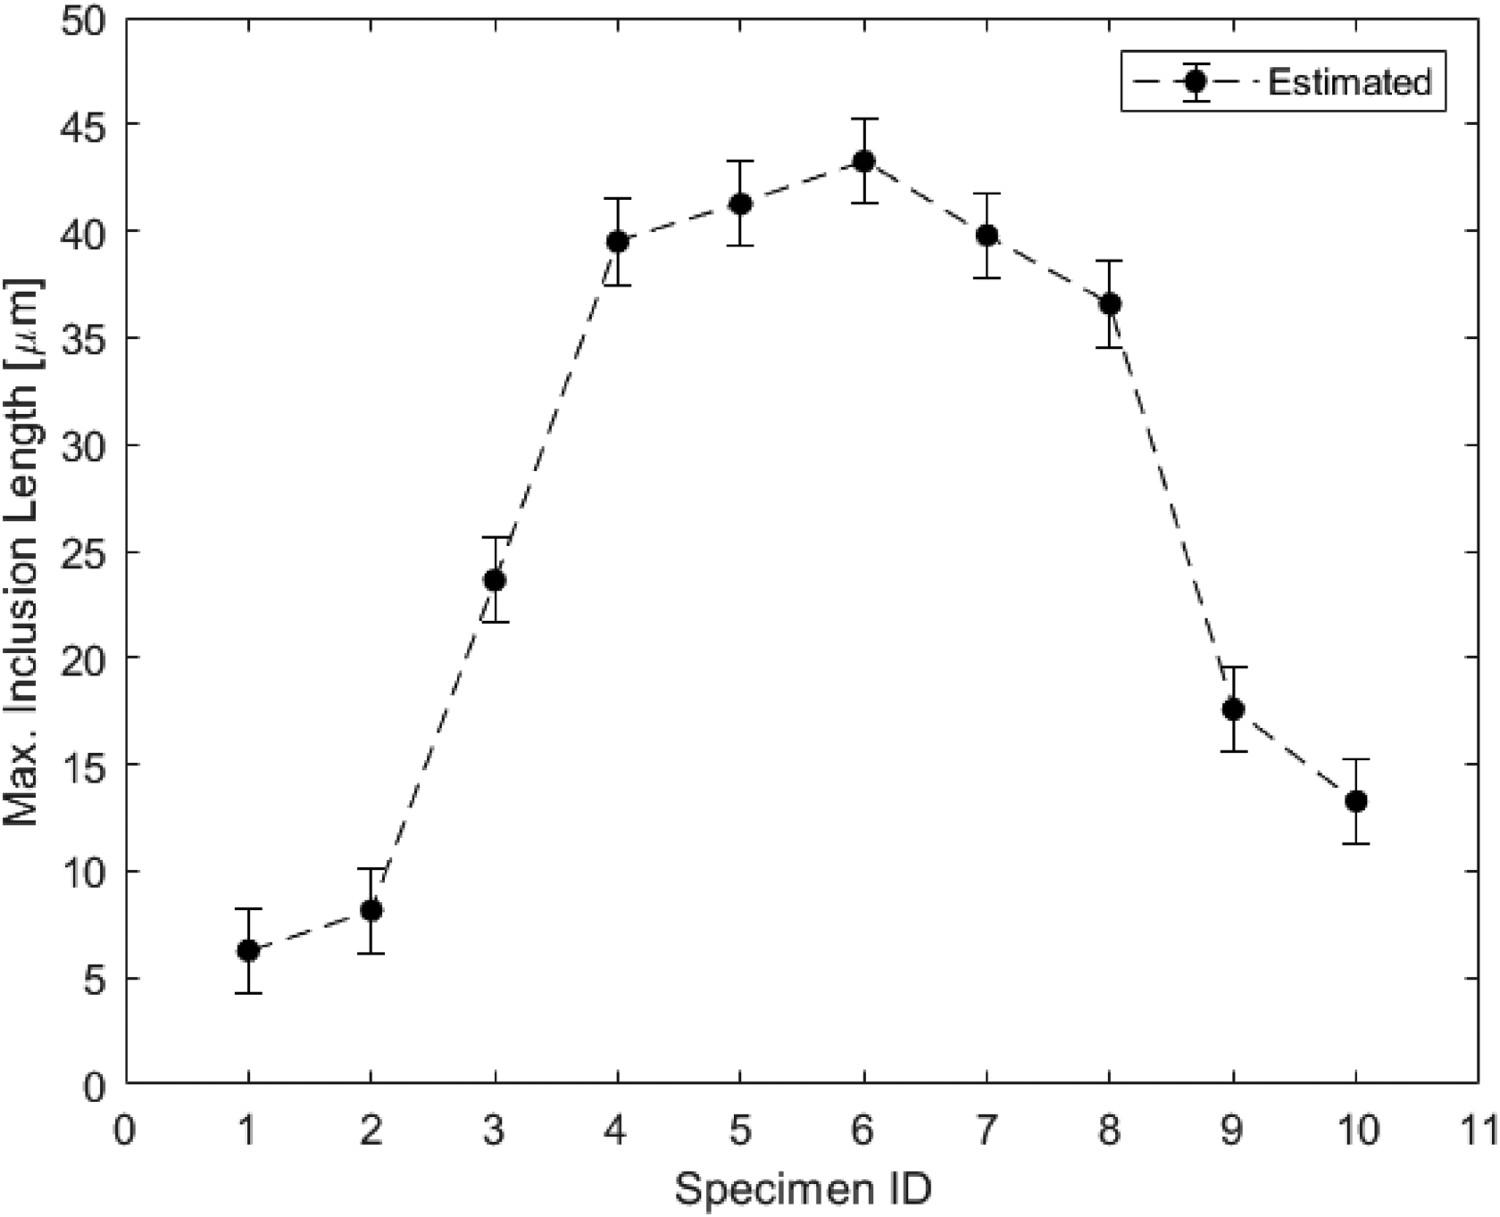
Figure 4 illustrates the process of SEV used to estimate the characteristic maximum inclusion length. This plot in particular shows Sample 4, highlighted as an example. For this specimen, Prediction of the maximum inclusion size using the SEV method (Sample 4). Maximum inclusion length calculated through SEV plotted against the position of samples relative to the coil width.


The distribution of inclusions was measured in accordance with ASTM E2283-08, which classifies inclusion distributions by their characteristic length – as previously calculated as part of the SEV method. The four classifications adopted via this method and their corresponding maximum lengths are: A = 1–15 µm, B = 16–30 µm, and C = 31–45 µm. No higher classification was required as no observed inclusion lengths exceeded those of class C.
Figure 6 plots the percentage fraction of each distribution class amongst the ten samples, to observe the variation in distributions along the length of the strip. In all bar Sample 4, Class A distributions have the highest frequency of occurrence across the entire coil width. Class A comprise of 100% of the inclusions at the outer edges of the coil but these reduce in frequency toward the coil centre, where larger inclusion (>15 µm) sizes begin to dominate. An increasing frequency of Class B inclusions is witnessed between Samples 3 and 7, seen concurrently with Class C inclusions. No strong correlations amongst Class B and C inclusion types were identified, other than being located in the central region of the coil. The highest frequency of Class C (largest) inclusions was observed in Samples 5–7. Inclusion fractional % distribution plotted per sample, relative to the coil width.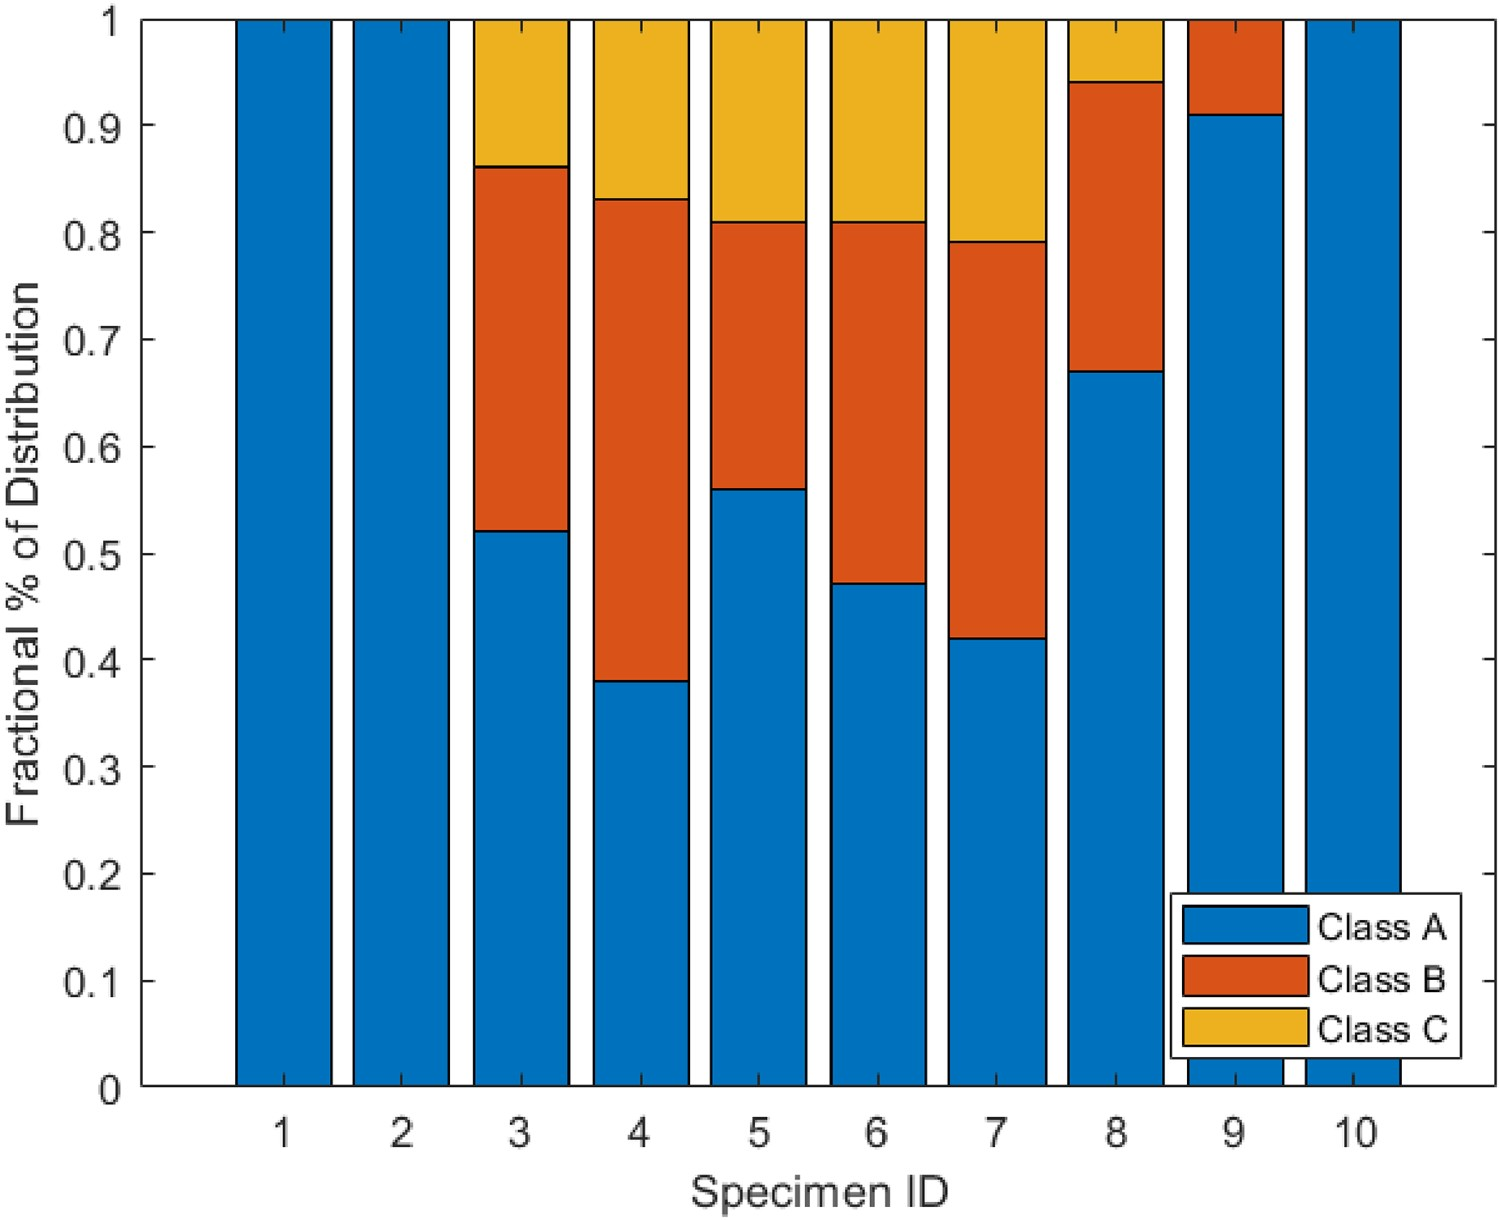
Inclusion characterisation
To understand the characteristics and position of inclusions and how they interact with the surrounding local microstructure, high magnification imaging and chemical analysis was conducted via SEM and EDS.
Inclusions from each sample were analysed in terms of shape, morphology and composition and no correlation was observed regarding their cross-coil position. Most inclusions were observed to be circular in shape, indicating that they are likely to be oxides, as shown in Figure 7a–f, showing examples of inclusions from Samples 3–8 in their respective order. SEM imaging of typical inclusion morphologies seen in Samples 3-8.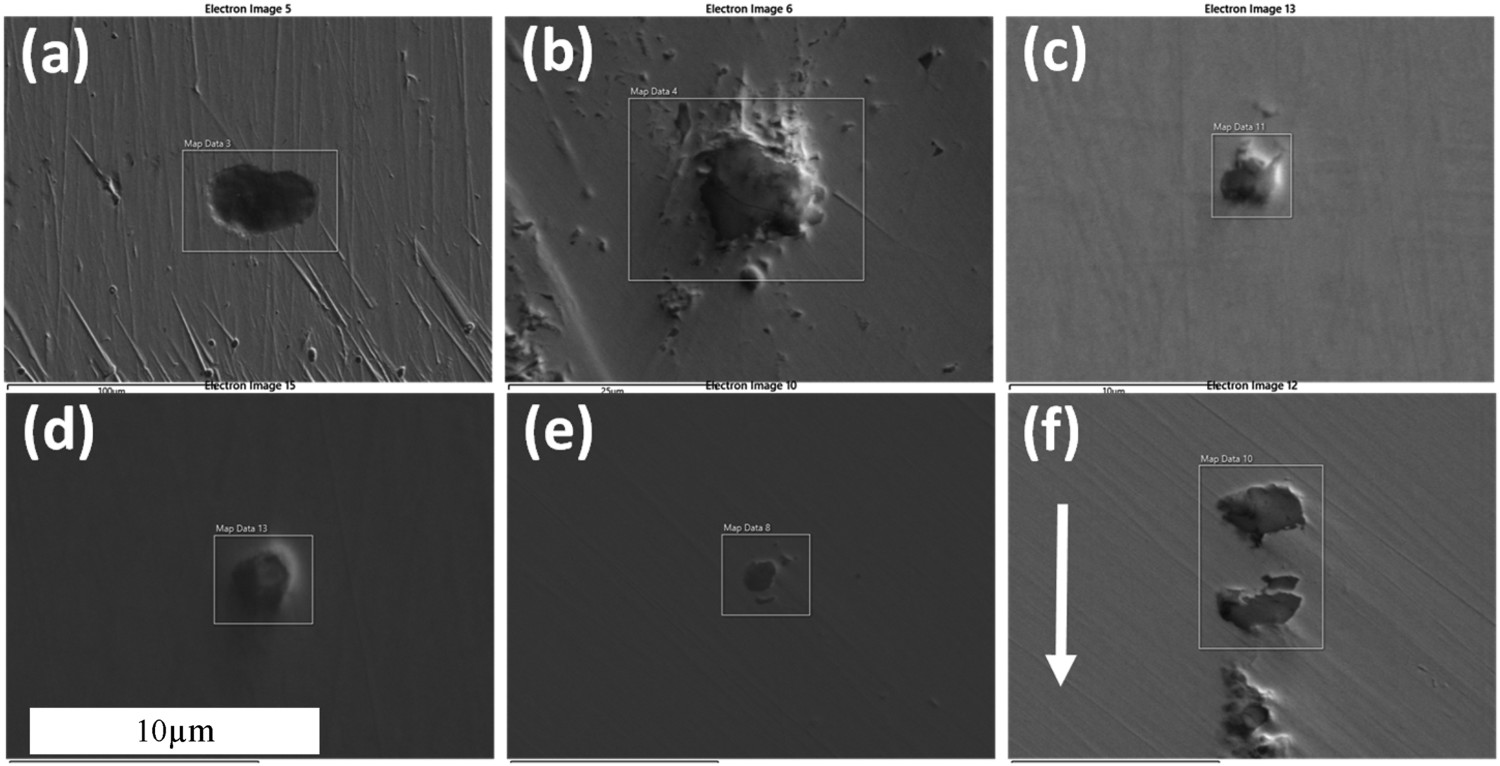
Figure 7a–d show examples of undeformed inclusions whereas Figure 7e, f show particles distributed along the roll direction (which was observed on multiple accounts throughout the coil width). This type of inclusion falls into the ‘brittle-broken inclusion’ category, as described by Wijk et al. [14] and is a consequence of thermomechanical processing. It has been suggested by Robinson and Pickering, that for particles such as alumina; during steel solidification, they will form clusters and subsequently break and redistribute upon rolling due to their high hardness [26].
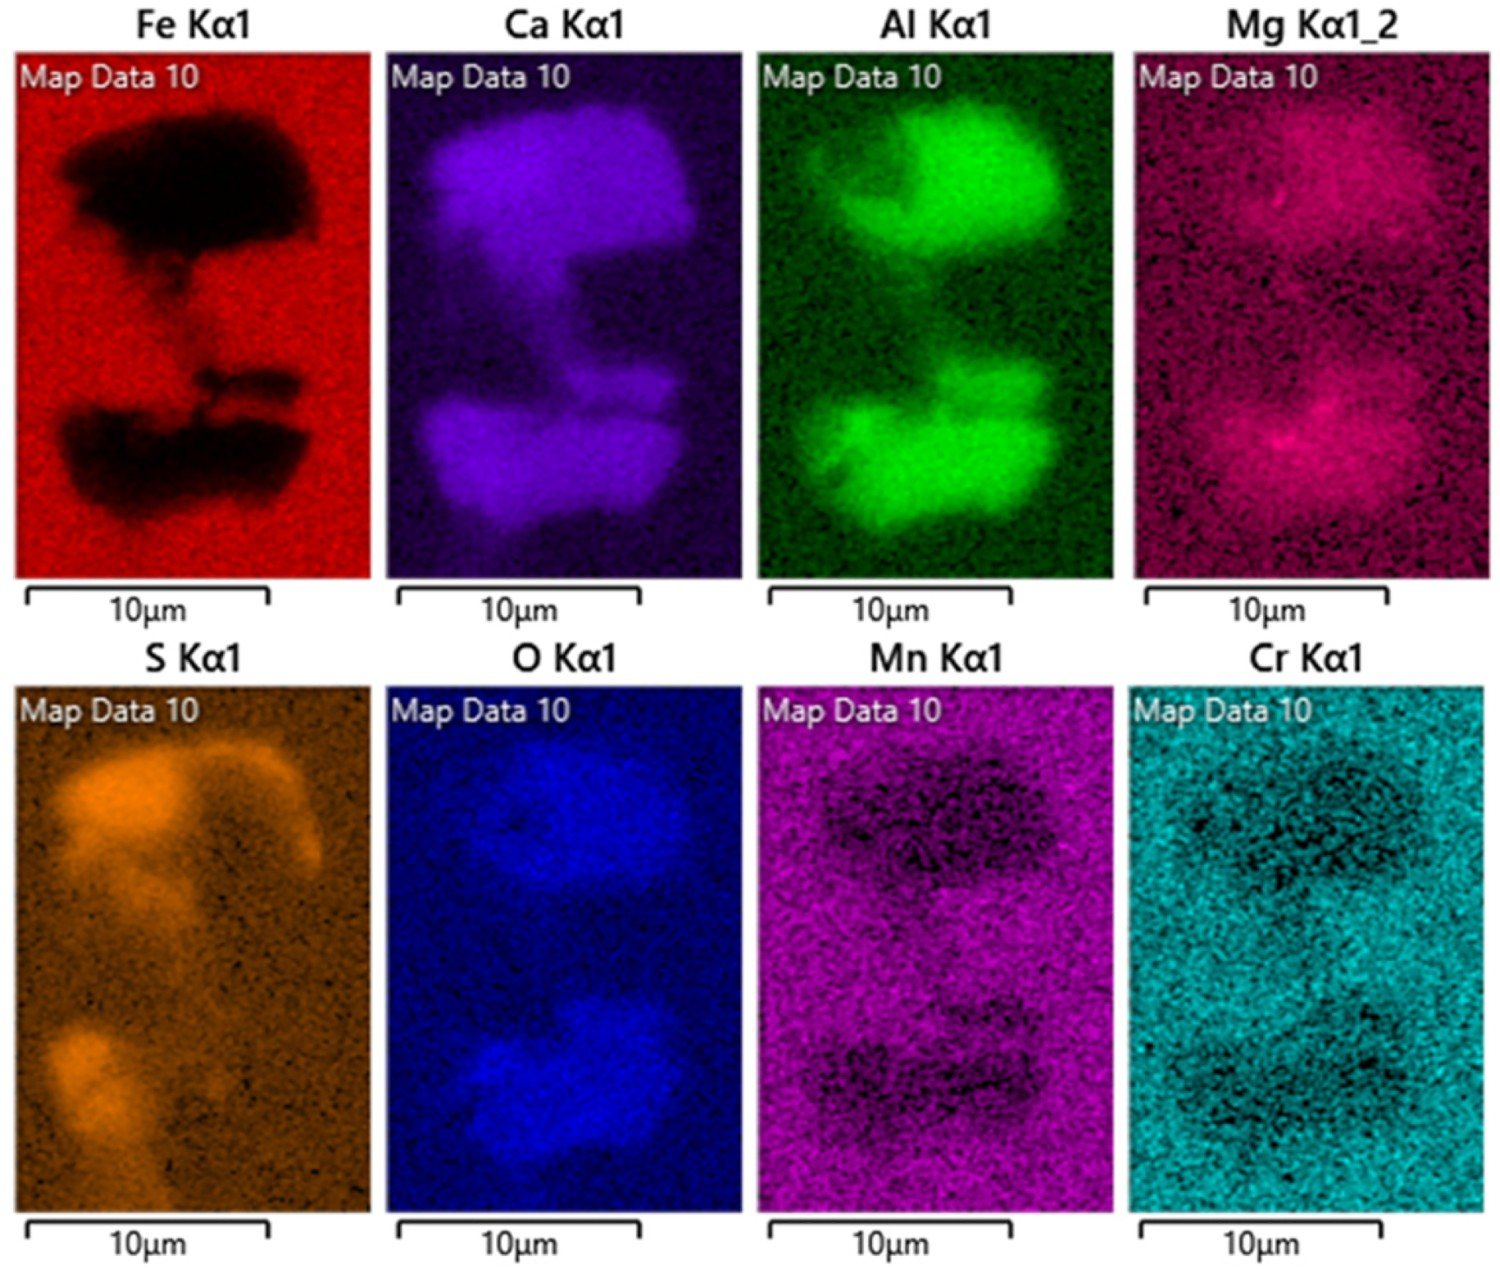
EDS analysis of the inclusions shown in Figure 7 (plus additional spot checks of other inclusions throughout the strip) highlighted two primary inclusion compositions that exist throughout this material. Inclusions that appeared as embedded clusters within the steel (such as those in Figure 7(a–d)) comprised of Al2O4 (aluminium oxide), whereas the broken-brittle type of inclusions (such as those in Figure 7(e and f)) consisted of Al2CaO4 (calcium aluminate). The presence of small quantities of sulfur was also observed in both types of inclusions, which is commonly seen to accompany the inclusions of sulfur-baring steels [27]. Figures 8 and 9 show the typical EDS maps for aluminium oxide inclusions (from Figure 7(c)/Sample 5) and calcium aluminate inclusions (from Figure 7(f)/Sample 8), respectively. Example EDS map of undeformed aluminium oxide inclusion (taken from Sample 5 but observed in various locations across the coil). Example EDS map of broken-brittle calcium aluminate inclusion (taken from Sample 8 but observed in various locations across the coil).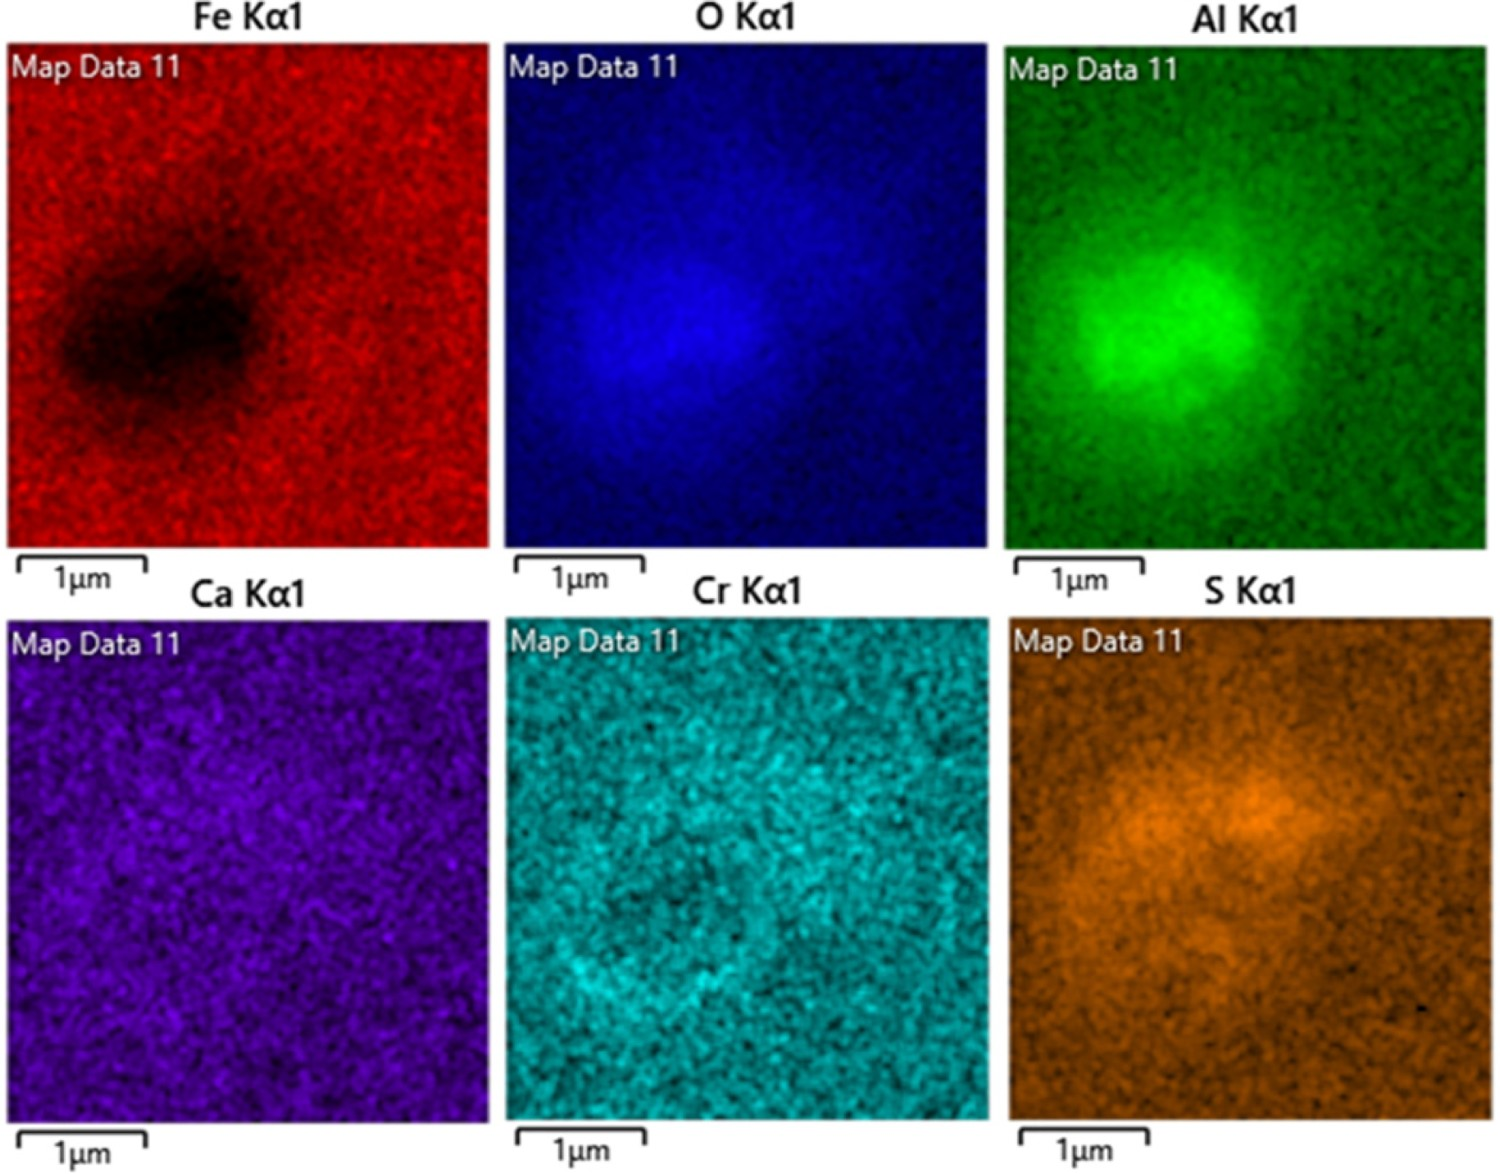
In all cases, it was found that the inclusions present within this DP800 steel, lie within the ferritic matrix, often occurring in the locations between martensitic islands.
Figure 10 highlights several inclusions within Sample 5 (at the midpoint of the coil width). Being located on the boundaries of the phases, inclusions of this nature and position have been shown to pose as potential sites of void nucleation and growth which can influence the tensile properties (such as elongation) and fatigue behaviour in steels [12]. A study reported by Santos et al on DP600 and 800, identified that microvoid formation is more likely at the ferrite-martensite interfaces, between martensite islands and inclusion when the material is exposed to increasing levels of strain during sheet metal forming [28]. SEM image of DP800 microstructure, highlighting inclusion presence and inclusion interface amongst the 
The inclusions that have been identified here, in this DP800 are endogenous in nature, due to their globular morphology and their composition, and being rich in alumina and calcium. The frequency and distribution suggest that formation likely occurred at the deoxidation process in the liquidous stage; Al-deoxidisation was employed during steelmaking and thus alumina was hypothesised to be the dominant inclusion type. However, during ladle metallurgy and casting, it’s also possible for inclusion formation to be influenced by other factors [11]. The presence of calcium in the form of calcium aluminates can be attributed to inclusion control by calcium treatment, which aims to transform Al2O3 to Al2CaO4 to prevent nozzle clogging during continuous casting. Calcium has also been historically used in the steelmaking process to prevent the negative effects of sulfur [29,30]. Being largely globular/spherical in shape, supports that their formation occurred by precipitation within the melt. In terms of the influence on mechanical properties, spherical inclusions are less detrimental than irregular-shaped inclusions with sharp edges, provided they do not exceed a critical value [13]. As the aspect ratio of the inclusion increases, so does the local stresses within its surrounding microstructure. Calcium addition provides benefits not only in preventing nozzle clogging, but also in improving inclusion morphology within the final steel product. A study showed how the aspect ratio of an inclusion can be modified with calcium treatment; whereby increasing CaO content in Al2CaO4 will reduce the ratio of length to width, transforming the inclusion to a more spherical morphology [31].
The formation of primary Al2O3 inclusions was studied by Tiekink and co-workers, where the morphology of precipitated inclusions at various local concentration gradients of aluminium and oxygen [32]. The study has been summarised and adapted by Vasconcellos and Silva to provide the illustrative plot shown in Figure 11 [12]. The inclusions shown within this study are similar to those that sit to the left-hand side of this plot, suggesting that the local aluminium concentration is relatively low, while the average local oxygen affinity may vary. Morphologies of alumina inclusion growth dependent on local oxygen and aluminium concentrations.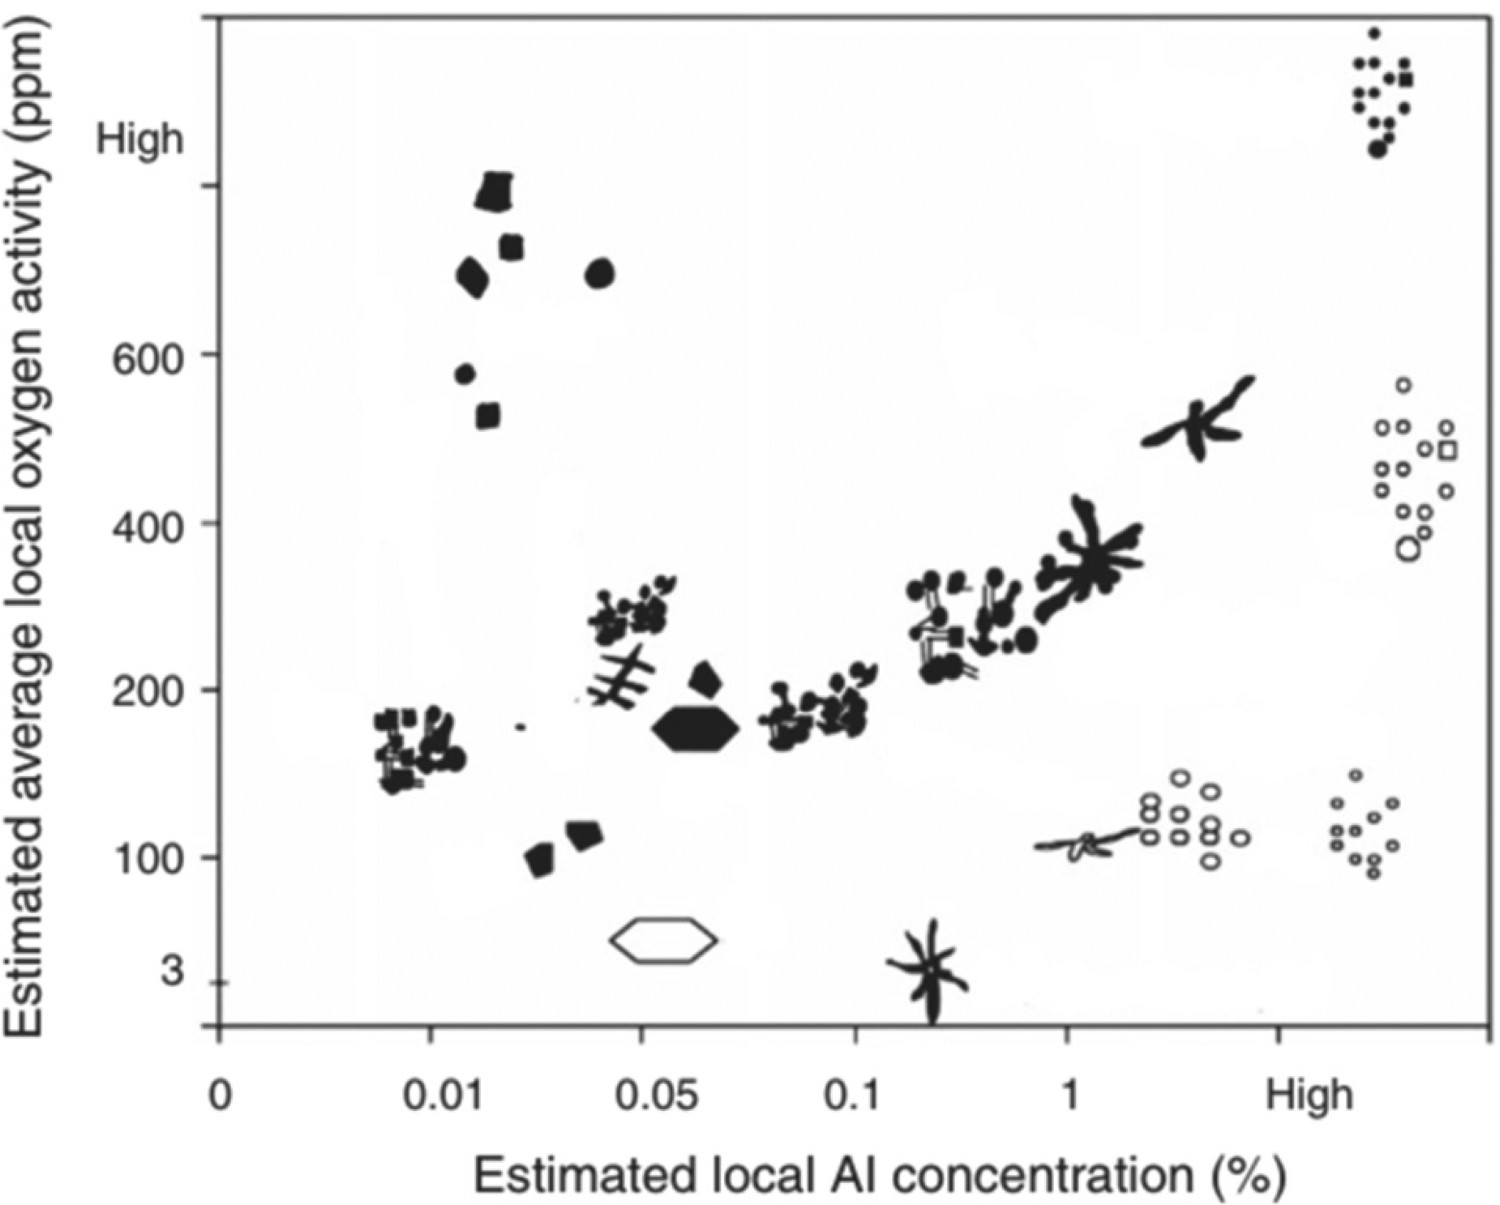
As shown in Figures 5 and 6, the size and distribution of inclusions were generally higher in the central region with respect to the coil width, although the distribution appeared to be slightly off-centre, with a greater inclusion size and frequency positioned to the right of the coil width (Samples 8–9). It has been previously observed that inclusion size is smaller near the surfaces of as-cast steel slabs, increasing in size and frequency towards the slab interior [33]. This will then be translated through the rolling process. It is possible for other factors to influence the positioning of the inclusions in the final product, contributing to the off-central effect seen in Figures 5 and 6. It has been discussed that during the casting and solidification process, phenomena such as gravity, buoyancy and friction can result in the movement of inclusions. As solidification occurs in line with the temperature gradient throughout the slab, the distribution of inclusions becomes more uniform at the outer regions due to the stronger escaping ability of inclusions, whereas trapping of inclusions occurs in the mushy and liquid zones. Forces induced during deformation processes such as rolling can also give rise to movement and repositioning.
Conclusions
A cold rolled dual-phase steel (DP800) has been analysed using optical microscopy and image analysis via Image J to provide inclusion data in relation to the cross-coil positioning of samples. A statistical approach, the ‘statistics of extreme values’, has been used to interpret inclusion data, providing an understanding of maximum inclusion lengths and fractional distributions, relative to the position of inclusions. Using the SEV approach, inclusion lengths were identified to be between 1.176 and 40.231 µm, with maximum inclusion lengths and fractional distributions being greatest near the centre of the coil width, with slight asymmetry being observed. Inclusions were either alumina or calcium aluminate in chemical composition, suggesting primary endogenous in classification. In respect of the microstructure, the inclusions were positioned within the ferrite matrix, but sitting between martensite islands. Being primary and endogenous, inclusions likely formed during the early liquidous stages, with localised conditions affecting the morphology of growth. Solidification has been shown to influence the positioning of the inclusions, with forces experienced during rolling further contributing to the distribution and morphology of inclusions in the steel product.