
Abstract
A novel horizontal stirring has been introduced to investigate the effect of such a stirring on the ladle profile during the combined stirring process at the refining stage. The multiphaseInterFoam solver has been updated to consider the induction forces imposed on the liquid bath by the magnetic stirrer.During the combined stirring stage, the gas plume is affected by the rotational movement. The gas plume seems to be intact in the lower one-third of the domain, then breaks into clusters in the upper section while the rotational movement of clusters dissipates a large portion of upward momentum of the bubbles. This prevents large openings in the slag layer and respectively, prevents the exposure of steel. It also disperses the bubbles to various sections of the ladle. Hence, such a novel stirring strategy seems to have the potential of improving the cleanness of the liquid steel during the ladle refining process.
Introduction
Ladle metallurgy and ladle stirring have proven to be one of the most critical steps in steelmaking. During the ladle process, steel plants can adjust and improve the composition and cleanness of the steel melt utilising stirring operations. Hence, the ladle process has been the focal point of numerous research activities, including plant and laboratory trials, mathematical and physical modelling. In the past two decades, due to increase in the computer calculation capacity and development of numerical methods of computational fluid dynamics (CFD), the numerical simulation has played a significant role to improve the understanding of the fluid flow and heat transfer during the process of the ladle stirring [1–10].
There are two standard methods of ladle stirring, namely gas stirring and induction stirring. Both methods have been extensively investigated through CFD modelling. One of the reasons for the popularity of ladle simulations has been because field tests are proven to be expensive, complicated and time-consuming. Therefore, CFD models were used to improve the understanding of the ladle process and the effects of changes in process parameters on the system's overall behaviour when stirring are used. The parameter sensitivity studies of the gas stirring include the effect of porous plug position, number of porous plugs, gas flow rate, stirring direction and intensity and have proven to be useful in providing an insight into the stirring process [1,2,7,9,10].
Induction stirring has also been the focus of many studies [11–16]. Sand et al. [12] used a water model to investigate the effect of induction stirring force on the gas plume and open-eye. In contrast, Alexis et al. [16] investigated the effect of combined stirring on removal of non-metallic inclusions. Moreover, the effect of ladle age on the refining process due to changes in the magnetic field force with respect to the ladle wear was first discussed in that study. Later, Mayur Pal [11] used the Finite Element method to solve the ladle induction stirring. In these studies, the magnetic force imposed on the melt is vertical forces that can be either upward or downward which can lead to formation of an open-eye due to that slag is pushed by the forces created by stirring.
The current study, on the other hand, investigates the effect of horizontal electromagnetic stirring (HLF-EMS) [17] during the ladle refining process [14,18]. The main reason to develop the HLF-EMS is to focus on an improved clean steel production. The application of HLF-EMS alongside the vertical gas stirring in a ladle refining process could have potential advantages in clean steel production compared to the conventional ladle stirring techniques. Therefore, Kesavan et al. has investigated the effect of such a stirring approach by means of physical and mathematical modelling [14]. The study only focused on a two-phase system of water and air to compare the laboratory data with the CFD simulation. Furthermore, the model used the Eulearian-Largrangian approach where the liquid phase and surrounding where modelled by means of using the Volume-of-Fluid (VoF) method while the purging gas was treated as individual bubbles using the Lagrangian particle tracking approach. In the follow-up to that model, Safavi Nick et al. tried to not only extend the model by using a three-phase steel-slag-gas model but also to investigate the possibility of using the opensource CFD software OpenFOAM for ladle modelling [18]. The study implemented the external magnetic force into a pre-existing solver of the application to be able to model the process. The current study, then, goes beyond that to investigate the effect of such a stirring strategy on the formation of the open-eye and gas plume profile within the steel phase.
Modelling approach
The ladle is modelled using Volume-of-Fluid (VoF) method [19,20] through OpenFOAM [21] V6.0 where the multiphaseInterFoam solver has been adopted to model the induction force. This multiphase solver is based on the interFoam which is a two-phase, isothermal, incompressible solver using volume-of-fluid algorithm [22] as below:


Physical properties of phases in the system.
The multiphaseInterFoam solver in combination with LES turbulence model is chosen due to the fact that the aim of the current study is to investigate the gas plume profile and behaviour of the slag layer during the combined stirring. Of course, the VoF approach has a limitation regarding the mesh resolution to the bubble size which, in the current study an empirical data related to the bubble size has been used. Furthermore, to address such a limitation, the mesh at the porous plug and near region has been chosen so that the size of the cell would not be smaller than at least one bubble size.
The induced induction force was calculated before the simulation and then adopted into the model geometry as a source term. This calculated force was used as an initial induction force generated by the stirrer where the transient behaviour of the stirrer was adopted by means of equation 1: [23]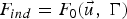


Geometry
Figure 1 shows the geometry of the ladle and the position of the stirrer. As can be seen in the left figure, the ladle geometry is a simple cylinder where the height and diameter are 2800 and 2400 mm, respectively. Moreover, the right figure (bottom view) shows the position of the porous plug. The porous plug is coloured by black colour and its centre is positioned at (0.25, −0.25). The figure also shows the location of the stirrer with respect to the centre line. It should also be mentioned that the centre of the stirrer is at 1200 mm from the bottom wall. Geometry of the ladle: side and bottom view. Porous plug coloured by black is located at (0.25, −0.25).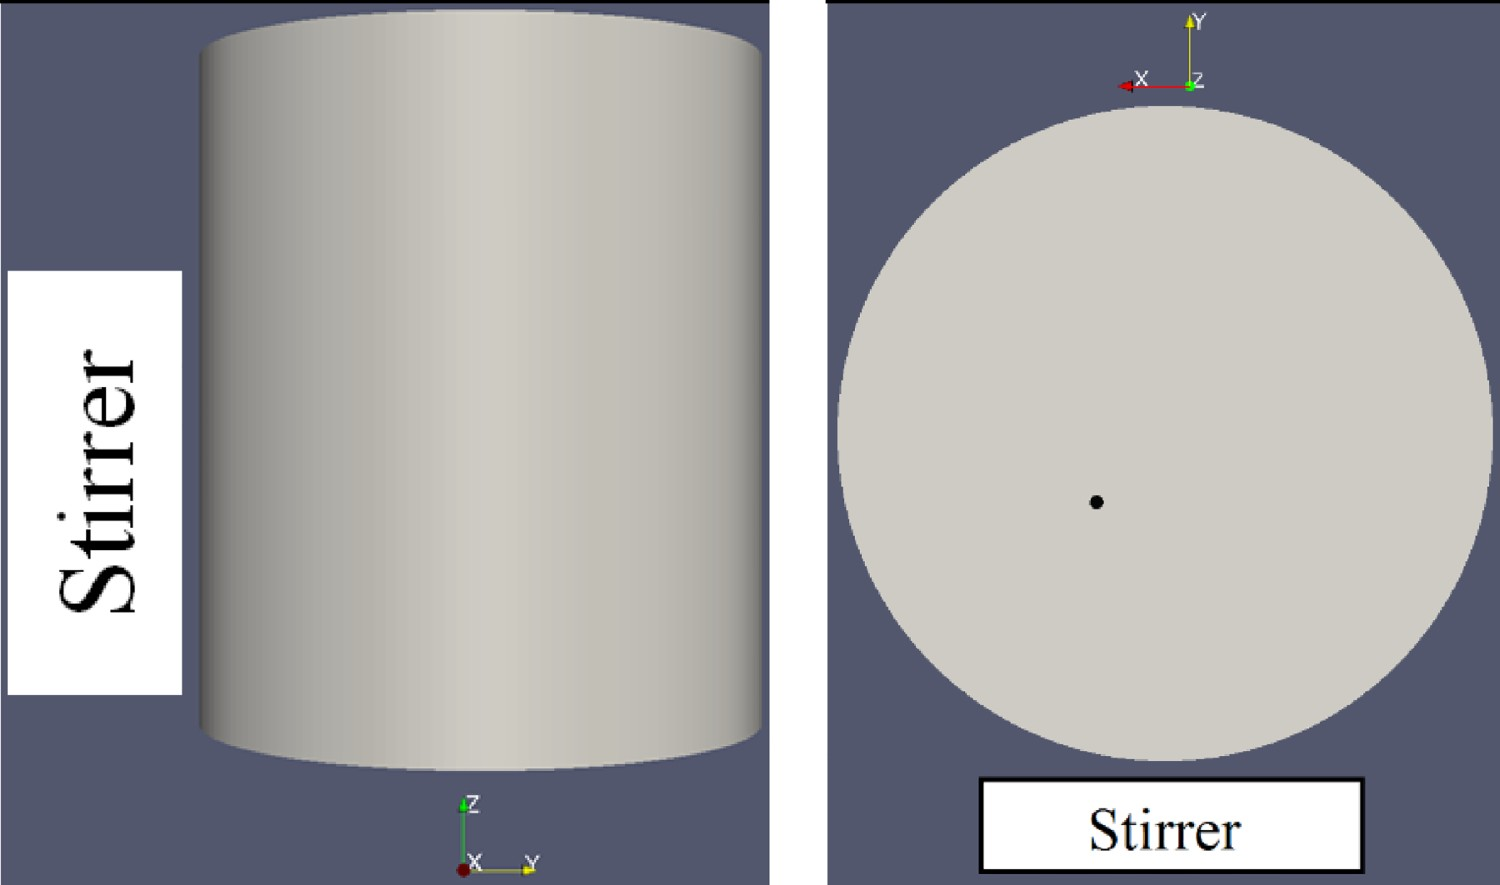
The boundary conditions for any ladle stirring model are the generic operational condition for the porous plug. Hence, in the current study the boundary condition at the inlet is set to volumetric flow rate where the solver then calculates the appropriate velocity based on the characteristic of the inlet mesh. At the top, the normal pressure outlet has been adopted so that the gas phase can leave the domain. Of course, the setting of the pressure boundary allows the re-entry of gas phase but not any of liquid phases.
Results
As it is mentioned, the current study investigates the three-phase model of argon-steel-slag system. The steel height in the system is set to 2400 mm while the slag layer thickness is assumed to be equal to 100 mm. Therefore, the distance between slag layer surface to the outlet (top surface) is equal to 300 mm. Figure 2 shows the distribution of phases for an unstirred calm bath where the blue colour presents the steel, the grey colour represents the slag and the top red colour is the gas phase. Distribution of the phases at the beginning of simulation; colour representation bottom to top: steel-slag-gas.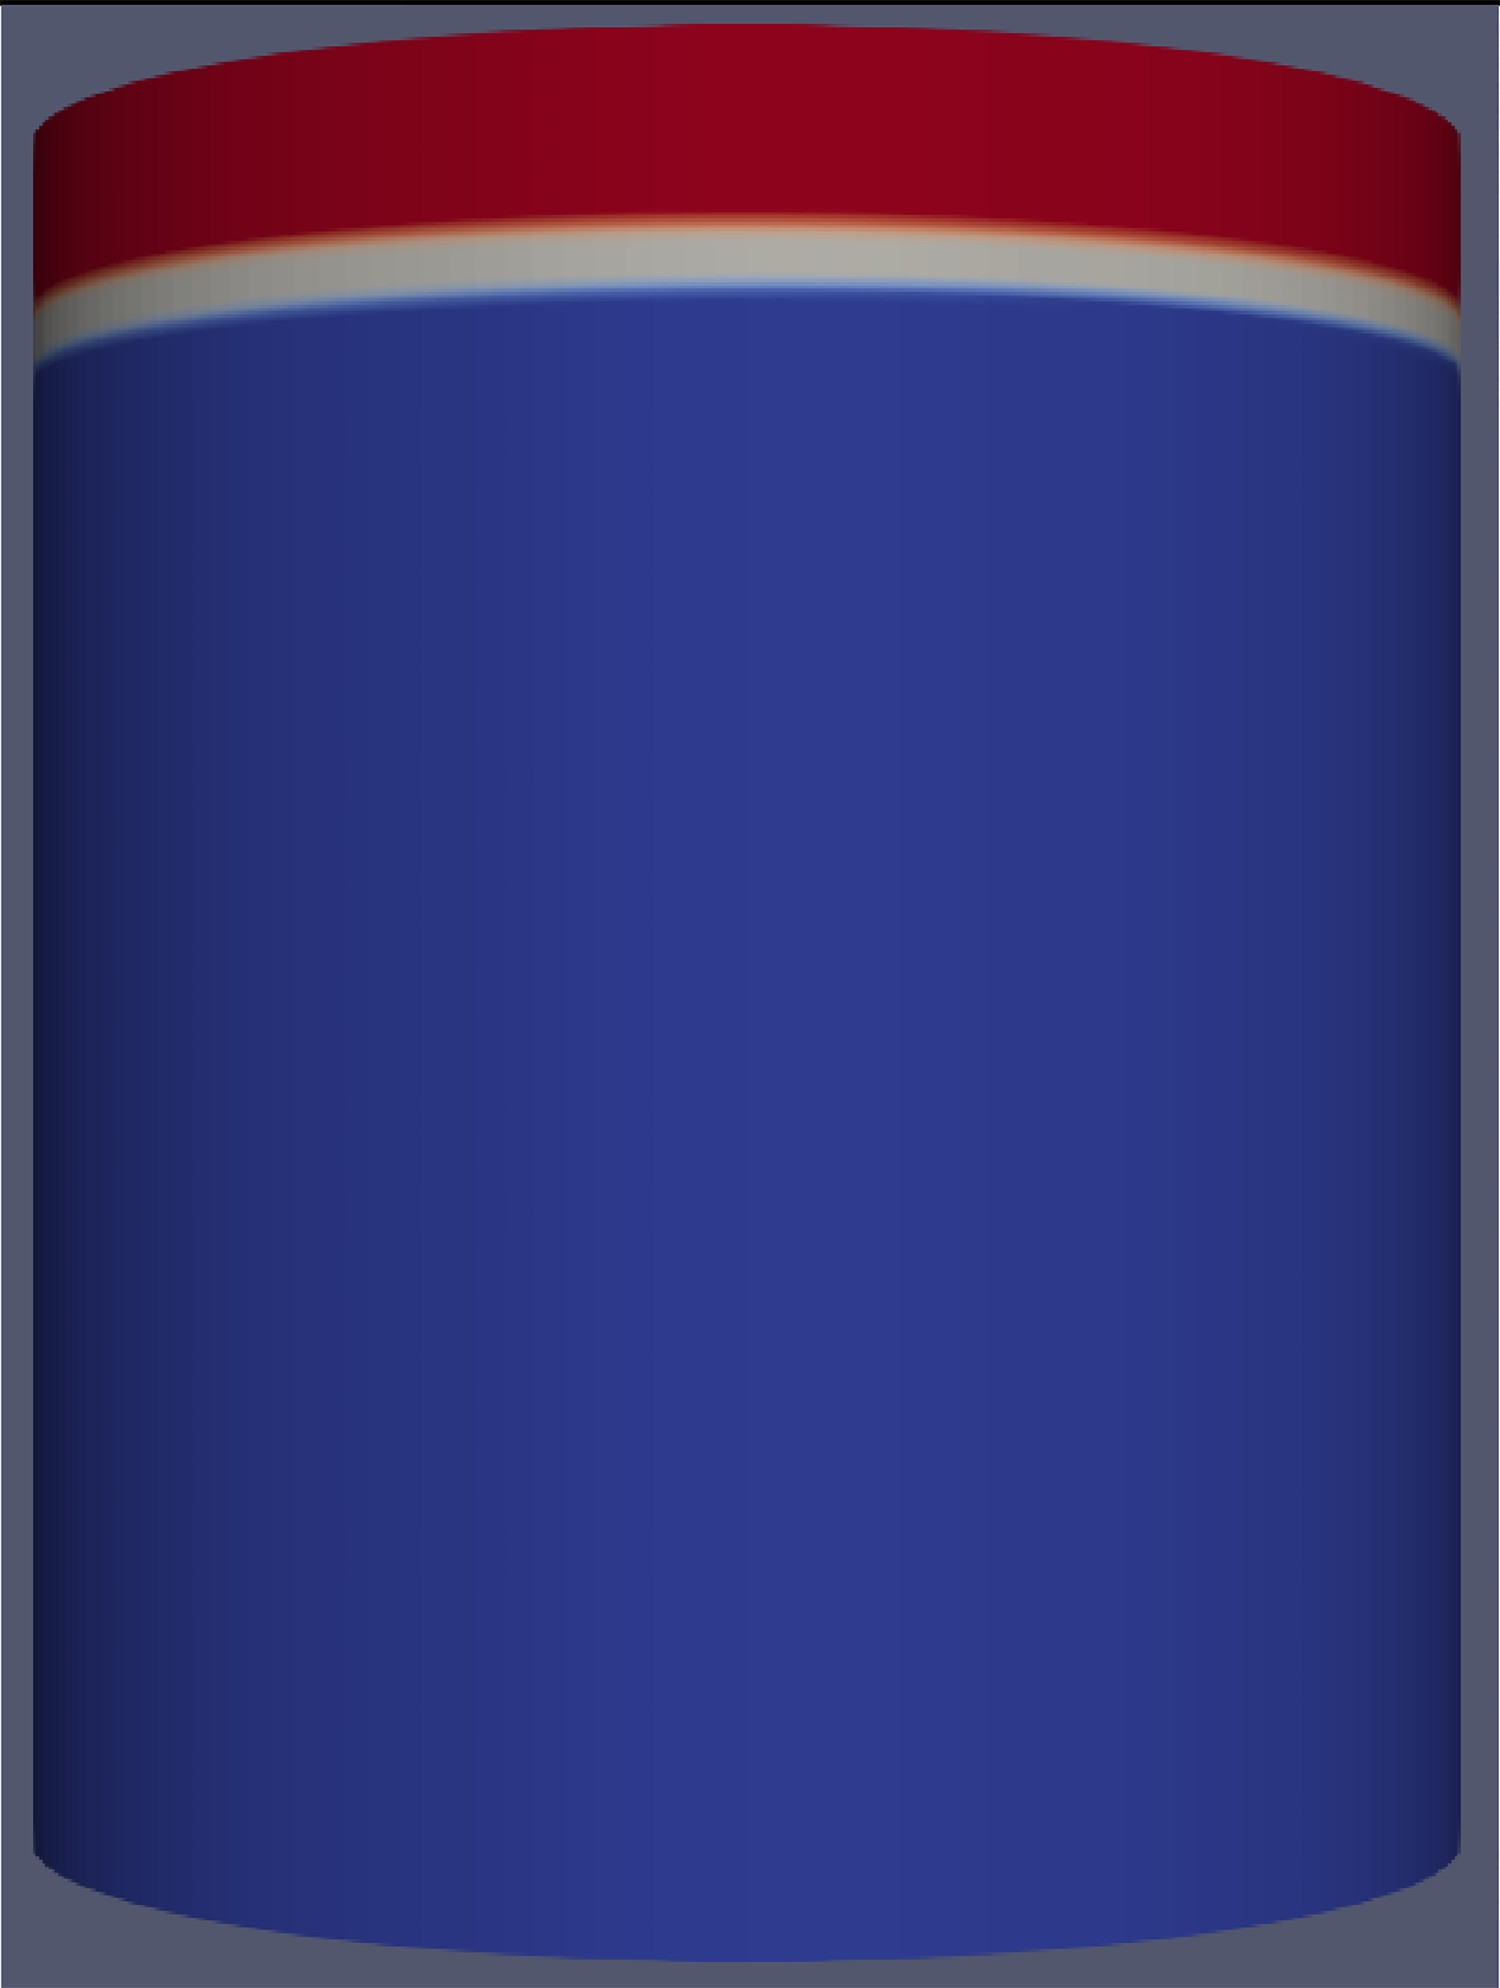
To model the combined stirring, first the model is run only with the induction forces. Using this approach helps to investigate the effects of the stirring force on the behaviour of the gas plume. Injecting the gas phase at the initial time alongside the induction forces can obscure the effect of the induction forces. Therefore, the results are presented in the same structure where the first part of the current section presents the flow field characteristics when only the induction forces are activated.
Of course, a gas stirred model in the absence of the induction force could add further understanding to the current study. Such a study, of course, has been published before and will be added in the future work.
Induction stirring
Figure 3 shows the velocity profile in the vertical cross section where the maximum value of the velocity magnitude is equal to 1.3 m s–1. Furthermore, the figure shows that the velocity magnitude have larger value (more than 0.8 m s–1) in a strip near the wall. Moving inwards, the velocity magnitude drops and the movement of the steel phase slows down towards the centre of the ladle. Velocity field in horizontal direction.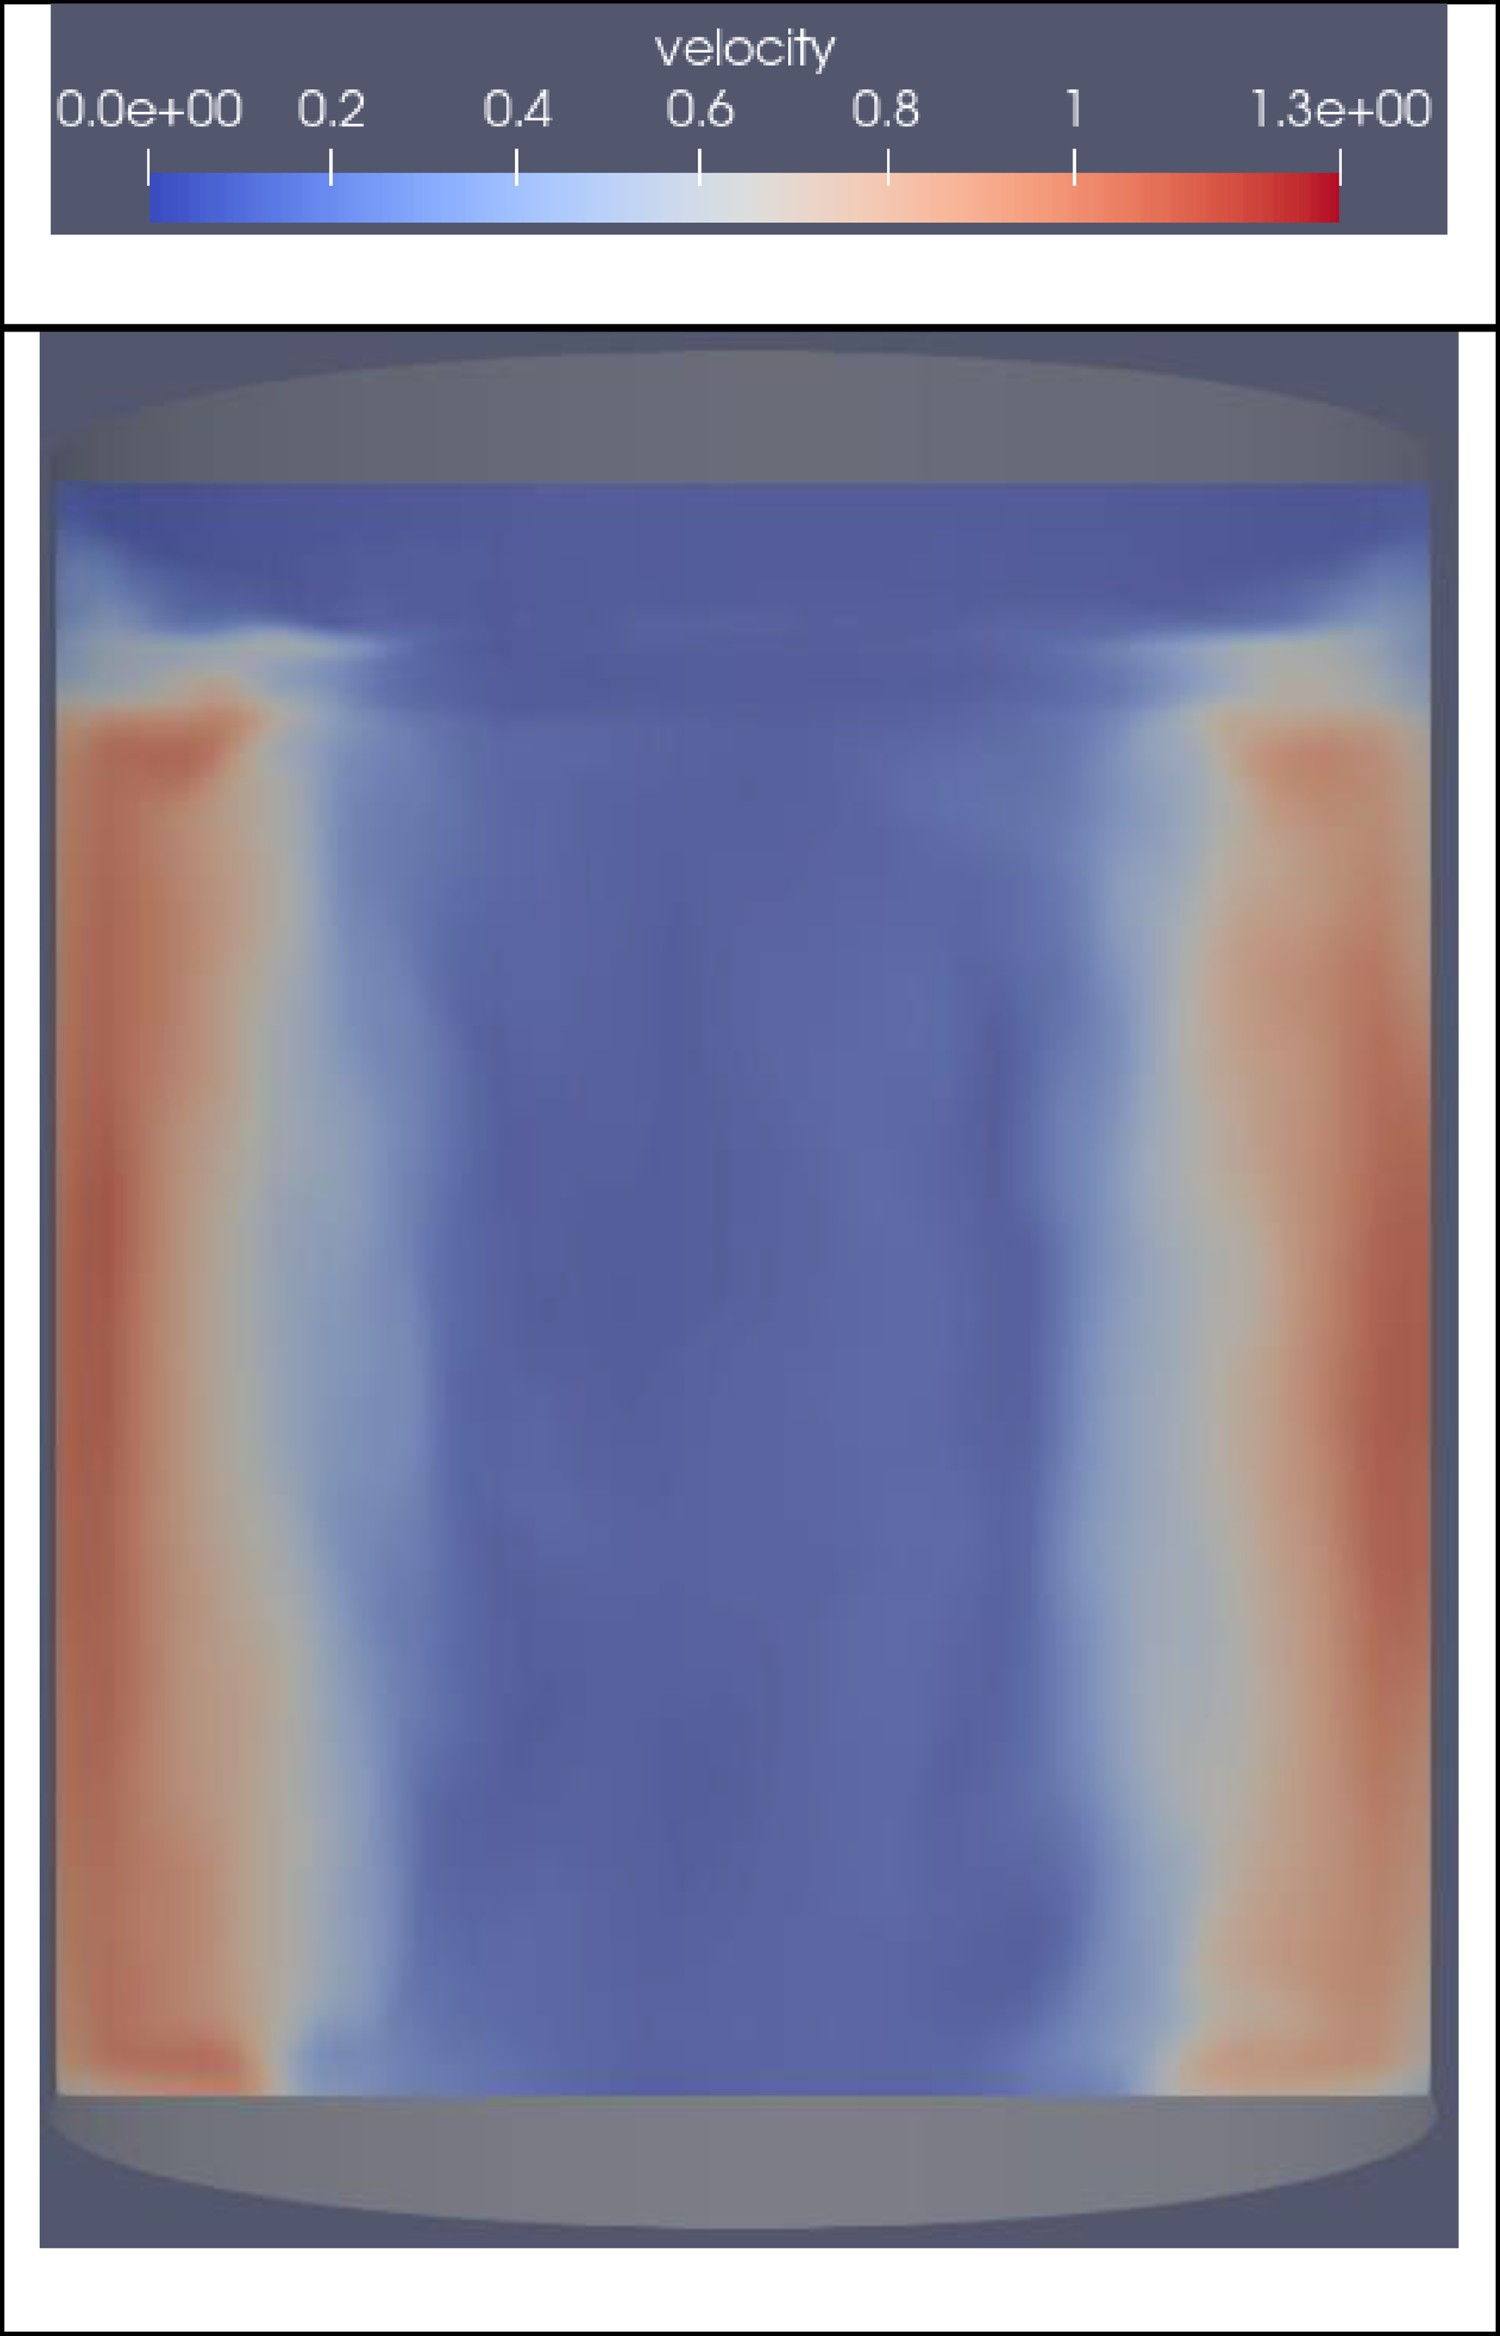
Figure 4 shows the cross-section views of the velocity field. The first two figures show flow profiles at planes of 250 and 1200 mm from the bottom of the ladle, respectively. Figure 4(c) shows the same field parameter at the steel-slag interface. The centre of the stirrer is located at 1200 mm where the maximum magnitude of the force field occurs. Figure 4(b) shows that the largest velocity magnitude occurs in the level of stirrer centre at 1200 mm. It can be seen that the maximum radial velocity is located in the 4th quarter of the domain which corresponds to the location of the stirrer in Figure 1. The figure also suggest that the velocity reduces as the liquid travels towards the 1st and 2nd quarter while it registers the lowest magnitude in the near-wall region at 180° (left-end of the horizontal line of the circle); the same behaviour can be seen at level 250 mm (Figure 4(a)). At the interface level (Figure 4(c)), the velocity magnitude has its lowest value compared to the other two levels. Of course, part of the momentum of steel phase dissipates into the slag phase since the magnetic force only applies in the steel and not the slag. The movement on the slag layer, therefore, is caused by viscous forces between the steel and slag phase. (a) Velocity field 250 mm from the bottom. (b) Velocity field 1200 mm from the bottom. (c) Velocity field at steel-slag interface.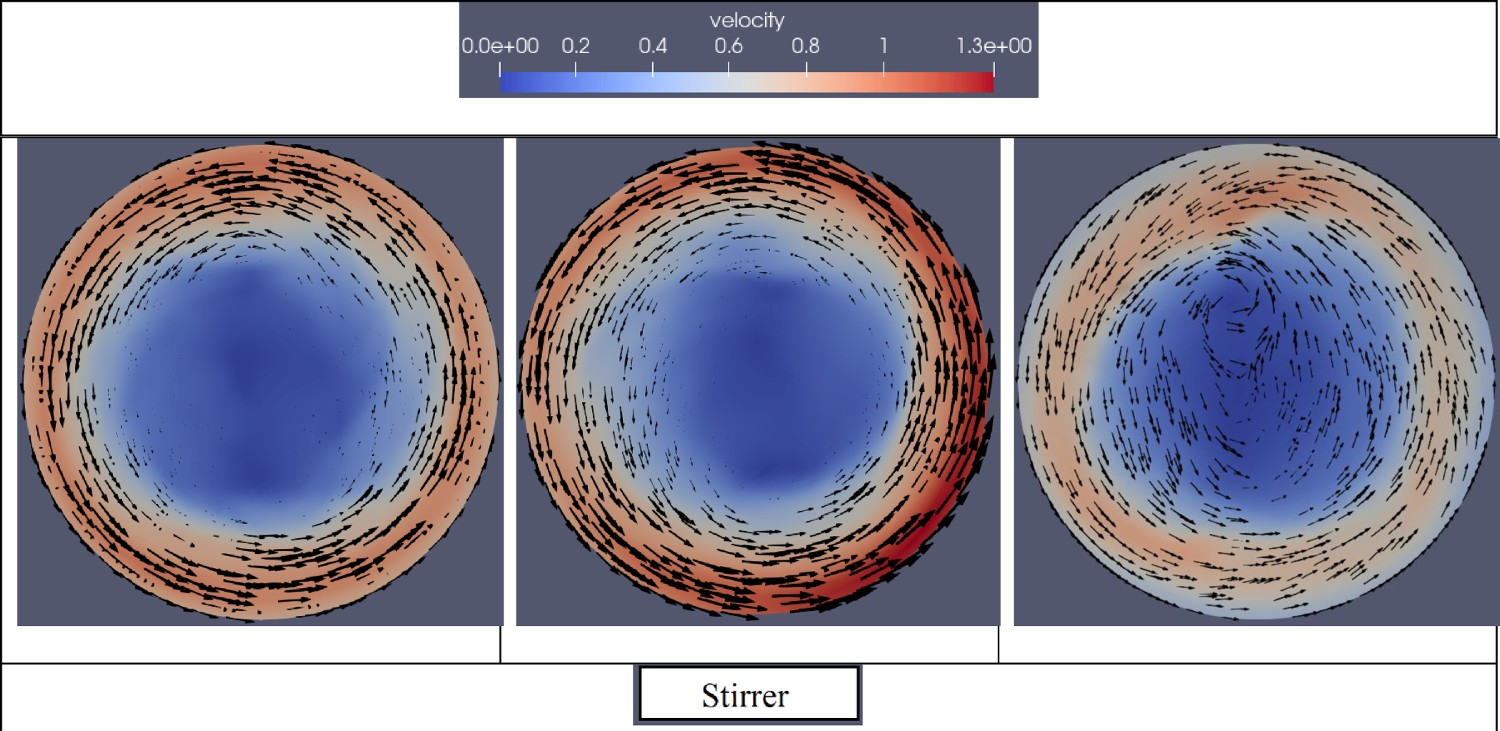
An important aspect of the ladle refining process is the inclusion removal. To that end, the objective of the ladle stirring is to bring the inclusion into contact with the slag layer. Of course, the current model has not included inclusion particles modelling but it is important to plot path-lines of different locations inside the ladle as affected by the flow field generated by the horizontal stirring force to investigate the movement within the liquid phases. Of course, a further study of combining Lagrangian approach with one-way coupling between floating particles and the liquid medium has the potential to improve the understanding of the effect of such a novel strategy on the profile of inclusion. While such a study has not been included in this work, a future study intends to investigate the behaviour of floating particle during HEMS combined stirring.
Figure 5 shows four different points which are chosen to plot the streamlines. These points are located at 10 mm above the bottom of the ladle at centre (0 mm), 200, 500 and 1000 mm from the centre line and are coloured red, green, blue and purple, respectively. Points of origin for streamlines.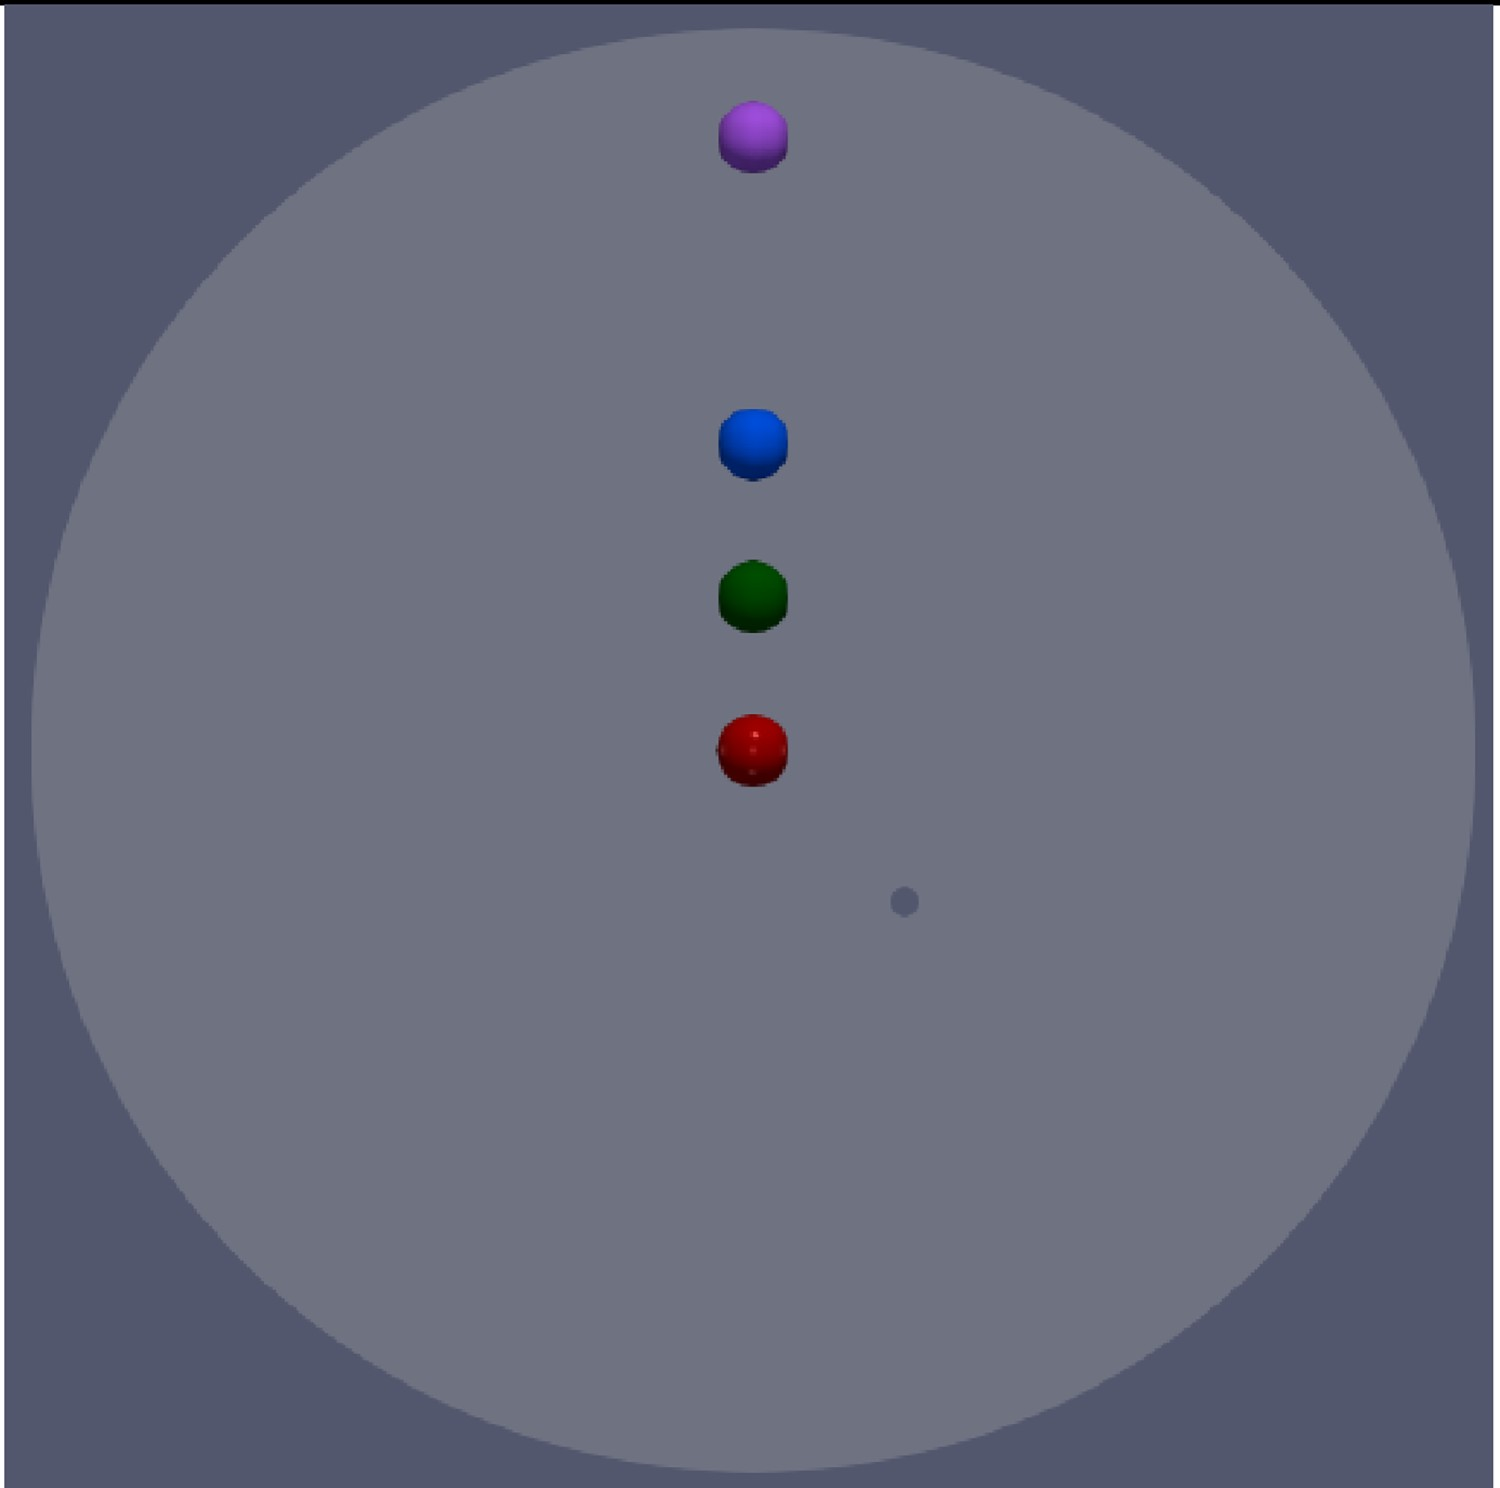
Figure 6 shows streamlines for points one and two i.e. centre point and 200 mm off-centre. As can be seen, both positions register very similar path-lines where the path-lines move along the vertical path and almost half-way between point blue and point purple, it is caught by the rotational movement of the steel phase and moves upwards in a spiral path-line. (a) Streamlines for points one and two: top view. (b) Streamlines for points one and two: side view.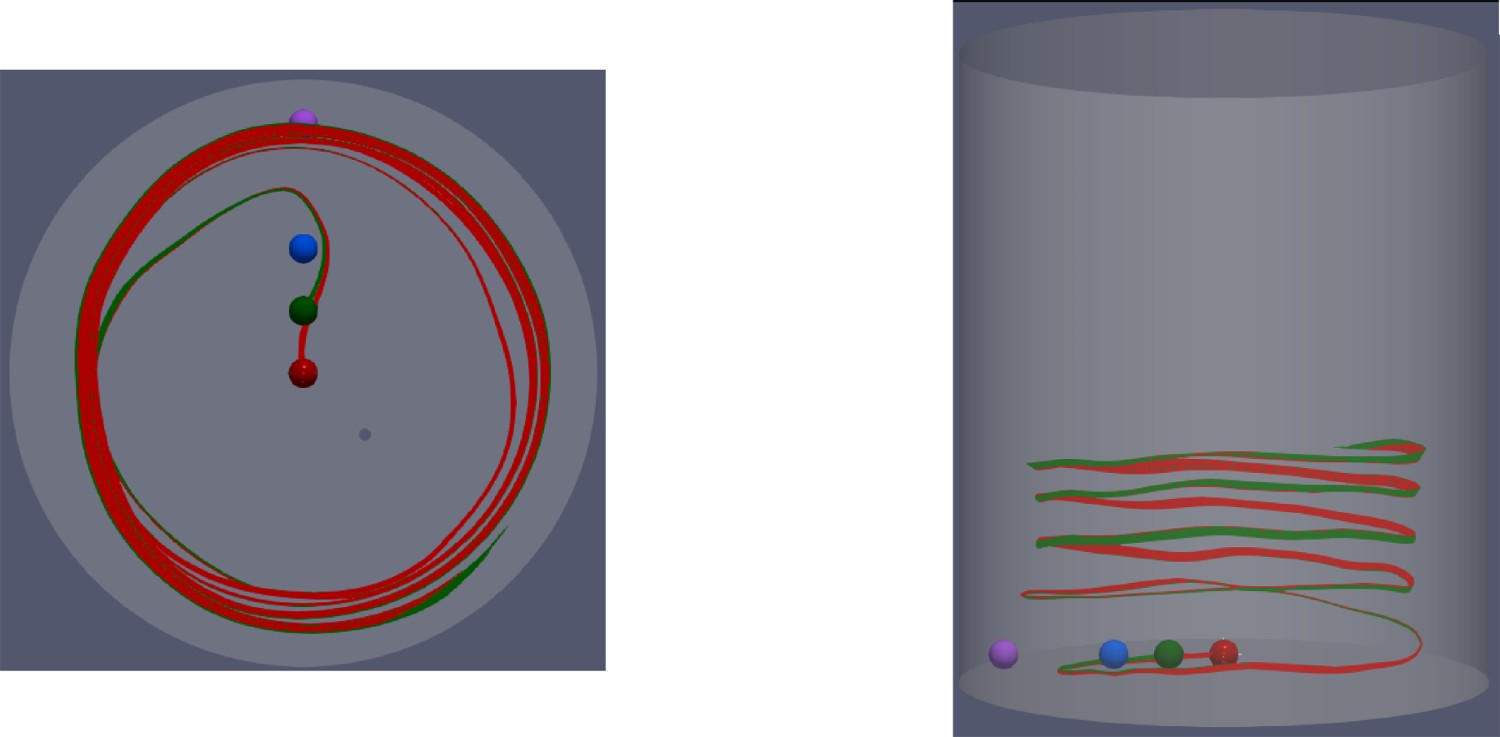
Figure 7 shows similar streamlines for points three and four i.e. 500 and 1000 mm off-centre. As can be seen, a hypothetical particle at point four stays in a rotational movement at a nearly constant radius from the central axis similar to points one and two. But the upward movement of such a particle is not as clear-cut as the first two points and covers a longer pathway. The same can be seen for point three but, for point three one can see that the particle does not stay in a constant rotational pathway. Figure 7(a) shows that such a hypothetical particle will move inward (towards the centre axis) and back while it does not overpass a certain radial limit and does not reach the purple line. (a) Streamlines for points three and four: top view. (b) Streamlines for points three and four: side view.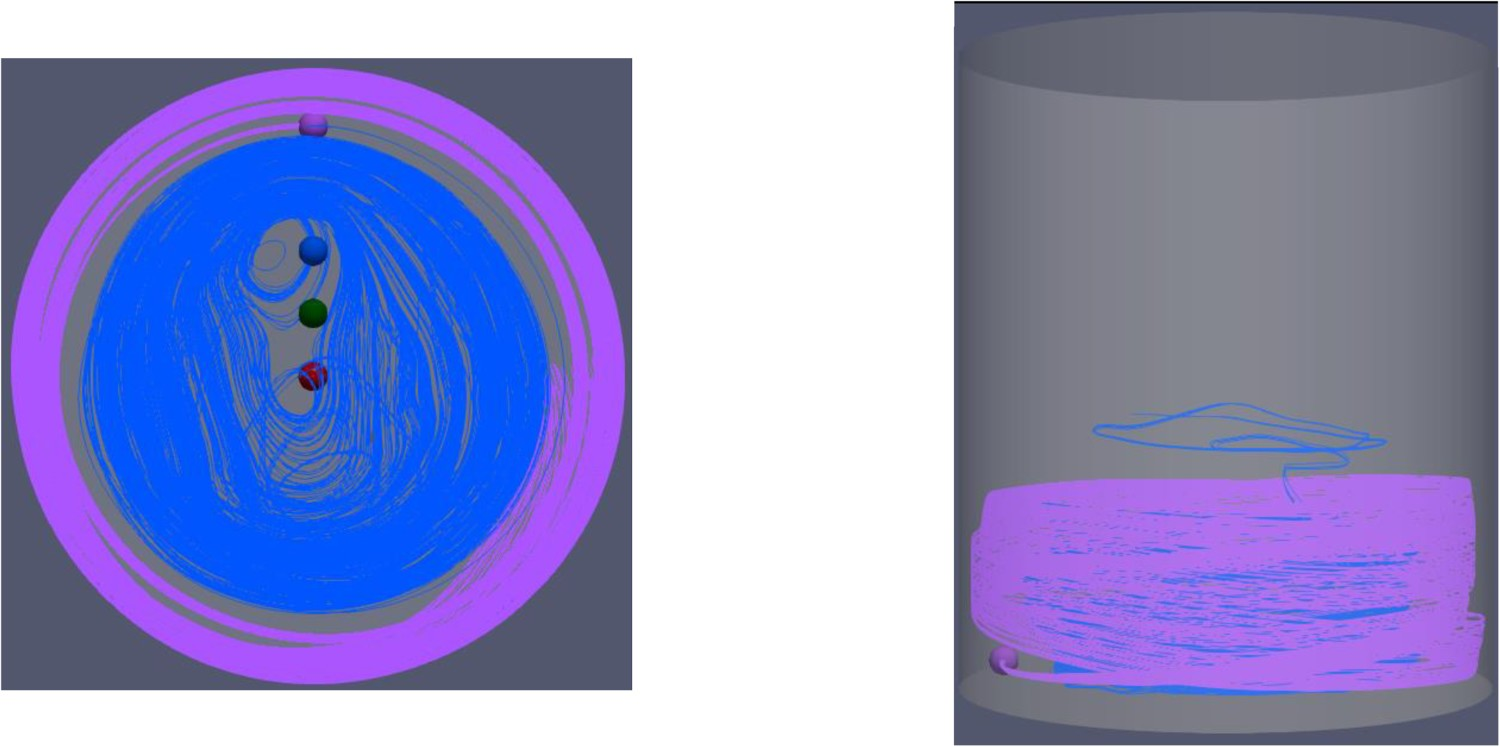
This can be due to the location of point three. With respect to Figure 4, one can immediately see that point three is in the region of brighter colour between central blue and near-wall red (velocity field in induction stirring). Therefore, it can be assumed that it transits in and out of the darker red and darker blue near the bottom of the ladle until it settles in and start its upwards movement. Moreover, the figure seems to suggest in this region there might be some local small vortices which the path line is caught into it and start to rotate until it comes out of rotation and moves into the main flow path.
Combined stirring
As mentioned above, the gas was injected after 60 s of pure induction stirring. To investigate the effects of combined stirring strategy, four different volumetric flow rates were used i.e. 20, 50, 75 and 150 NL min–1. The objective is to disperse the bubbles more within the liquid bath and increase the resident time of each bubble during the final stage of a ladle refining process.
Of course, it should be mentioned that the industrial application of the ladle gas stirring uses larger flow rate compared to the current study. Meanwhile, the current stirring strategy was to use this process not as a main stirring strategy but as a final step in the clean steel production. Therefore, a very low flow rate in combination with the horizontal stirring would be adopted.
Moreover, the normal argon flow rate during the soft stirring is known to be dependent on the ladle heat size with a typical value in the range of 0.5–1.0 (NL/min/ton of liquid steel); assuming a ladle in the size of 70 ton, a proper argon flow rate would be in the range of 35–70 NL min–1. With this thought in mind, this study tried to look into very low gas flow rate to investigate the effect of such a stirring strategy in the final (5 min, as an example) stage of the stirring.
A flow rate of 20 NL min–1
Figure 8 shows the gas plume profile at 60 and 300 s after the start of the injection where the thick black region represents the slag at the top of the steel bath. As can be seen, Figure 8(a) suggests that the gas plume is affected by the horizontal movement of the liquid bath. In an upward vertical induction stirring, the gas plume tends to travel upward from the injection point and therefore, the open-eye(s) usually form above the porous plug(s). When using a combined stirring, one can see that the plume, instead of vertical penetration towards the surface, is distorted from the vertical axis of the injection point towards the side walls. Hence, bubbles are dispersed along the radial direction and move in a spiral form upwards. This behaviour is clearly illustrated in Figure 8(b) which shows the plume profile after 300 s from the start of the gas injection. (a) Gas plume after 60 s from start of gas injection for flow rate of 20 NL min–1. (b) Gas plume after 300 s from start of gas injection for flow rate of 20 NL min–1.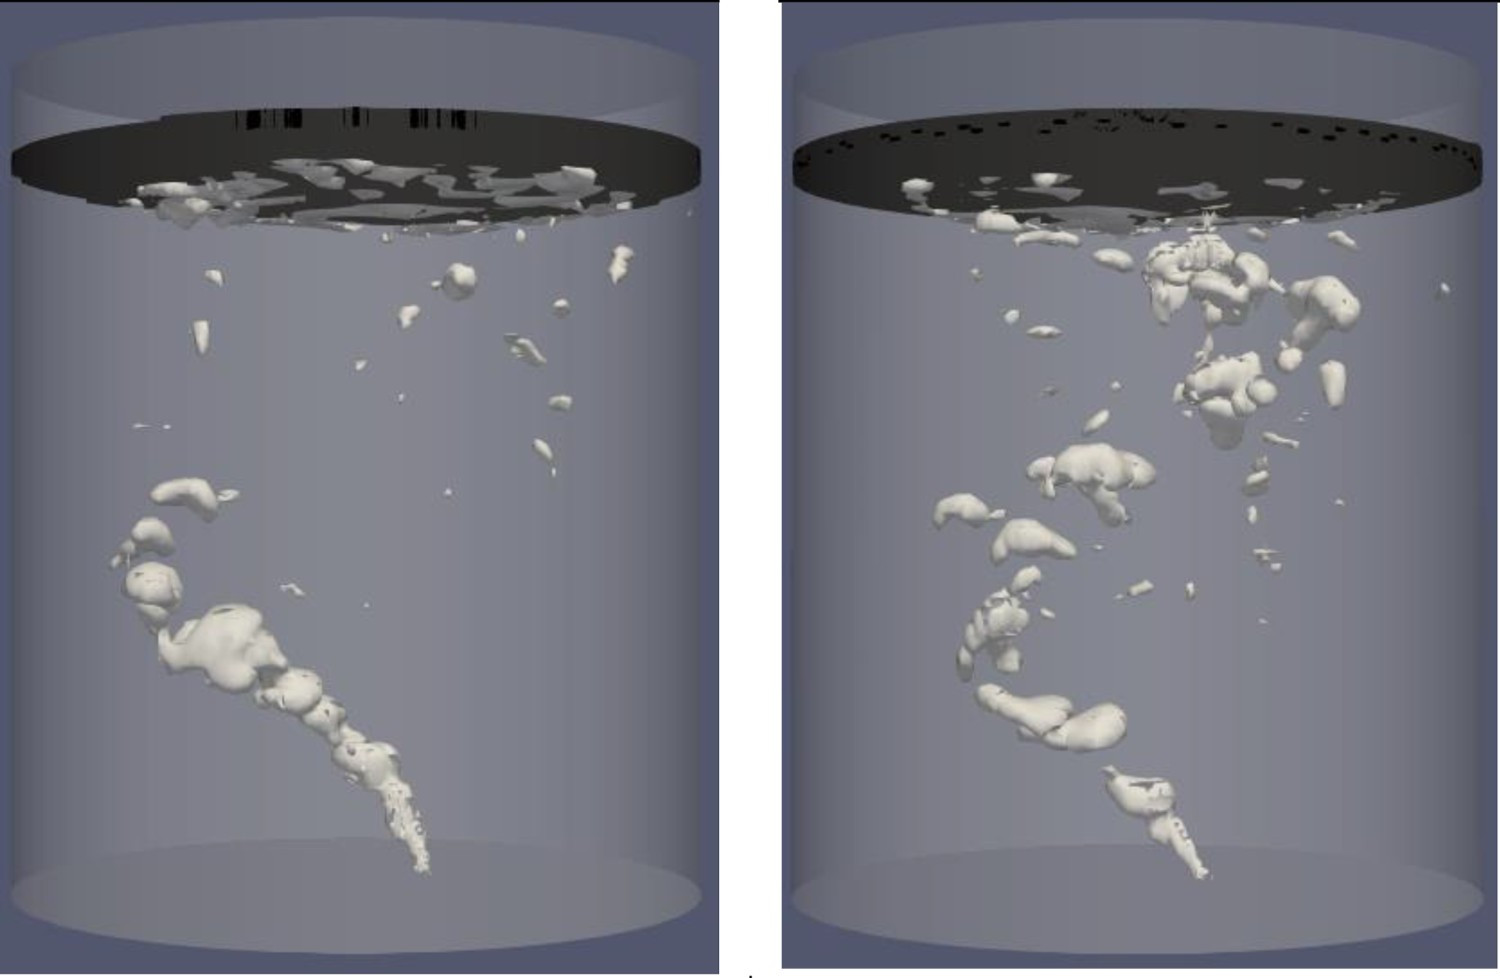
At the slag level, it is seen that a large contact area of bubbles with the slag layer exist. Therefore, it is natural to assume that, consequently, the steel should be largely exposed through openings of the slag layer.
Figure 9 shows the slag layer profile at 60 and 300 s from the start of gas injection. It can be seen that the slag layer is held together and there is no exposure of the steel to the surrounding environment. Of course, looking at the snapshots of ladle process does not express the evolution of the steel exposure throughout the refining process. Therefore, using the ImageJ application, a quantitative study of the area of exposure has been performed for a sequence of data with the frequency of 5 s. (a) Slag layer profile after 60 s from injection. (b) Slag layer profile after 3000 s from injection.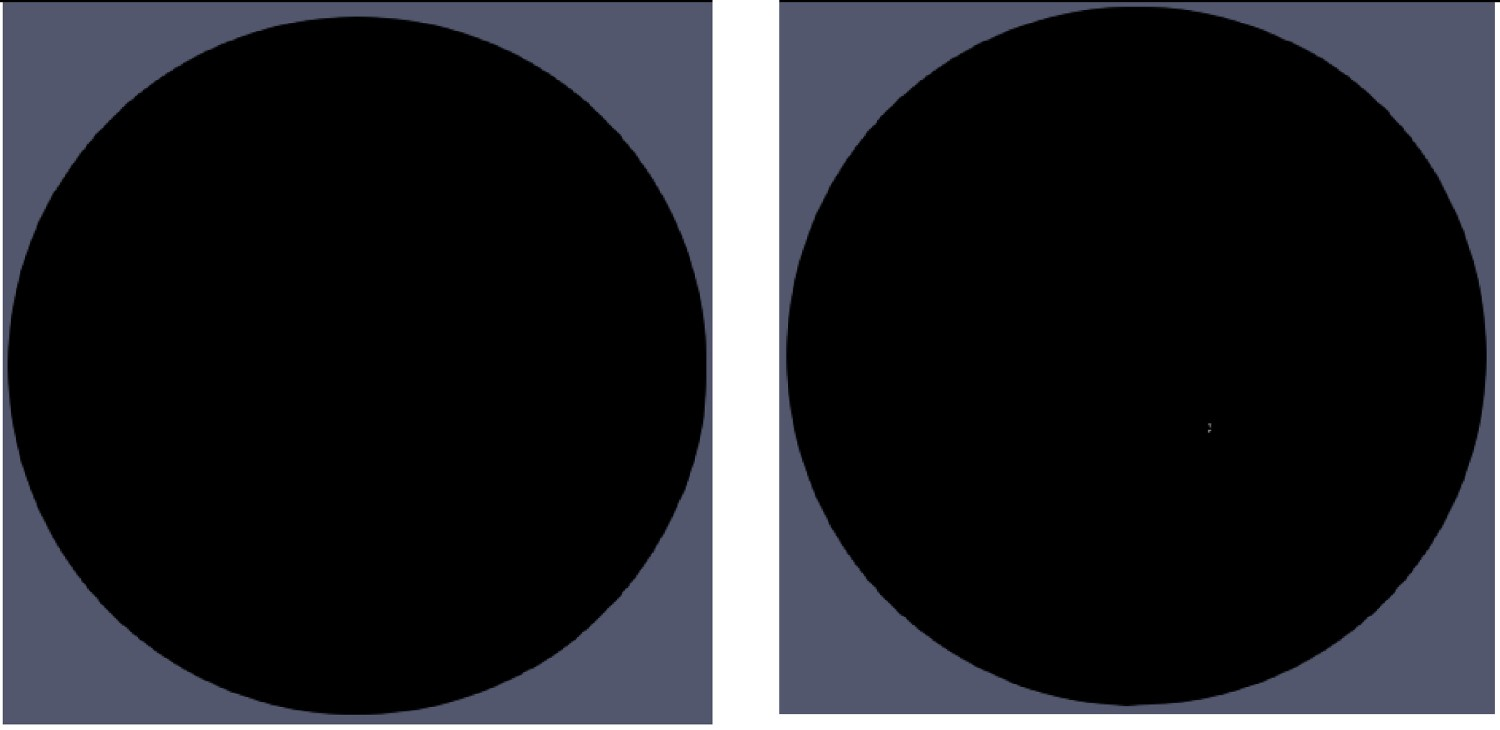
In this approach, after calibration of the application, a series of figures similar to the figure presented above were fed to the ImageJ which the application outputs the size of the white/grey region within the black coloured surface; Figure 10 shows an example of the input data. Input data to ImageJ for calculation of the exposure area (open-eye).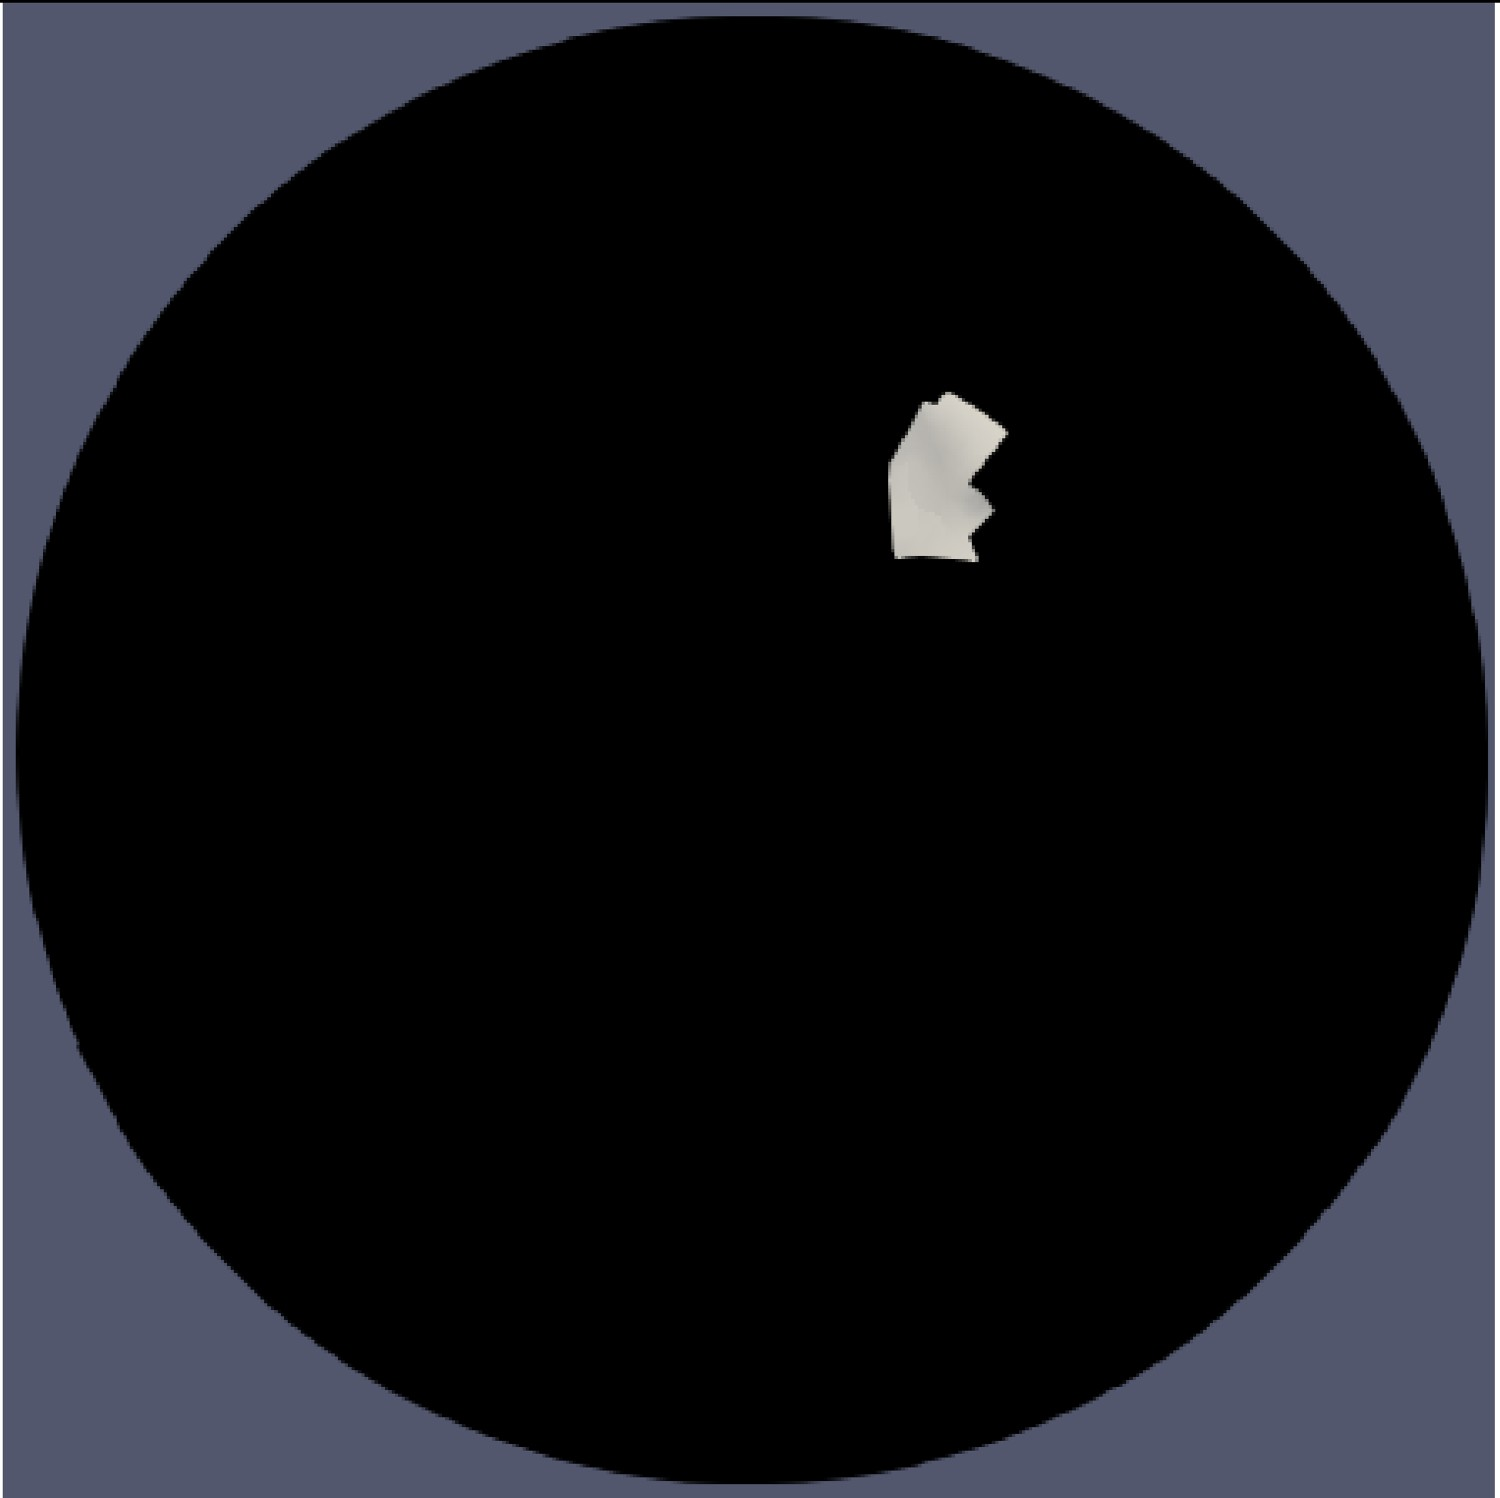
Using a sequence of such input data, it is possible to plot the evolution of the exposure area (open-eye) with time which is presented in Figure 11 in percentage of the total cross-section area. Evolution of open-eye size and number of break through of the slag layer.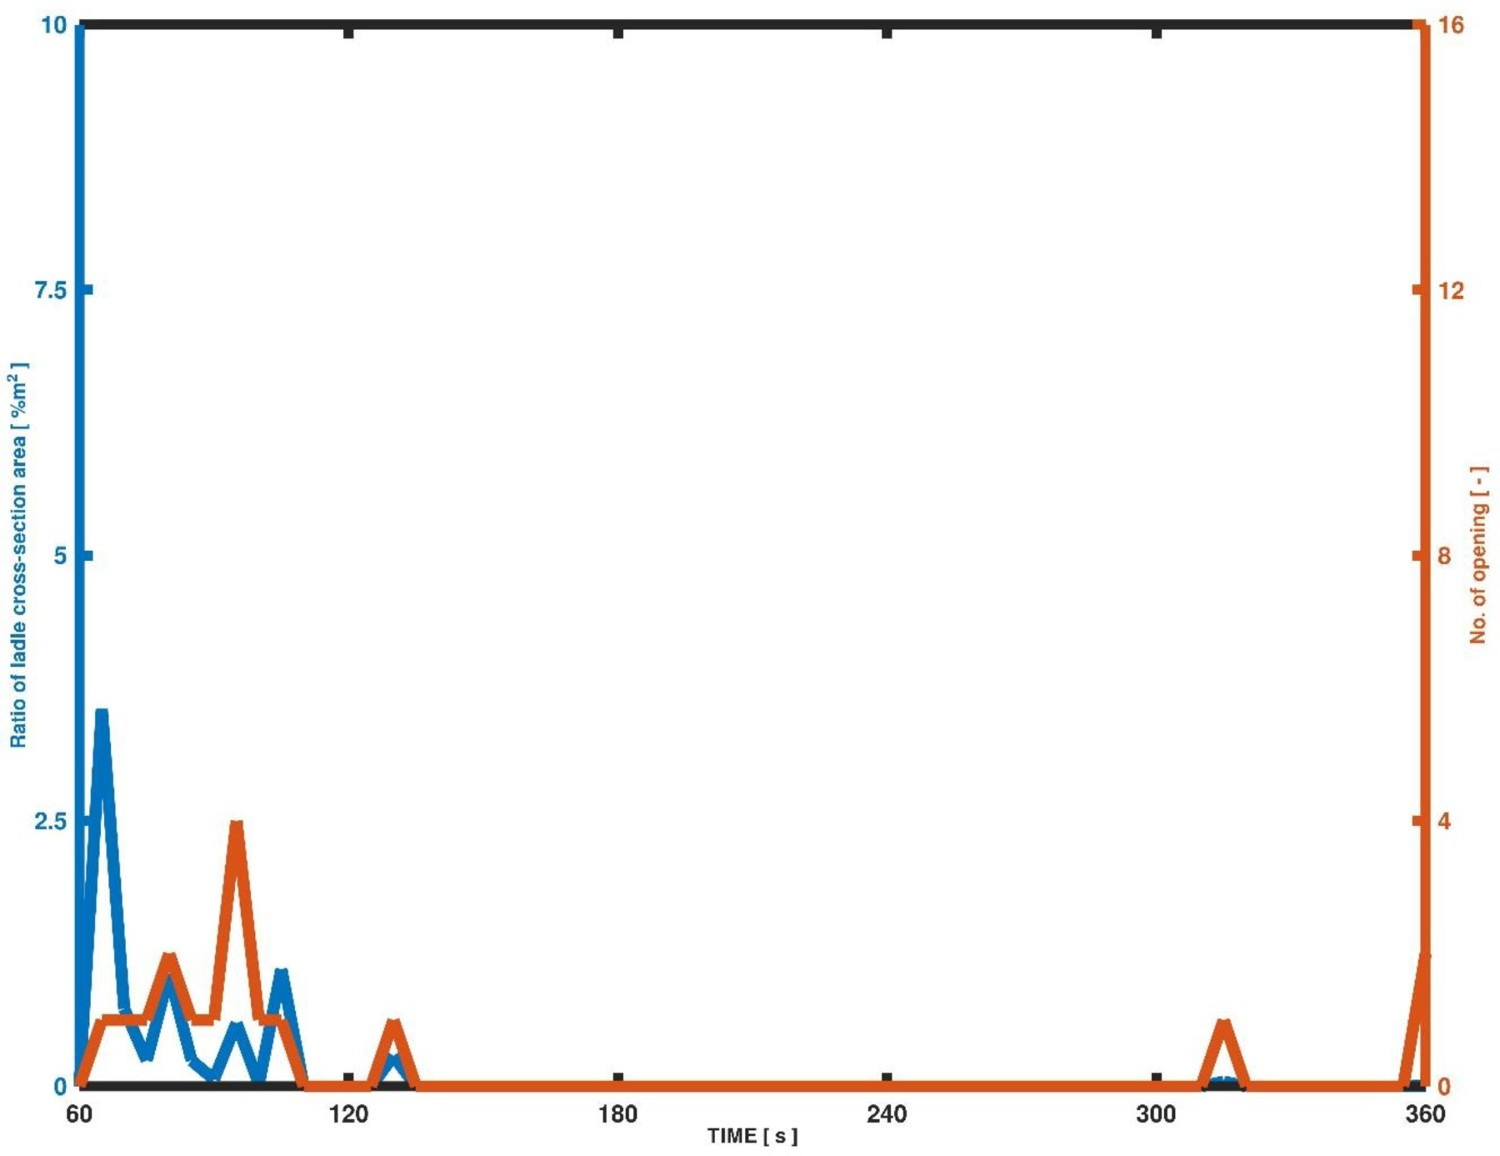
As can be seen, the figure suggests that most of the exposure occurs within the first sixty seconds of the purging. After the initial sixty seconds the slag layer seems to close down to cover the steel from the surrounding environment with two exceptions of 130 and 315 s. However, it can be seen that the openings at these two instances are small and in case of later one seems to be a tiny gap. Therefore, it can be assumed that the rotational movement of the liquid bath breaks down the upward force of the bubbles and by reaching to the slag layer, bubbles do not have break through the slag layer violently to expose the steel bath. This behaviour can also be observed in Figure 8.
The open-eye during the ladle process is mostly not formed of one opening but a series of breakthroughs where the number of openings is plotted alongside the size evolution of open-eye in Figure 11, simultaneously.
The figure seems to suggest that at the very beginning of open-eye formation, these opening are caused by larger cluster of bubbles collectively moving upwards whereas, after the initial opening stage the exposed surface area reduces while the number of opening increases. This could mean that bubbles are being dispersed through the bath and break away from their cluster.
A flow rate of 50 NL min–1
Figure 12 shows the gas plume profile at 60 and 300 s from the injection of gas with the flow rate of 50 NL min–1. It is possible to see that the volume of gas within the steel bath has increased i.e. larger number of bubble clusters. (a) Gas plume after 60 s from start of gas injection for flow rate of 50 NL min–1. (b) Gas plume after 300 s from start of gas injection for flow rate of 50 NL min–1.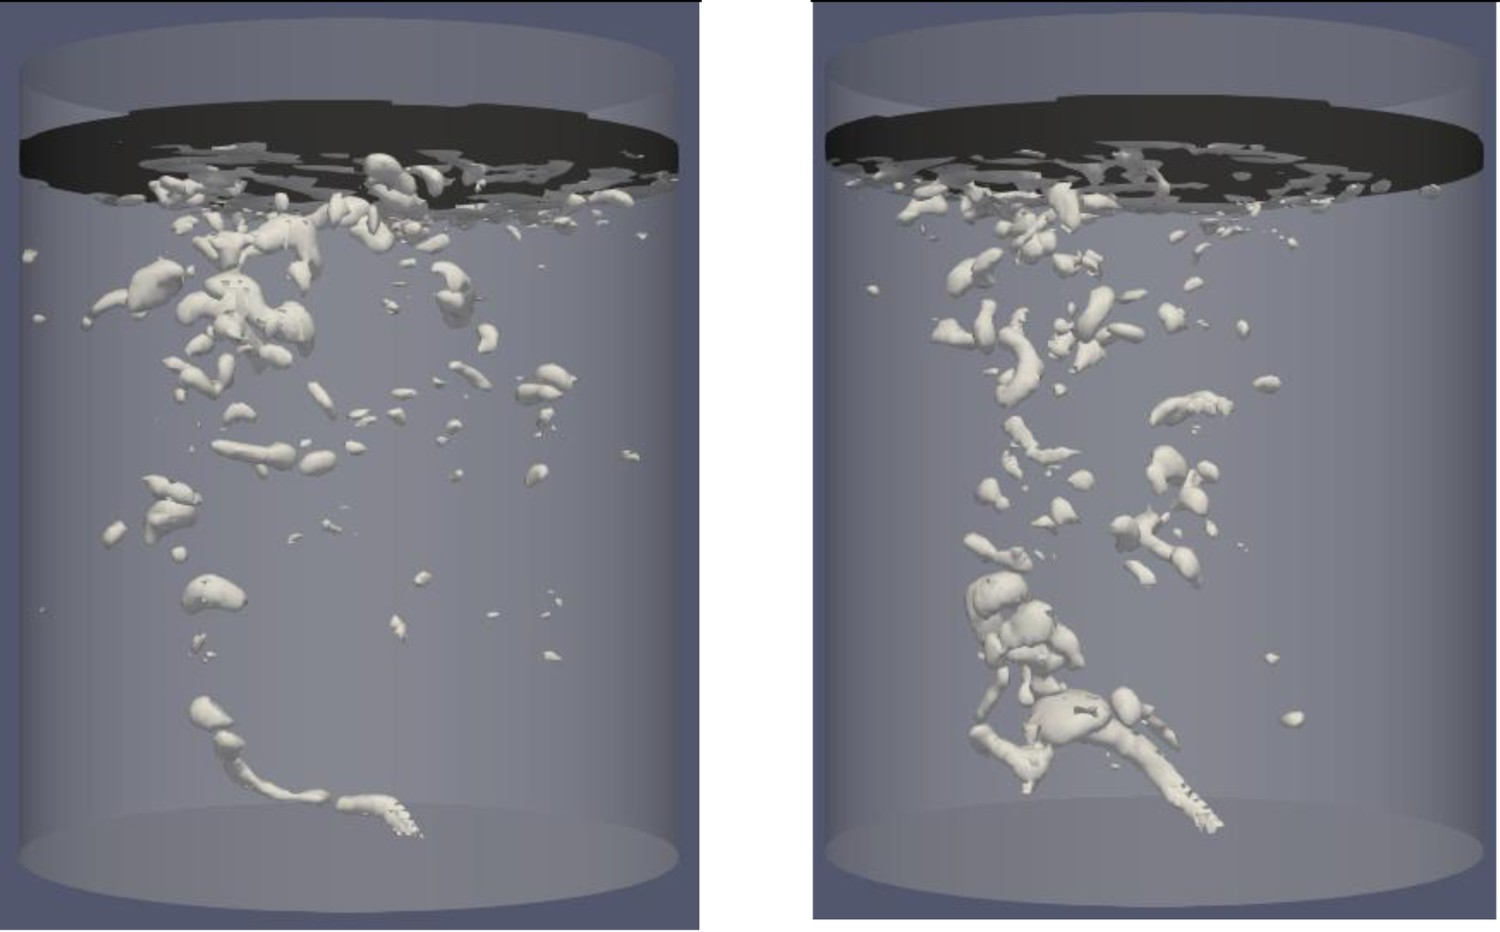
It can be seen that in these two snapshots, most of the bubbles are located in the left half of the ladle at the lower level of the liquid bath while, at the upper region of the liquid, bubbles are distributed more in radial direction. The figure also suggests at the slag layer, in both instances, bubbles are in contact with almost all the slag layer surface area.
Similar to the previous case study, Figure 9, instantaneous counter plots of the slag layer at 60 and 300 s showed a solid black area at the top (and therefore it is omitted) which proposes that this large contact does not lead to a violent eruption of bubbles through the slag layer. Therefore, it can be concluded that the bubbles momentum force has dissipated into the liquid phase and upon reaching the slag layer, it contacts the layer radially and diffuses though.
Figure 13 shows the area of the steel exposure with respect to the total cross-section area in percentage. Again, one can see that the exposure of steel to the surrounding occurs at the first 60 s of the simulation with one other significant occurrence at 265 s (205 s after injection) and three minor occurrences in the last 60 s. Otherwise, it can be seen that through the rest of the simulation interval, the slag layer holds together and no breaking in the slag layer can be seen. Evolution of open-eye size and number of breakthroughs of the slag layer.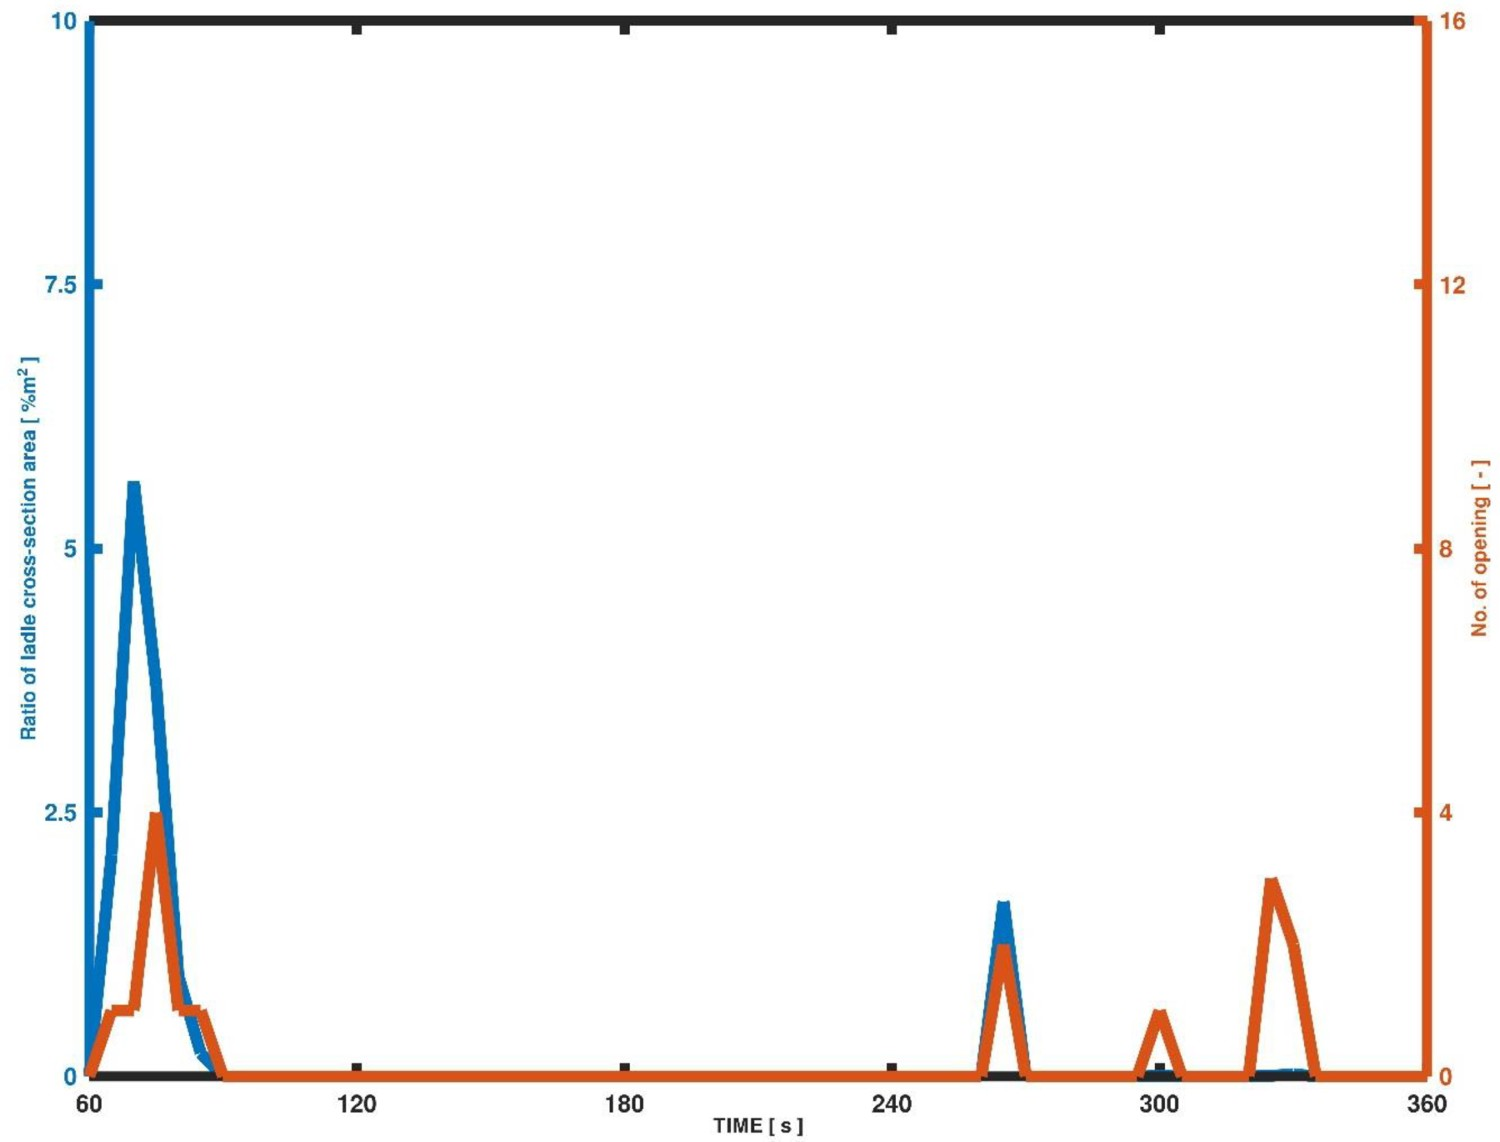
Moreover, the figure shows the area of the exposure simultaneously with the number of openings at the slag layer. It can be seen that at the beginning the largest exposure is caused by one break through while after the initial 60 s of the purging, the number of openings are more than one while the exposed surface area is not that large.
A flow rate of 75 NL min–1
Figure 14 shows the gas profile within the steel phase for flow rate of 75 NL min–1. One can immediately see that the population of bubble clusters has increased while, Figure 14(a) suggests the bubbles are almost radially distributed into the melt at the upper two-third of the domain. The figure suggests that in the lower one-third of the region the gas plume holds together while it is distorted from the vertical axis but then it breaks into clusters of bubbles and these clusters are then affected by the radial movement of the melt. This radial movement, then, distributes the clusters to other regions of the melt and at least one bubble cluster can be found in almost every part of the melt. (a) Gas plume after 60 s from start of gas injection for flow rate of 75 NL min–1. (b) Gas plume after 300 s from start of gas injection for flow rate of 75 NL min–1.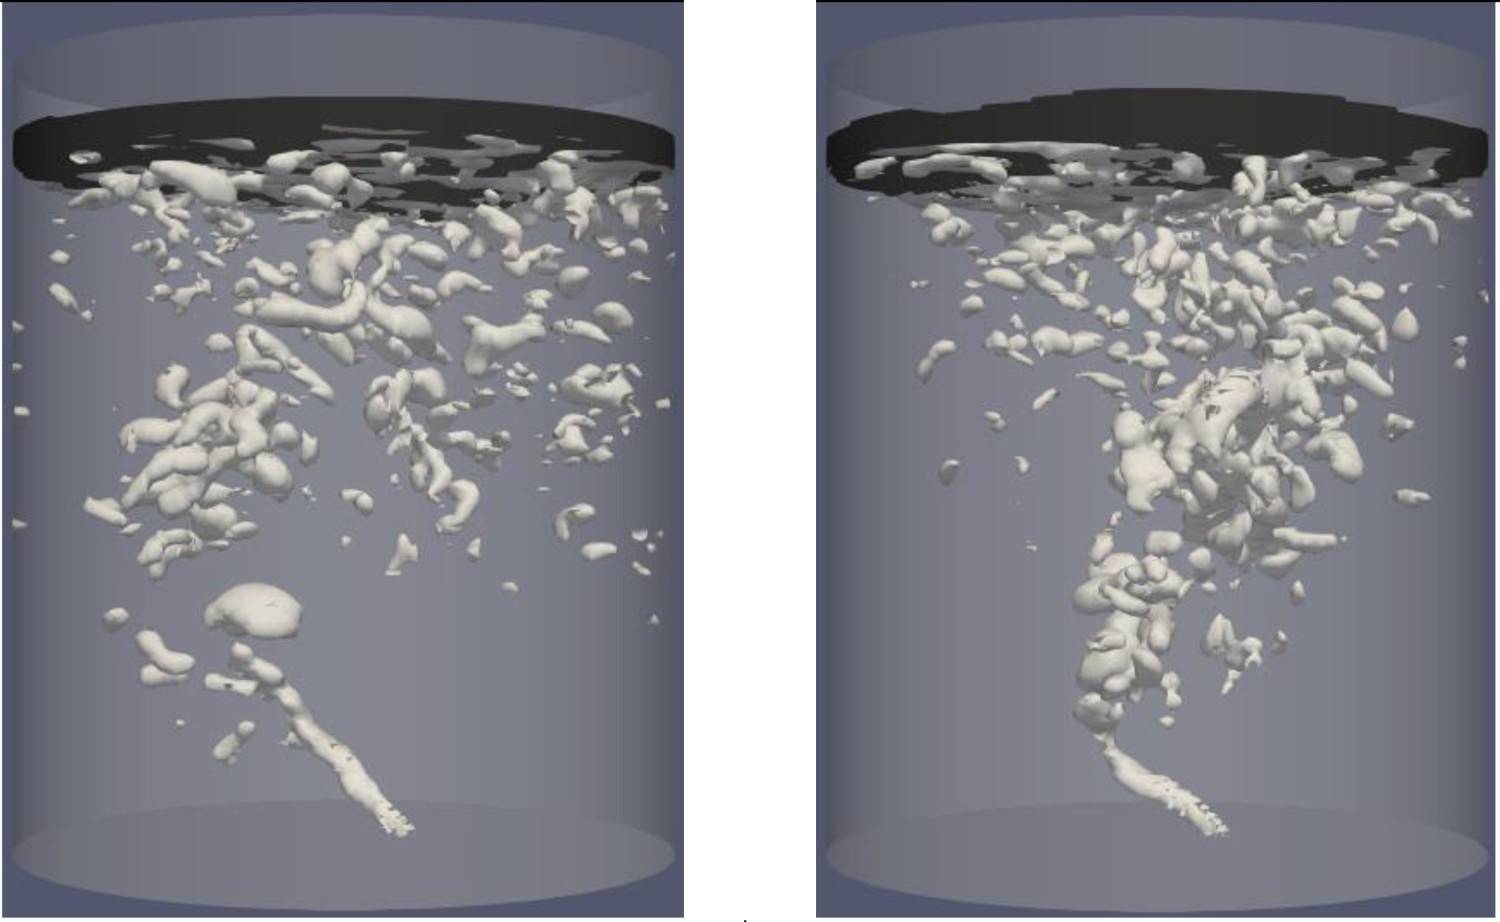
Figure 14(b), which shows the gas profile after 300 s into the purging, seems to suggest clusters are not as widely distributed as the case of 60 s (Figure 14(a)). It can be deducted that the bubbles are more concentrated in the middle one-third of the bath, but it is similarly as widespread in the last one-third as for the 60 s case.
Figure 15 shows the slag layer profile at two instances of 60 and 300 s. It can be seen that unlike the previous two cases representing lower gas flow rates, two and three openings are visible for cases 60 and 300 s into the gas injection. The figure also shows that these openings are not in fact very large, from snapshots of the process. (a) Slag layer profile after 60 s from star of gas injection. (b) Slag layer profile after 300 s from start of gas injection.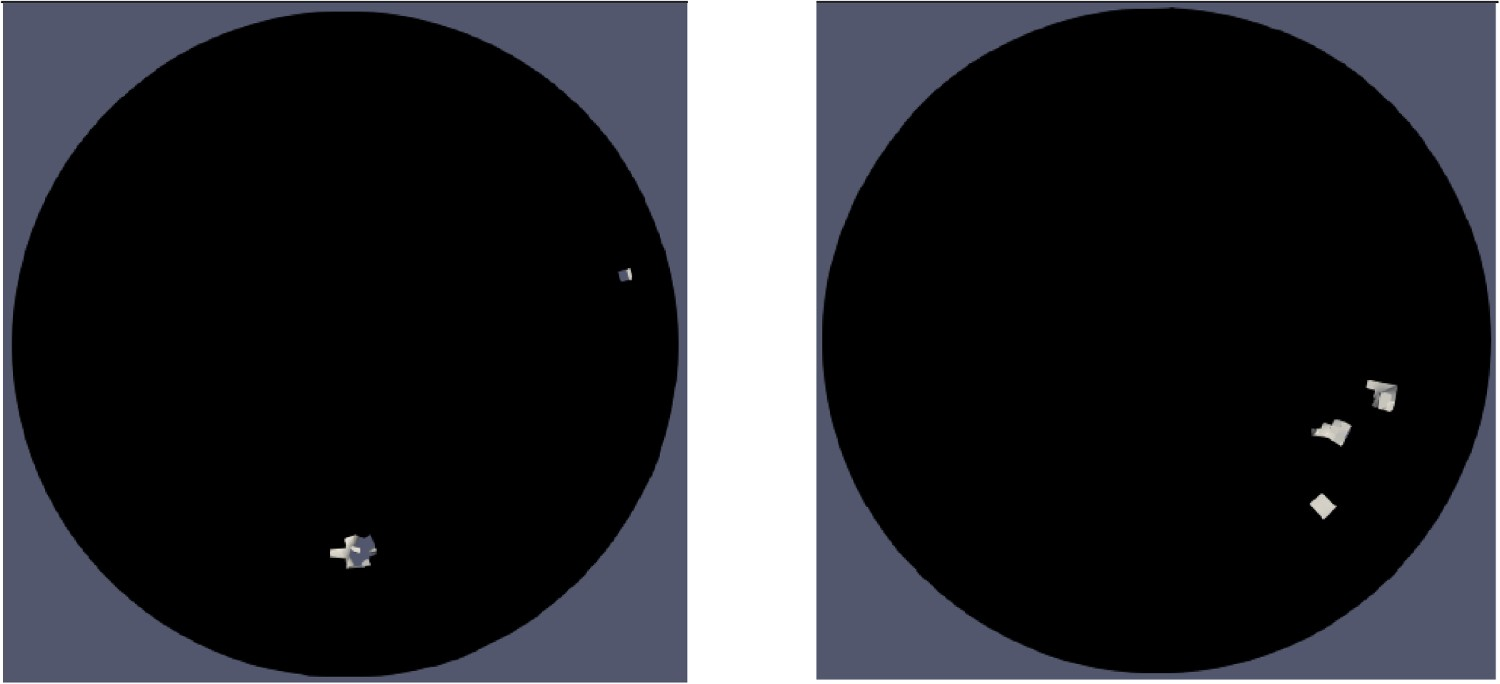
Figure 16 shows the evolution of the open-eyes with respect to simulation time. It can be seen that during the first 50 s of the gas injection, bubbles constantly break through the slag layer and expose a large portion of the steel phase to the surrounding environment. This initial eruptions, then, subside but do not disappear as the previous two cases until another large area of exposure occurs around 180 s (120 s into the gas injection). This trend, then, seems to be repeated in another 60 s but the interval between the two peaks shorten after 240 s (180 s after the start of gas injection). During the last 60 s of the simulation the two largest peaks occur with shorter interval. Evolution of open-eye size and number of breakthroughs of the slag layer.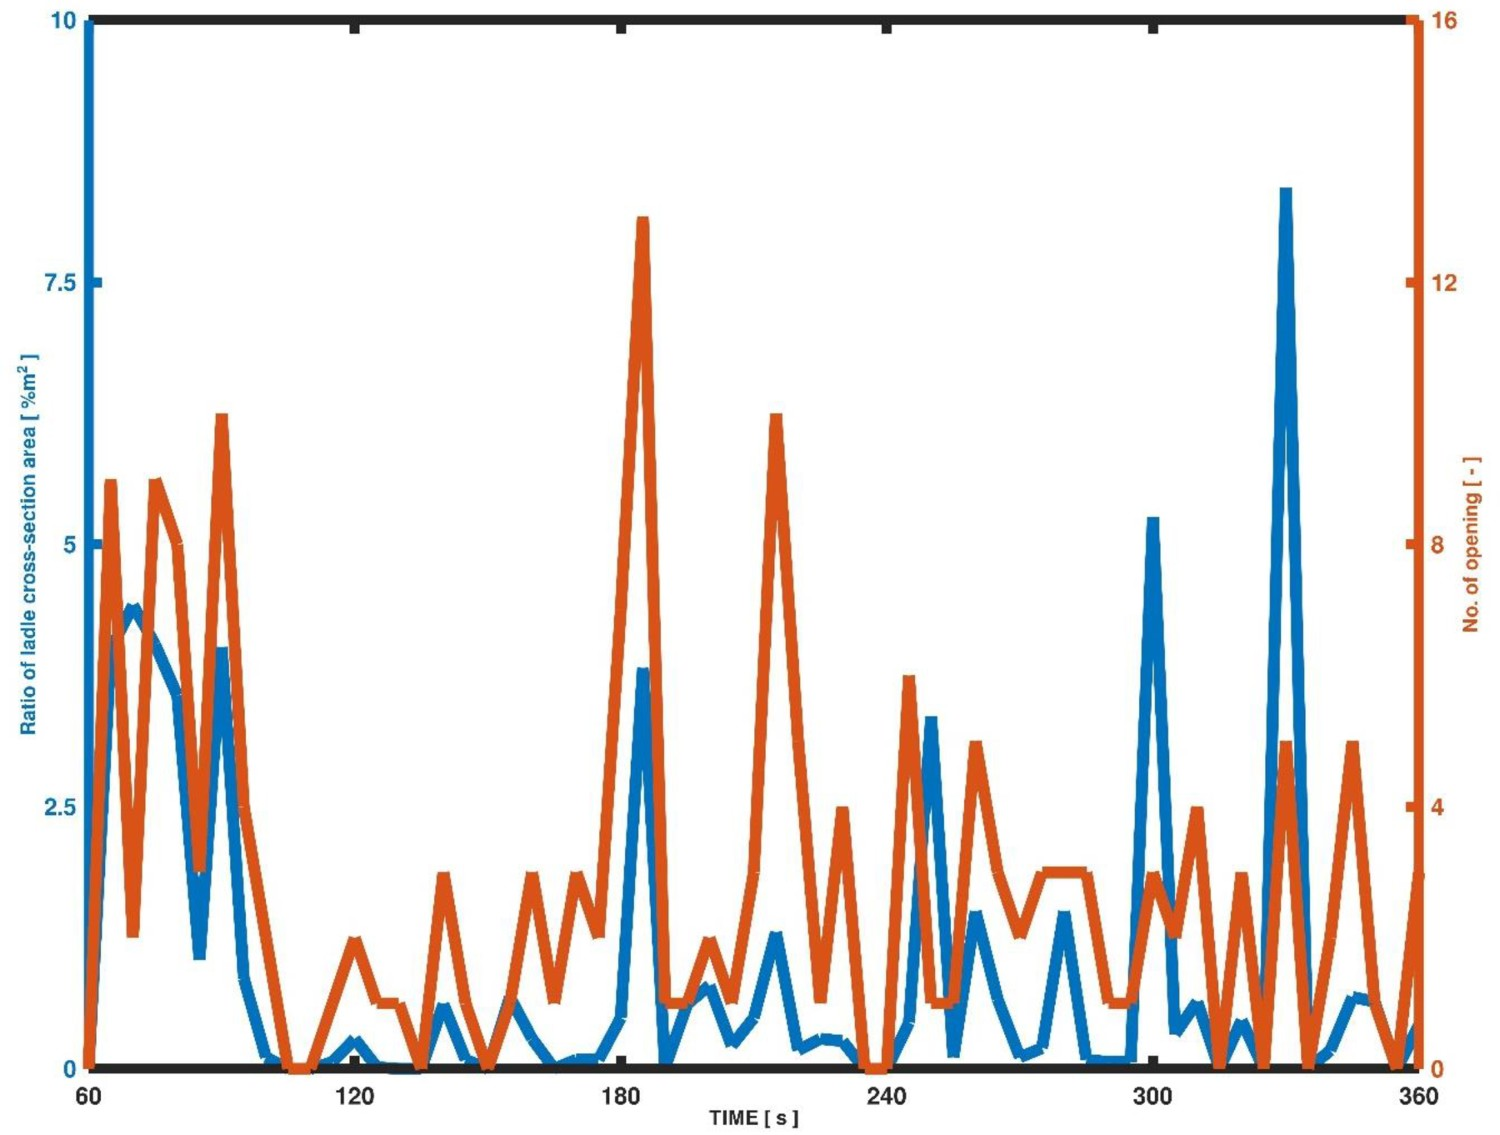
Furthermore, the figure shows the evolution of number of opening simultaneously with the size of the area of exposure. The figure displays that the large area of exposure (peaks) in the first 120 s (from 60 to 180 s) are formed of multiple break through in the slag layer (> 8). This trend, then, changes and during the final 120 s, peaks correlate with lesser number of break through in the slag layer (< 6).
A flow rate of 150 NL min–1
Figure 17 shows the gas profile within the liquid bath for flow rate of 150 NL min–1. As can be seen, the profile is similar to the previous case where the plume is intact in the lower one-third and forms a column but is distorted from the vertical axis due to the momentum force of the liquid bath. One the other hand, in the upper two-third, the column breaks and bubble clusters are formed. Then, these bubble cluster trapped by the radial force of the liquid phase are distributed radially into other parts of the bath. Furthermore, the figure seems to suggest the profile of bubbles distribution does not vary significantly between 60 and 300 s into the gas injection. (a) Gas plume after 60 s from injection. (b) Gas plume after 300 s from injection.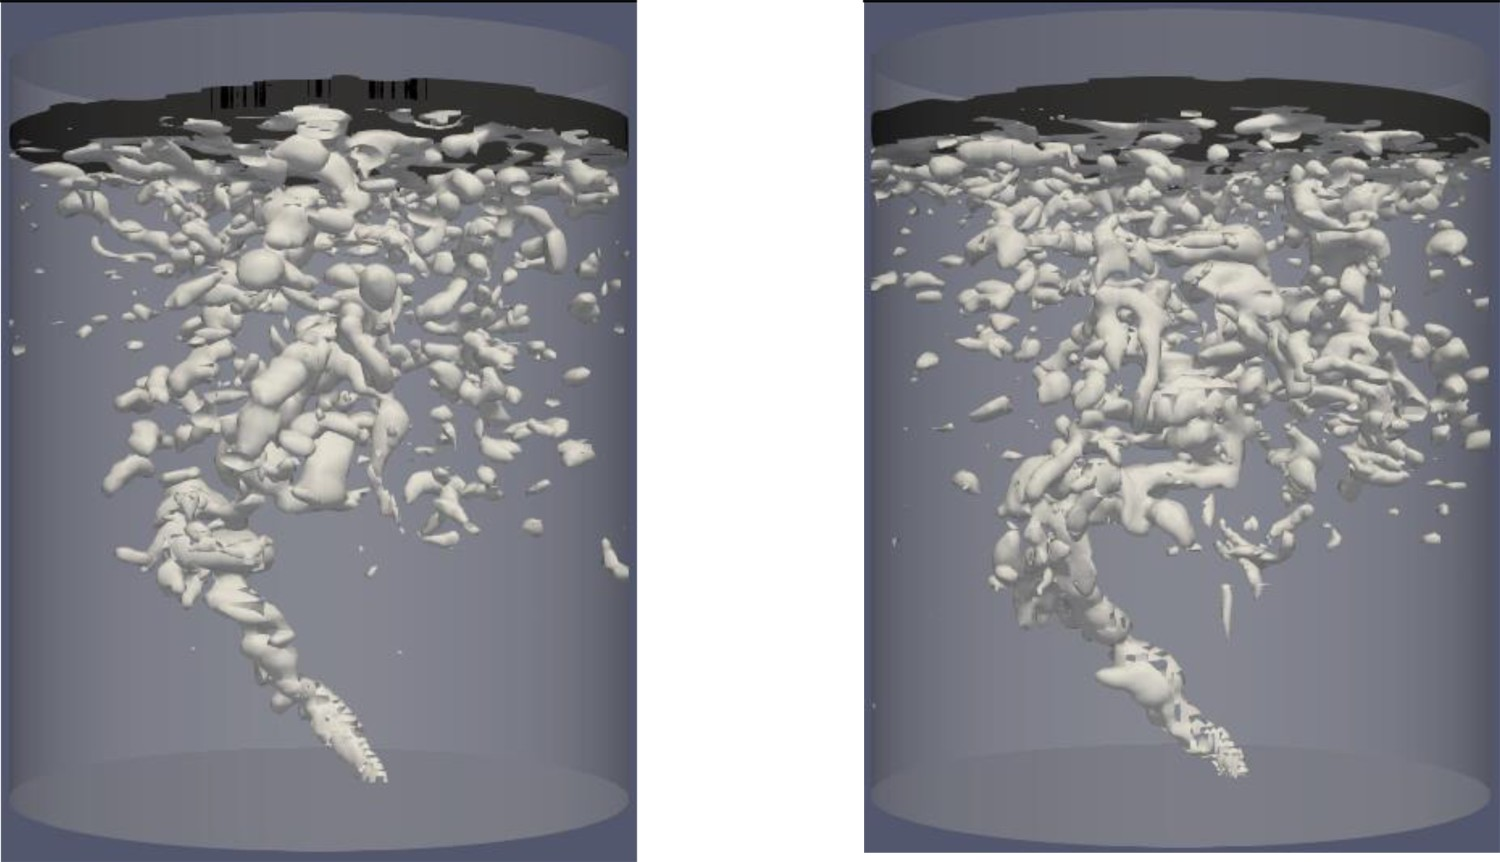
Figure 18 shows the slag profile when the gas flow rate is set to 150 NL min–1. As can be seen, in both instances, the exposed area is formed of multiple breakthrough at the slag layer and these openings are not limited to a specific location. (a) Slag layer profile after 60 s from injection. (b) Slag layer profile after 300 s from injection.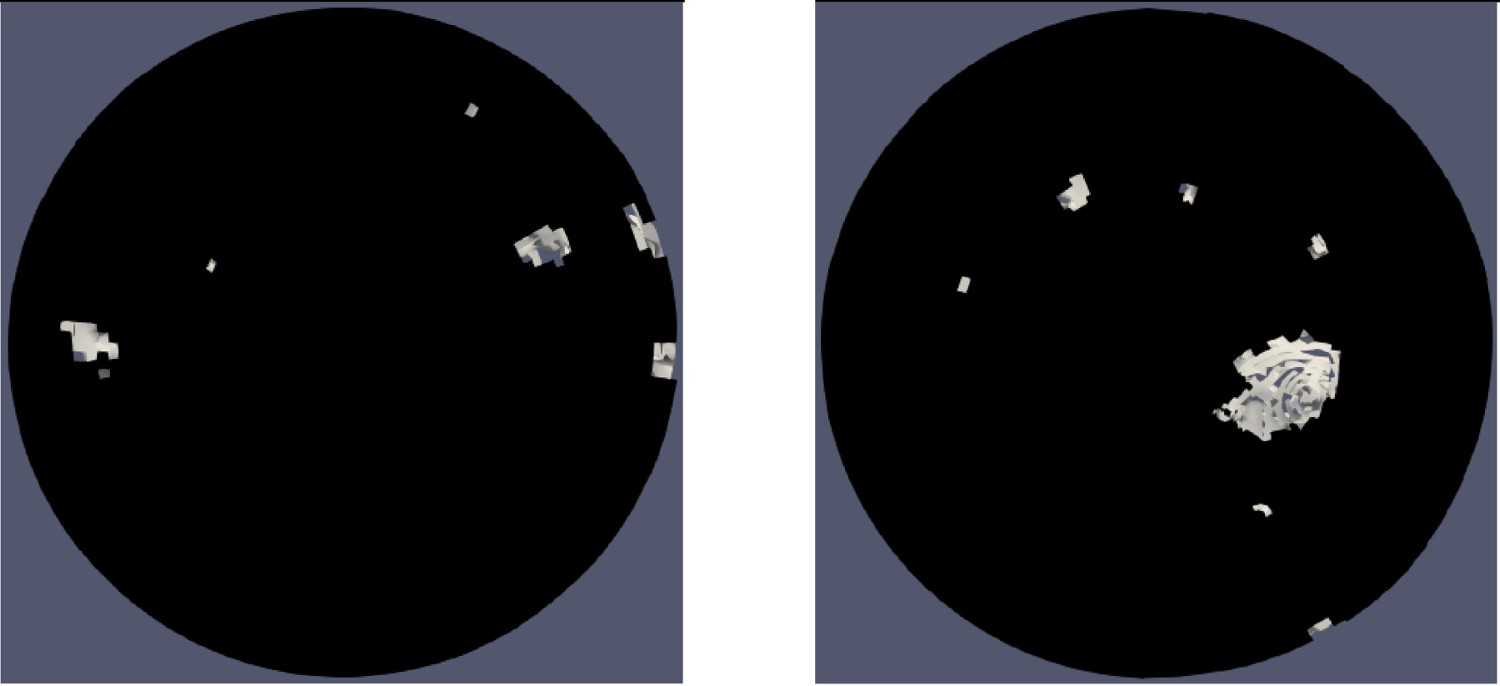
The distributed opening in the slag layer suggests that the bubbles are widely spread through the steel bath and even though the gas column and bubble clusters are affected by the radial movement of the bath, but this is now not enough to break down the momentum of bubble clusters. Hence, the bubbles, upon reaching the slag layer, push the slag away to break through the liquid phase.
Figure 19 shows the evolution of the total area of exposure with respect to the simulation time where the exposed area peaks in the beginning of the gas injection. Furthermore, the figure shows that there are less large peaks (one before 300 s) but simultaneously, in most of sampled instances, the area of exposure is one per cent or more. This is more visible after 180 s till the end of the simulation where there all sampled instances have registered such a values. Evolution of open-eye size and number of breakthroughs of the slag layer.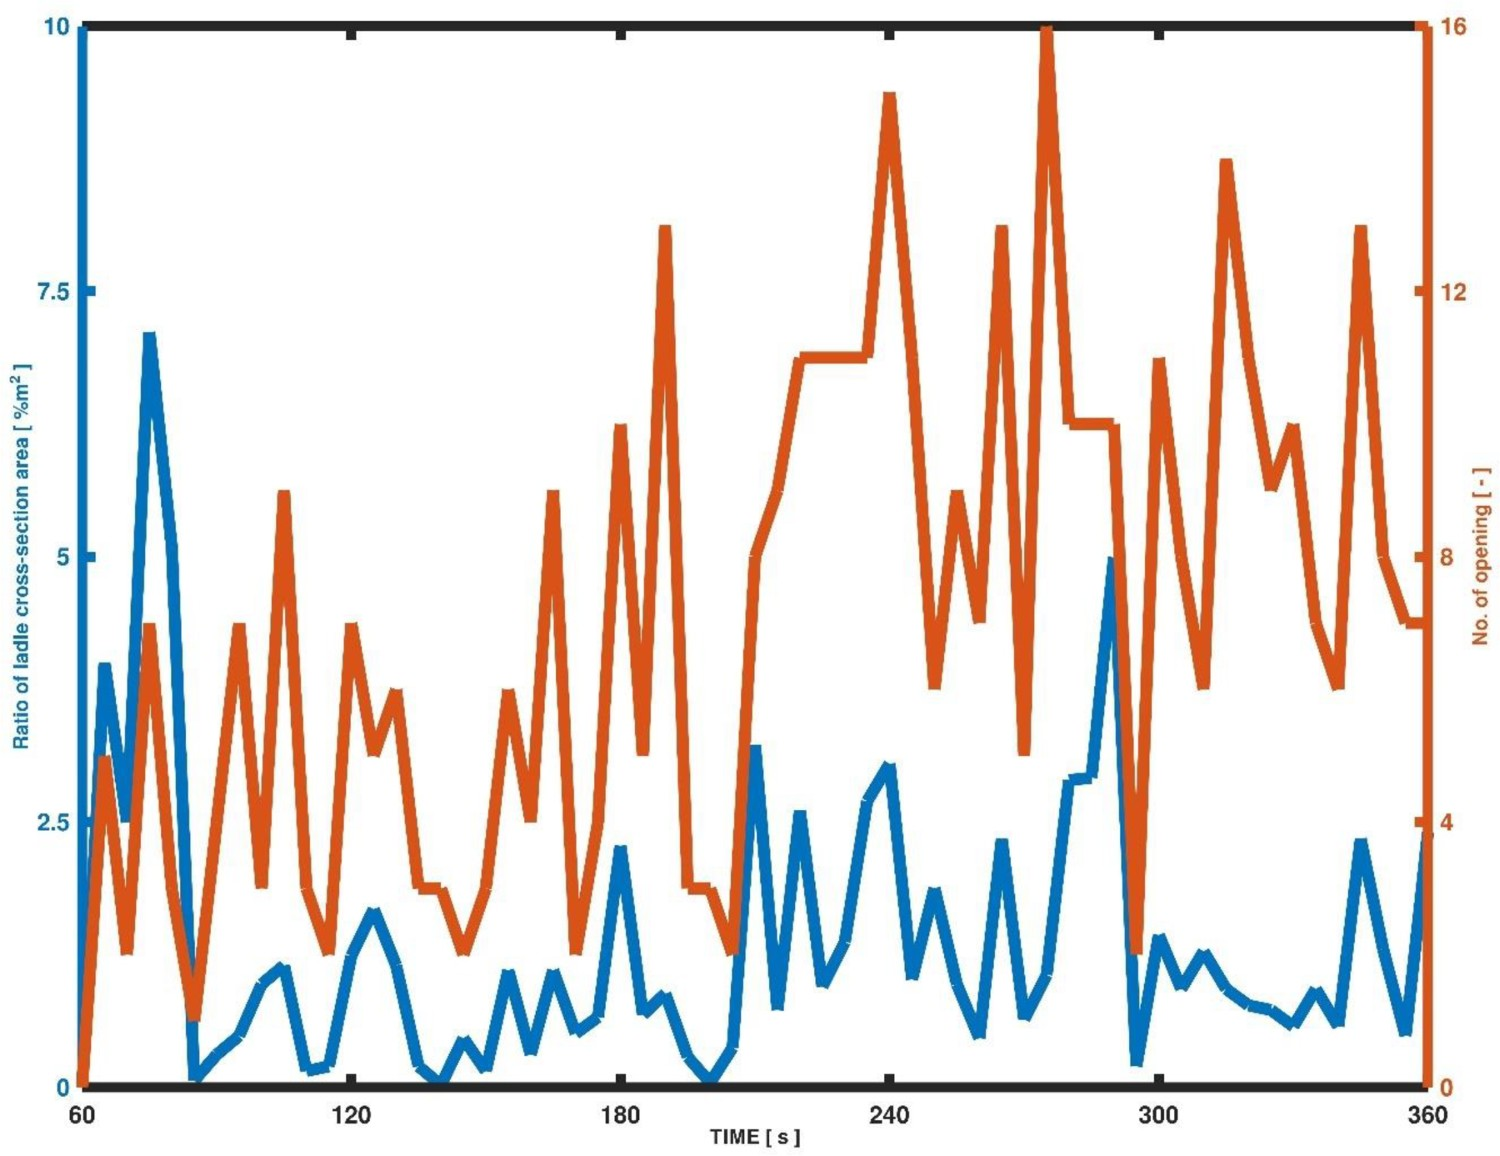
Similarly, the figure shows the changes in the number of openings at the slag layer with rate of total exposed area. It can be seen that, after the initial stage, the area of exposure is formed of larger numbers of openings. Even though the area of exposure is more volcanic at the top, it is formed of most probably small openings. This can be seen in the instance when the number of opening peaks at 16 while the total exposure surface area is slightly above 1% of the cross-section of the ladle. This can be explained by average size of the opening.
The ImageJ application process a picture using the contrast in the picture and returns not only the sum of area but also the average size of the area which is the sum of all areas divided by the number of counts. In the instance where the number of opening is the largest, the average value of the exposed area is equal to 0.003 which is due to number of very tiny contrasted pixels in the input picture. These are formed of either couple of pixels or a very thin strip similar to a line. If those tiny areas are ignored, the number of opening drops to 12 which is still a large number of openings compared to the total size of the exposed area. Therefore, it still suggests similar behaviour to other data.
Time averaged open-eye size
Figure 20 shows the time averaged size of open-eye for all four flow rates in this study. The figure shows that in the low flow region the open eye area increases quickly by nearly 80% (for flow rates of 20 and 50 NL min–1). This increase, on the other hand, is more than four times when the flow rate increases to 75 NL min–1 from 50 NL min–1. But, doubling the flow rate to 150 NL min–1, the increase in the average open-eye size does not even reach 1.5 times of case with flow rate of 75–150 NL min–1. This shows that the increase of open eye area slows down when the gas flow rates are doubled and overall, the relation between average size of the open-eye is not linearly increases by changes in the flow rate. It also emphasises on the significance of horizontal stirring effect on keeping the slag layer intact and preventing the enlargement of the open-eye size. Time averaged open-eye size in percentage for flow rates of 20, 50, 75 and 150 NL min–1.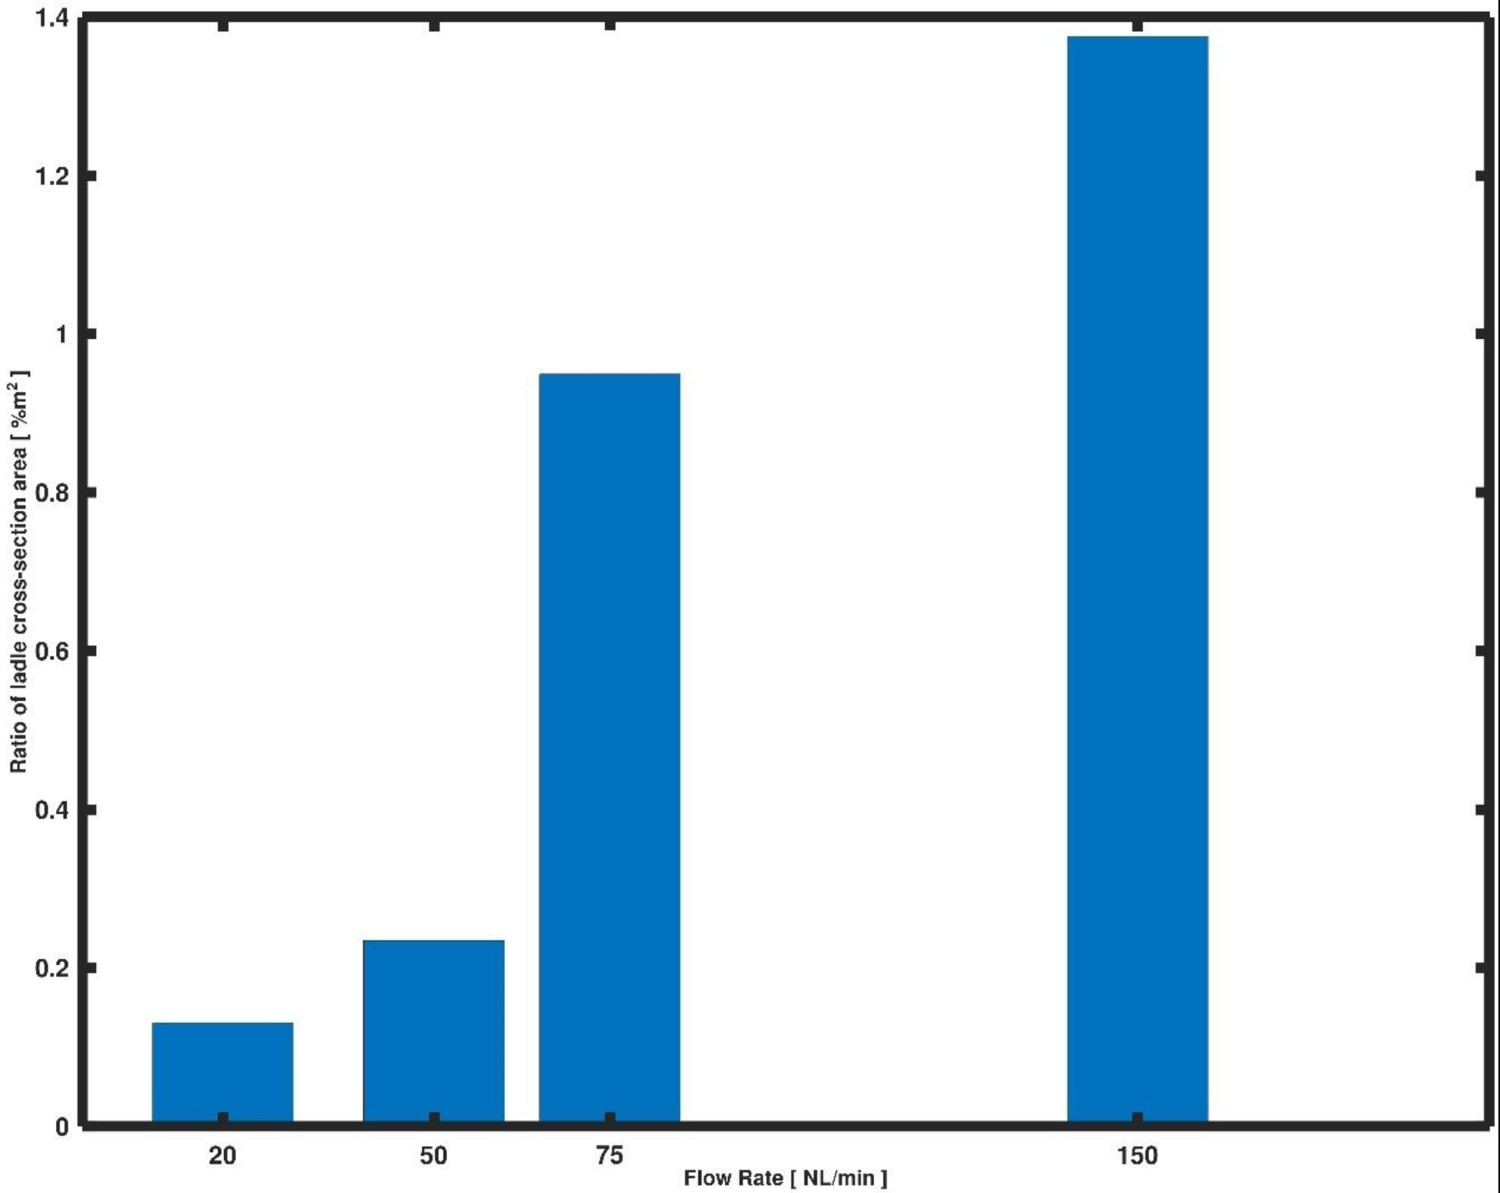
Discussion
As explained, the simulation has been done in two steps: step one, which covers the first sixty seconds of the simulation deals with induction stirring while, in the next step, a combined gas-induction stirring is modelled with a parametric study of gas flow rates equivalent to 20, 50, 75 and 150 NL min–1.
Induction stirring
Looking at the velocity contour plot of inductions stirring (Figure 3), there is a rather distinct border between the regions with velocities larger than 0.8 m s–1 and less than 0.4 m s–1. It can be seen that the larger velocity region forms a tube shape from the wall half-way to the centre axis of the ladle where the low velocity region starts rather sharply afterwards; the transient region of velocity interval (0.4, 0.6 m s–1) looks very narrow. Moreover, the streamlines profiles for all four points near the bottom of the ladle show that any particle which might be located near bottom will eventually be caught by the steel phase momentum. Therefore, these hypothetical particles, will move in a spiral pathway upwards towards the steel-slag interface which increases the probability of getting separated into the slag layer. It should be mentioned that particles located in the outer half of the ladle (towards the ladle wall), the pathways take a longer route in length upwards in comparison to the ones in the inner half (with respect to the top-view of the ladle interior).
Gas injection
Figures 8, 12, 14 and 17 show the gas plume profiles for flow rates 20, 50, 75 and 150, respectively. As can be seen, in all cases, the plume holds together and forms a distorted column in the lower one-third of the domain. Furthermore, there are very little bubble clusters in this part of the ladle domain. On the other hand, the plume starts to break down and forms bubble clusters after a while. Thereafter, these clusters are caught into the steel rotational momentum and are dispersed into the other sections of the ladle. Of course, this behaviour is better visible for larger flow rates. Figures 14 and 17 clearly show that bubble clusters can be found in almost all part of the upper two-thirds of the liquid bath.
An important factor is the exposure of the steel phase to the environment due to the break away of bubble clusters through the slag layer, which will expose the steel phase to the atmosphere. Figure 9, 15 and 18 shows the slag layer profile at two instances of 60 and 300 s after the start of gas injection. It can be seen that for the lower injection rates cases, the slag layer holds together and there is no breaking visible in these two instances. For the case of the gas flow rate of 75 NL min–1 (Figure 15), the openings are rather small while for the gas flow rate of 150 NL min–1 the openings are small at 60 s interval and a large one at 300 s. However, these are instantaneous profiles which have the their limitation to explain the transient behaviour of the system.
Figures 11, 13, 16 and 19 show the evolution of the total exposure area for steel phase on the left vertical axis and the number of openings on the right axis. As Figure 18 shows, the exposure of the steel phase might not be due to one opening but rather due to a number of small and/or large ones. The left axis in those figures, then, shows the sum of all exposed areas with respect to the cross-section of the ladle i.e. the sum of area of openings divided by the cross-section area of the ladle.
It can be seen that in the case of a lower gas injection rate (Figures 11 and 13), the opening of the slag layer occurs mainly during the first 60 s of the start of injection and will close down for a large portion of the simulation time after the initial 60 s. For the case of 20 NL min–1, one can see that the only other openings forms at the final 60 s while for gas flow rate of 50 NL min–1, the openings occur during the final 120 s but in very limited numbers.
For the final two cases (Figures 16 and 19), one can see a very different behaviour; the figures suggest that the slag openings occur throughout the simulation time. A major difference between these two cases is that for the case of a 150 NL min–1 flow rate, the number of openings is generally larger than four while this is less frequent for the flow rate of 75 NL min–1. Therefore, it is reasonable to assume that in case of a 150 NL min–1 flow rate dispersed bubbles form a large number of small clusters and due to the large upward momentum of the clusters they break into the slag layers in multiple locations forming small openings. Furthermore, Figure 16 shows that in case of the injection rate of 75 L m–3, the exposure area subsides after the initial 60 s and for the rest of the simulation time, besides some spikes the sizes of exposed areas are generally less than 1%.
Conclusions
In this study, the multiphaseInterFoam has been updated to address the induction and/or the combined stirring of the steel melt during the ladle process. The induction forces were calculated before the calculation and the forces acting on the melt were updated with respect to changes in the velocity magnitude of the steel phase to mimic the transient behaviour of the induced magnetic field. The model suggests that the maximum velocity in the melt when using only induction stirring appears a quarter of the rotation away from the stirrer location in the direction of the rotation. It also shows that there is a rather sharp interface between the region of velocity magnitude larger than 0.8 m s–1 to lower than 0.4 m s–1. Moreover, the simulation shows that all the locations in the melt are affected by the rotational movement of liquid steel as the streamlines present.
The gas phase was also injected through a porous plug to create a combined gas and induction stirring. The location of the plug is chosen so that the region above the plug has the lowest velocity magnitude. The simulation suggests that the gas plume is affected by the rotational movement of the liquid phase. It can be seen that the gas plume is intact in the lower one-third of the domain, but that it breaks into bubble clusters in the upper section. These clusters are then dispersed horizontally into the melt. Furthermore, the simulation suggests that the rotational movement of the clusters dissipates a large portion of upward momentum of the bubbles. Hence, when the bubbles reach the slag layer they do not carry as much force as for a common vertical gas stirring case so, the openings in the slag layer are not as large. This, in turn, prevents the exposure of steel to the environment to a larger extent.
In a conventional method, the Soft-blowing is used to avoid the very large open-eye. Moreover, such practices produce conical plumes which widens as bubbles travel upward. However, the bubbles have tendency to stay in such a zone and can scarcely be found in other regions of the ladle. Using the new novel horizontal stirring method, it seems that the large open-eye can be avoided even with Strong-blowing, where the rotational movement of the slag not only holds the layer tight but also breaks the upward momentum of the plume and disperses the bubbles to various sections of the ladle. Therefore, it can be concluded that such a novel stirring strategy has the potential to improve the cleanness of the steel during the ladle refining process.