
Abstract
Coal char presence in blast furnace dust, indicates the inefficiency of combustion in the raceway. A retroactive approach has been applied by investigating the presence of carbon sources in blast furnace dust via carbon type differentiation methodologies. The current state of the art in carbon type differentiation for similar applications consists of thermogravimetric analysis, however this technique does not allow for samples to be analysed in line with the ever-changing conditions of the blast furnace. Here, the TGA method has been trialled for use with blast furnace dust, with improvements offered to the heating profile, allowing for faster analysis. Moreover, alternative techniques have been trialled, in combination with characterisation methods such as XRD, SEM/EDS, total carbon and ICP-OES. The ‘Winkler Method’ originally designed to quantify charcoal in soil sediment, has been successfully optimised for carbon type differentiation in blast furnace dust, showing good correlation with the original benchmark technique.
Introduction
During integrated steelmaking, coal is typically used in the blast furnace to offset the use of metallurgical coke as a fuel as it is more cost-effective particularly with the global scale extreme pressures on coke at present, the EU has enlisted coke as a critical material [1]. The amount at which the coke can be offset is highly dependent on the chemistry of the coal. The complete combustion of coal in the raceway of a blast furnace, however, is unlikely, resulting in a highly inefficient process. The short residence time within the raceway and evolving gaseous conditions throughout the furnace, means that coal char will inevitably be present within the flue dust. While the flue dust from the blast furnace is recycled via the addition of fines to sinter, complete combustion of coal is favourable to ensure optimum efficiency. To be fully utilised within the furnace, coal is required to fully gasify, by undergoing five key stages. These include the evaporation of moisture, heating of the particle, gasification of volatile matter, ignition of volatile matter, ignition and gasification of remaining coal char [2]. The temperatures and gaseous conditions of the raceway are the most favourable for coal combustion, however, should these five stages not be completed in this region of the furnace, the coal will not be fully utilised and coal char will be present in the off-gas dust [3,4].
Studies of coal combustion characteristics include works by Osario et al., which show that reactivity is often strongly related to petrographic macerals, mostly vitrinite. This is useful in determining which coals or blends are the most effective injectants, but further information is required on process conditions and their effect on combustibility [5,6]. In terms of process parameters, it has been shown that injecting coal, which is low in sulphur and ash content, may prevent agglomeration further up the furnace [7]. Moisture is also an important factor to control, where a higher moisture content would require more energy demand for coal combustion [8]. While coals are often blended to obtain desired physical characteristics, it has also been proven that the combustion properties of coal can also be improved by blending [9]. To assess coal combustion effects in the laboratory, studies have been completed on the off-gas dust to quantify the sources of carbon present within the dust itself, as a method of diagnosing coal injection efficiency. A carbon type differentiation technique outlined by Schwalbe et al. included deconvoluting the ion current peaks from a mass spectrometer coupled with a thermoanalyser [10]. The peaks present from the off-gas created by increasing the temperature in the thermoanalyser with a blast furnace dust could be integrated into carbon from coal, coke and soot, respectively. Further peroxide and mineral acid digestion of the sample was carried out to calculate the graphite portion of the sample using X-Ray Diffraction (XRD) [10]. An alternative technique, developed by Wing Ng et al., known as the CanmetEnergy Technique (CET), makes use of a specifically designed temperature profile using a thermogravimetric analyser (TGA) to quantify moisture, low-order carbon (LOC), high-order carbon (HOC), soot and ash content of blast furnace dust samples. The technique has been validated using char and coke mixes of known quantities and the technique returns the correct LOC portion in each case. The LOC in this context refers to predominately coal-originating carbon, but due to the complex nature of blast furnace dust, there will inevitably be an overlap in the temperature of ignition of LOC and HOC in the material [11,12]. The fact that this technique has been validated using synthetic mixes is attractive for its use as an industrial diagnostic tool. It is hypothesised that an increase in LOC indicates an increase of coal char present in the dust itself and, therefore, less combusted coal in the raceway.
While the CET is successful in terms of result output, the requirement to conduct rapid assessments in response to the ever-fluctuating conditions of the blast furnace remains a challenge. Moreover, as environmental considerations are increasingly prioritised, it is important to be able to identify critical process and raw material variables that may result in incomplete coal combustion and unwanted particle matter in blast furnace off-gas. This paper aims to assess the applicability of existing techniques to understand coal combustion before exploring alternative methods to conduct rapid response carbon type differentiation. Advanced characterisation will be utilised alongside quantification methodologies to provide additional qualitative information and validation of the experimental methods trialled.
Materials and methods
Materials
A selection of dusts were collected on different operational days from the blast furnaces at TATA Steel Port Talbot. Nine samples were taken from the first abatement of each furnace off-gas system, 18 samples in total, in accordance with BS EN 932-1:1997, Methods for Sampling [13]. Although the blast furnace process parameters and raw material input have been recorded for each sample, they have not been referred to in this study since it focusses primarily on the optimisation of carbon type differentiation methodologies.
Methodology
The primary focus of the experimental work is on the quantification of the LOC in blast furnace dust. If LOC value can be tracked daily, it will allow for the comparison of coal blends and process conditions which produce dissimilar dust output, providing essential combustion and efficiency data during blast furnace operation. The aim of the work is to first utilise the existing CE technique as a means of assessing the coal combustion at TATA Steel, through TG analysis of the blast furnace dust samples, establishing a baseline condition for carbon type differentiation. Other methodologies will then be explored and developed to improve the efficiency of carbon data collection. As research in the field moves towards utilising artificial intelligence and deep learning for applications such as manufacturing, factors such as obtaining high-accuracy results and providing high-volume data capacity in a given timeframe will also be important considerations in this study.
Material analysis
Material characterisation and analysis were first carried out on the dust samples to confirm the presence of the different carbon sources. Optical microscopy was conducted for the purpose of cross-sectional analysis, exploring the internal structure of the dust. Samples were hot-mounted in polyvinyl formal resin. The sectioned samples were then imaged using a Zeiss Primotech light microscope. Scanning electron microscopy (SEM) was also carried out to explore the microstructure and distribution of the dust in its entirety. Samples were mounted on adhesive carbon discs and analysed using a Zeiss Evo LS25 in variable pressure mode. An HD backscattered electron detector (BSD) was used to provide contrast between dust particles, allowing for the difference between lighter and heavier elements to be ascertained, supported with energy dispersive X-Ray spectroscopy (EDS) (Oxford Instruments XMax50n) for chemical analysis.
To obtain quantitative, accurate measurements for total carbon, an Eltra CS500 C/S analyser was used, which also had the ability to measure sulphur. 200 mg of each sample was precisely weighed into alumina combustion boats and charged into the analyser’s horizontal tube furnace. The furnace was preheated to 1450°C and purged with a 4 L min−1 O2 purge to allow for the oxidation of carbon and sulphur into CO2 and SO2, respectively. Total carbon was used primarily to compare and validate the carbon type differentiation methods.
Carbon type differentiation methods
Thermogravimetric analysis (CET)
To carry out baseline carbon type differentiation and understand the coal combustion history of the samples obtained, the CET was used to test all dust samples utilising a TA Instruments SDT Q600 for thermogravimetric analysis. 20 mg ± 0.5 mg of sample was weighed into alumina crucibles and heated to 1000°C over a period of 1600 minutes. As outlined by K.W. Ng and co-workers, two isothermal holds should be introduced at 475°C and 600°C to allow for the LOC and HOC to respectively oxidise and the ramp rate was fixed at 1°C min−1. The length of the holds is defined to minimise the overlap in oxidation between these two carbon types [11]. 100 mL min−1 of compressed air was used as a reaction gas to promote oxidation of the carbon within the dust. According to K.W. Ng, the suitability of this method for industrial samples has been established using synthetically doped coke and chars.
Modified CET
While the current CET profile takes more than 1600 minutes to analyse a single sample, it is not possible to analyse coal combustion daily, meaning the ability to respond to any change in furnace condition is not currently possible. The aim here was to therefore suggest a new thermal profile for TGA, with the aim of reducing the overall testing time to allow rapid response carbon type differentiation, enabling at least one sample to be characterised daily.
Powder X-ray diffraction
X-Ray Diffraction (XRD) is often used to identify crystallite phases, particularly in complex materials such as furnace dust, and it was therefore explored as a tool for carbon type differentiation. Powder XRD analysis was performed using a Panalytical Empyrean S3 (Co-Kα1 λ = 1.78901 Å, 10–120°, s = 0.066°, t = 20 s). A rotating stage was used to improve the data and bias from the preferred grain orientation [14].
Digestion and combustion – ‘Winkler method’
Research conducted by Winkler in 1984, outlined a technique for quantifying charcoal in soil sediment samples, which consisted of nitric acid digestion and ignition to measure the relative frequency of charcoal in lake and bog sediment. It was discovered that the technique returned similar values of charcoal to when charcoal particles were manually counted under a microscope and the analysis was completed in less than half the time [15]. Soil can be relatively complex in nature, as can blast furnace dust, although both contain very different constituents, which would react differently to nitric acid digestion. This aspect of the experimental methodology aimed to assess the applicability of the Winkler method for the purpose of carbon type differentiation, a novel concept that has not yet been trialled.
The approach here was to first apply the parameters outlined by Winkler in soil samples but to slightly modify as appropriate for the purpose of testing blast furnace dust. The paper suggests that a 0.5 mL sediment sample is dried overnight at 90°C, cooled and weighed. By incorporating BSI Standards Publication for Coal Proximate analysis [16], 2 g of each dust sample was instead dried in a Memmert UN30 drying oven at 105°C to remove any moisture. 500 mg ± 10 mg of each sample was then weighed into 50 mL reaction tubes for reflux digestion using the DigiPREP Jr graphite block digester. While the traditional method suggests digestion for 1 hour, the blast furnace dust required 120 minutes for full digestion at 120°C. The digested samples were decanted, centrifuged, and washed with deionised water three times. The remaining samples after digestion were then dried and their mass was recorded. Finally, the digested sample was weighed into wideform porcelain crucibles and combusted in a muffle furnace to record the loss of weight on ignition. Soil and sediment samples are required to ignite between 450°C and 500°C for 3 hours; however, a temperature of 475°C was used for 12 hours to allow for full LOC oxidation. The mass after combustion was recorded.
Modified Winkler method
Iterations of aqua regia for replacement of digestion stage.
Supporting analysis
To support the understanding and validation of the carbon type differentiation methods, supporting analyses techniques were utilised. Total carbon measurements were captured as per section ‘Material analysis’ to compare against summed HOC + LOC values for TGA. Since the application of the Winkler Method and its modifications are novel to the use of blast furnace dusts, additional analysis was conducted at various stages of the process. XRD was also utilised as described in section ‘Carbon type differentiation methods’ to check remaining constituents post-combustion during trials and SEM and EDS analysis was also conducted at each stage to check the morphology of the material and its corresponding chemical composition.
Lastly, ICP-OES was carried out when trialling various acids for the modification of the Winkler Method to quantify the degree of metallic element removal. Here, the samples were digested in 13 cm3 aqua regia for 180 minutes using the DigiPREP Jr block digester at 120°C. A watch glass was added to the top to allow for reflux. The refluxed samples were made up to 50 cm3 with deionised water before being centrifuged and analysed using an Agilent 5100 ICP-OES with an SPS 4 autosampler, Plasma gas flow (argon) was set at 12.0 L min−1 while the nebuliser flow rate was set to 0.7 L min−1. The sample uptake was set to 30 seconds. Multi-element standards were created with a calibration range between 0.5 and 100 ppm with the same matrix as the samples. The regression of the calibration curve exceeded 0.9990, which was deemed to be in the acceptable range for accuracy.
Results and discussion
By comparing and evaluating the outcome from each alternative technique against the original CET, it can be clear which would be most suitable for use as an industrial diagnostic tool or suitable monitor for combustion performance in the blast furnace. For this application, the absolute value for low-order carbon representing char quantification is not vital, but the change over time is the important factor. To determine a techniques’ suitability, the correlation and the coefficient of determination are considered. In cases of high correlation or coefficient of determination, it can be assessed that this method could be a suitable replacement for this specific application.
Baseline analysis
Optical and SEM characterisation was conducted of the blast furnace dust samples for baseline analysis, examples of which are shown in Figure 1. Figure 1(a,b) provides optical microscopy cross-sections of the dust, highlighting the presence of cenospheres. Cenospheres are characterised as low density, irregular porous structures that are created as a byproduct of the coal combustion process and are predominantly comprised of non-metallic materials and minerals, and most importantly, char [17]. Their presence in blast furnace dust is therefore indicative of coal-char particles and thus suggests incomplete combustion of the coal [17,18]. Figure 1(c,d) shows examples of typical SEM micrographs obtained from the dust samples. Here, BSD has provided good contrast between elements and supporting EDS analysis confirmed the dust constituents consisted of iron ore, limestone, coke, coal char and sinter. The SEM micrographs also highlight the presence of char which appear as dark particles with visible surface pores. These differ from metallurgical coke particles, which appear flaky and lighter in colour [19]. (a) and (b) optical micrographs of blast furnace dust mounted in polyvinyl formal resin. (c) and (d) SEM micrographs showing the presence of coal char cenospheres.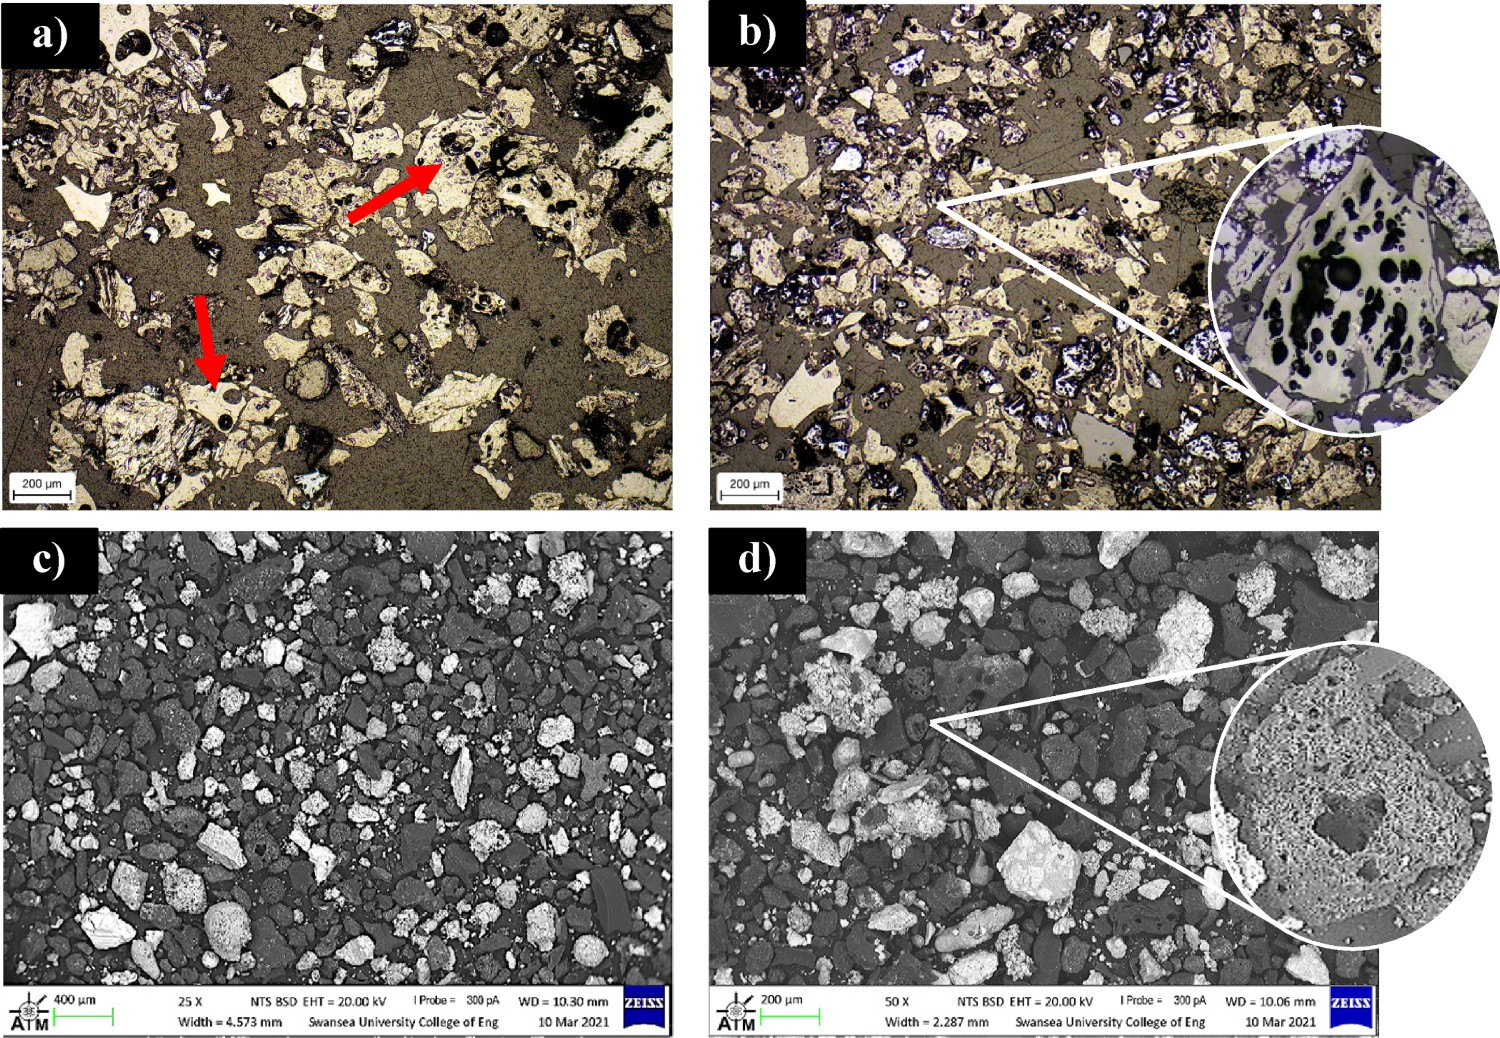
Carbon type differentiation
TGA (CET)
TGA of the dust samples were carried out as set out by the CET. The thermal profile utilised, described in section ‘Carbon type differentiation methods’ is shown in Figure 2, alongside the differential thermogravimetric (DTG) curve for Sample 1. Each section of the curve represents a different stage in the gasification of the samples. Initially, moisture losses are calculated as the mass lost from the beginning of the test to the end of the 175°C isotherm. The area under the DTG curve, between the minimum points before and after the respective isotherms, is relative to the quantity of LOC and HOC. The small peak at ∼1400 minutes refers to the soot portion of the carbon in the sample and ash can be calculated from the mass lost after carbon. Thermogravimetric analysis of a blast furnace dust (Sample 1). DTG and temperature plotted against time.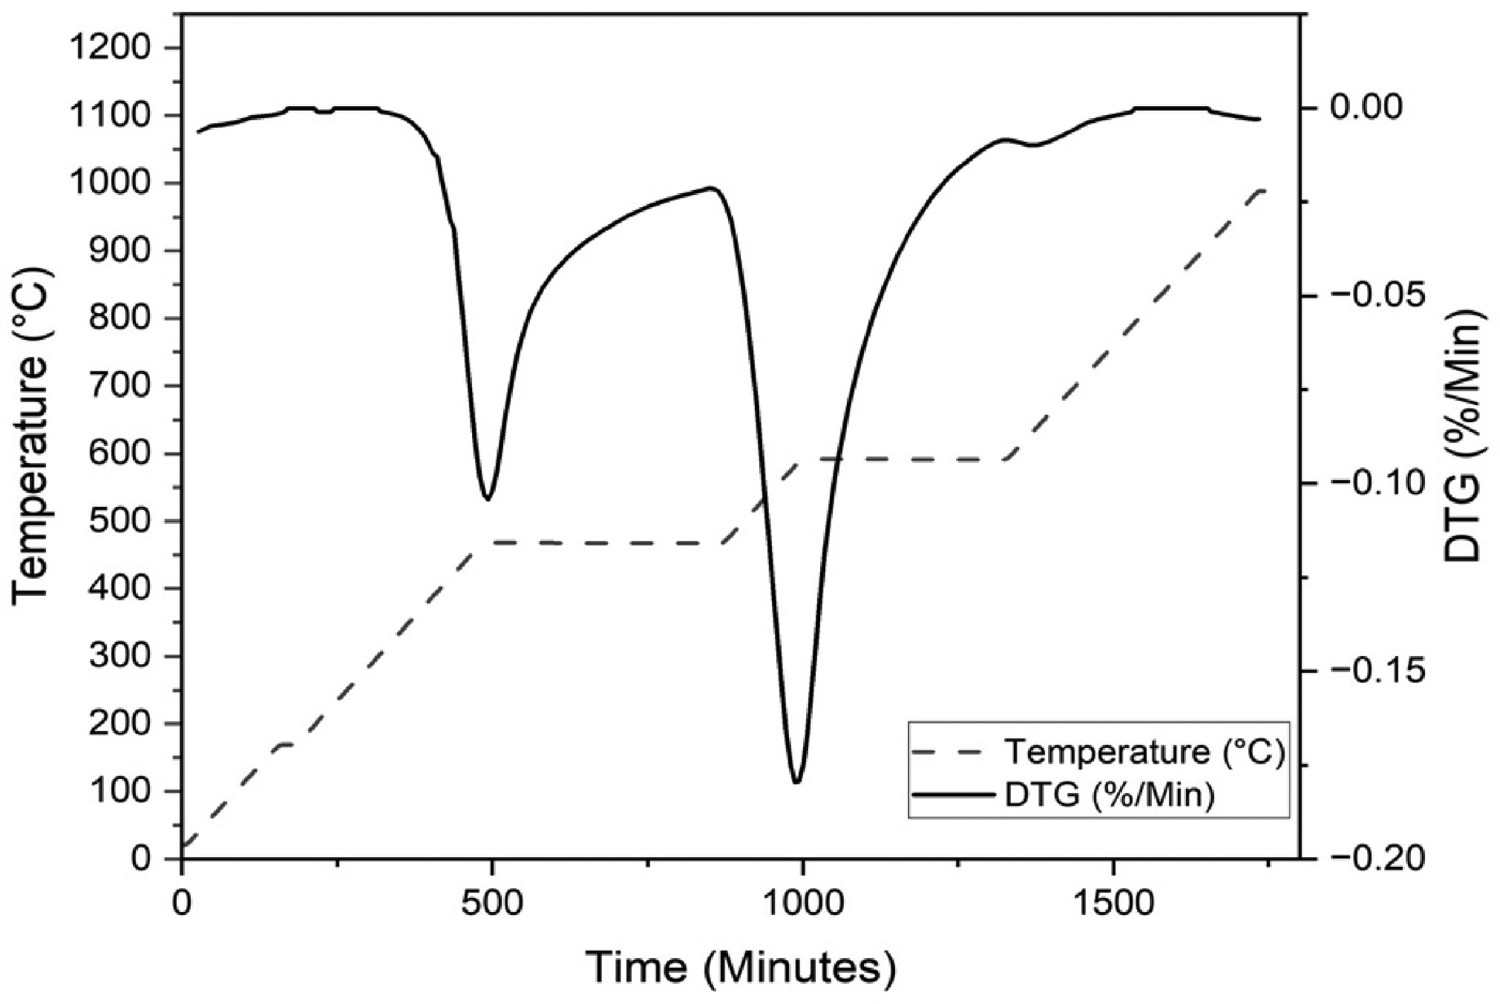
The previous (CET) work assessed blast furnaces that use only pulverised coal injection (PCI) systems as opposed to granulated coal injection (GCI) systems. The difference between the two is predominately size fraction. PCI aims for 60% of the material to be less than 65 micron, as opposed to GCI which is coarse, measuring up to 2–3 mm [7,20]. A larger particle size distribution (PSD) is therefore attributed to GCI which is hypothesised to result in a greater variation in combustion. An initial programme of 10 repeatability tests were conducted on dust apportioned from Sample 1 to ensure that the variation in PSD did not result in significant test variability during TGA and that the data was within the 6σ range. The variation within the sample remained within the control limits for all the calculated constituents, including LOC, HOC, soot, ash and moisture. With satisfactory repeatability, TGA was subsequently conducted on all 18 blast furnace dust samples, as per Figure 3. Control charts for the repeatability of blast furnace dust samples.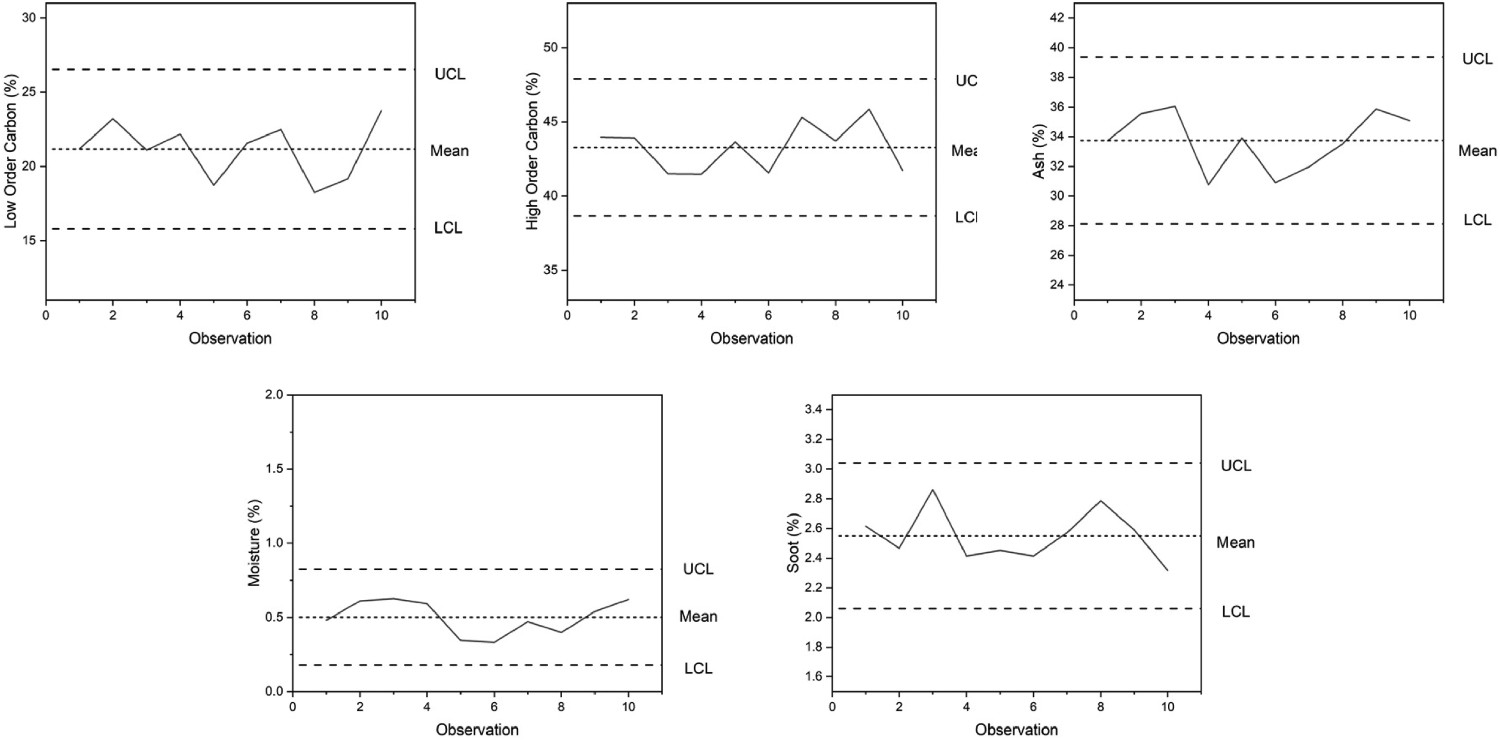
The TGA CET method was used to calculate the total carbon within each sample by simply determining the sum of LOC and HOC for each test. The data calculated was compared to the total carbon data obtained from the Eltra C/S 500 and shows a good correlation, with less than 3% variation between TGA-calculated and measured carbon, as shown in Figure 4. Table 2 shows the error statistics for the carbon types, the low error values supports the comparison. This data comparison provides additional confidence and validation that the TGA method provides a good representation of the total carbon types with the blast furnace dust samples and that the method is a suitable comparison and diagnostic tool. Total carbon from Eltra C/S 500 vs. total carbon calculated from CET (left), prediction error histogram (right). Error of carbon from Eltra C/S500 vs. total carbon calculated from CET.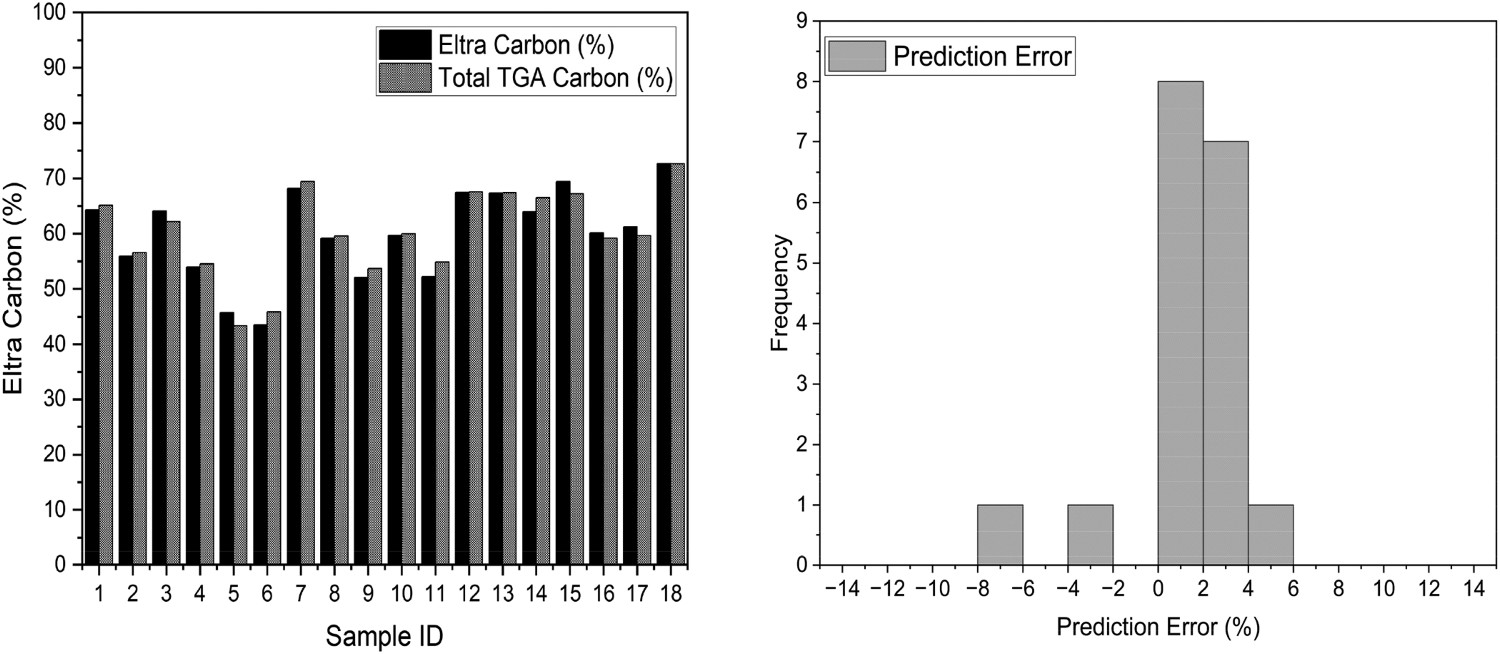
Modified CET
Following optimisation trials of the thermal profile, the final modified CET condition comprised of increasing the ramp rate to 20°C min−1, while the isotherms were held at similar temperatures and durations as per the CET to minimise the overlap between LOC and HOC. The overall duration of the test was approximately half that of the original CET as per Figure 5. Modified CET profile with 20°C min−1 ramp rate and total test time of ∼800 minutes. DTG for Sample 1 is shown.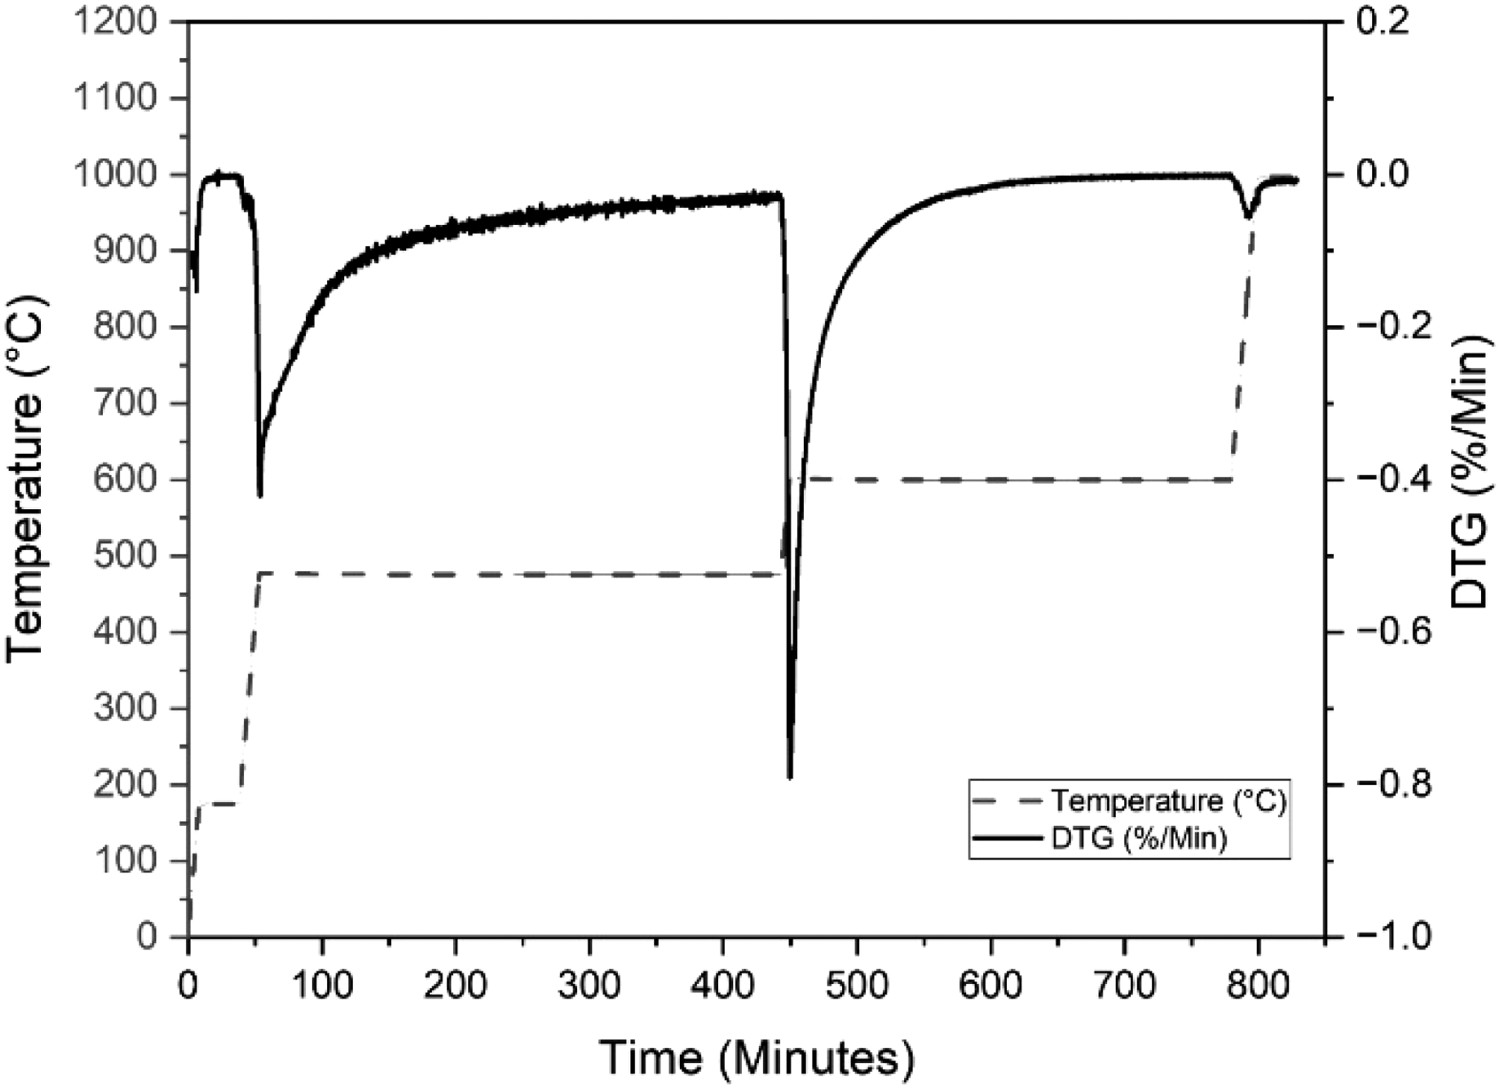
Each of the constituents, including LOC, HOC, soot, ash and moisture was calculated in the same way as the original technique, adjusting the minimum points to the beginning and end of the new isotherms. Tests were completed on all 18 samples and Figure 5 shows an example DTG produced for Sample 1, which was typical of all the tests. Despite decreasing the overall time on test, the degree of overlap remains minimised, and the peaks are relative to the original technique.
Figure 6 shows the values for LOC produced by the faster technique, which correlate very well with the original and the coefficient of determination shows that the data fits the regression well. The other constituent comparisons appear to correlate to a lesser extent, with moisture correlating lowest of all, according to Table 3, the error data also shows a close relationship between the actual values from the CET and the modified CET. The rapid heating and short isotherm time here appear to be too short for moisture determination and would require an extended hold at 175°C to ensure complete moisture removal for improved accuracy. The soot portion appears to be a weak correlation, however, the value for soot is <1% in all cases, which is likely to be influenced by the resolution of the equipment. According to Figure 6, the results for each sample appear to be correlate well with the original CET. This technique could be used in the context of comparing daily LOC quantities with a relatively high degree of confidence and this test can be completed in just 15 hours, hence accomplishing the requirement of testing one sample per day. Correlation of LOC for modified TGA and original CET (left) and %LOC for both techniques per sample (middle) and histogram of error (right). Statistical data for comparing the original CET with the modified TGA technique.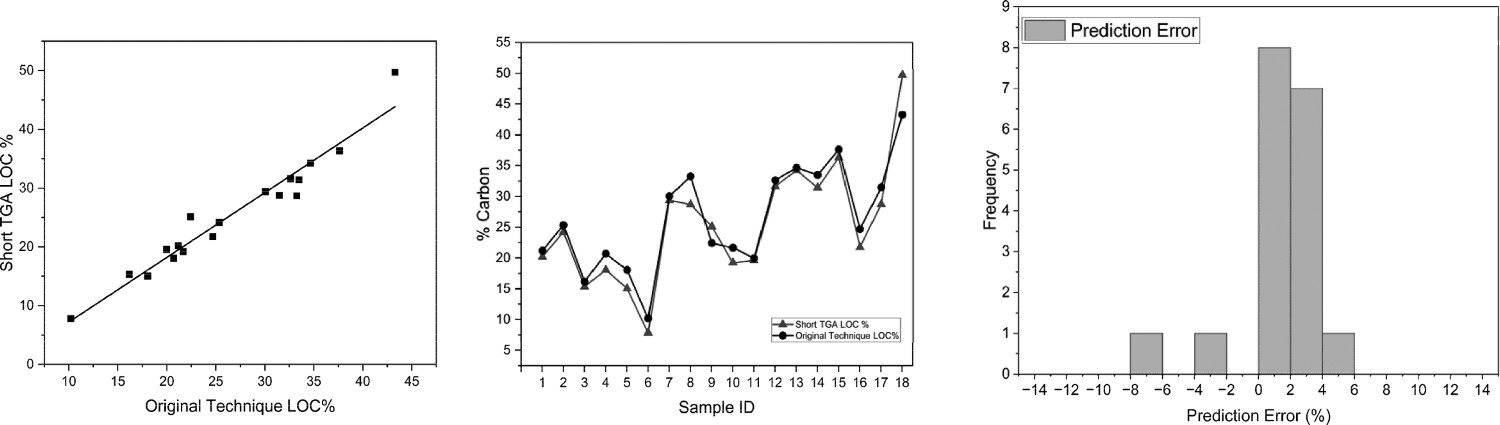
Powder X-ray diffraction
The XRD spectra for Sample 1 can be seen in Figure 7. One of the limitations when analysing the blast furnace dust is that an amorphous region of carbon exists between 25° and 33° [21]. This can often hide peaks such as graphite and haematite. This broad region, as per Figure 7, can be used to identify some key parameters and characteristics of the carbon itself, by deconvoluting two gaussian peaks around 28 and 31 2θ named alpha (α) and beta (β), respectively. X-ray diffraction pattern for Sample 1 blast furnace dust.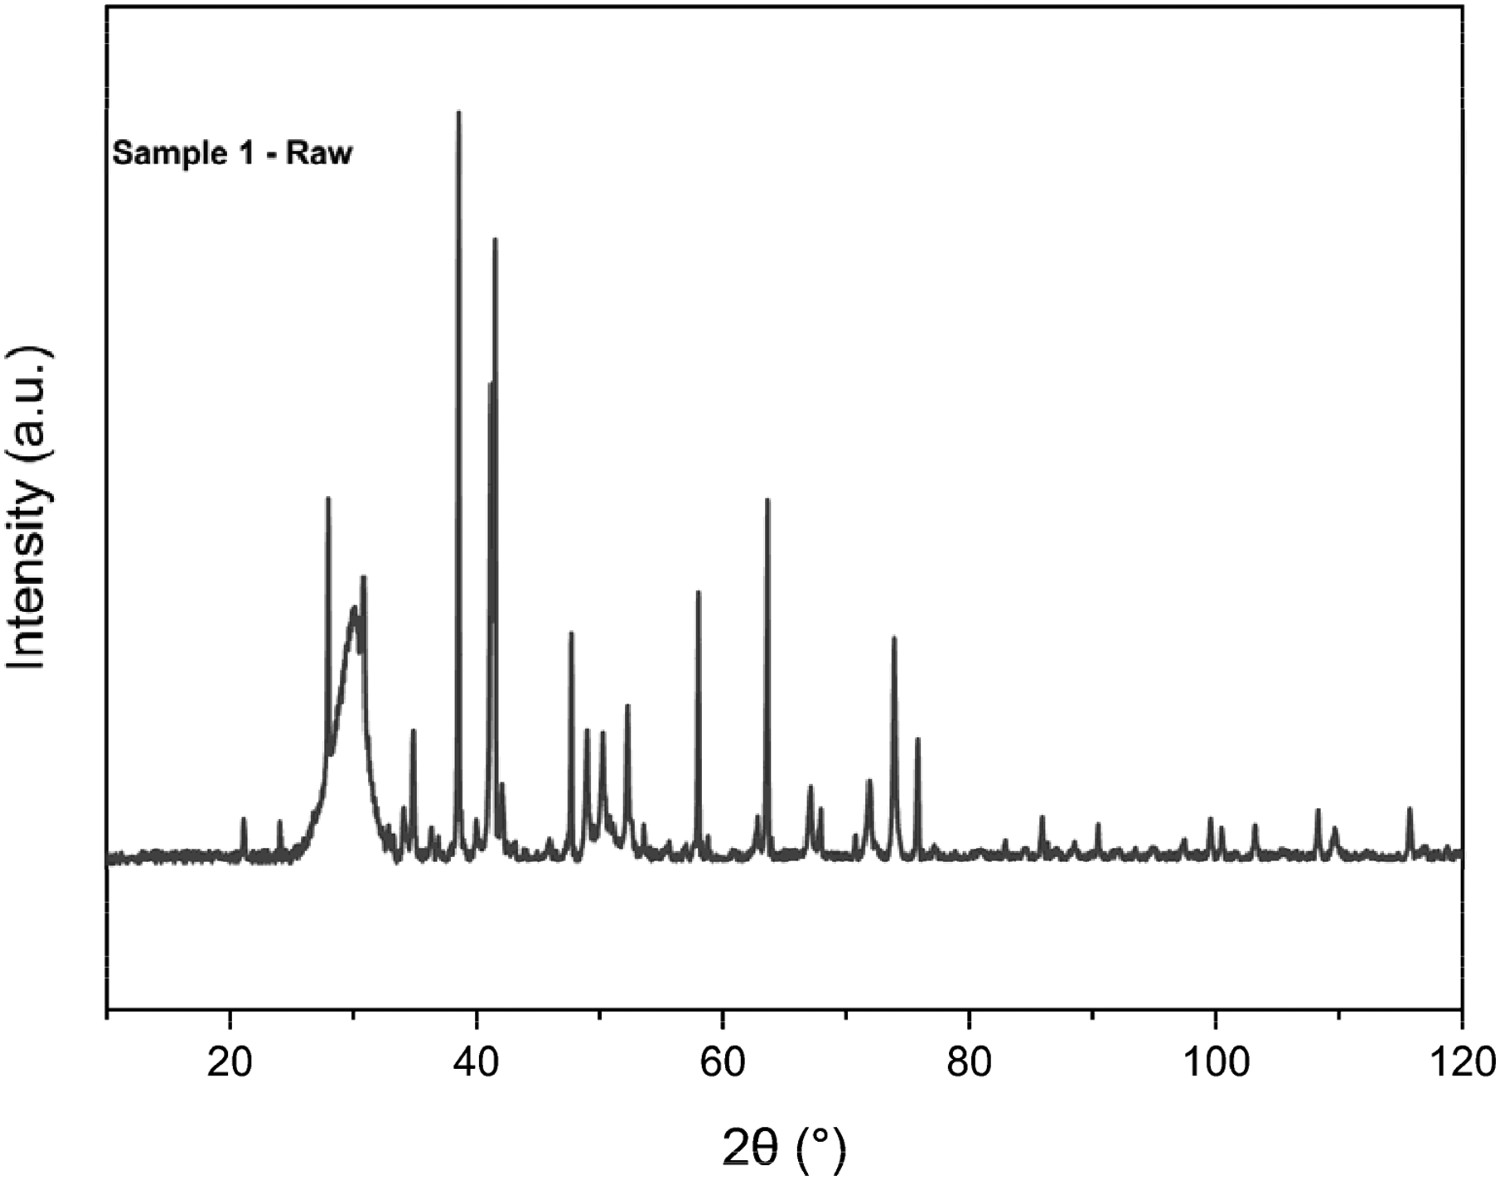
Asymmetry within the amorphous region can be seen clearly, which is why there must be a least two bands of material within the same peak. The left-hand gaussian peak refers to aliphatic structures attached to the carbon crystal structure, but the left-hand peak can be attributed to the spacing of the aromatic ring layer. Graphite is also clearly present with a large peak at 31° [22].
Lc or the degree of crystallinity is the measure of stacking height in nm of the carbon layer structure within the dust sample. With samples containing more LOC, it can be expected to see lower values for stacking because the carbon present is more crystalline in nature [21]. La refers to the average crystallite lateral size in nm. This is the laterial size from the left gaussian peak, referring to the aromatic carbon rings. For this reason, it is expected that lower values for lateral size will give higher values for LOC because of its higher aromaticity. Rank is simply a comparison between the intensities of the aromatic and aliphatic peaks of α and β. This is a crude measure for this type of sample due to sample complexity, the many forms and sources of carbon make this challenging, rank is more suited to coal analysis with less constituents [23]. It can be said that with increasing rank the intensity of the β peak is growing or the intensity of the α is shrinking, which would lend itself to increased crystallinity so a higher value for rank would be expected to return a lower LOC value. The interlayer spacing can be considered a measure of the stacking quality, more perfected stacking structures are considered to be stacking towards a graphite structure, which would give a lower interlayer spacing. There is a known link between Lc and interlayer spacing as proven by Manoj et al. With increasing stacking towards graphite, it is expected to see lower LOC values because the interlayer spacing is decreasing. The aromaticity measure simply measures the area of the aromatic α peak per total area of both α and β peaks. The increasing aromaticity means a lower aromatic per aliphatic ratio, which would suggest decreased crystallinity. For these reasons, it could be expected that with increased aromaticity, the value for LOC would increase [21–24].
The XRD results were correlated against the original CET, shown in Table 4. The correlation between XRD parameters and LOC measured through the CET show a very weak relationship, which was observed in the data. An improvement is seen for the interlayer spacing and LOC, also witnessed in the data (Figure 8). Despite the improved correlation, the sensitivity of the interlayer spacing is high, with the entire span being just 0.05 Å, and is therefore unable to track well with the CET LOC measurements, Figure 8. The error data also shows vast differences between the CET and the XRD parameters. While XRD would be a fast technique, with samples being analysed in 25 minutes, the data shows too little correlation. Correlation of LOC for XRD interlayer spacing and original CET (left) and LOC for both techniques (XRD and CET) per sample (right). Pearson’s correlation, coefficient of determination and errors for results from XRD parameters vs. CET.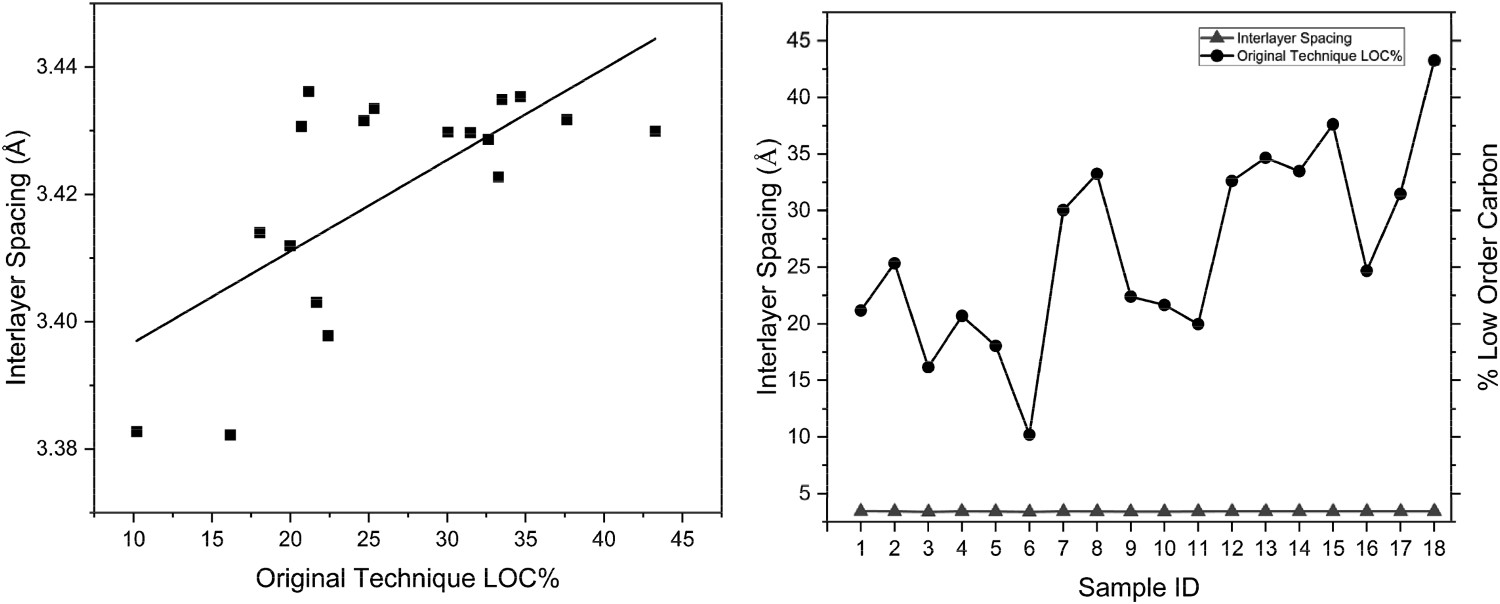
Digestion and combustion – ‘Winkler method’
The following calculations in Equation (1) were used to calculate the charcoal and organic constituents of the dust following the digestion and combustion steps, as per the Winkler Method.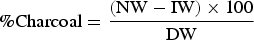
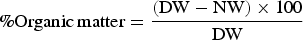
The linear fit from the %Charcoal vs. CET LOC was used to generate values for predicting the LOC using the Winkler Method, from initial inspection, there appeared to be a moderate correlation. A correlation coefficient of 0.7946 was observed with an R
2 of 0.6313 as per Figure 9. The values appear to resemble the original CET well which shows that the difference in LOC between samples is more important than the absolute amount when comparing samples. Correlation of predicted LOC obtained through Winkler method and original CET (left) and %LOC for both techniques (Winkler and CET) per sample (middle) and prediction error histogram (right).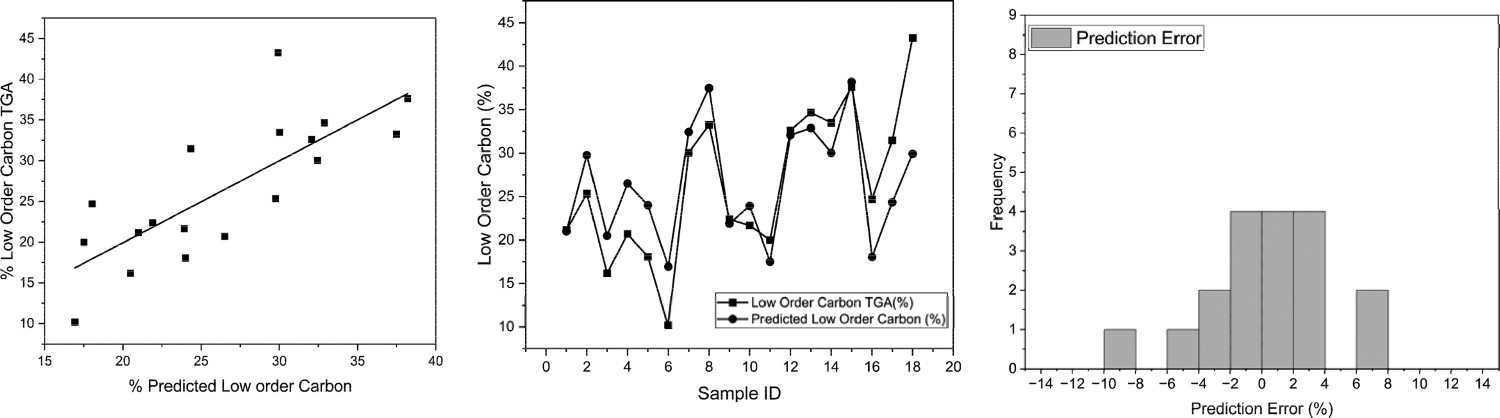
The values of total carbon obtained from the Eltra C/S500 have been used to normalise the carbon value into a %charcoal per carbon value. Figure 10 shows both the coefficient of correlation and determination have improved, with a tighter fit of the data evident at 0.88282 and 0.76558, respectively. This technique removes the effect of changing ash values which can influence the predicted LOC. Correlation of predicted LOC/total C, obtained through Winkler method and original CET (left) and LOC for both techniques (Winkler and CET) per sample (middle) and prediction error histogram (right). Predicted carbon has been normalised per total carbon.
With the exception of Sample 3, the results appear to track each other very well across the 18 samples. It appears from this data alone, that using this technique could be a suitable tool for monitoring the changes in LOC within the blast furnace dust. This test, however, is time-consuming, with a digestion step that takes 3 hours and a combustion step that takes 12 hours. This analysis, however, can be run in batches, limited by the size of the digestion block and the furnace size. In this case, 24 samples can be analysed in the same time frame as 1 sample per the original CET.
Figure 11 highlights how the ash is broken down into its respective constituents following the application of the Winkler Method. The total ash from the CET would be different because the digestion stage is not in place before the combustion. Breakdown of ash constituents per their derivation.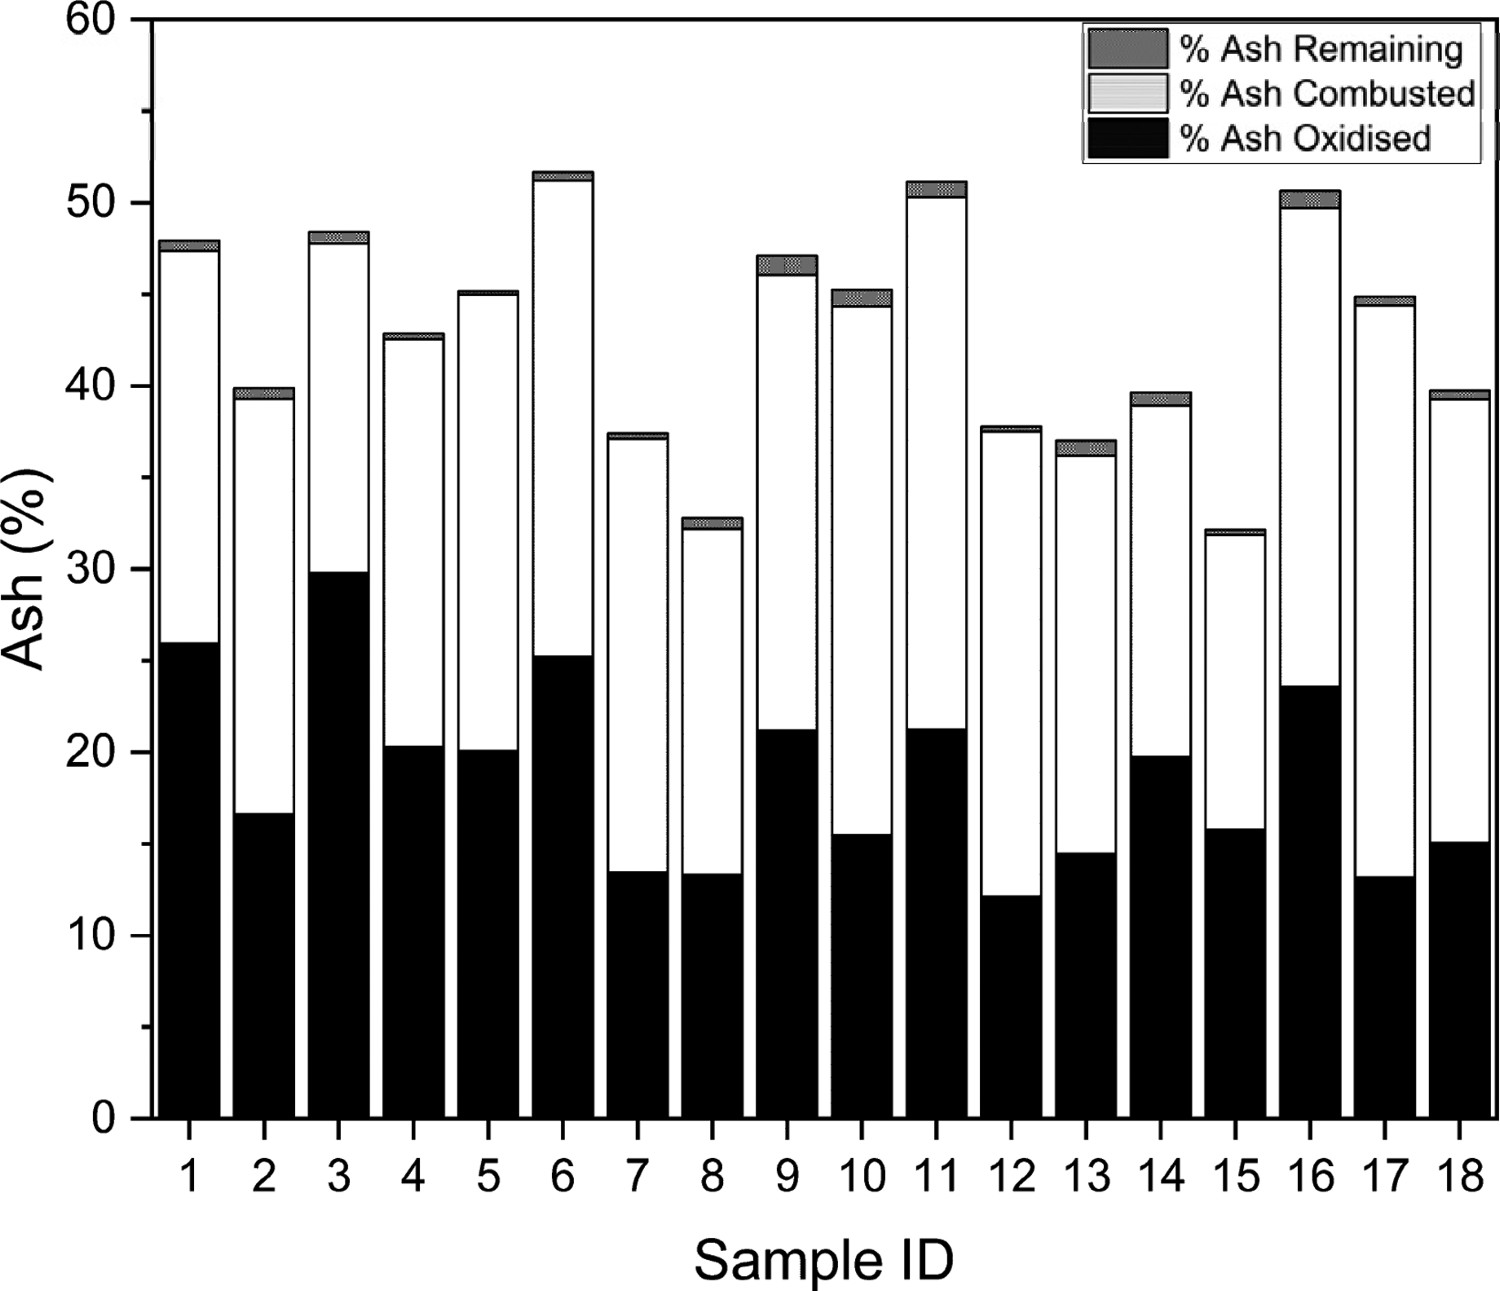
Further investigation into each of the stages, applying the new technique, was carried out to ensure the hypothesis was correct. To confirm if the nitric acid stage was indeed removing the organic material, the samples were investigated using XRD. Samples were analysed before and after digestion. XRD was also completed on the ash after ignition to understand what changes can be observed at each stage. As can be seen in Figure 12, the acid has a significant effect on haematite, magnetite, silica, metallic iron, calcite and dolomite. It is clear that the acid was not effective enough to strip it completely of the organic materials and some materials remain. After combustion, these spectra show that the organic matter has become more concentrated in the ash, so much of what remained initially has not been effected by the ignition cycle. This shows that it is likely the carbon was selectively combusted. Powder XRD patterns for Sample 1 – raw, Sample 1 – after chemical oxidation and Sample 1 – after combustion. H = Hematite (Fe2O3 – COD# 9000139), M = Magnetite (Fe3O4 – COD# 1011084), W = Wüstite (FeO – COD# 9008636), C = Calcite (CCaO3 – COD# 9016200), Si = Quartz High (O2Si – COD# 1011200), G = Graphite (C – COD#9011577), D = Dolomite (CaMg(CO3)2 – COD# 9000885), Fe = Iron (Fe – COD# 4113941).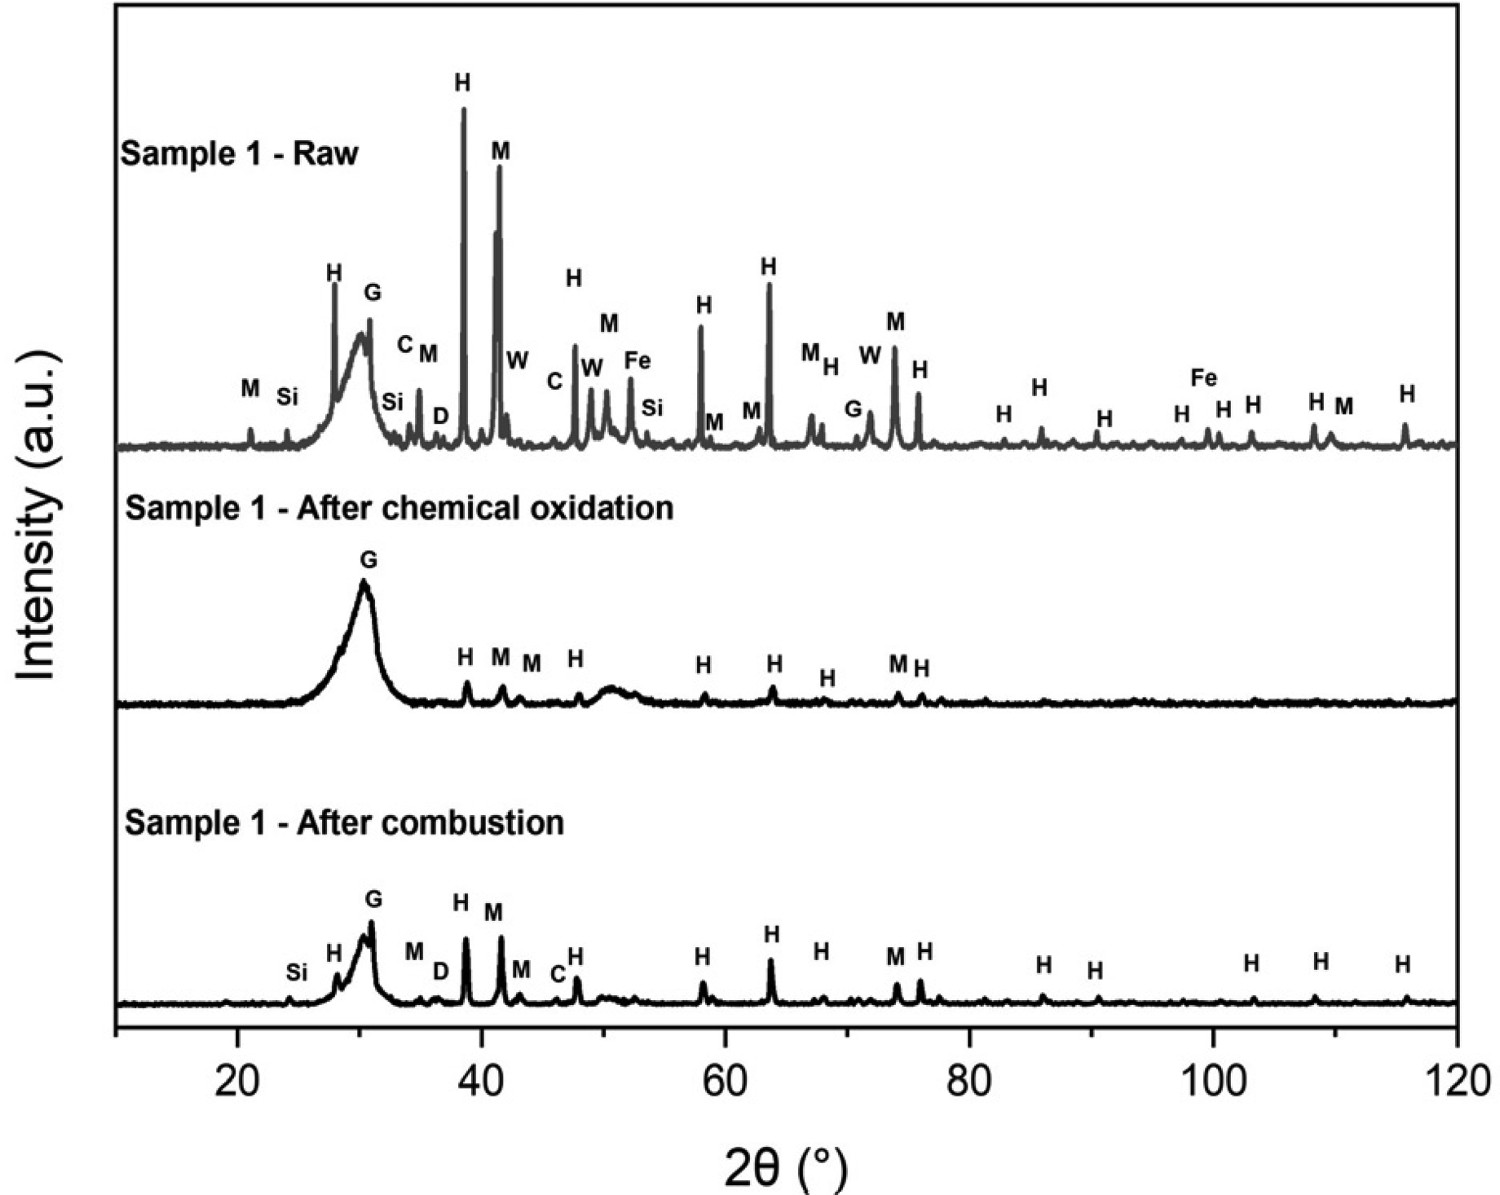
The SEM/EDS images in Figure 13 agree with XRD data. EDS analysis highlights that following digestion, when the samples are oxidised, the concentration of Fe is reduced and the carbon appears to be more concentrated. Carbon remains present in the post-combustion sample also but is slightly less concentrated due to the combustion of LOC at 475°C. The remaining ash constituents include HOC, observed as grey flakes in the SEM image, silica, alumina and magnesia, which are all more concentrated in the ash, supporting the theory that the carbon is selectively combusted. SEM/EDS analysis of Sample 1 in the as-received (pre-tested) condition, the post-digested condition and the post-combusted condition. Top-bottom images respectively show SEM micrograph, full EDS map and C, Fe and O spectra highlighted.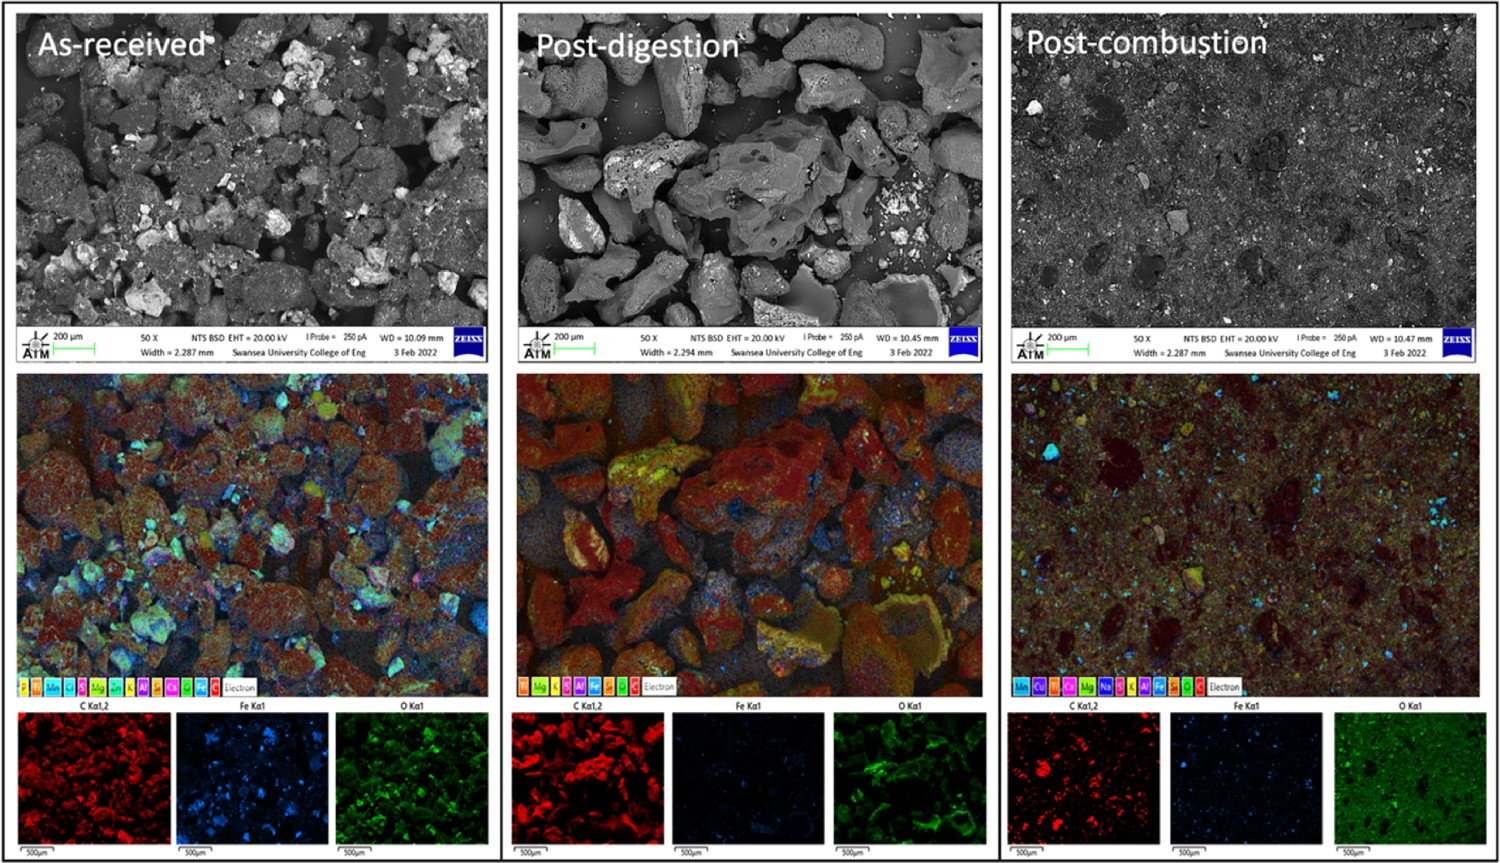
Improving the digestion method
By trialling various acid solutions on Samples 1–3, the ICP-OES in Figure 14 suggests that Acid 4 was the most effective at removing Fe. However, Acids 1 and 6 had the best overall effect when removing all of the metals, particularly Acid 6, with the addition of peroxide. Low-level elements such as Zn, Cr, Ni and Na were stripped relatively easily to below the levels of detection for the instrument in all cases; however, the nitric acid alone appeared to be gentle in removing elements, particularly Cr and Ba, which were not digested at all. Potassium appeared to not reduce well with the acids in question, but this appeared to be a similar case for nitric acid. ICP-OES analysis of raw blast furnace dusts compared to dusts digested in various mineral acids outlined in Table 1.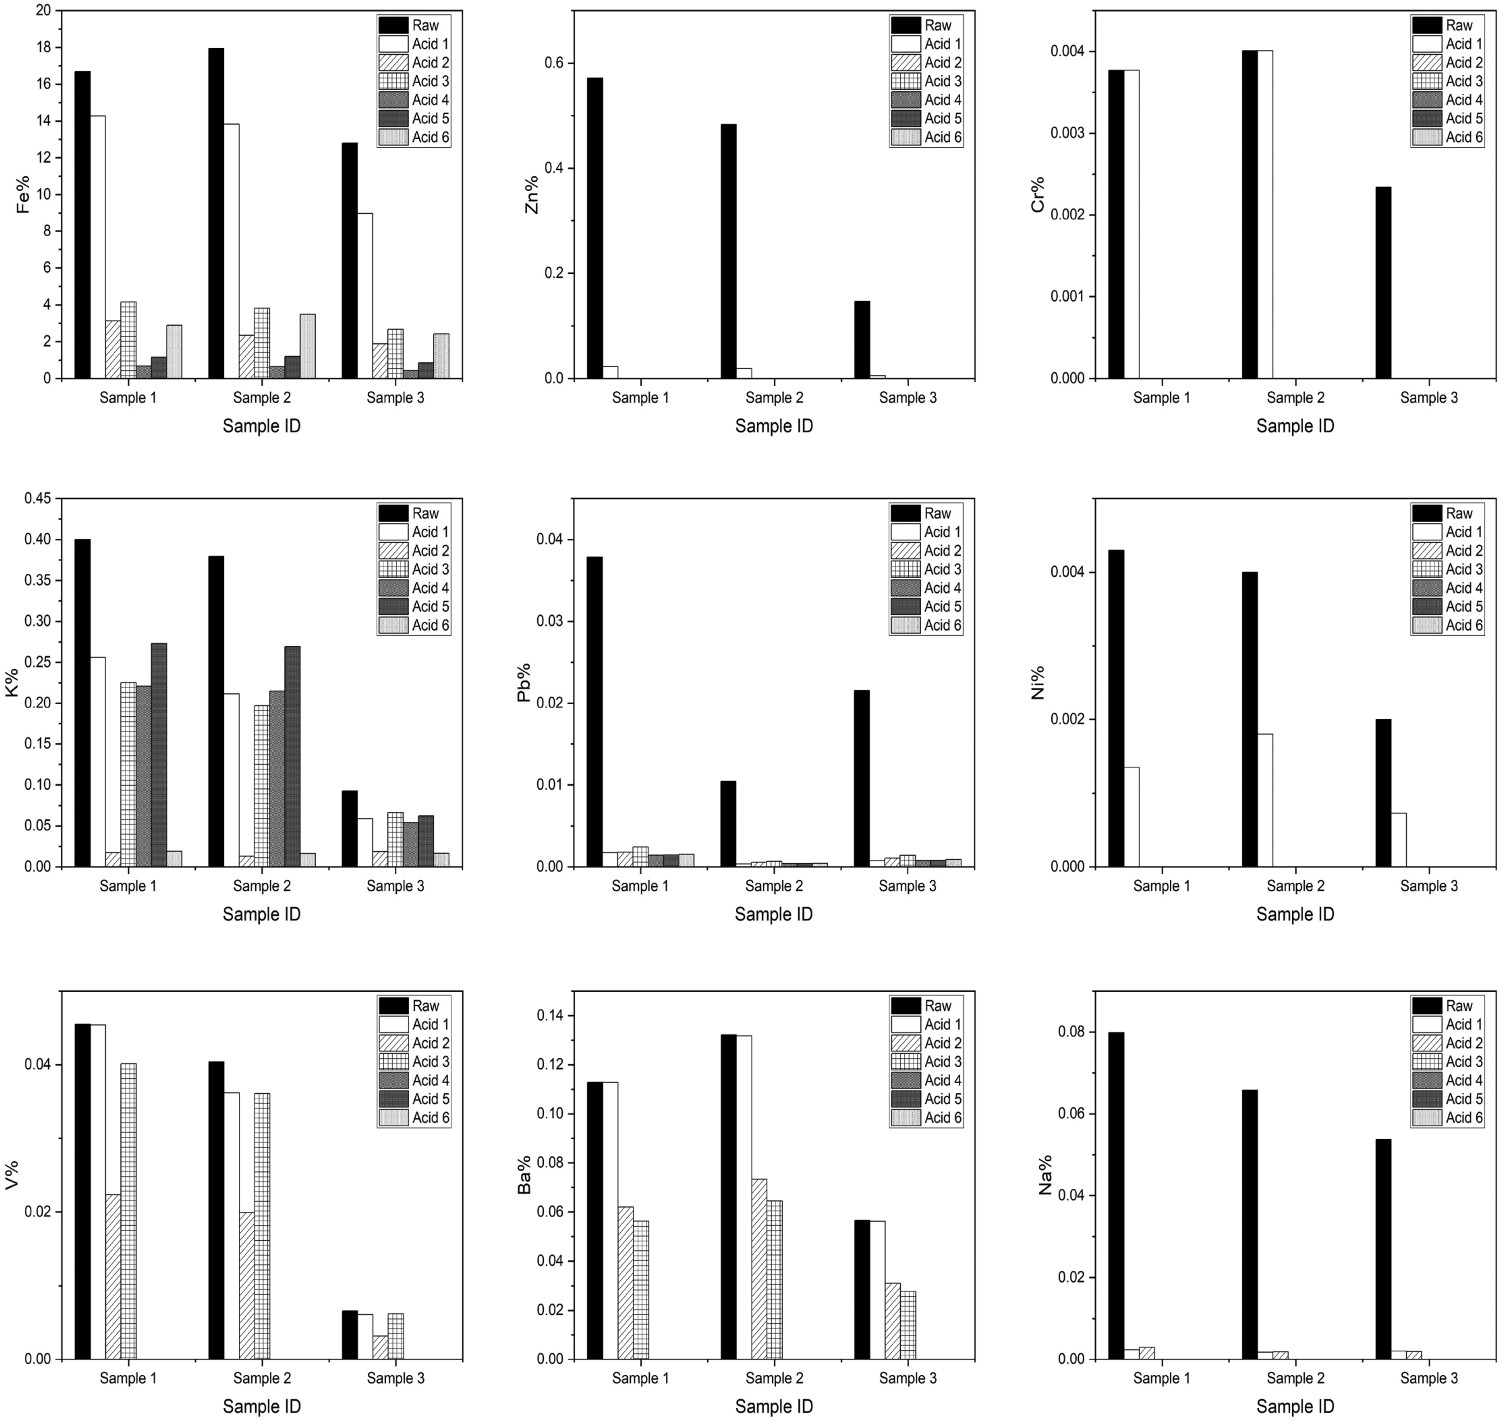
One of the key considerations when digesting materials for selective carbon combustion is the effect of the acid on the carbon. It is important to minimise the number of residual elements before combustion, to avoid any contamination during the ignition stage, but it is equally important not to physically alter the carbon, which is possible when different acids in varying degrees of strength are used for digestion. Figure 15 has been developed to show the changes in XRD parameters with the various acids. When examining the aromaticity and rank parameters, all of the acids have changed the aromaticity from the raw sample. But it appears Acid 6 has had the least effect over the three samples. In terms of La and Lc, Acid 2 has the least effect on carbon. The interlayer spacing is relatively consistent with all acids. Overall either Acids 2 and 6 perform better in terms of digestion as they have the lowest aggregated effect on the carbon during the reaction. It is clear though, that the effect on the XRD parameters is within a miniscule scale. So the impact of all of the acids is minimal. Graphs to show evolving XRD parameters with varying acid digestion acids as per Table 1.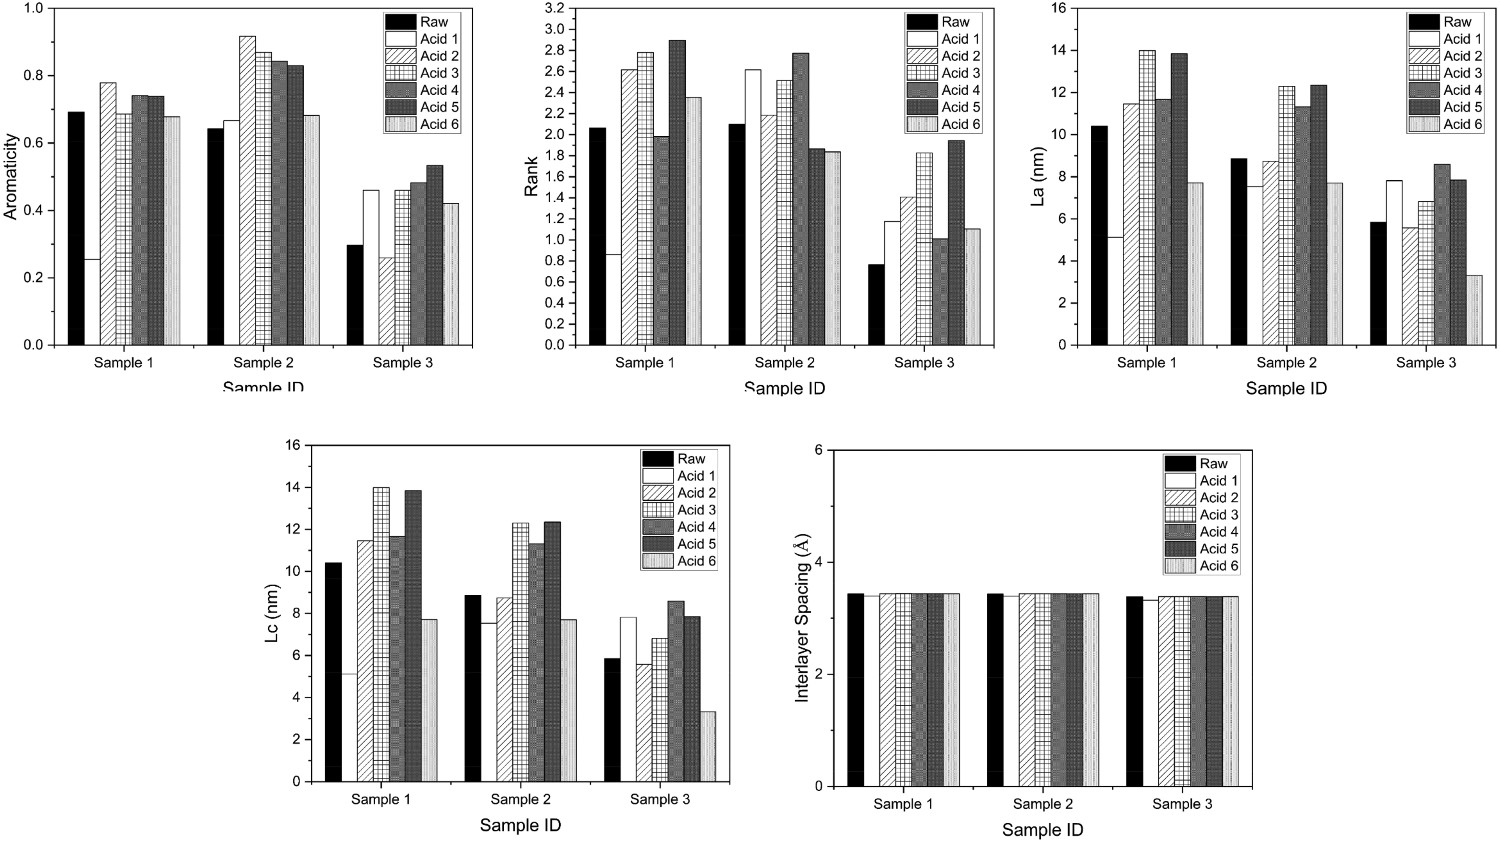
The XRD spectra in Figure 16 show that all acids have reduced the residual elements, but Acids 1 and 5 appear to be most effective because the peaks after the large amorphous carbon peak referenced in the powder XRD section of this paper. It also shows the change in the amorphous carbon peak that the parameters are referring to. It can be seen that dust digested in Acid 1 retains a similar peak shape, only losing the haematite and graphite spikes, whereas the other acids have either elongated or altered the overall shape of the carbon peak. The observations thus far, suggest Acid 2 and Acid 6 appear to be the best performing overall, for both element reduction and lowest effect on the carbon itself. Acid 4 performed best in terms of removal of residual elements but had more of an effect on the carbon peak. XRD Spectra showing Sample 1 after chemical digestion with acids outlined in Table 1.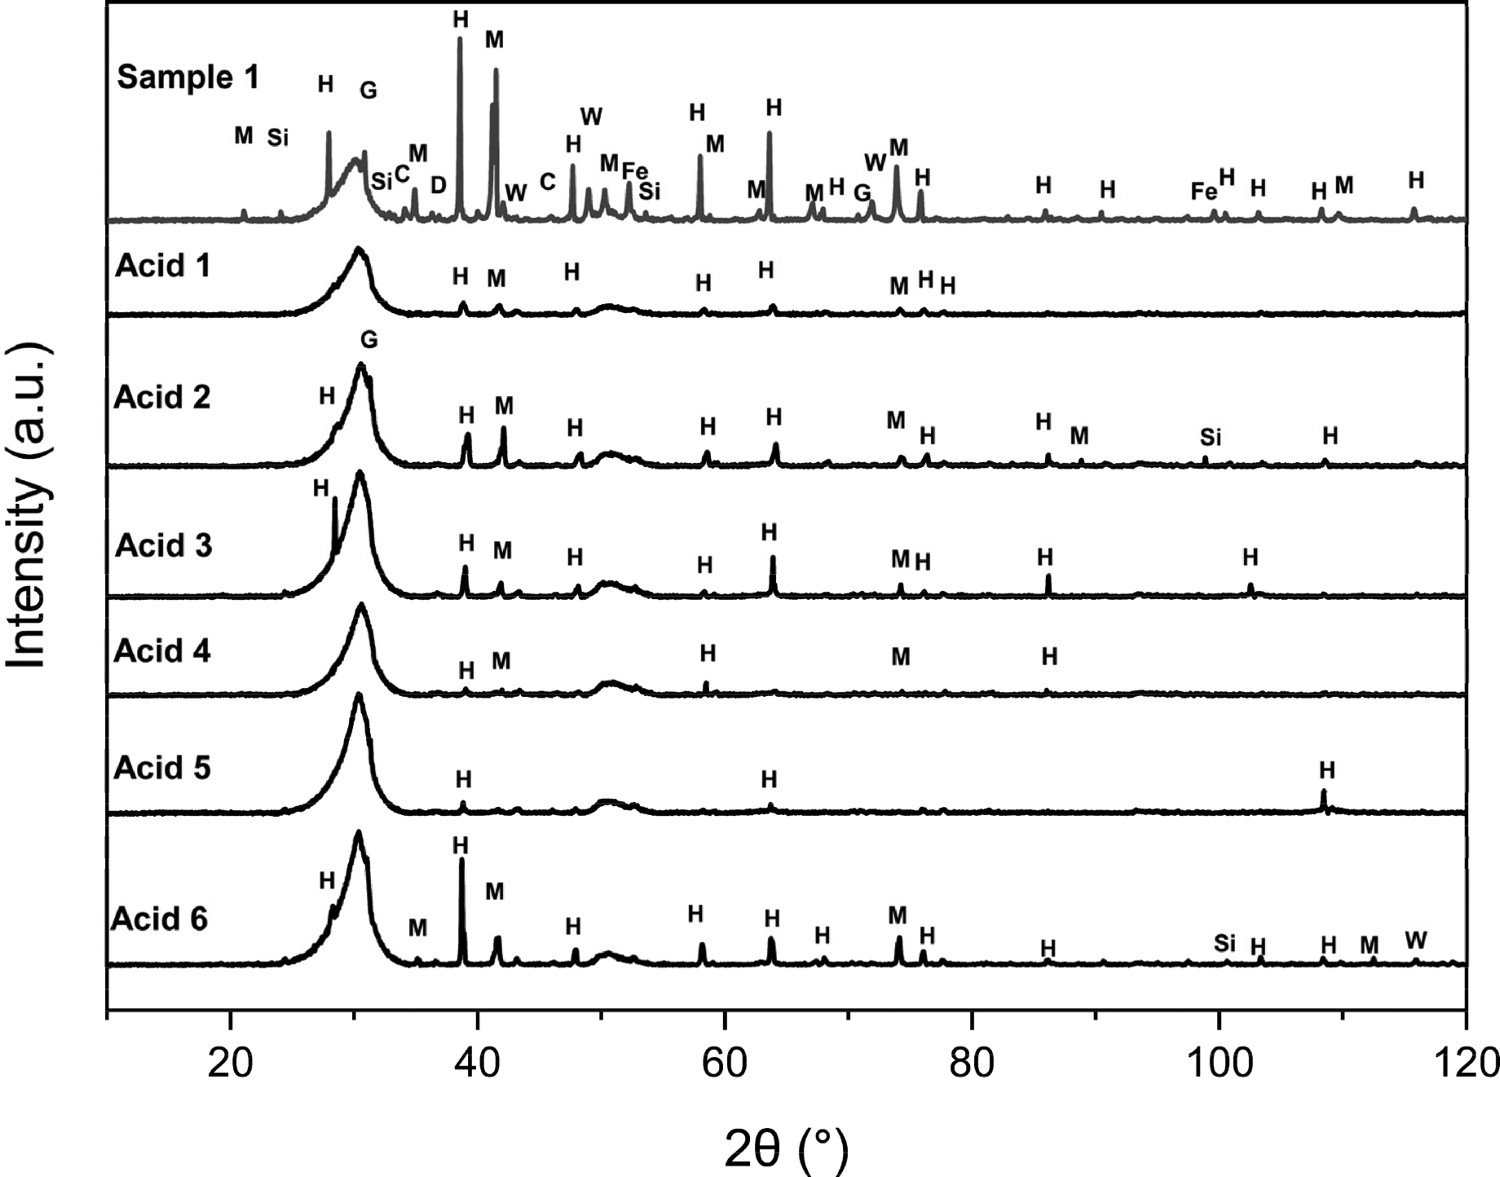
Pearson’s correlation for the LOC result from each of the improved acids outlined in Table 1 vs. LOC from the CET.
It is clear from Figure 17 that Acid 1 still tracks the original TGA CET well This is supported by the error data. Both could be used within a reasonable degree of confidence, however, as can be seen in Figure 17, Acid 2 tracks the CET well with a reasonable degree of correlation. Line graph showing the results for each sample from the CET vs. Acid 1 vs. Acid (left) and prediction error histogram (Acid 1) (middle) and prediction error histogram (Acid 2) (right).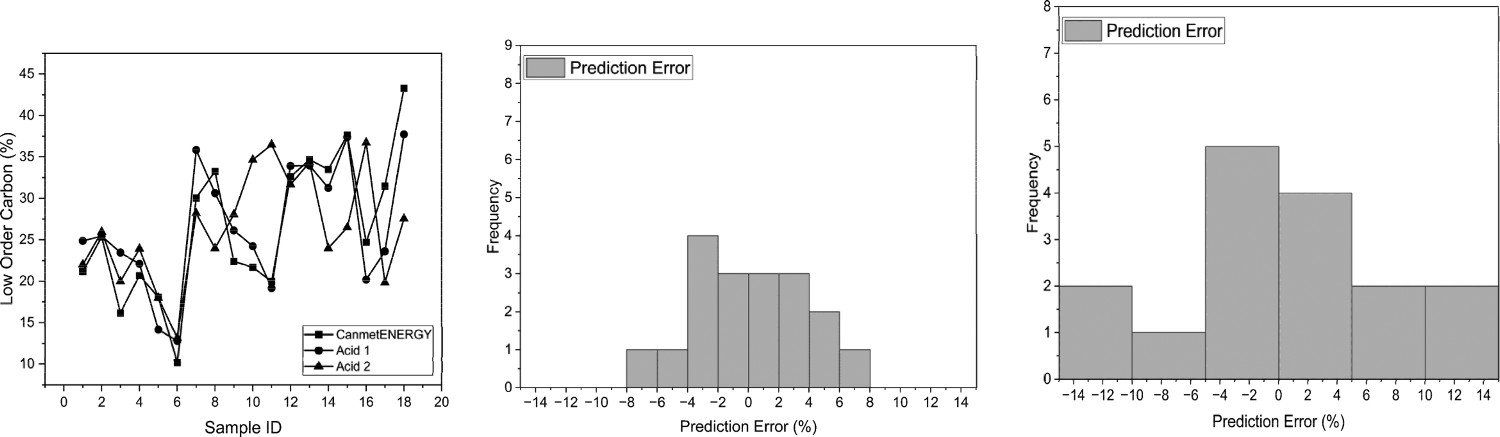
Best available technique
Pearson’s correlation, coefficient of determination, mean error, mean squared error, max error, root mean squared error and time to test per sample.
Conclusions
Baseline optical and electron analysis shows the presence of coal char in blast furnace dust, confirming that complete combustion of coal does not occur. The TGA CET method for carbon type differentiation was able to quantify LOC and HOC but analysis takes in excess of 24 hours. Modifying the heating profile of the TGA CET method provided the best correlation against the original technique and accelerated the analysis process to <15 hours. A novel application of the ‘Winkler Method’ using a digestion and ignition approach proved successful in predicting LOC within blast furnace dust. Large sample quantities can be analysed together within a 15-hour period. The use of nitric acid during digestion was found to have the least impact on carbon structure but was less effective in removing metallic residual elements. The TGA CET, the modified TGA CET, the Winkler and modified Winkler methods were all able to provide accurate carbon type differentiation analysis, with the modified variations offering significant improvements in analysis time, providing researchers and operators with the ability to respond daily to changes in combustion conditions.
Footnotes
Acknowledgements
The authors would like to acknowledge the assistance provided by Swansea University College of Engineering AIM Facility, which was funded in part by the EPSRC (EP/M028267/1), the European Regional Development Fund through the Welsh Government (80708) and the Ser Solar project via Welsh Government. John Lewis: Conceptualisation, visualisation, data curation, methodology, formal analysis, investigation, writing – original draft. Hollie Cockings: Funding acquisition, conceptualisation, supervision, project administration, writing review and editing. Daniel J.C. Stewart: Formal analysis, methodology. James Russell: Formal analysis, methodology. Matthew Thomas: Formal analysis, methodology. Mark Greenslade: Conceptualisation, funding acquisition, resources.
Disclosure statement
No potential conflict of interest was reported by the author(s).
Data availability statement
Data will be made available on request.