
Abstract
A three-dimensional computational fluid dynamics (CFD) model for the HIsarna off-gas system is set up and validated by real plant data. In the model detailed reaction mechanism and kinetic data for post-combustion of CO-H2 mixture and carbon particles are incorporated. The results are presented and discussed in another study (Part 1) by the same authors. In the present paper, the focus will be on geometry modification of the off-gas system and the effects on the operating parameters. The effect of this modification on heat loss, temperature profile, carbon conversion and gaseous phase composition across the off-gas system is investigated. It is shown that the modified geometry leads to a higher heat loss through the reflux chamber walls which can change the temperature profile and consequently species composition. The modified geometry also offers possibility of higher CO-H2 mixture and carbon particles conversion rate and reduce unwanted emission from the reflux chamber.
Nomenclature
Stefan-Boltzmann constant

spectral index of refraction of the medium

scattering coefficient

absorption coefficient

direction vector

position vector (m)

spectral radiation intensity

solid angle
total energy (J kg−1)

diffusion flux of species

effective conductivity (W m−1 K−1)

heat of chemical reaction

effective diffusivities (kg m−1 s−1)

source term

coefficients are constant

production terms

destruction terms

dissipation frequency (1 s−1)

turbulent kinetic energy (m2 s−2),

turbulent viscosity (m2 s−1)

unity matrix


mean velocity

pressure (Pa)

molecular viscosity (kg m−1 s−1)

density of fluid (kg m−3)

particle mass (kg)

fluid phase velocity (m s−1)

particle velocity (m s−1)

density of the particle (kg m−3)

additional force (N)

drag force (N)

net rate of production/consumption of species by chemical reaction

diffusion flux of species

particle relaxation time
Introduction
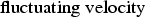
The HIsarna process is a new and breakthrough smelting reduction technology for the production of liquid hot metal from iron ores and coal directly fed into the reactor. Compared to the blast furnace route, coking and iron ore agglomeration (sintering and pelletizing) processes are eliminated which inherently leads to at least 20% reduction in CO2 emission. This reduction can be further increased, up to 80%, by incorporating carbon capture and storage technologies. The HIsarna process combines the cyclone converter furnace (CCF) technology owned by Tata Steel and the HIsmelt technology, originally developed by RioTinto [1]. In 2010, a pilot plant based on the HIsarna technology capable of producing 8 ton h−1 hot metal had been set up in the IJmuiden Works of Tata Steel Europe and the technology is under further development towards industrial demonstration. The main reactor and the off-gas system are shown in Figure 1. Schematic overview of the HIsarna pilot reactor including its off-gas system (left) and CCF (right).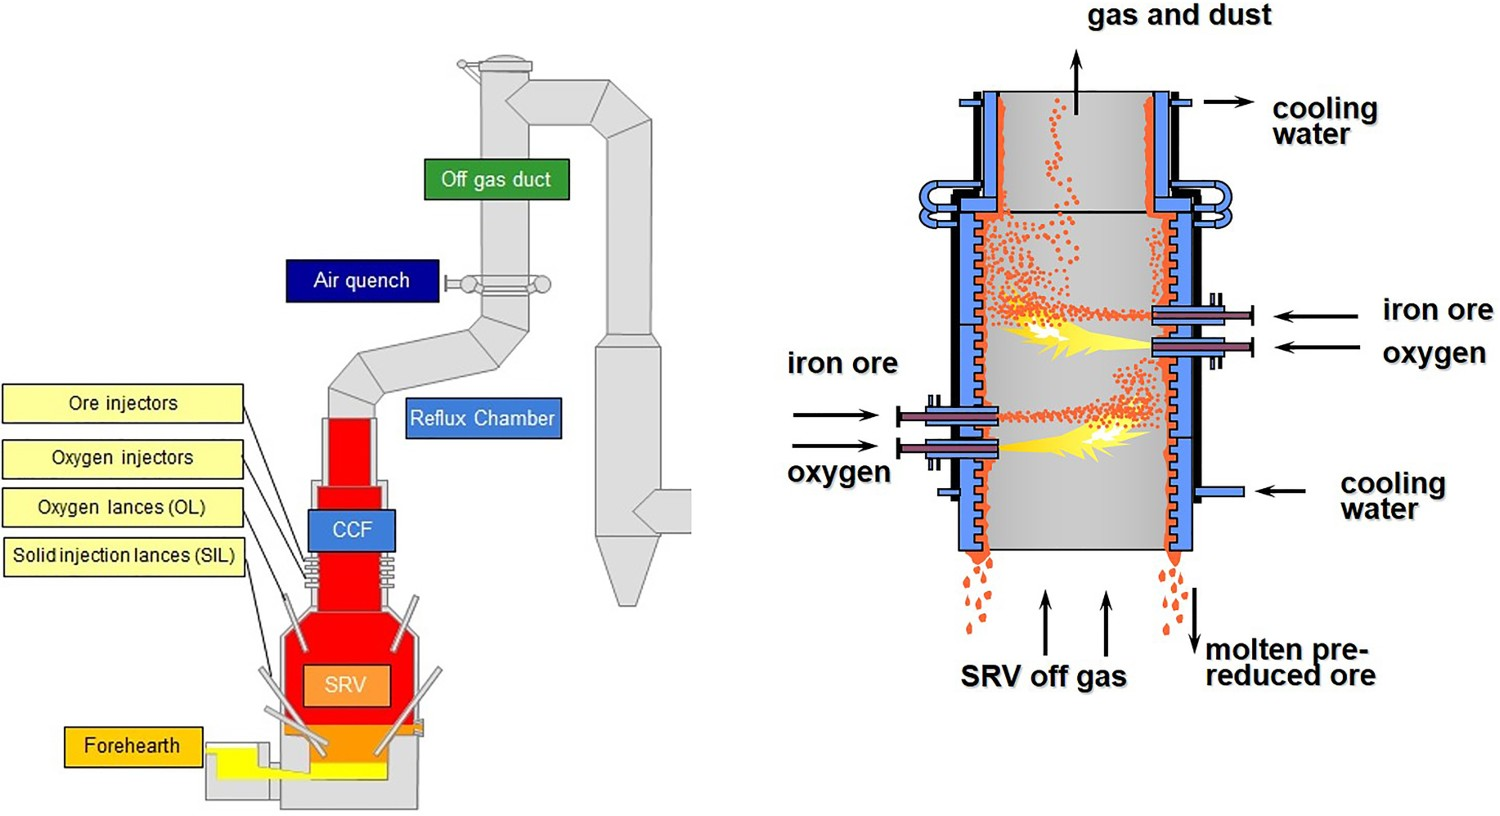
Fine iron ore is injected into the CCF along with pure oxygen. The oxygen is needed as an oxidizer to partly combust the CO-H2 compound of the off-gasses coming from the smelting reduction vessel (SRV). The combustion process provides heat to pre-reduce and melt the iron ore during the flight time and ultimately are deposited against the wall of the furnace. The accumulation of the particles on the wall creates a liquid film to drip along the wall and fall into the molten iron bath of the SRV.
Some of the injected ore, during the fly time, are carried away by the flu gas and escape CCF. According to the plant measurements and model prediction, almost 10% of the injected ore into CCF is escaping and enters the off-gas system. In the previous design, the off-gas system was a straight vertical pipe with an incinerator to burn unwanted compounds. The design is changed and a special piece is added to the system which is called the reflux chamber as shown in Figure 2. Scheme of the current reflux chamber installation.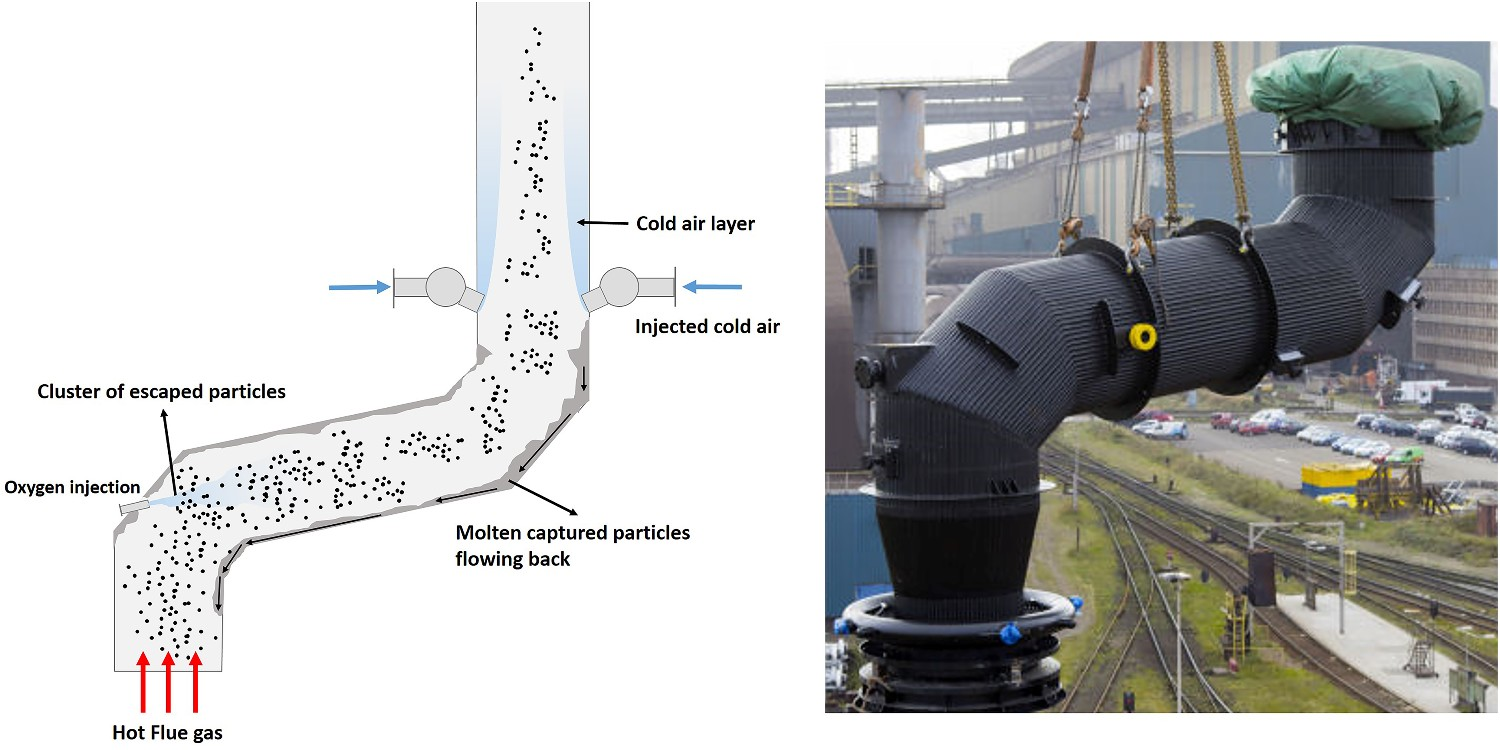
This modification fulfils two important tasks: First task, post-combustion of the remaining CO and H2 coming from CCF by injecting O2 and eliminating the downstream incinerator. Second task, capturing particles using the added bend and horizontal section. Once the molten pre-reduced ore particles are being carried with FG they hit the upper wall and form a film which can flow back to the CCF and then SRV. This material remains liquid as the temperature at the reflux chamber remains high (for most of the length), above the melting point of pre-reduced ore.
The current modification is called ‘dog leg’ and is capable of increasing capturing efficiency of escaped particles from CCF. Further increase in capturing efficiency can be achieved with further modification of the dog leg and by adding a second bend. The modified geometry is called ‘frog leg’ (see Figure 3(C)). The detailed discussion on particle capturing is a topic of another study which will be presented in another paper. In this study, the effect of frog leg configuration on the performance of the off-gas system is investigated. Off-gas system components and data acquisition points.
A three-dimensional computational fluid dynamics (CFD) model for the current HIsarna off-gas system (shown in Figure 3) is set up and validated by real plant data. In the model, a detailed reaction mechanism and kinetic data for post-combustion of CO-H2 mixture and carbon particles are incorporated. The results are presented and discussed in another study by the same authors [2]. In this study, the same model is used to investigate the off-gas system performance using the frog leg configuration for the reflux chamber.
CFD model overview
Detailed discussion on model setup, mesh, grid independency and governing equation can be found here [2]. In this section, a summary of the model set up and validation is presented. All of the equations, definitions and constants are taken from Ansys Fluent Theory Guide [3].
In any numerical simulation of fluid flow, a set of conservation equations of mass, momentum, energy and the turbulence will be solved. The equation for conservation of mass, or continuity equation, can be written as follows:


Particle behaviour is modelled using the Lagrangian discrete phase method. The force balance equation can be written in the Lagrangian reference frame as follows:
Liquid droplets evaporation is modelled using the convection/diffusion-controlled model. For carbon particle combustion, the field char oxidation model is used which is a simplification of the unreacted shrinking core model. Detailed kinetic mechanism proposed by Cuoci et al. [5] is used for CO-H2 mixture combustion and carbon is combusted through the kinetic data and expressions proposed by Wen et al. [6].
The computational grid (mesh) is composed of polyhedral cells. A total number of 1.5 million cells are used for all calculations. The advantage of using polyhedral mesh is lesser cell count compared to tetrahedral and hexahedral mesh elements while maintaining the accuracy of the predictions. For example, for the same assigned cell size, tetrahedral mesh generates a total number of 7.1 million cells which is 4.5 times higher than polyhedral mesh.
Inlets B and C for the CFD model setup.
Non-uniform profiles are used for species at the inlet. A fixed swirl number of 0.6 at the inlet of the reflux chamber is used to take into account the effect of swirl motion coming from CCF. The flow rate of carbon particles is considered to be 0.0282 kg s−1 with the uniform particle size of 12 × 10−5 m.
Wall material properties.
ANSYS FLUENT commercial software, which is a CFD code solver based on the finite volume method, is used to solve and couple the governing equations. To obtain velocity and pressure field, pressure–velocity coupling is required which is done through the coupled algorithm. The second-order upwind scheme is used to discretize the convective terms in all conservation equations. Ultimately a convergence criterion of 10−4 for the relative error between two successive iterations is considered.
Results and discussion
The temperature and composition profile from model prediction and real measurements for dogleg geometry are shown in Figure 4. The data are plotted as an average value over a cross-section swept along the centreline of the system (length). As it can be seen, the predictions are in fair agreement with the measured industrial data [2]. The same validated model is used to study the further geometrical modification of the reflux chamber and possible effects on the off-gas system performance and the results are discussed in the following sections. The simulations for frog leg geometry are performed from inlet to Point C as illustrated in Figure 3(A) and the water quenched zone is not included in the models. Temperature and composition profile for model prediction and plant measurements (10% error in temperature measurement).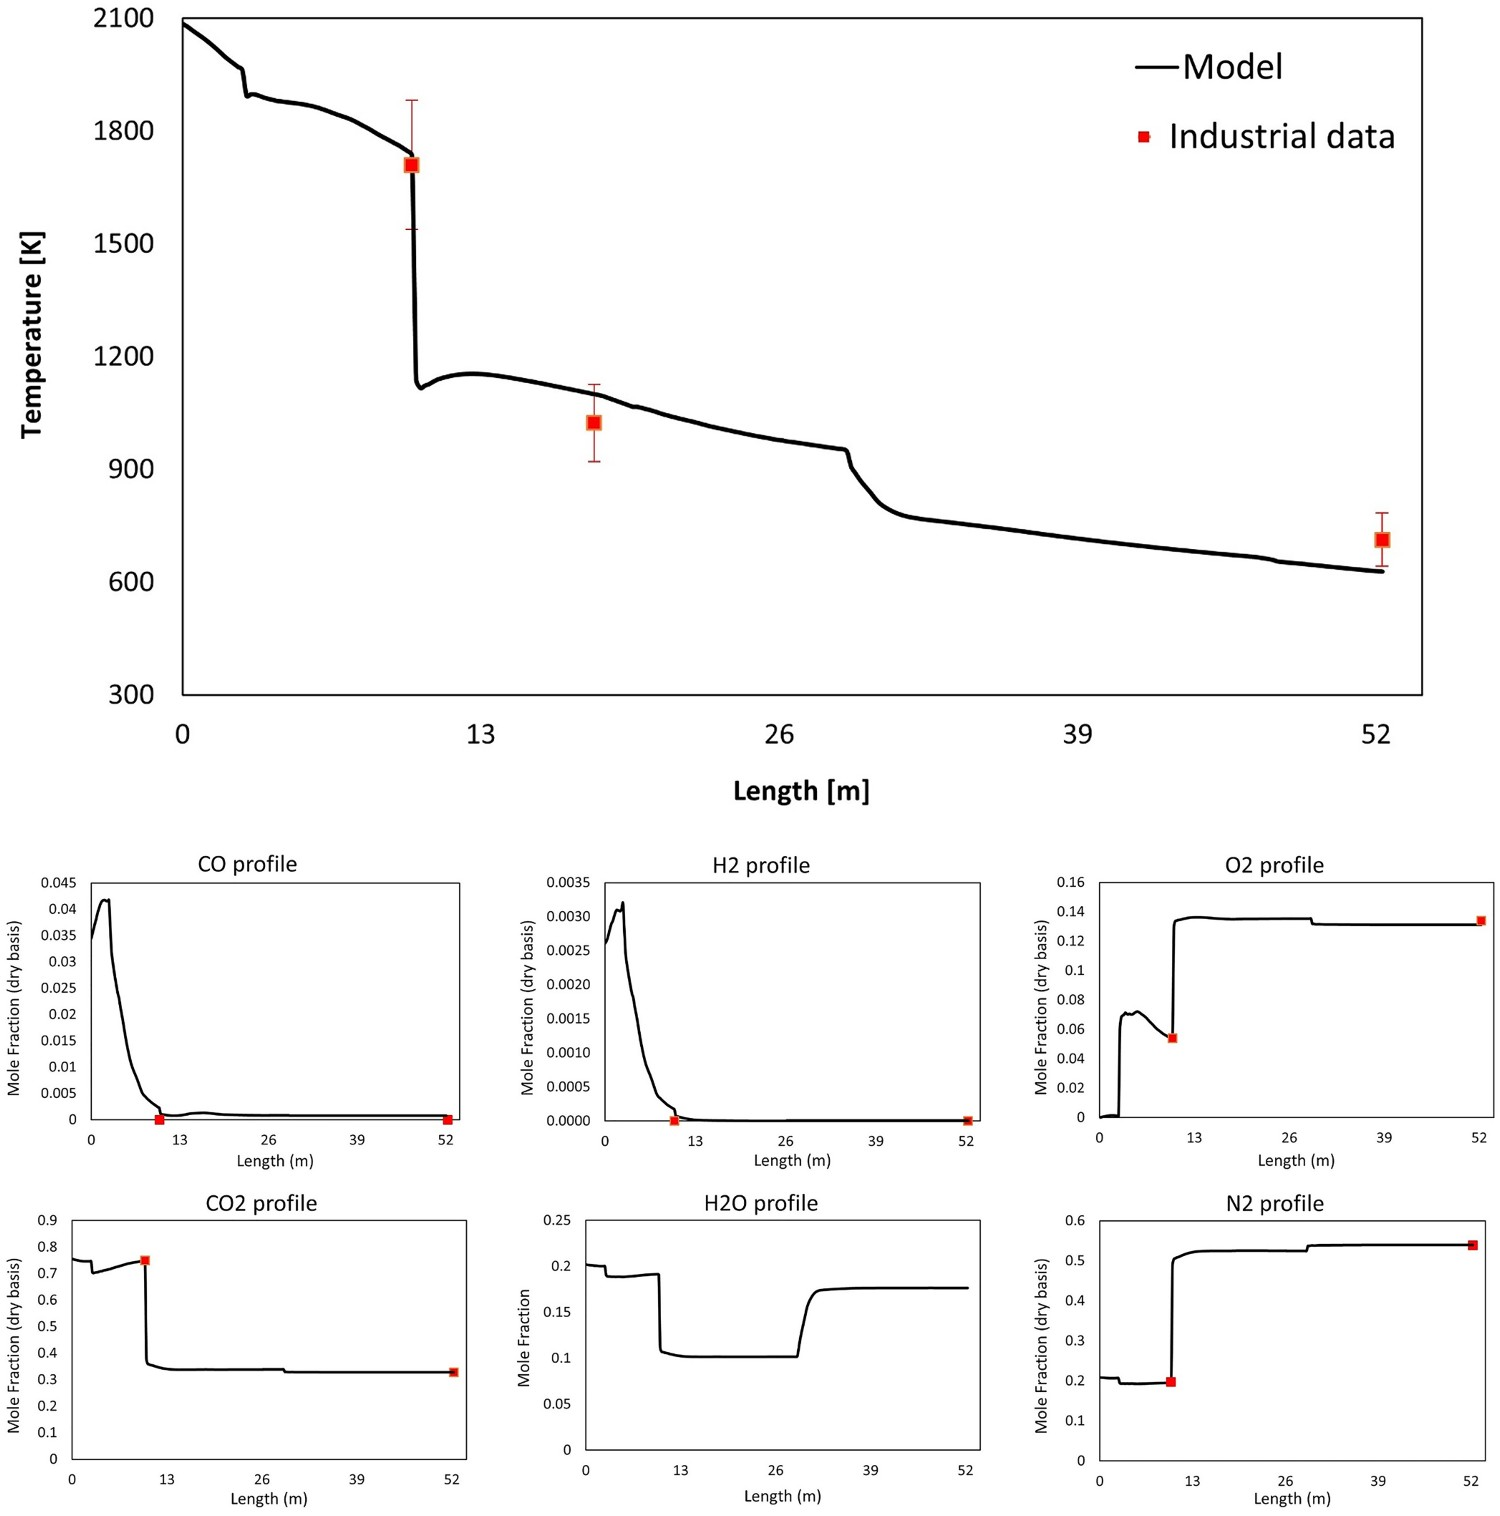
Temperature and composition profiles
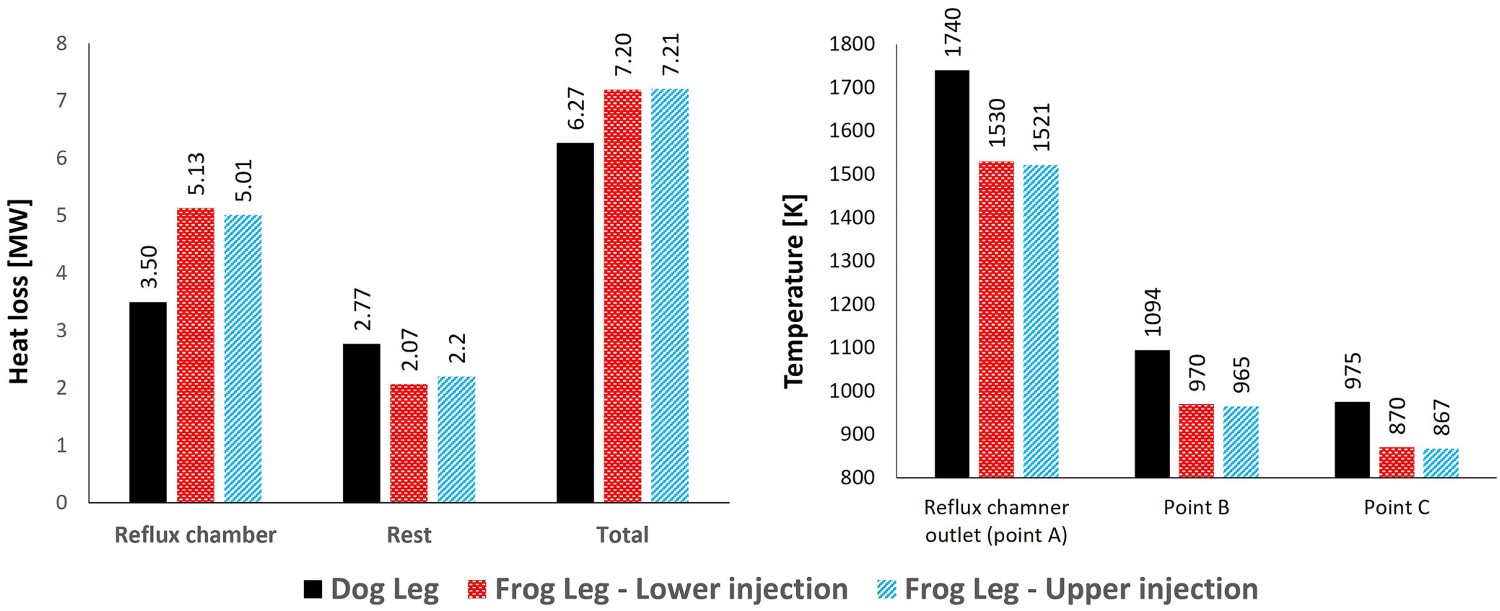
Figure 5 shows the temperature and composition profile for dog leg and frog leg geometry. The oxygen injection position is the same as dog leg geometry (lower position) and as it can be seen the profile trends are the same at the beginning of the reflux chamber length. For frog leg geometry, the temperature reduction continues and the flu gas enters the air quench section at much lower temperature (210°C difference) as heat loss in the reflux chamber is higher (illustrated in Figure 6). Temperature and composition profile for the off-gas system – model prediction for ‘dog leg’ and ‘frog leg’ geometry from inlet to Point C. Calculated heat loss (left) and calculated temperature at different measurement points for different designs.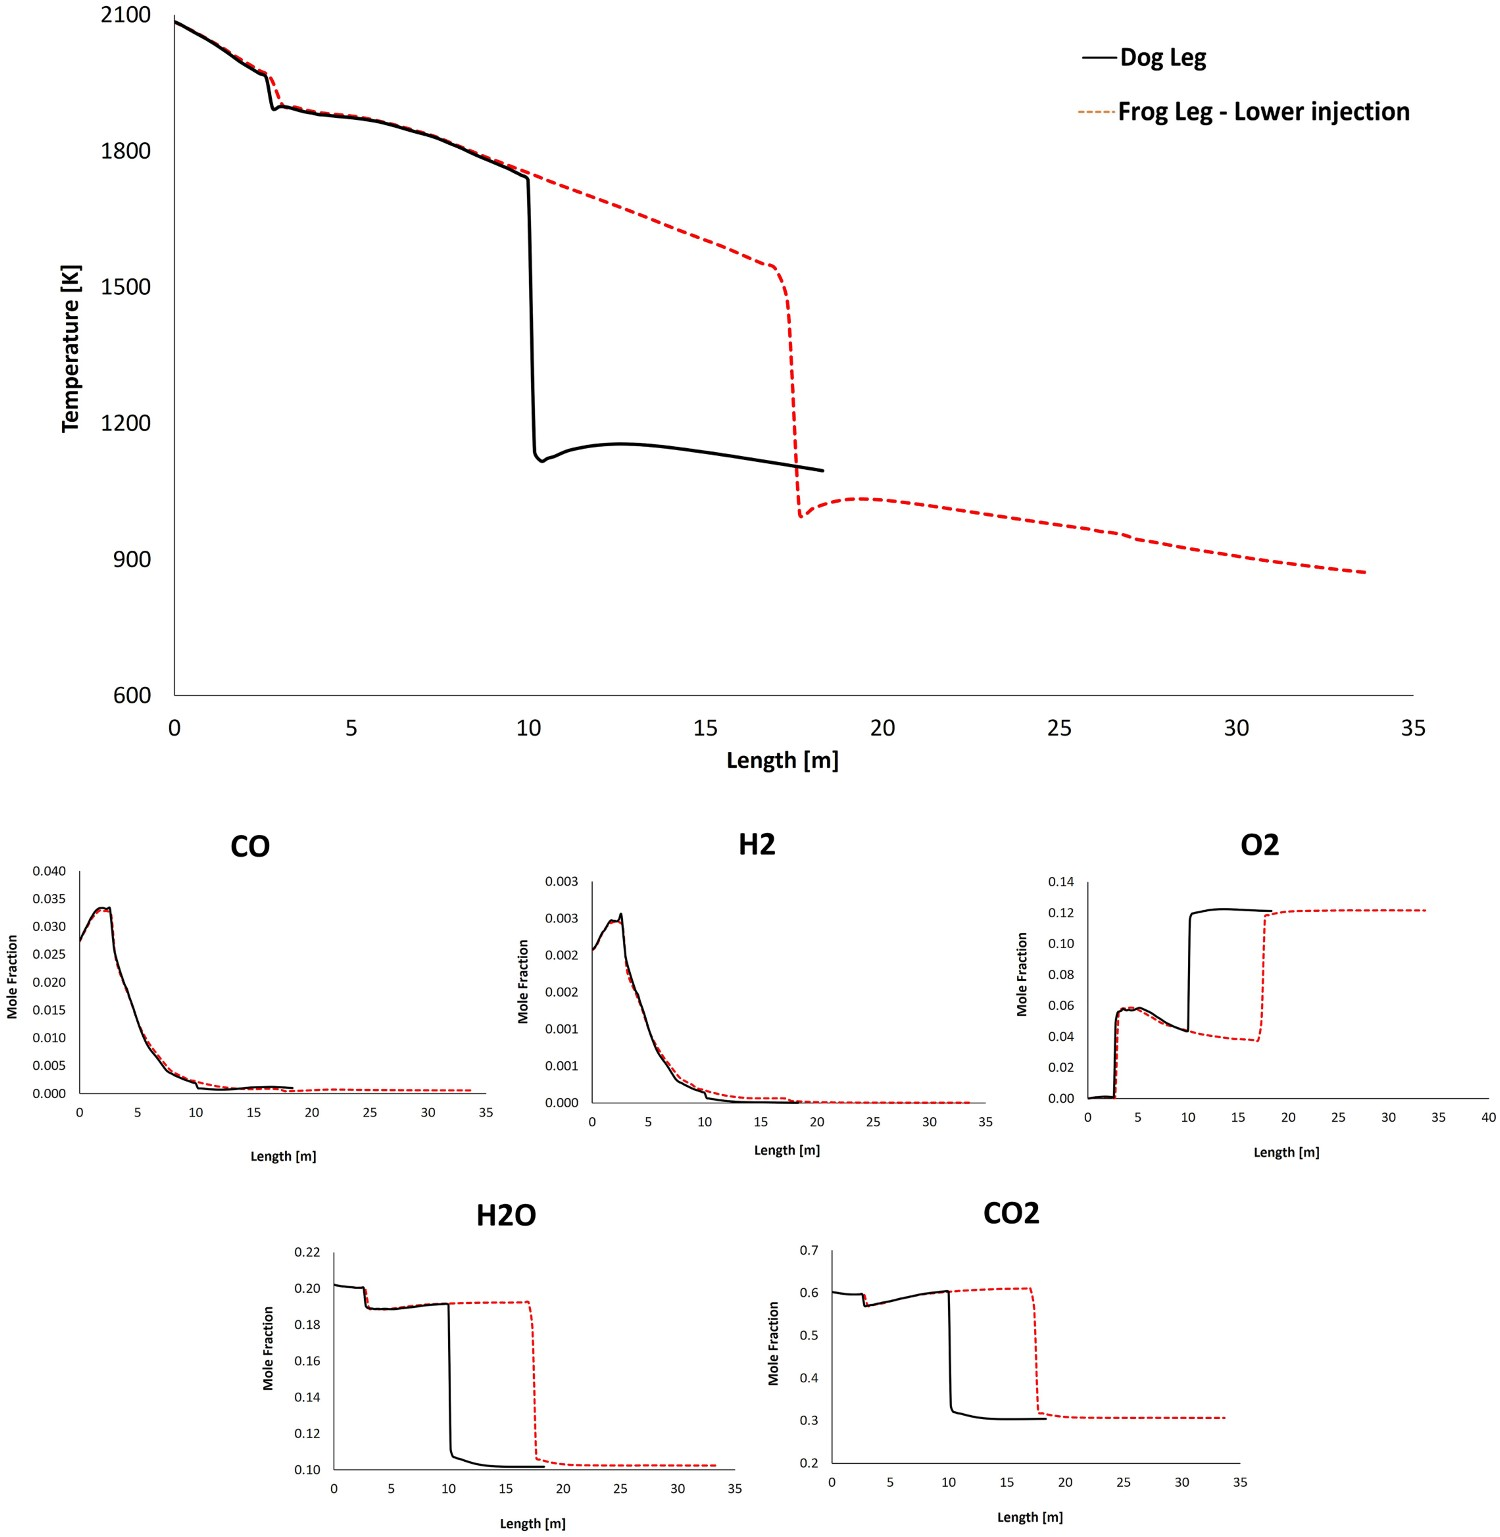
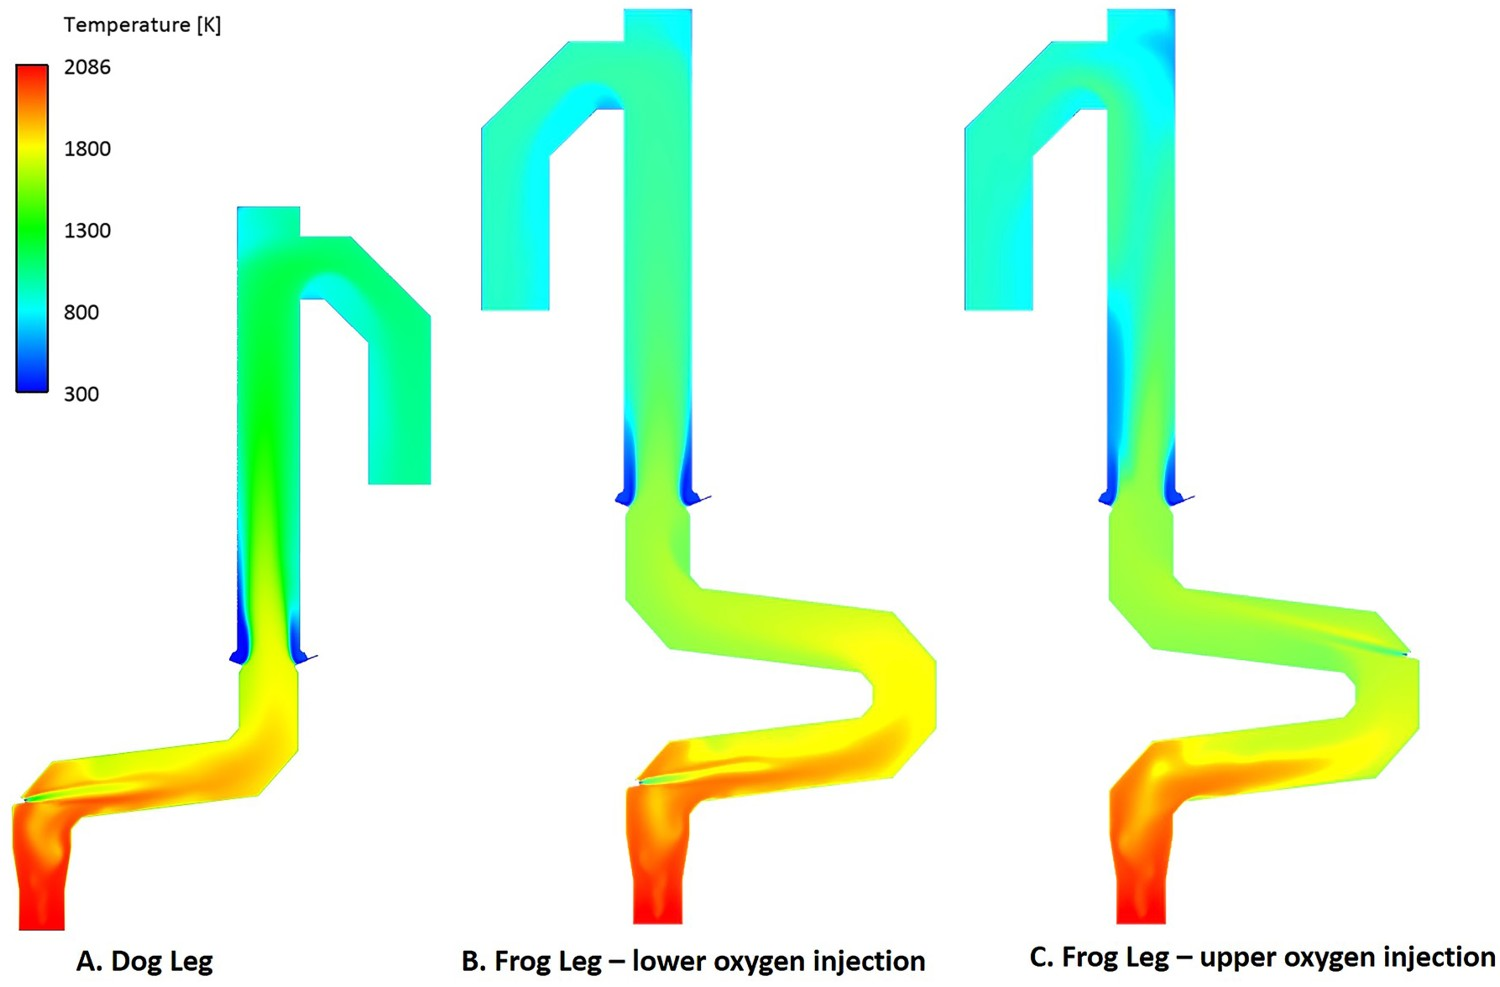
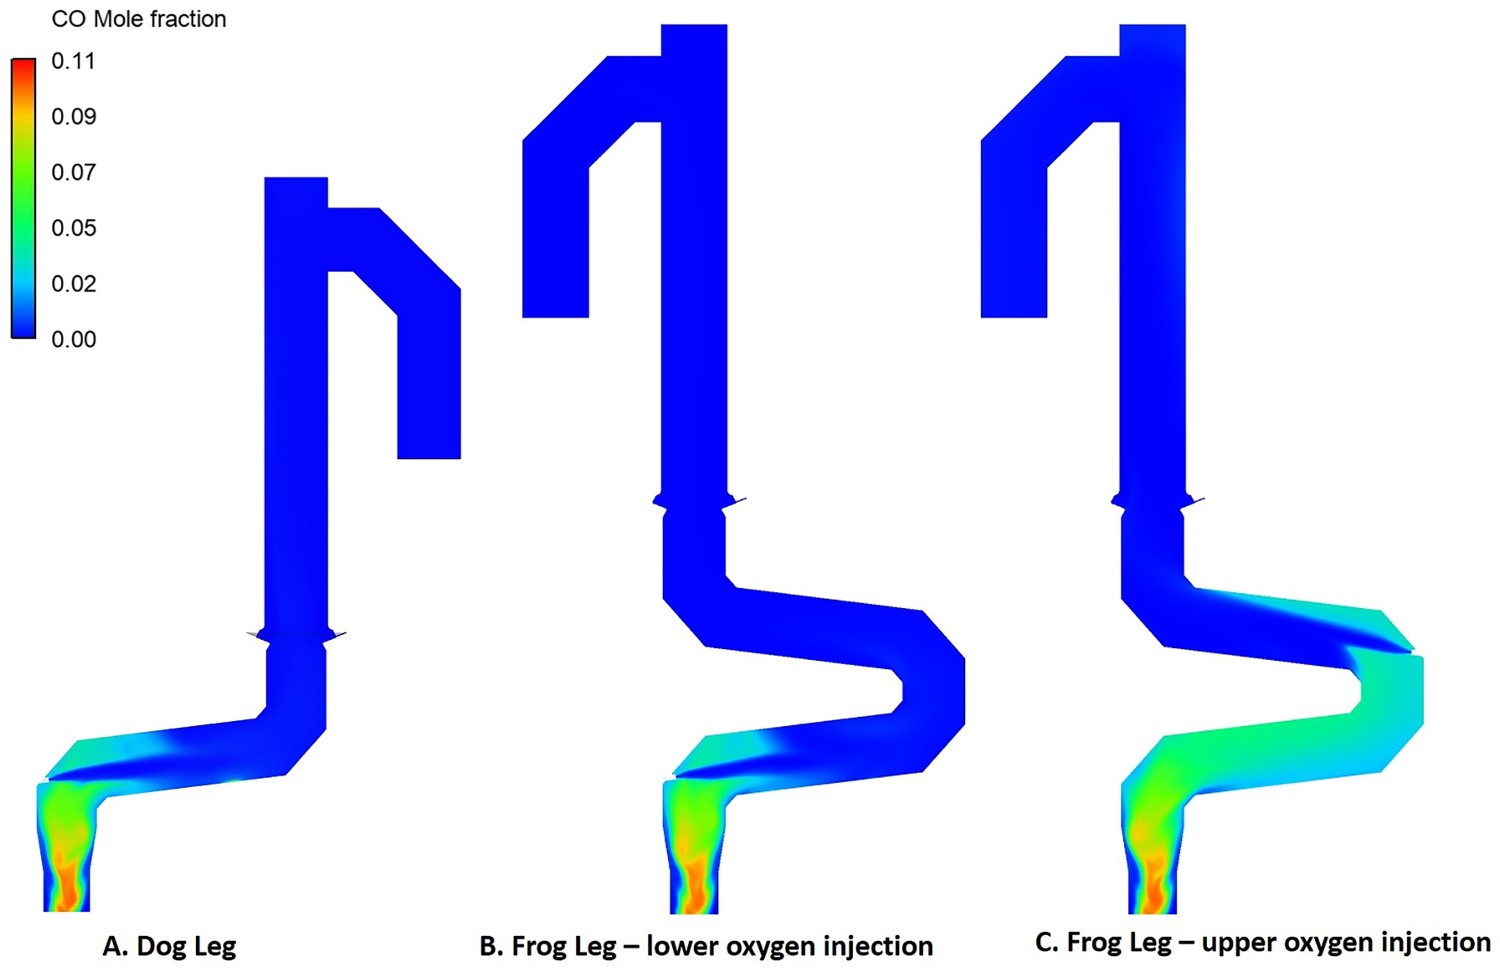
As shown in Figure 3(C), using the frog leg design, it is possible to inject oxygen at two different elevations. Figures 7–9 show the temperature and composition profile contours for different positions of oxygen injection inside the frog leg geometry. From these graphs, a major difference can be seen between the two designs. Once the oxygen is injected at lower part, the temperature tends to stay higher inside the reflux chamber (compared to upper injection). This is a great advantage since CO and carbon will be combusted with higher rate at higher temperature. Ultimately both designs lead to the same temperature at the reflux chamber outlet (also at Points B and C) and similar heat losses as presented in Figure 6. The modified design leads to a lower averaged temperature at different measuring points compared to the dog leg design due to higher heat loss through the walls. When oxygen is injected into the upper region, the combustion of unwanted CO and H2 is delayed due to the lack of oxygen at lower part of the reflux chamber. In fact, an increase in CO and H2 is observed in the lower part as carbon can react with H2O and CO2 to produce H2 and CO, respectively. Temperature and composition profile for the off-gas system – model prediction for ‘frog leg’ geometry with different oxygen injection levels – from inlet to Point C. Temperature contours for different off-gas designs. CO contours for different off-gas designs.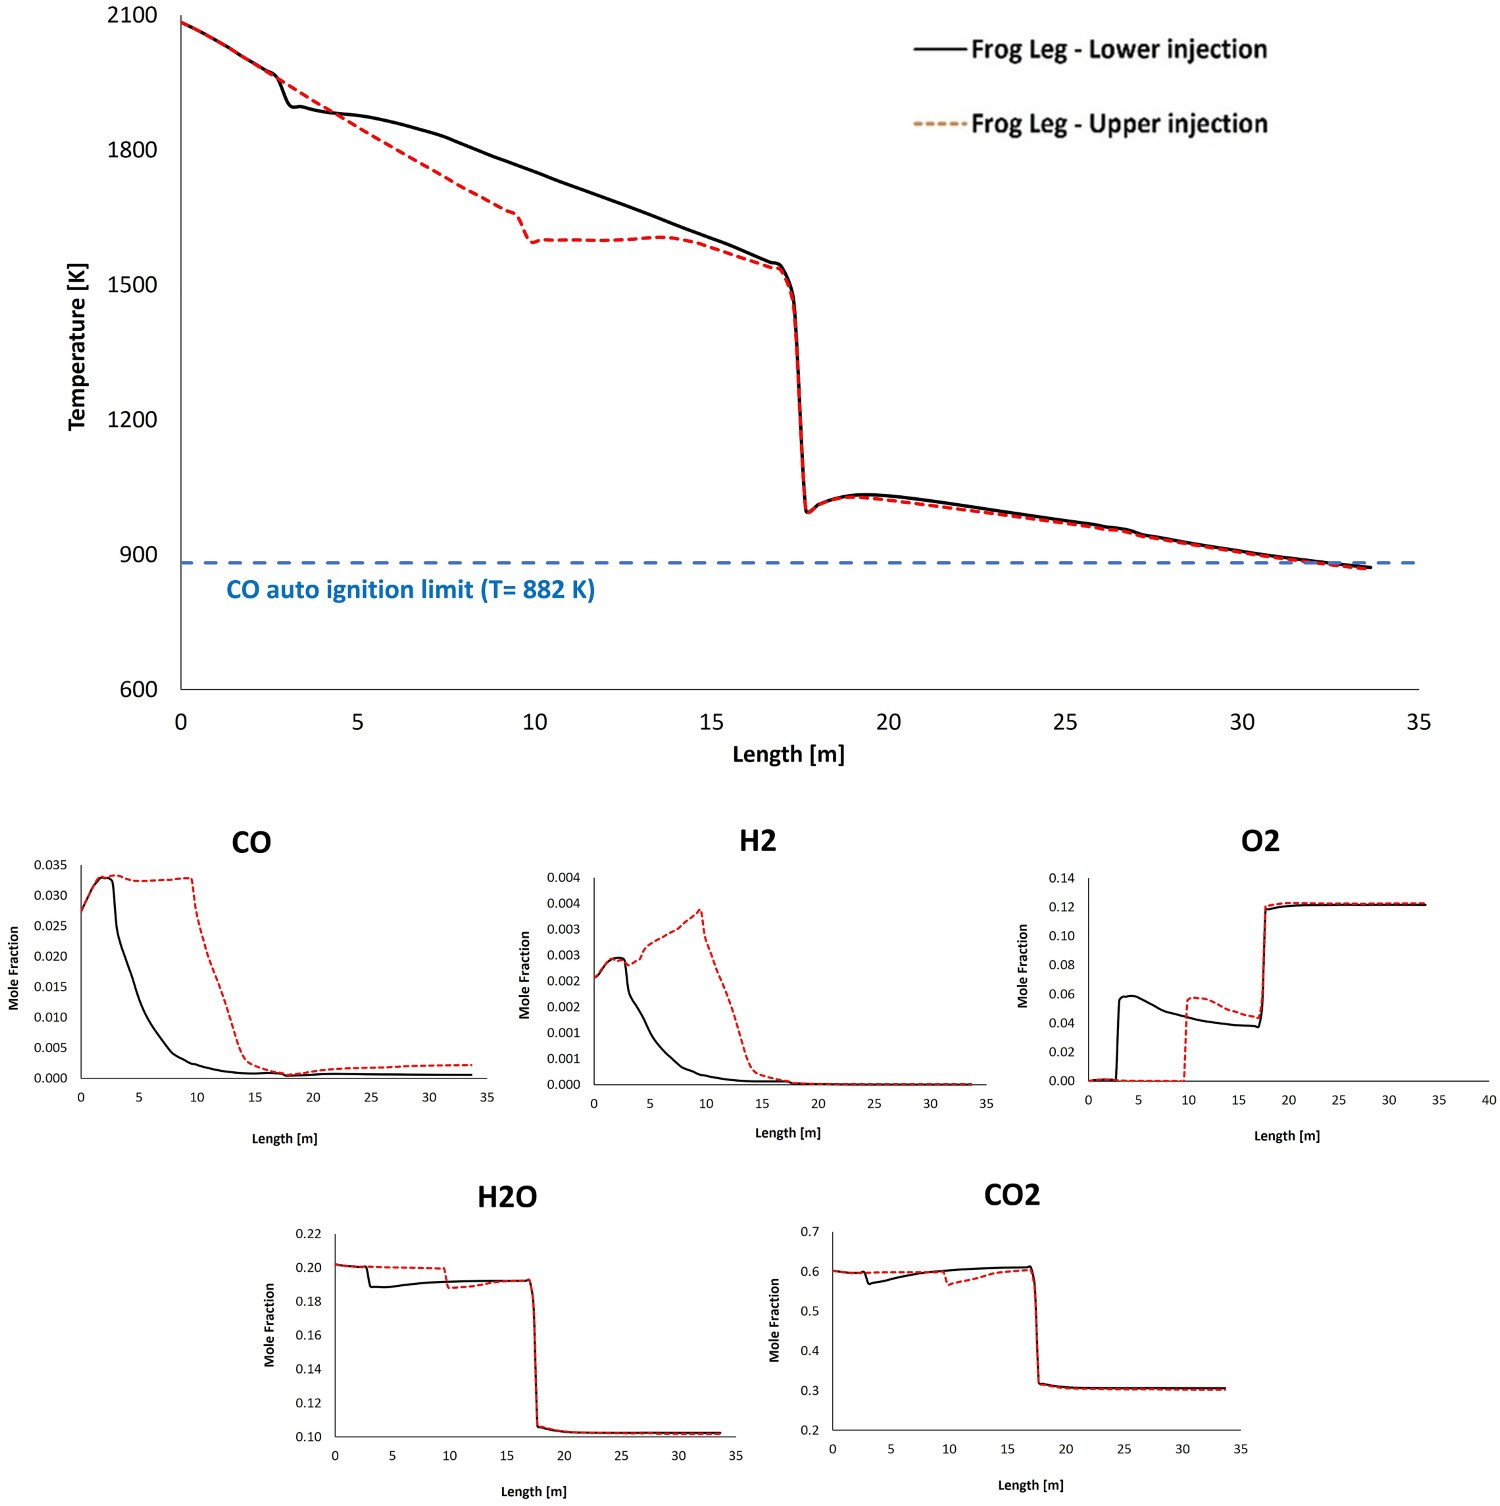
Carbon and CO conversion
As mentioned before different profiles for CO mole fraction across the reflux chamber length are observed for the frog leg geometry. This difference stems from different oxygen injection positions.
For the case with lower injection, the oxygen is injected at the early stage (3 m from inlet) and the combustion of CO and carbon particles proceeds immediately after entering the reflux chamber. Because of the longer length compared to the dog leg geometry, the unwanted species will have higher residence time inside the reflux chamber and will mix for longer time with the flu gas. This will increase CO and carbon conversion inside the reflux chamber as reported in Figure 10 at different measurement points. CO and carbon, conversion and flow rate at different measurement points for different designs.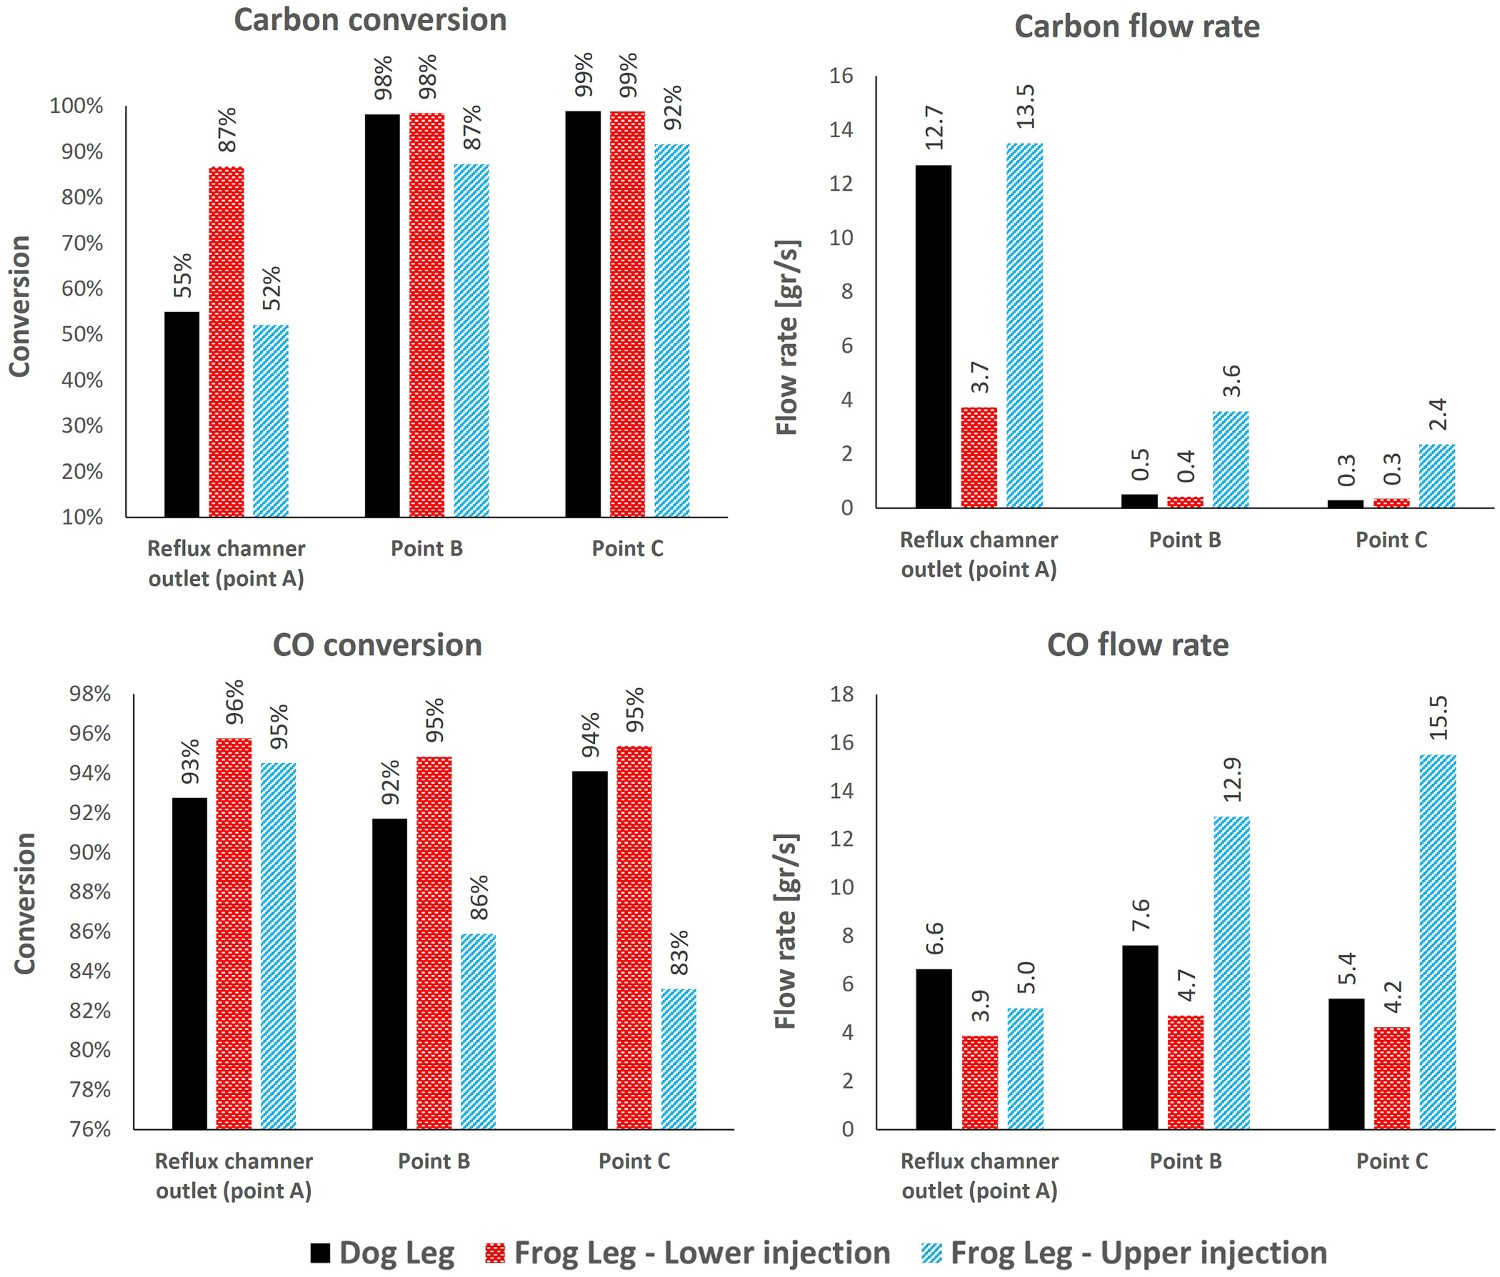
Species conversion is defined as: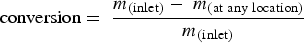

This conclusion can also be seen in Figure 11 where the carbon particle track, coloured by particle diameter, is shown. As it can be seen carbon particles reach their minimum diameter at a shorter length compared to the dog leg geometry. Carbon particle tracks coloured by particle diameter for different off-gas designs.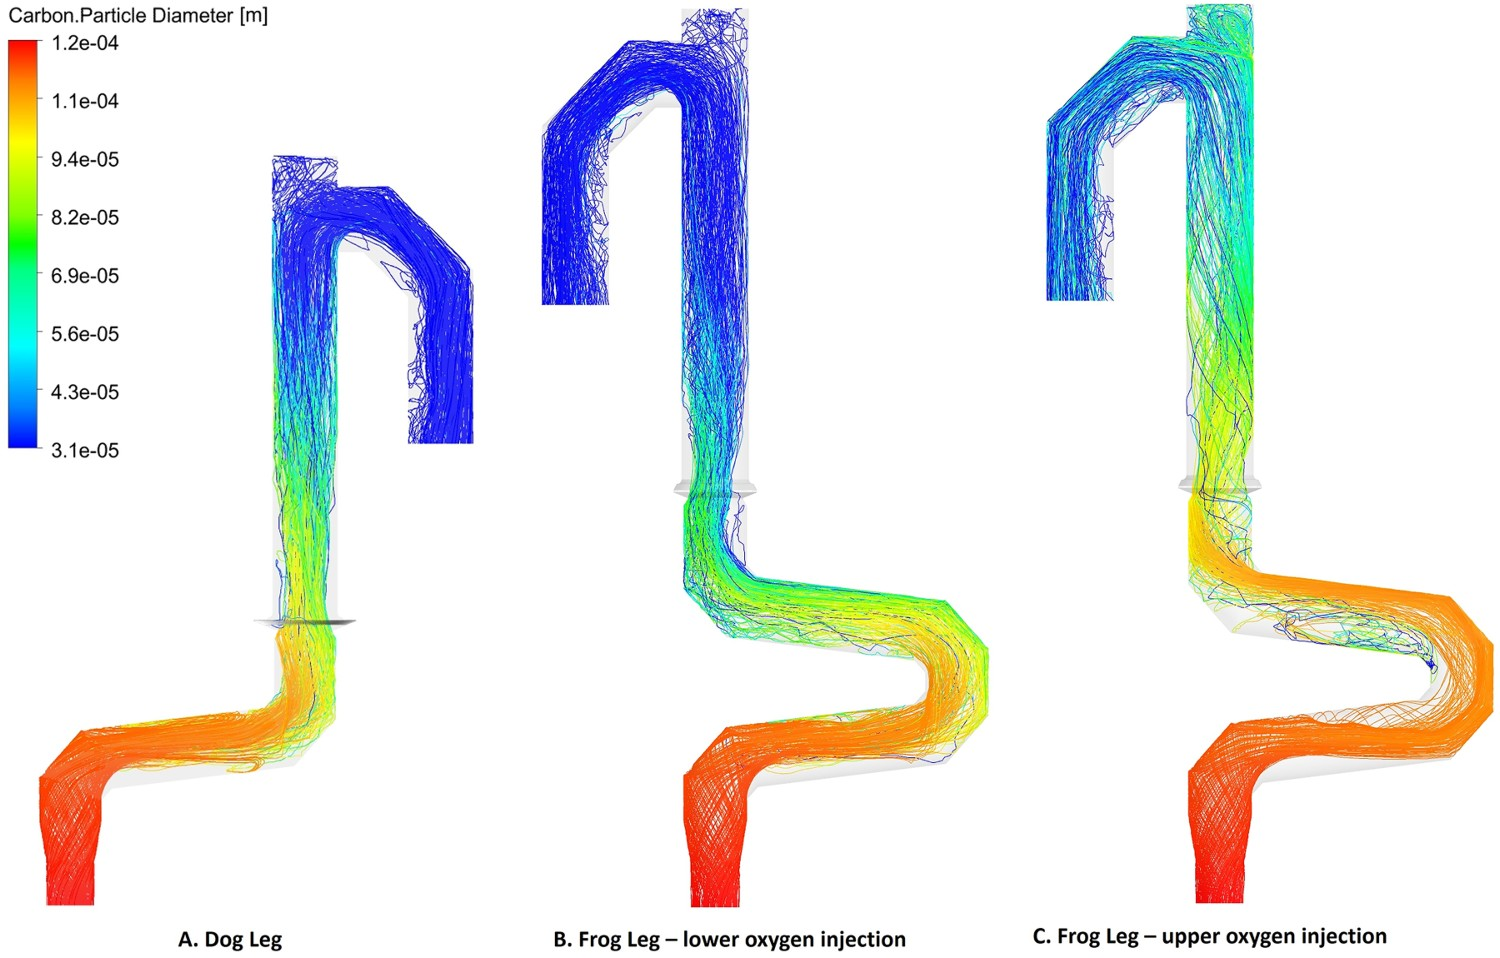
The other option is injecting oxygen at the upper level of the reflux chamber. In this case, the combustion and conversion of CO and carbon particles with oxygen are delayed. However, the carbon conversion still proceeds by reacting with H2O and CO2 and a negative conversion (increase in flow rate from 91 to 110 g s−1) of CO is predicted. The maximum conversion of carbon particles before reaching the oxygen port (length: 9.5 m) is 20% with reduced flow rate from 28.2 to 23 g s−1.
Owing to the heat loss through the wall and the endothermic reaction of carbon particles with H2O-CO2 mixture, the temperature is constantly decreasing and reaches as low as 1650 K before mixing with oxygen at the injection point. The reaction temperature with oxygen is much lower compared to the case with lower injection where the flu gas is mixed with oxygen at a temperature of 1945 K.
So for the upper injection case, carbon reaction with oxygen inside the reflux chamber is performed at a lower temperature which leads to a lower reaction rate and conversion (52%) as depicted in Figure 12 which is 35% lesser than in lower injection case. The escaped carbon enters air quench at a low temperature where the flu gas is further quenched. Carbon particles will still react with oxygen (and H2O-CO2 mixture) to produce CO, however, the reaction rate of CO combustion is low due to lower temperature in up/down leg. So the CO consumption rate will be lower than the production rate and accumulation of CO occurs. Also, a full conversion of carbon is not predicted, even though the flow rate is constantly decreasing and ultimately 8% of carbon particles enter Point C and the water quenched zone. The increase in CO flow rate can be clearly seen in Figures 10 and 12 (decreasing conversion profile). As reported in Figure 10, the flow rate of CO and carbon is higher than in other designs at Point C before entering the water quenched zone. Further conversion of CO cannot happen since the flu gas temperature falls below the auto-ignition temperature of CO (882 K) before reaching Point C as shown in Figure 7. This is true for both frog leg cases, however, for the dog leg design the temperature is still higher than auto-ignition temperature and CO conversion still proceeds even after Point C. CO and carbon, conversion and flow rate profile along the off-gas system length for ‘frog leg’ geometry (Points A, B and C are shown). Positive conversion means consumption and negative means production of species.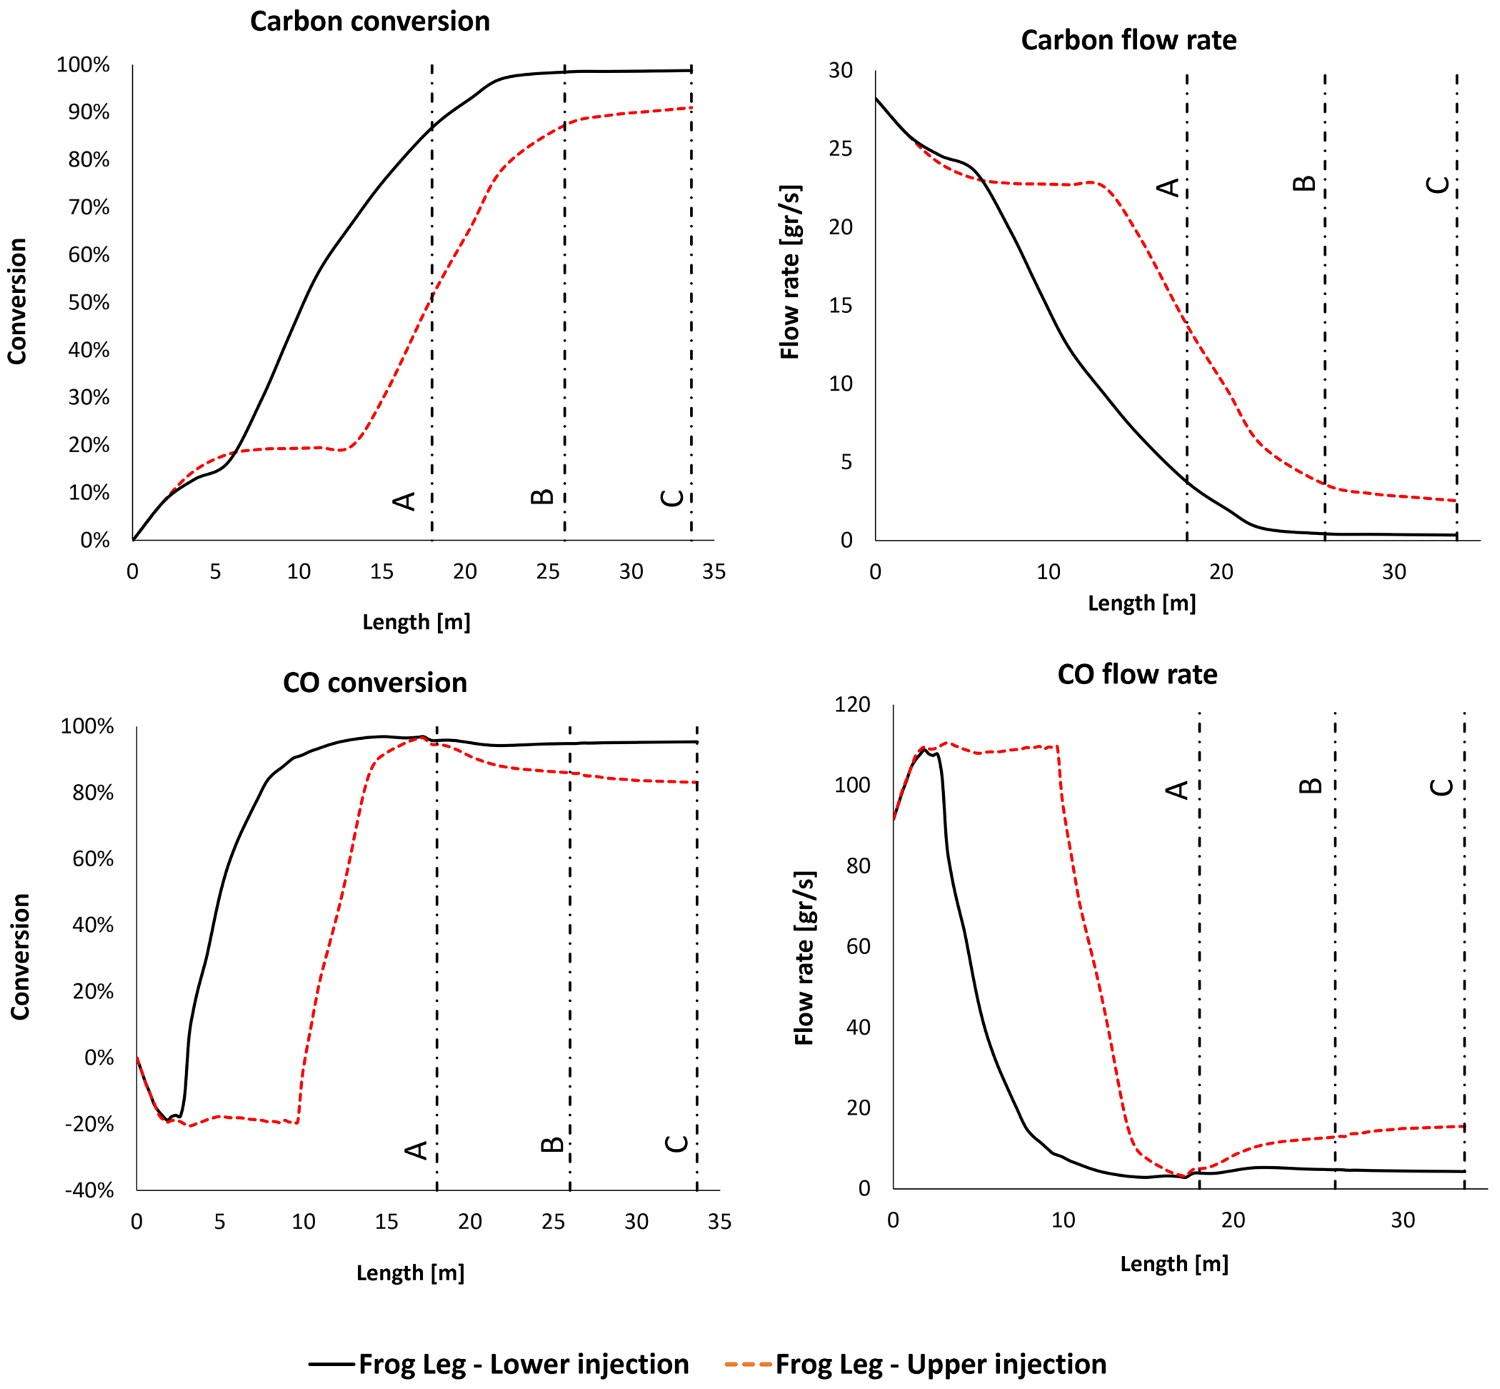
For the case with lower oxygen injection, the escaped fraction of carbon from the reflux chamber is much lower (13% compared to 48% for upper injection) and CO conversion is already 96%. Owing to a lower carbon emission from the reflux chamber, the amount of CO produced inside up/down leg is insignificant or small and is safely combusted with 95% conversion. The carbon also reaches full conversion at Points B and C as reported in Figure 10 and visualized in Figure 11.
To sum up, reflux chamber performance plays an important role in overall system performance regarding unwanted species removal. It is desired to perform all possible conversions inside the reflux chamber and at high temperature. This becomes more important for frog leg geometry. It is quite important to reach maximum CO and carbon combustion (preferably full combustion) before Point C to avoid any emission of unwanted species into the water quench zone. Based on the model predictions, the frog leg geometry with lower oxygen injection can fulfil this ideal with maximum CO and carbon conversion.
Further modification of frog leg geometry
As discussed before, the frog leg design with upper oxygen injection leads to CO and carbon particle emission into the water quench zone. However, with further modification, it is possible to reach a better or the same performance as other designs.
This can be acquired by keeping the temperature as high as possible inside the reflux chamber. One possible solution would be decreasing the heat loss inside the reflux chamber by increasing the refractory wall thickness. A set of simulations is performed to investigate the effect of wall thickness on the reflux chamber performance for the frog leg geometry with upper oxygen injection.
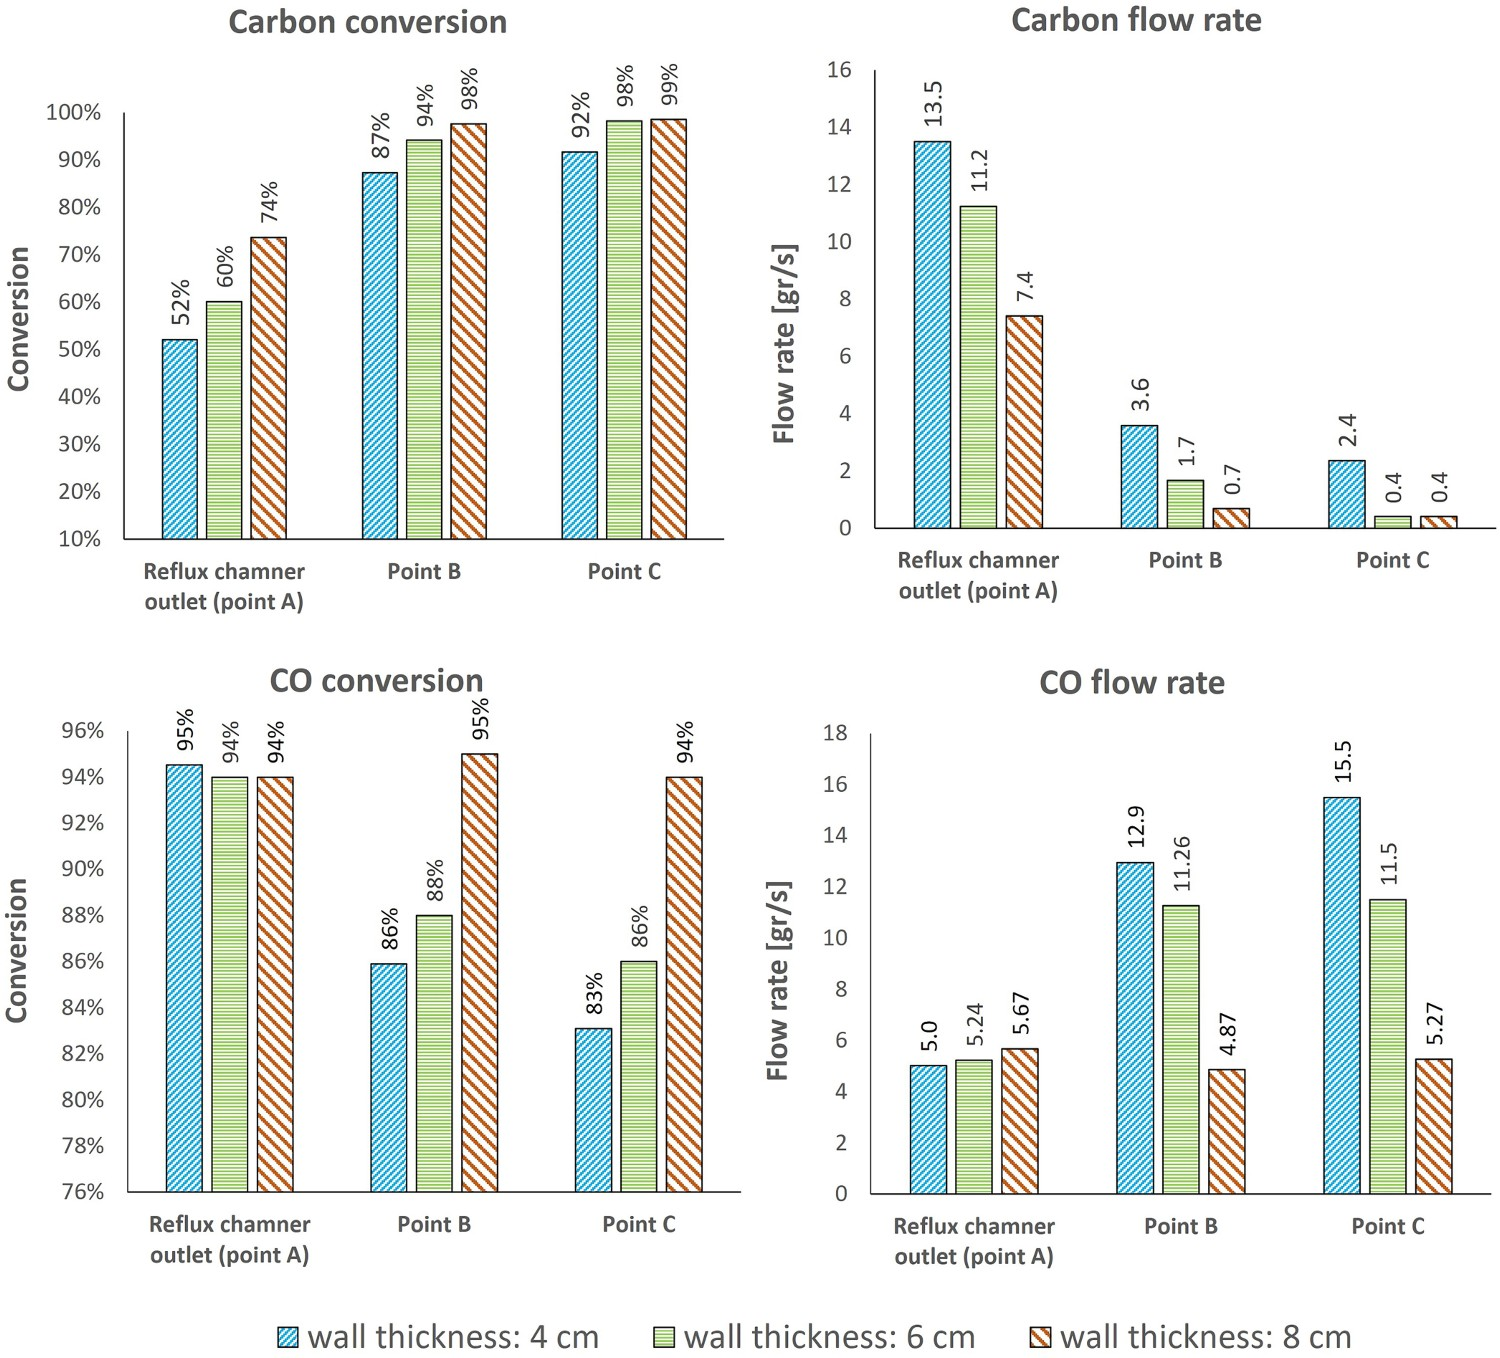
In Figure 13, the temperature, CO and carbon profiles for conversion and the flow rate are shown. As it can be derived from both profiles, increasing wall thickness will increase the isolation quality of the walls thus raising the local temperature inside the reflux chamber. This will lead to higher consumption rate and lower emission of CO and carbon into the regions with low temperature. The carbon conversion inside the reflux chamber, increases from 51% for original thickness to 60% and 74% for 6 and 8 cm of wall thickness, respectively (see Figure 14). Since the temperature is still high for thicker refractory walls, a full conversion of carbon is predicted before reaching Point C for both increased thickness. Carbon monoxide conversion is high, around 95% for all cases, at the outlet of the reflux chamber, however, it remains high only for wall thickness of 8 cm and it is as low as 86% and 83% for 6 and 4 cm of wall thickness due to a higher carbon emission from reflux chamber. The emitted carbon will still be converted to CO but with a lower temperature inside up/down leg, the CO conversion rate will be low. Effect of wall thickness on temperature and composition profile for frog leg geometry with upper oxygen injection. CO and carbon, conversion and flow rate at different measurement points for different wall thickness.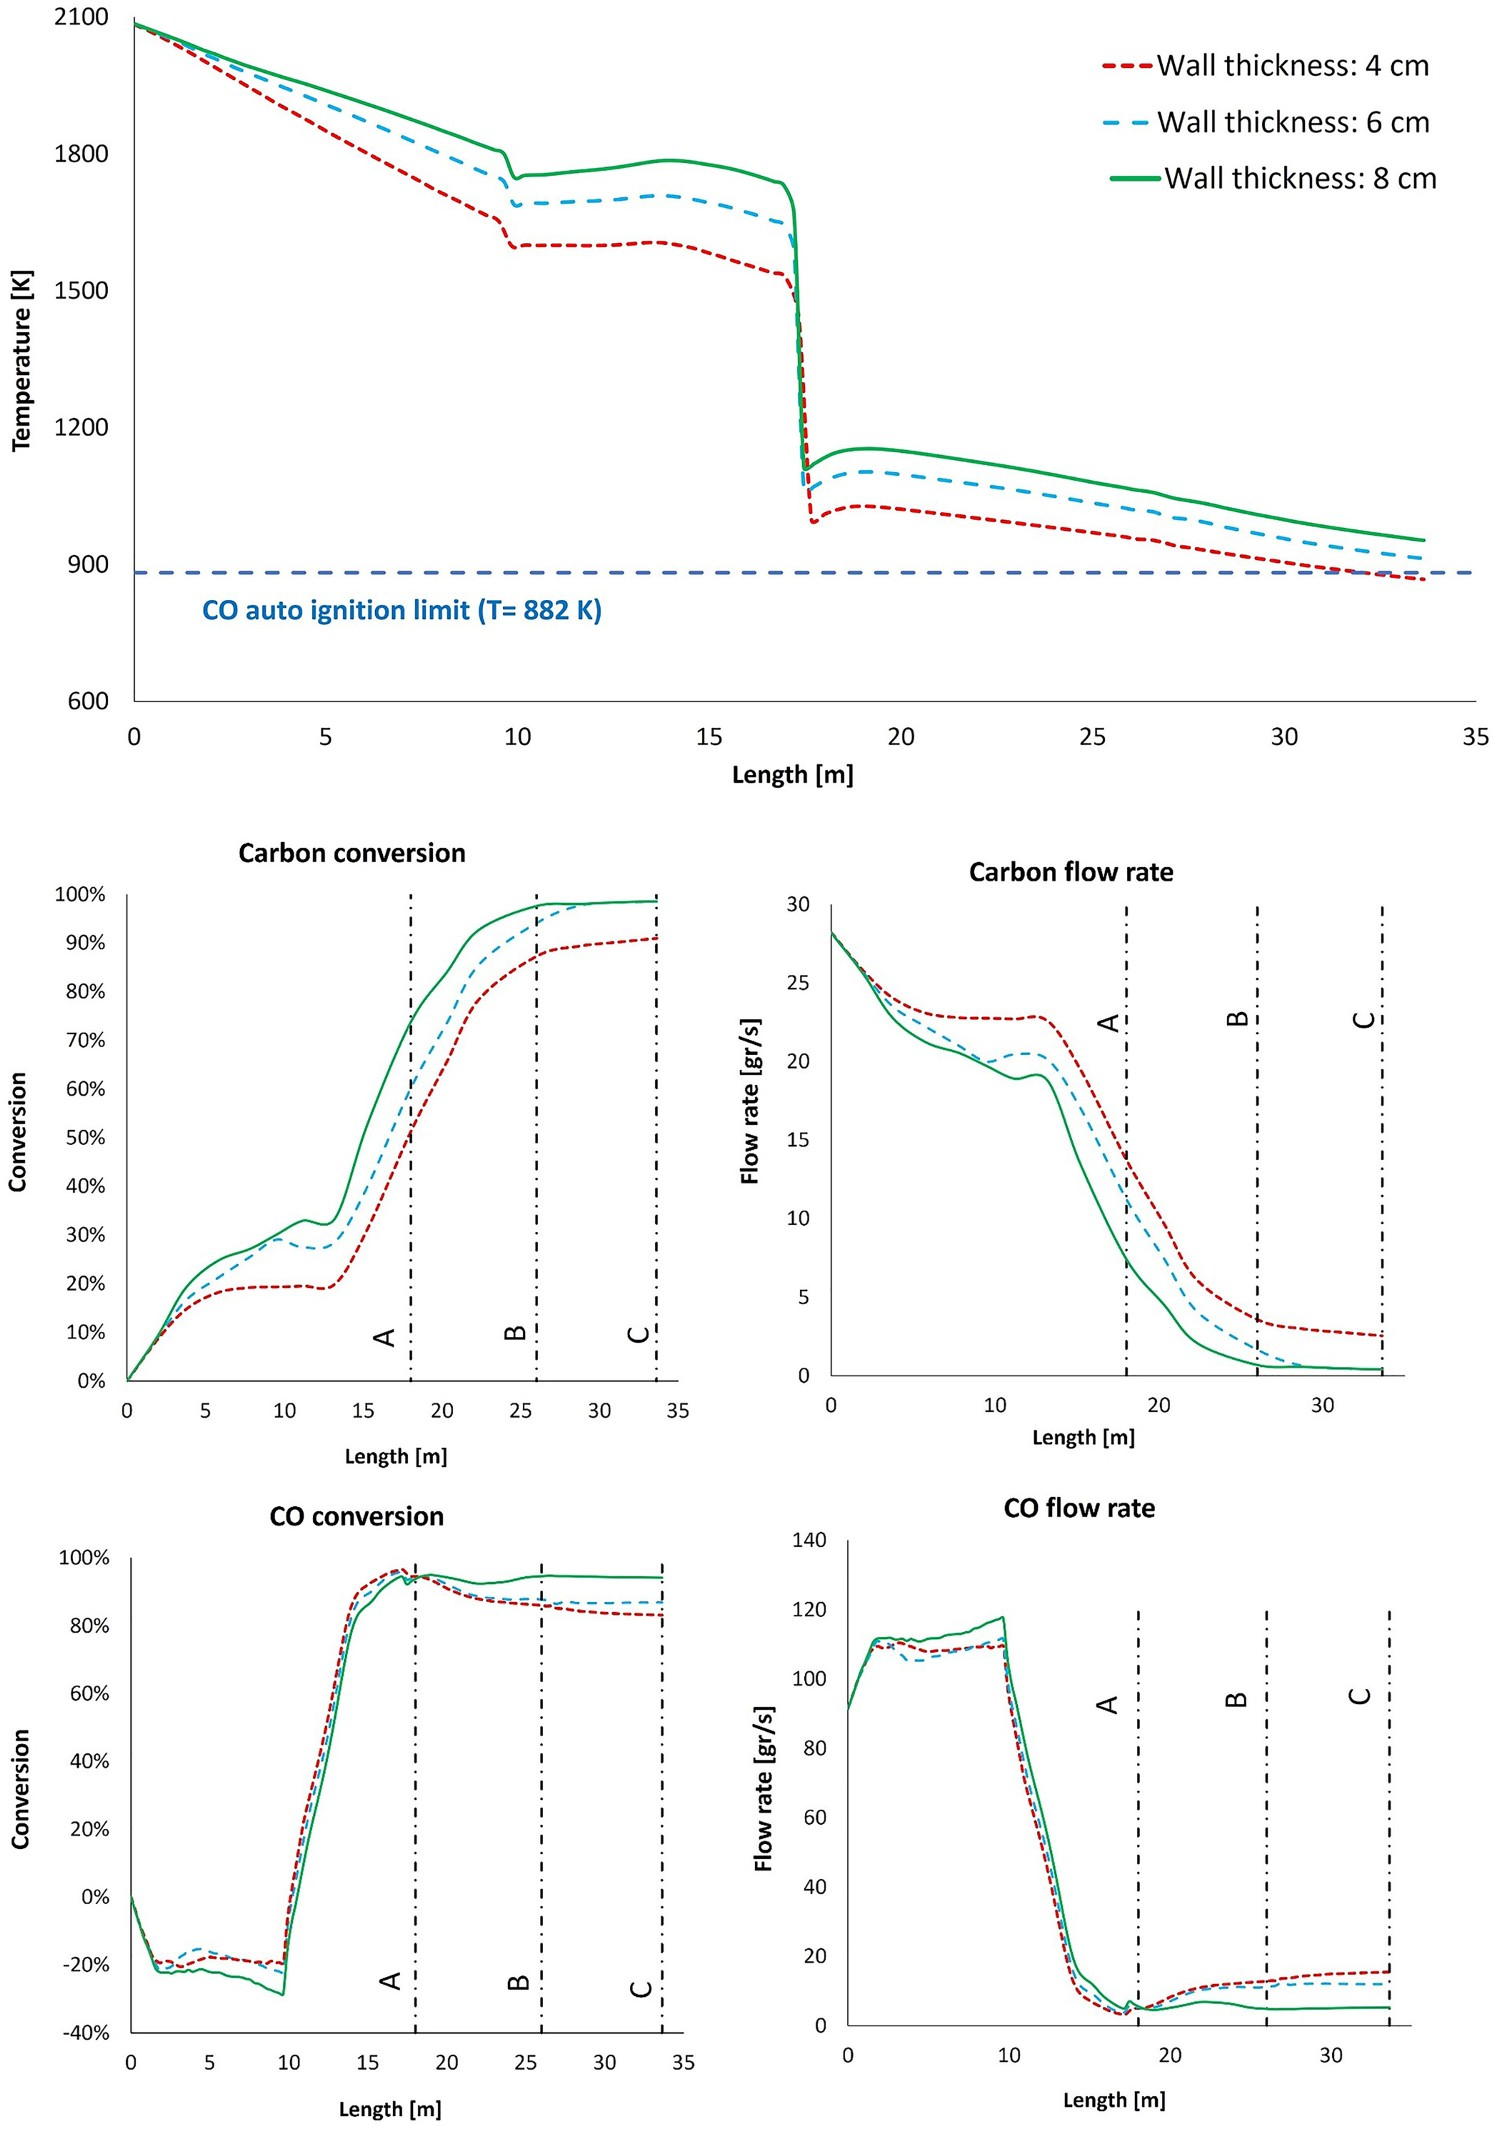
The same modification can also be performed for the frog leg geometry with lower oxygen injection to reach the maximum possible conversion of unwanted species (not presented here).
Increasing the temperature inside the reflux chamber will offer another benefit. As mentioned before the reason for modification from dog leg to frog leg geometry is mainly increasing particle capturing efficiency (see section). Once molten ore particles (escaped from CCF) hit the wall they will form a liquid surface which flows back into the CCF. It is important for the particles to remain in the liquid phase (or semi-liquid) to be captured by the wall. Particles in solid-state bounce off the wall with much lower chance of capturing.
The physical state of individual particles can be liquid, semi-liquid or solid depending on the composition. The injected particles to CCF are mainly composed of Fe2O3 which is reduced to Fe3O4 and FeO. For semi-liquid or liquid state of iron ore, the predicted temperature of 1723–1872 K (which melting temperature of pure Fe3O4) is needed. If the maximum temperature is considered here, with the original design of the dog leg (with wall thickness of 4 cm), the temperature falls under 1872 K half way of the reflux chamber length (around 5.9 m) this length is 4.8 and 5.8 m for the frog leg design with upper and lower oxygen injection, respectively. Considering the longer length of the reflux chamber for the frog leg design and based on the predicted temperature profiles, most of the wall length will not capture any particles. So increasing wall thickness will put more of the reflux chamber volume above the maximum melting temperature of particles to increase the capturing efficiency of the walls. A detailed model is needed to investigate particle capturing efficiency for different designs which is a topic of another ongoing study by the same authors.
Conclusion
A three-dimensional CFD model is developed to study the HIsarna off-gas system. The model is validated and used for further modification of the reflux chamber. The geometry of the reflux chamber is changed from ‘dog leg’ to ‘frog leg’ geometry by adding another bend at the upper section of the chamber before the air quench. The modification offers a great potential for increasing capturing efficiency of pre-reduced iron ore particles escaping from CCF. In this study, the effect of this modification on CO and carbon conversion and general effect on temper sure and composition profile is investigated without focusing on the particle capturing effect. It was possible to inject oxygen at different positions in the reflux chamber (frog leg geometry). Depending on the injection position, the frog leg geometry can have a notable effect on the mentioned parameters and profiles.
Injecting oxygen at the lower level has led to the best performance with the highest carbon and CO conversion inside the reflux chamber and off-gas downstream comparing to the dog leg geometry.
However, once the oxygen is injected at the upper level, a low conversion of unwanted species was predicted in the whole off-gas system. This was mainly due to a lower local temperature inside the reflux chamber which lead to a lower conversion rate of CO–carbon mixture and the unreacted portion enters the low-temperature regions and ultimately reach points where temperature falls under auto-ignition point of CO with no further conversion. By observing this result, it was concluded that the reflux chamber performance plays an important role in the whole off-gas system performance.
The mentioned issue with the upper injection design could be addressed by increasing wall thickness inside the reflux chamber. This simple modification will reduce the heat loss through the walls and increases the local temperature across the reflux chamber. Higher temperature leads to an increased rate of CO and carbon conversion inside the reflux chamber and consequently lower emission of these species into those regions with low temperature.