
Abstract
In this work, a time-dependent thermodynamic AOD process model, TimeAOD3™, is proposed to be used as a prediction model at practice to reach the desired nitrogen level to lower the cost and carbon footprint. The model is developed from an existing model and integrated with Thermo-Calc®. The modelling results suggest a fairly good prediction when compared with production-scale heats. The relative error of dissolved nitrogen content during and after decarburisation is −0.05 < RE < 1.36 and −0.23 < RE < 0.29, respectively. Besides, most modelled dissolved N% are higher than the measurement during decarburisation. This is probably owing to the formation of high turbulence flow and CO gas bubble which can flush the dissolved nitrogen out of the bath at practice. Moreover, dissolved C%, Cr% in bath and Cr2O3%, CaO%, MgO% in slag, as well as bath temperature are also compared and studied.
Introduction
The Argon Oxygen Decarburisation (AOD) steelmaking process is one of the main processes in stainless steelmaking. Liquid metal that contains mainly iron, carbon, chromium and nickel from an Electric Arc Furnace (EAF) is refined in the AOD converter at temperatures between 1500°C and 1750°C. The AOD process normally consists of the following three stages: decarburisation, reduction and desulphurisation.
At the decarburisation stage, a mixture of oxygen gas and argon or nitrogen gas is blown into the melt to lower the carbon content in the melt. Similar to the oxidation of carbon, the other dissolved elements such as Si, Mn and Cr are also partly oxidised during the decarburisation stage. The chromium oxidation rate is lowered by decreasing the partial pressure of CO through controlling the oxygen to argon or nitrogen gas ratio. Once the carbon content in the melt reaches the target value, the decarburisation stage is completed.
During the reduction stage of the AOD process, reduction agent such as FeSi or aluminium is added to recover chromium from the slag. In order to protect the refractory lining, lime is added to maintain a slag basicity (CaO%/SiO2%) of 1.5–1.7 [1]. If silicon is used as the reduction agent, fluorspar is usually added to lower the slag’s viscosity to favour the kinetics of the reduction reaction. After removal of the reduced slag, more lime is added to facilitate a desulphurisation of the melt.
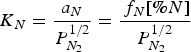
Other than being used as a dilution gas, nitrogen is also an important alloying element in stainless steel; which improves its corrosion resistance against, for instance, pitting corrosion. The content of nitrogen, together with chromium and molybdenum, can be used to calculate the Pitting Resistance Equivalent Number (PREN) which is an indicator of the pitting corrosion resistance of the stainless steel [2]. As a nickel substitute, the increased nitrogen content may lower the nickel material cost and lower the carbon footprint of stainless steel production. On the other hand, a nitrogen content above a specification can lead to an extra argon gas blowing to flush excess nitrogen which results in an increased production cost. Thus, it is of importance to have access to a reliable prediction model to perform an optimum operation practice to reach the desired nitrogen level.
Summary of AOD model from previous investigations.
aT: thermodynamic model; M: mixed model, (thermodynamic + kinetic); C: computational fluid dynamic model; P: Physical model
bThermo.: thermodynamic data; Lit.: literature; TC: Thermo-Calc software; HSC: HSC Chemistry software; FactSage: FactSage software
cD: Decarburisation; R: reduction; S: desulphurisation
d(BS): basic Fe + C + O + Cr.
eS: solid slag, L: liquid slag
fVerifi.: verification; N.S.: not specified.
gBD: bath diameter; BL: bubble location; BS: bubble size; Cstart: initial carbon concentration; OS: chromium oxide separation; CRE: carbon removal efficiency; CSA: carry-over slag amount; DC: design configurations; DR: decarburisation rate; GFR: gas flow rate; GHV: gas holdup value; GR: gas ratio; HL: heat loss; MA: melt analysis; MT: mixing time; MTR: mass transfer rate; NOT: number of tuyeres; OD: oxygen distribution; PCO: partial pressure of CO gas; PS: parameter study; RR: reduction rate; RSA: reaction surface area; SA: slag analysis; SB: slag basicity; SD: sulphur distribution; SDS: slag droplet size; SF: slag fraction; SSA: solid slag amount; SV: slip velocity; T: temperature; Tstart: start temperature; TP: top pressure; V: velocity;


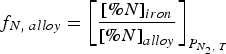
Summary of studies on solubility of nitrogen in the melt.
N.S.: not specified
To the best of the author's knowledge, there is no published model that can predict the nitrogen behaviour during the entire AOD process in a system consisting of gas, liquid metal, solid slag and liquid slag. In the present work, a time-dependent thermodynamic AOD process model was developed to study the nitrogen behaviour during AOD process. The model system involves equilibrium multiphases such as gas, liquid metal, liquid slag and solid slag. Furthermore, the model is divided into decarburisation, reduction and desulphurisation stages, with consideration of material additions, multiple slag phases and slag removal. The focus is to model the nitrogen content of the liquid steel during the entire AOD process. However, the study of nitrogen cannot be completely separated from other elements owing to their interactions. Thus, the current work aims to investigate the changes of bath temperature, metal and slag chemical composition during the AOD process as a function of processing time, and to compare the calculation results with data from industrial trials in order to verify the model.
Thermodynamic modelling
Description of the AOD model
In this study, the AOD modelling work has been carried out by using an existing AOD model, TimeAOD2™ [15], and integrating it with the computational thermodynamic software Thermo-Calc® (version 2021a) [35] through using the TQ-interface to create a new model TimeAOD3™ [36]. The AOD converter is modelled as a homogenous equilibrium reactor and the process equilibrium calculations are time step based. The equilibrium content of steel, slag and gas was calculated with Thermo-Calc® and using the TCOX10.1 database, which contains thermodynamic data of all the typical phases relevant for secondary steelmaking such as liquid phase, oxide phase, sulphide phase and gas phase. Also, the database can handle nitrogen in the system [36]. The equilibrium computations will suggest the most favourable phases based on the basis of the minimisation of Gibbs free energy.
The modelling of the AOD process requires the following input data: The weight and composition of the molten metal and carry-over slag charged in an AOD converter. The initial bath temperature. Gas flow rates and gas ratios (O2: dilution gas) during different AOD stages (decarburisation, reduction, desulphurisation). The time for material additions, material analysis and added amount in the converter.
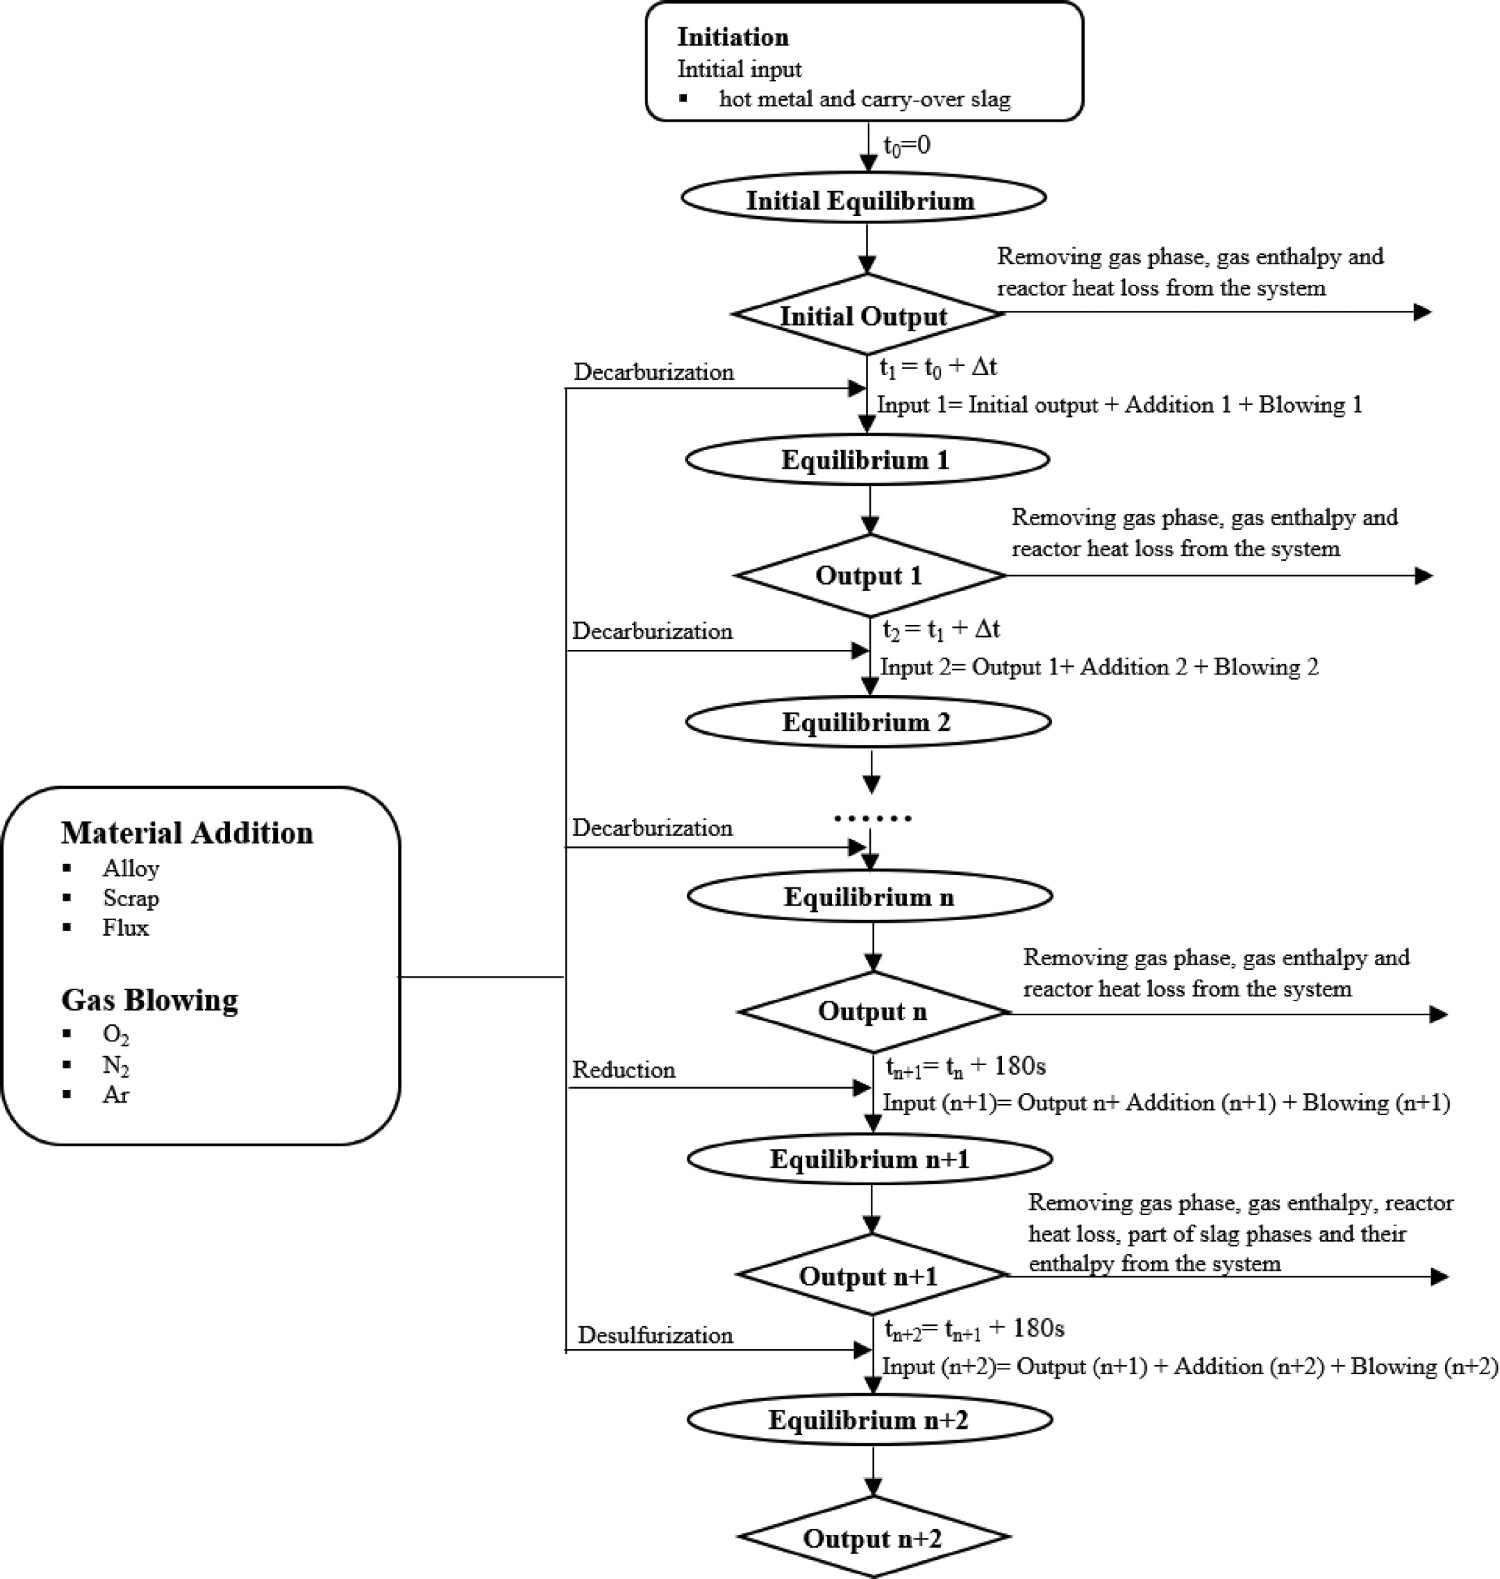
Figure 1 illustrates the logic of this process model. An initial equilibrium calculation (t0
= 0 s) is performed with the incoming molten metal and carry-over slag. The next equilibrium calculation is subsequently carried out using the outputs from the initial equilibrium calculation by considering gases and heat losses leaving the modelled system. Thereafter, added materials and gases within a time step (0 ∼ 0 + Δt) are included in the system. The time step Δt is typically a few seconds. These time steps are then repeated till the end of the AOD process. Specifically, the reduction and desulphurisation stages in the model are handled as a fixed one-step calculation each where the time step length is 180 s. The following assumptions have been made to simplify the model: The whole AOD system is assumed to be homogenous and to be in an equilibrium stable. The system is defined using the following elements: Fe, C, Si, Mn, S, Cr, Ni, Mo, N, Ti, Al, V, W, O. The model is taking pressure and temperature into account. The total pressure and temperature are assumed to be representative of the whole system at a given time. To solve the problem of Thermo-Calc® convergence, some not usually present phases are initially set to suspend and then dormant state during the calculation. Once reaching a positive driving force the dormant phase is set as an entered state in the next calculation. If no solution could be found, the total gas pressure was assumed to increase by 25 Pa until a solution could be found. After the reduction stage, most slag is tapped from the converter. The removal proportion of solid and liquid slag phase is assumed the same proportion before slag removal. Material additions are split between time steps with equal masses during the pre-defined dissolve time. The modelled slag phases assume that the element (Si, Cr, Al, Mn, Mo, Ni, V, Fe, etc.) will form the typical oxides (SiO2, Cr2O3, Al2O3, MnO, NiO, MoO3, NiO, V2O5, FeO). Heat loss from radiation (Qradiation
) and convection (Qconvection
) is estimated based on calculated bath temperature (T), given radiation (Cradiation
) and given convection (Cconvection
) heat loss parameters by Equations (4) and (5): If not specified, the incoming temperature of material additions and injected gas are assumed to be 298.15 K. Charged solid material enthalpies are calculated with Equations (6)–(8). An ideal mixture is assumed, which means the mixing enthalpy is zero:
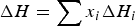
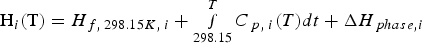
where ΔH is the enthalpy change of the material. xi
represents the molar fraction of the pure compound i (i = Fe, Cr, CaO, MgO, etc.) in the material. Here, Hi (T) and Hf,298.15, i
represent the enthalpy under the temperature of T and the enthalpy of formation from the pure compound i, respectively. Furthermore, the variable ΔHphase,i
is the enthalpy change of phase transition and Cp,i
is the specific heat capacity of the pure compound i and it is temperature dependent. In Equation (8), heat capacity coefficients a, b, c and d are dependent on the pure compound i. Thermodynamic data such as Hf,298.15,
ΔHphase,i
and heat capacity coefficients are taken from the literatures [37,38].


Industrial practice
The model has been applied to the industrial practice of two AOD converters in Sweden and tested on data used to produce two duplex stainless steel grades, EN 1.4410 (25%Cr, 7%Ni, 4%Mo, 0.27%N) and EN 1.4462 (22%Cr, 5%Ni, 3%Mo, 0.17%N), to examine the model’s predictive performance. The modelling results were compared with measurements from samples obtained from the industrial operation. The verification is based on the steel samples, slag samples and temperature measurements taken during AOD processes. Five samplings were planned for each heat, according to the following schedule:
Sample No. 1: after 1st decarburisation step.
Sample No. 2: in the middle of decarburisation stage.
Sample No. 3: near the end of decarburisation stage.
Sample No. 4: after reduction stage.
Sample No. 5: after desulphurisation stage. Logic flow diagram of the AOD modelling.
Summary of evaluated heats.
Plant-specified parameters during modelling.
Result and discussion
C% in the bath
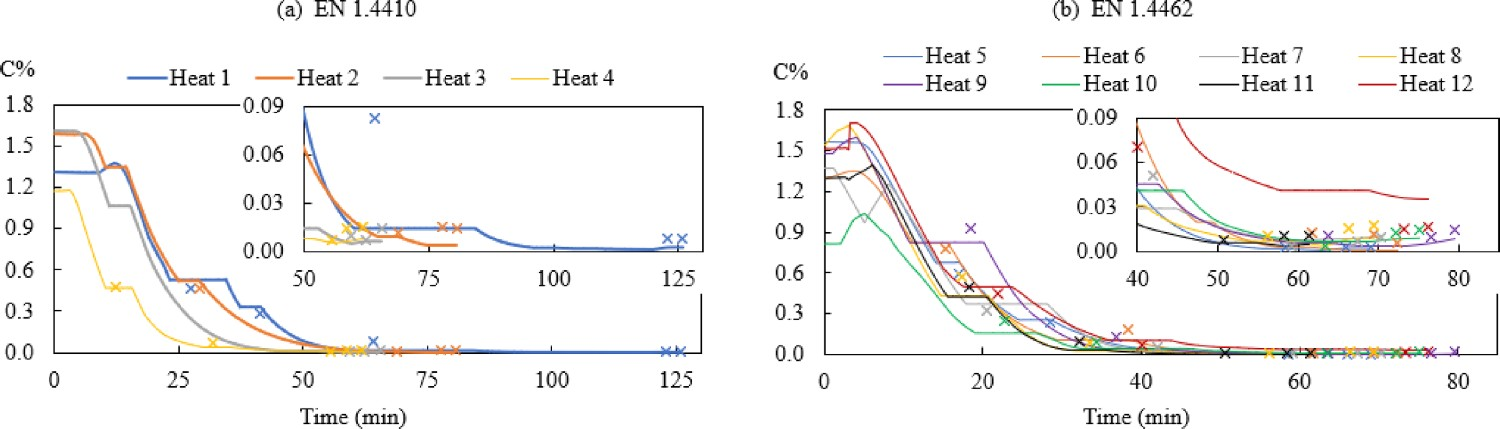
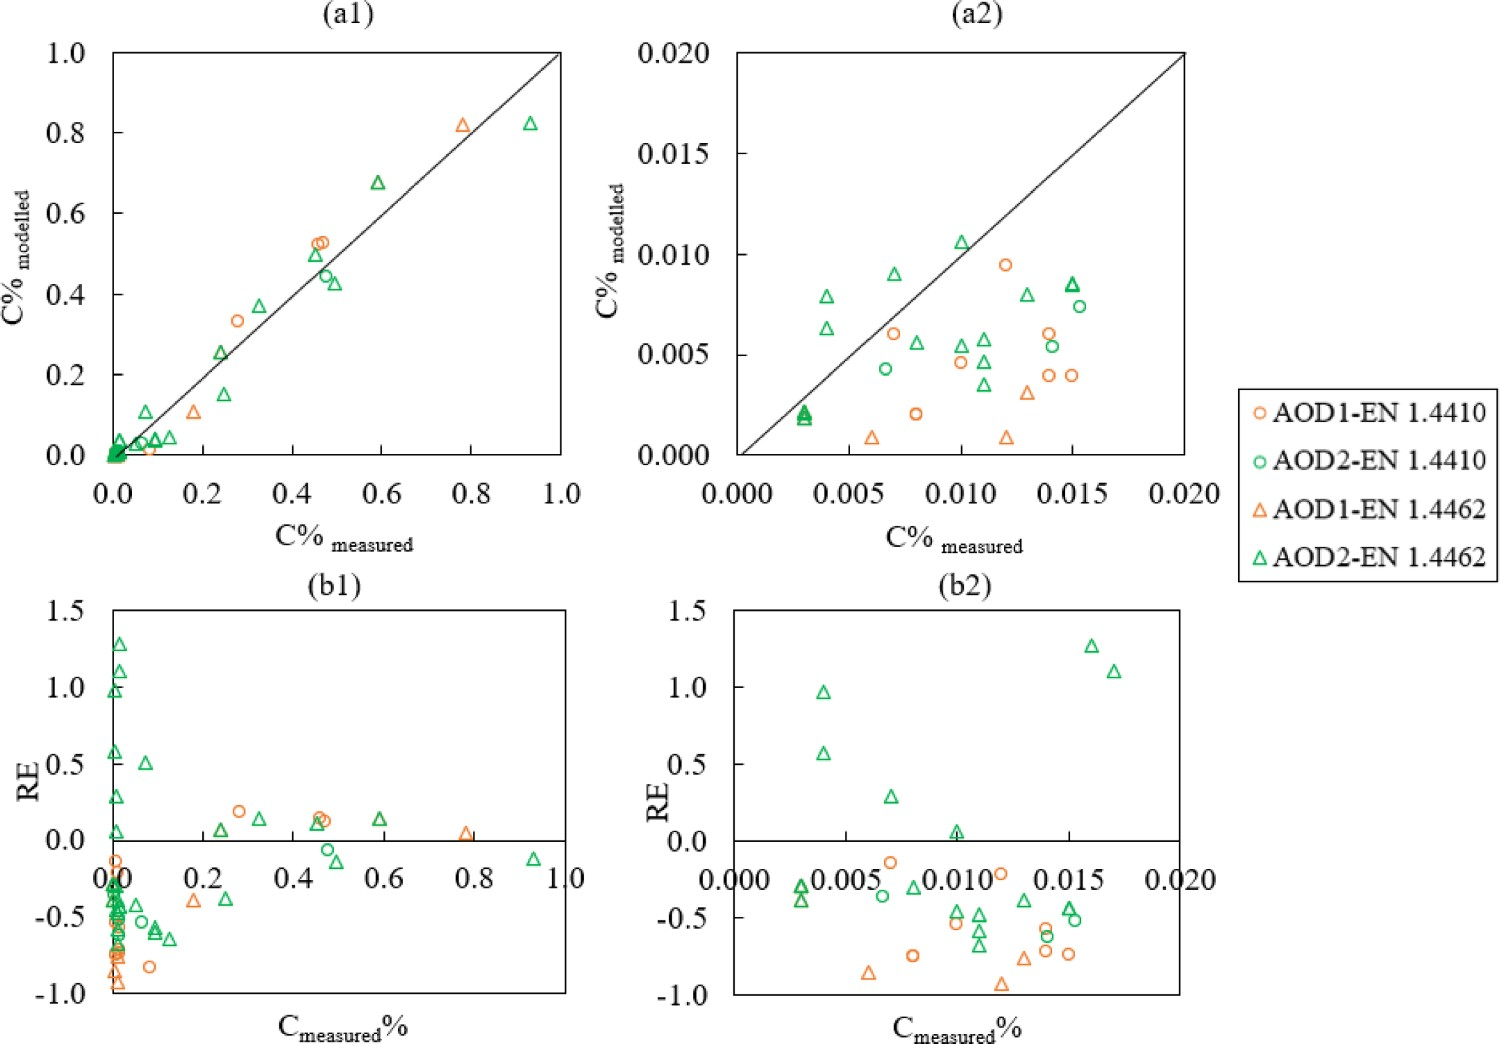
Figure 2 displays the changes of modelled and measured carbon contents during the AOD process. Figure 3 compares the modelled C% with measured C% and its relative error. The relative error (RE) is defined in Equation (9): Changes of C%modelled (–) and C%measured (×) in the bath for steel grade (a) EN 1.4410 and (b) EN 1.4462. Comparison of (a) C%modelled and C%measured and (b) Relative error (RE) of Cmodelled%.
Järvinen has proposed an AOD model [13] which predicted the locally varying conditions (temperature/pressure etc.). It predicts that the incoming oxygen is rapidly consumed near the gas nozzle (depth = 1.8 m), which means that most decarburisation reaction occurs close to the gas nozzle.
If a nozzle depth (h) of 1.5–2 m is assumed for the current work, suggested by the plant engineer in the study, together with a steel density (ρ
steel) of 7000 kg m−3. The total pressure P
tot acts on the gas bubbles at the distance of nozzle depth is calculated to reach values between 2 and 2.36 atm, according to Equation (10) [1]. This range agrees well with the total pressure during decarburisation used in the current modelling (1.8–2.5 atm, described in Table 4):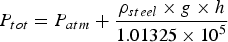
N% in the bath
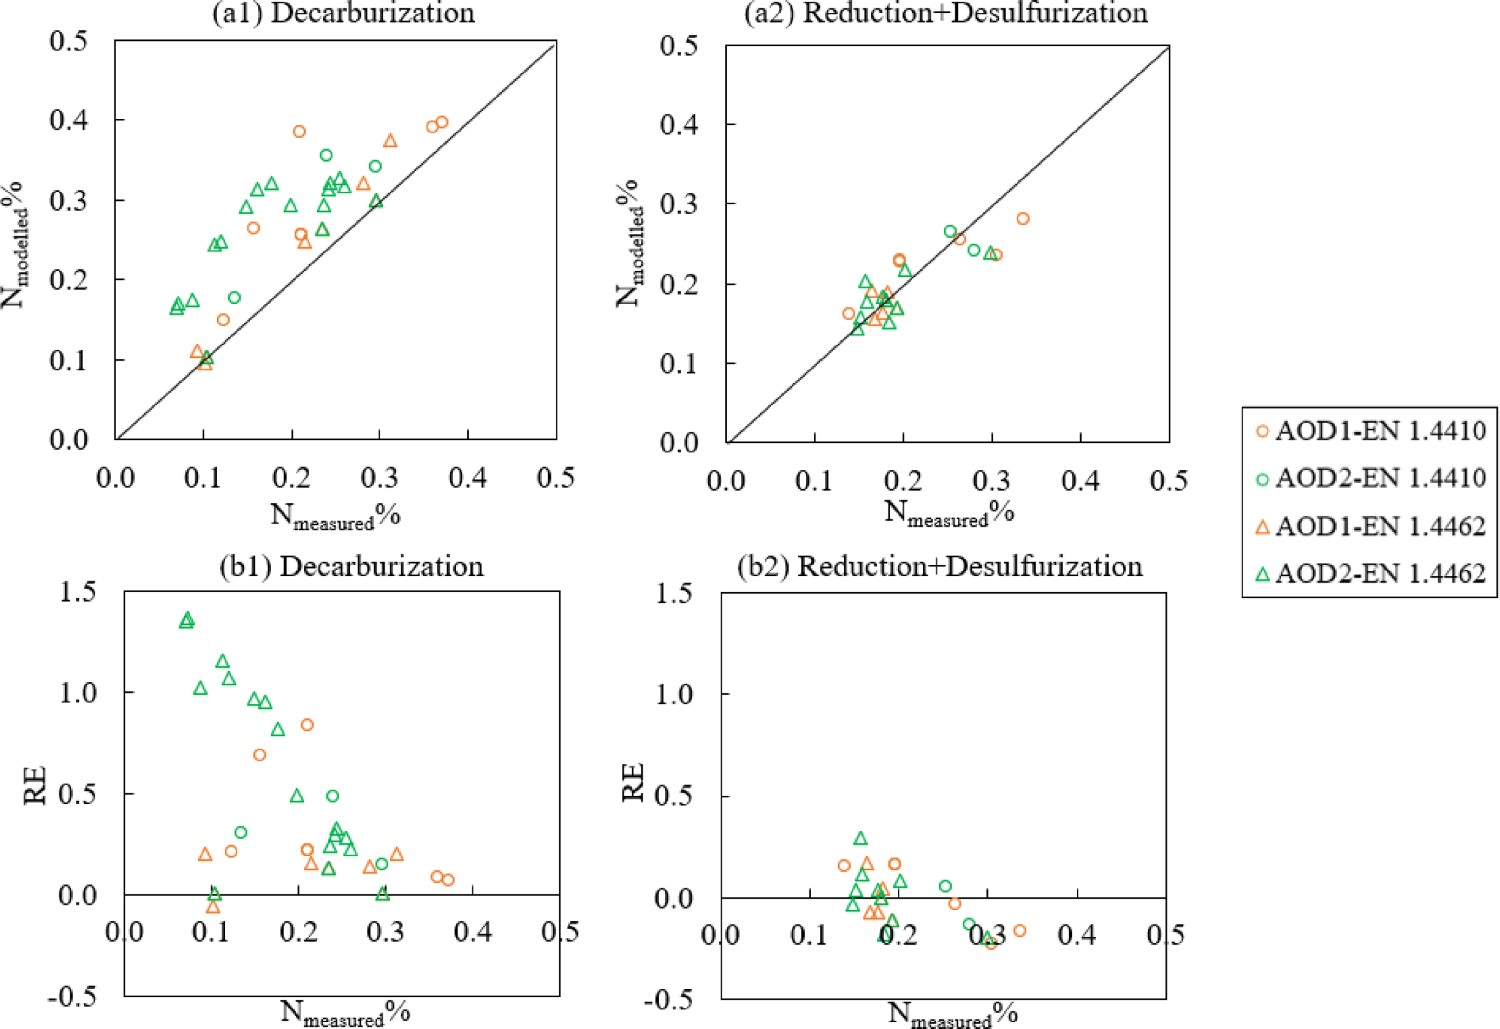
Figure 4 shows the changes in the nitrogen content during the AOD process. It can be observed from both steel grades that the predictions show a better agreement to the experimental data during the reduction and desulphurisation stages (the last two measured values in Figure 4) compared to the decarburisation stage. Figure 5b further reveals that the relative error of nitrogen after decarburisation (−0.23 < RE < 0.29) is smaller than that during decarburisation (−0.05 < RE < 1.36). Also, the positive value of RE in Figure 5(b1) indicated that the majority of the predicted nitrogen concentrations during decarburisation are higher than the measured N%. This can also be suggested through Figure 4. Changes of N%modelled (–) and N%measured (×) in the bath for steel grade (a) EN 1.4410 and (b) EN 1.4462. Comparison of (a) N%modelled and N%measured and (b) relative error of Nmodelled%.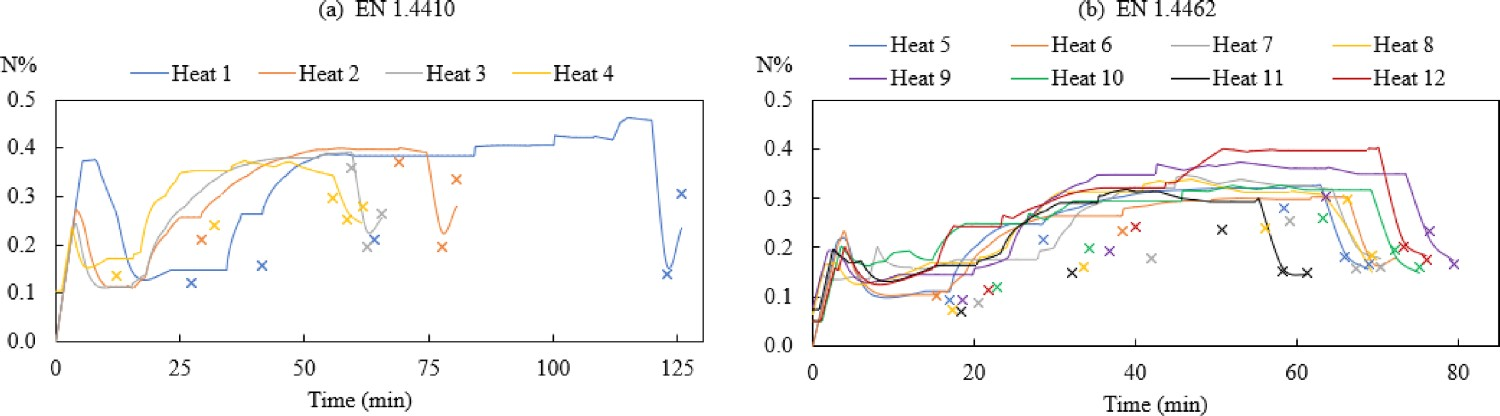
This indicates that the prediction of nitrogen behaviour is preferable to be predicted under a total pressure of 1atm (reduction + desulphurisation). In the real system, a total pressure of 1 atm corresponds to the position close to the bath surface where the ferrostatic pressure can be neglected and the total pressure is approximately the same as the surrounding atmospheric pressure.
In the simulation, it may be realistic to assume that the oxygen in the injected gases quickly reacts near the gas nozzle, while the remaining nitrogen gas continues to float upward towards the bath surface. It forms a gas–liquid two-phase flow. Once the gas reaches the bath surface, the nitrogen gas in the two-phase flow escapes from the melt to the gas. The high total pressure during decarburisation results in a higher partial pressure of nitrogen gas that can lead to a high dissolved nitrogen content in the steel during the decarburisation stage. In addition, the total gas flow rate during decarburisation is much higher than the reduction and desulphurisation stages. Thus, a higher turbulence flow can be expected during the decarburisation stage and the formed CO gas may act as a medium to flush away dissolved nitrogen from the steel [41]. The results suggest that nitrogen is probably governed by a lower total pressure during the decarburisation stage than the total pressure based on the ferrostatic pressure (i.e. 1.8−2.5 atm).
Bath temperature
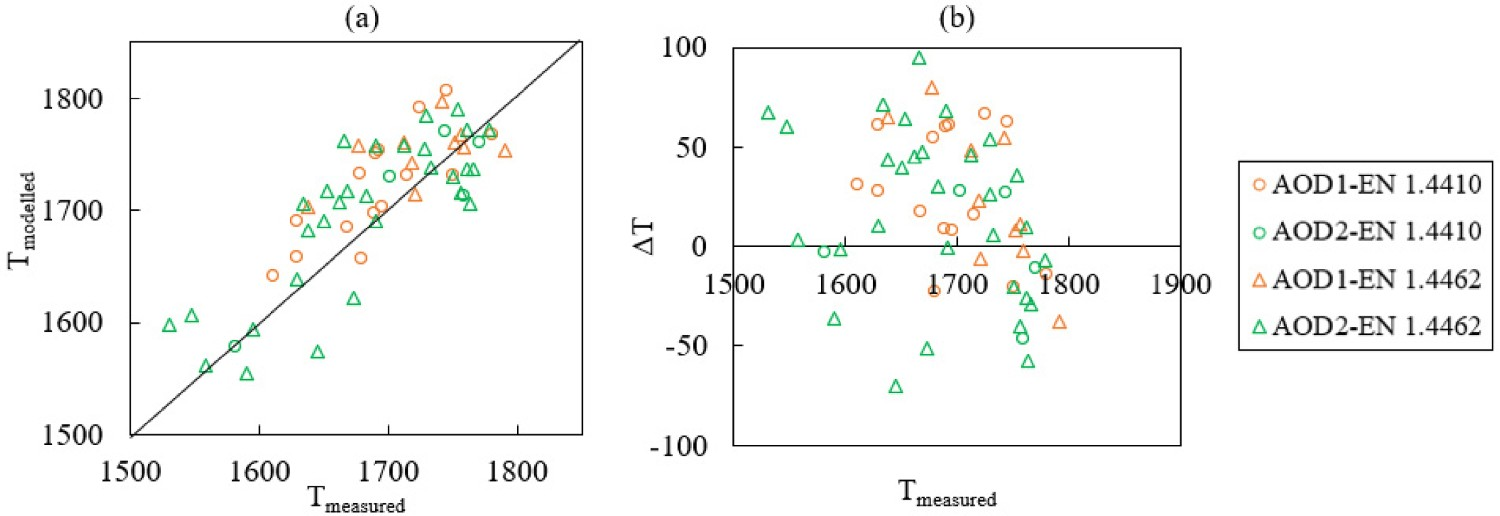
Figure 6 exhibits the changes of modelled and measured bath temperatures. In Figure 7, the modelled bath temperature is plotted against measured data. As suggested in Figure 7, the difference between modelled bath temperature and measurement i.e. the absolute error is between −70°C and 95°C. The temperature is adjusted partly by the heat loss parameters as stated in Table 4. The modelled bath temperature is likely to be improved by applying further adjustments to the heat transfer parameters. However, the modelling of heat transfer is rather complex. Specifically, it can be affected by different factors, such as the thickness of the refractory walls, material addition times, etc. which is outside the scope of this study. Changes of Tmodelled (–) and Tmeasured (×) in the bath for steel grade (a) EN 1.4410 and (b) EN 1.4462. Comparison of (a) T
modelled and T
measured and (b) Temperature difference ΔT (T
modelled –T
measured).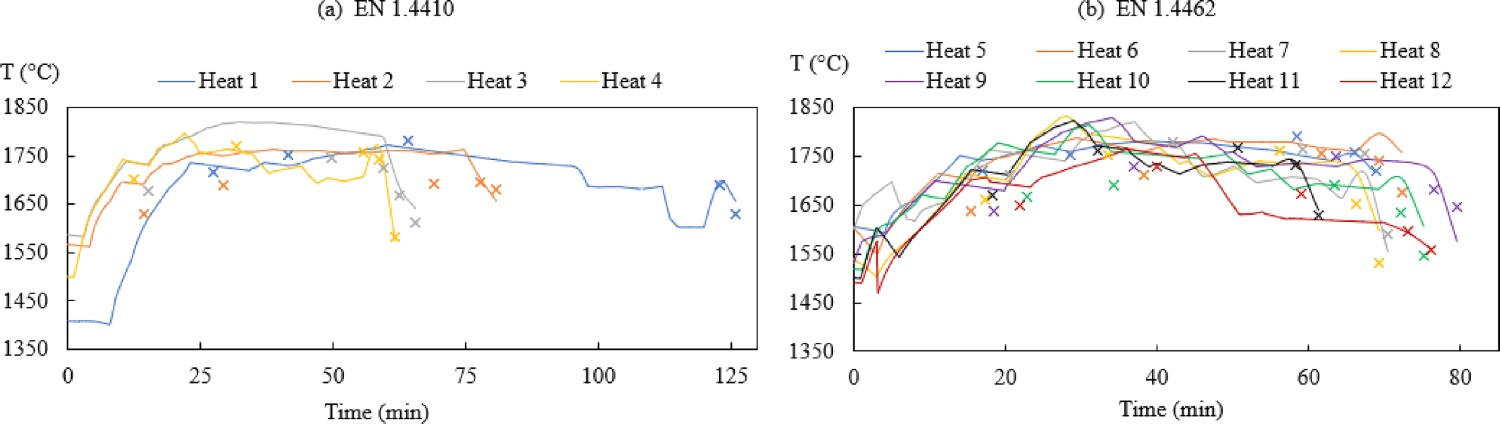
Cr% in the bath and Cr2O3% in the slag
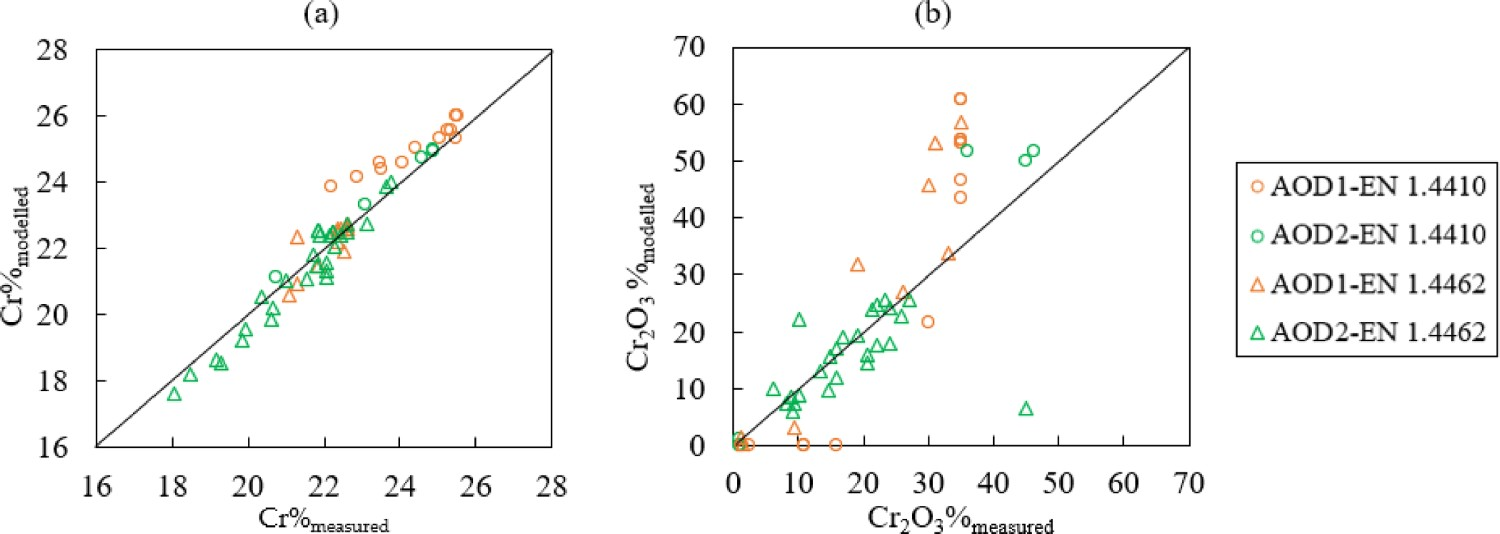
The modelled Cr% and Cr2O3% contents are compared to measurements and the results are presented in Figures 8 and 9. As shown in Figure 9(a), the model predicts the chromium concentration in the bath quite well compared to the measured data (−0.04 < RE < 0.07). However, the relative error of Cr2O3% is rather high (−0.99 < RE < 26.74). The highest deviation (RE = 26.74) appears in No. 2 slag sample of heat 9. In Figure 8, it is presented in purple colour at about 38 min and the measured Cr2O3% (1.5%) is very close to the bottom horizontal scale. Changes of Cr%modelled (–) and Cr%measured (×) in the bath, Cr2O3%modelled (–) and Cr2O3%measured (×) in the slag during AOD process for steel grade (a) EN 1.4410 and (b) EN 1.4462. Comparison of (a) Cr%modelled and Cr%measured and (b) Cr2O3%modelled and Cr2O3%measured.
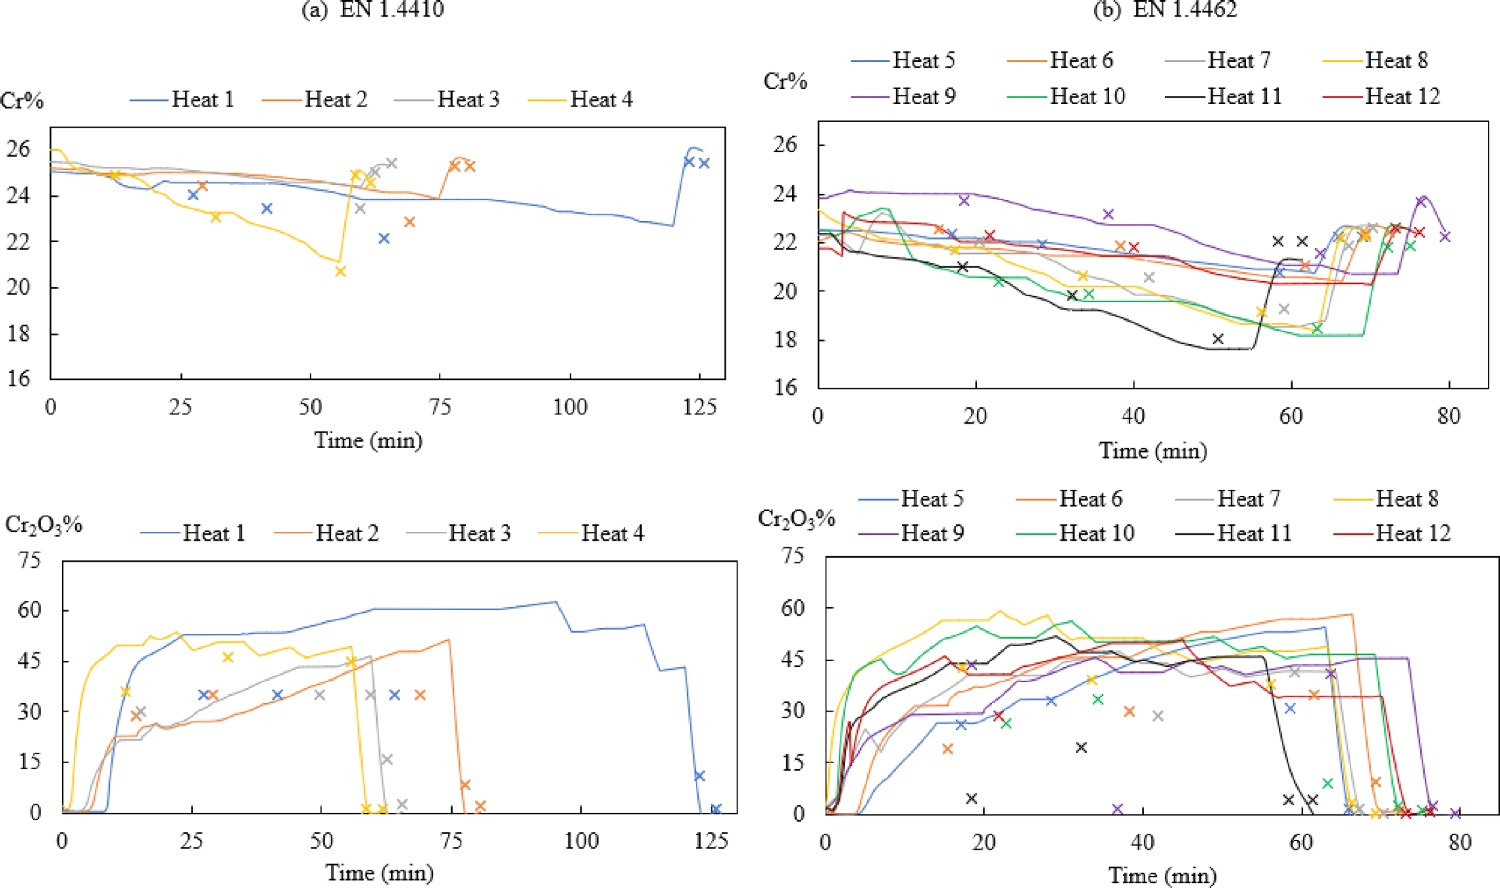
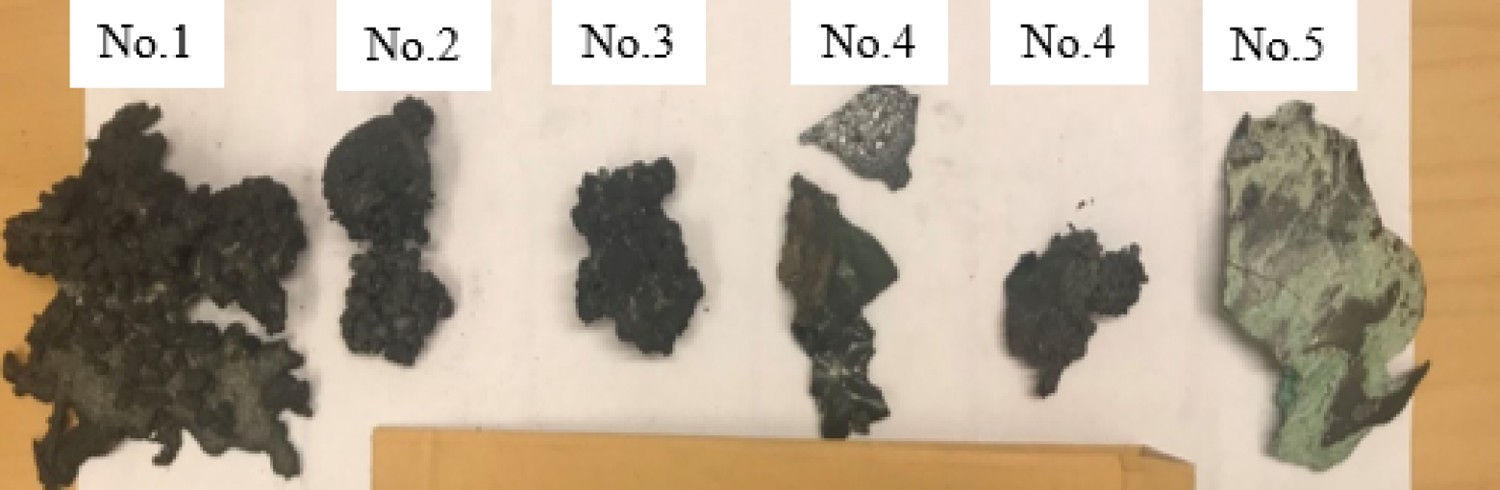
To further illustrate the difference between modelled and measured Cr2O3% in the slag, heat 4 in Figure 8 is selected as an example. Figure 10 presents the Cr2O3% value of heat 4 in liquid slag, solid slag (mass weighted average Cr2O3% of multiple solid slag phases) and total slag, as well as the measured Cr2O3% content. During the decarburisation stage, the slag contains both slag and liquid phases. The liquid slag phase is more homogenous than the solid slag phases. As shown in Figure 10, the calculated Cr2O3% value in solid slag (blue line) is higher than the calculated Cr2O3% in liquid slag (yellow line). The difference in measured Cr2O3% and modelled Cr2O3% is probably owing to the heterogeneous nature of the slag, which has a poor representation of mineralogical variability within a slag sample. Therefore, when taking a sample, the total Cr2O3% in slag will present a lower concentration if a larger fraction of liquid slag is included in the slag sample. Figure 11 exhibits the real slag samples taken from heat 4, mixed solid slag and liquid slag phases can be presenting during decarburisation (No. 1–No. 3). Cr2O3% in measurement and modelling of heat 4. Slag samples from heat 4 (No. 1: at the beginning of decarburisation; No. 2: in the middle of decarburisation; No. 3: at the end of decarburisation: No. 4: during reduction; No. 5: after desulphurisation).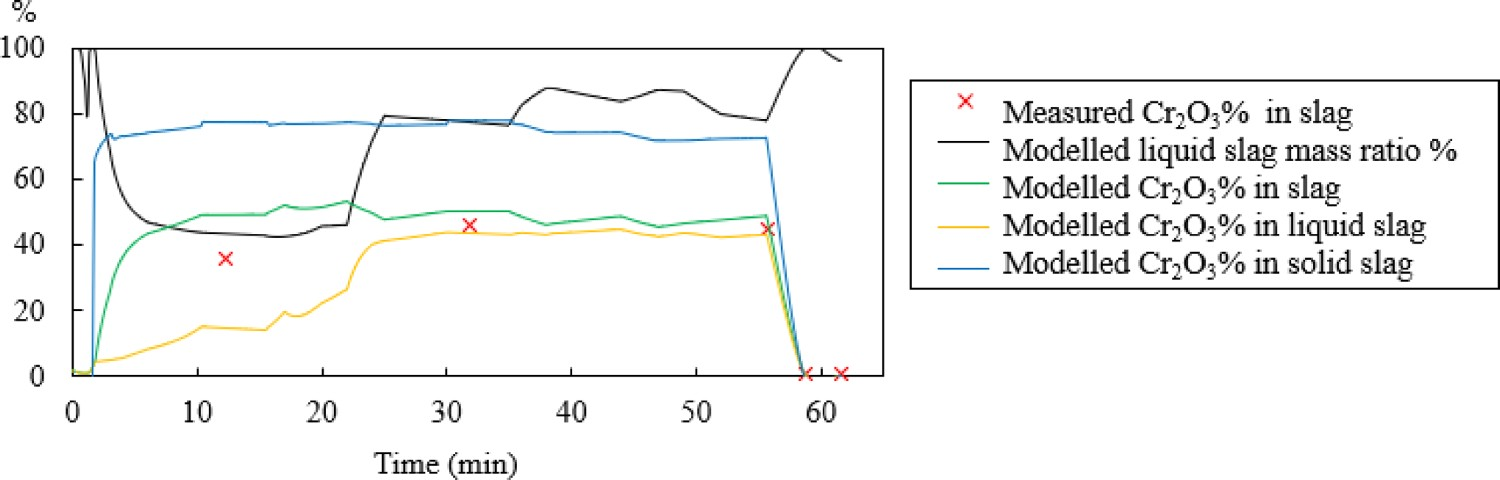
The calculated liquid slag mass ratio in Figure 10 (black line) is around 80% at the end of decarburisation (around 55 min). This seems not to agree so well with the observance in the plant where the majority slag ratio is occupied by the solid slag phases. One of the explanations is that a reaction layer, 2CaO·SiO2, is formed around the lime (CaO) in the metallurgical operation, which can limit the thermodynamic force of lime dissolution in the slag [42,43]. The presence of undissolved lime may explain the difference in the results compared to those predicted using the thermodynamic computation model. Besides, the plant observation through eyes sometimes is neither reliable owing to the formless nature of liquid slag and the top solid slag’s porous structure. These facts make a liquid slag to be present in a higher mass ratio, but which can hardly be seen through eyes. The mineralogy of slag varies greatly during the AOD process. In future work, it is necessary to use the XRD method to show how mineral phases in an AOD slag varies to have a better understanding about the characteristics of AOD slag.
Mass balance during 1st sampling in Heat 4.
CaO% and MgO% in the slag
The modelling comparison results of slag components CaO and MgO are presented in Figure 12. During decarburisation, some deviations can be observed between predicted and measured CaO and MgO values owing to the inhomogeneity of the decarburisation slag. The slags during reduction and desulphurisation stages containing mostly or only liquid slag, which will result in a better agreement between measurements and predicted in general. Besides, the difference between results can also be attributed to the assumption of the addition time and the dissolving time during modelling, which may differ from an industrial condition. However, some trends, like an increase of CaO and a decrease of MgO content in the slag during the AOD process, are predicted quite well. Changes of modelling (–) and measurement (×) values for CaO% and MgO% in the slag during AOD process for steel grade (a) EN 1.4410 and (b) EN 1.4462.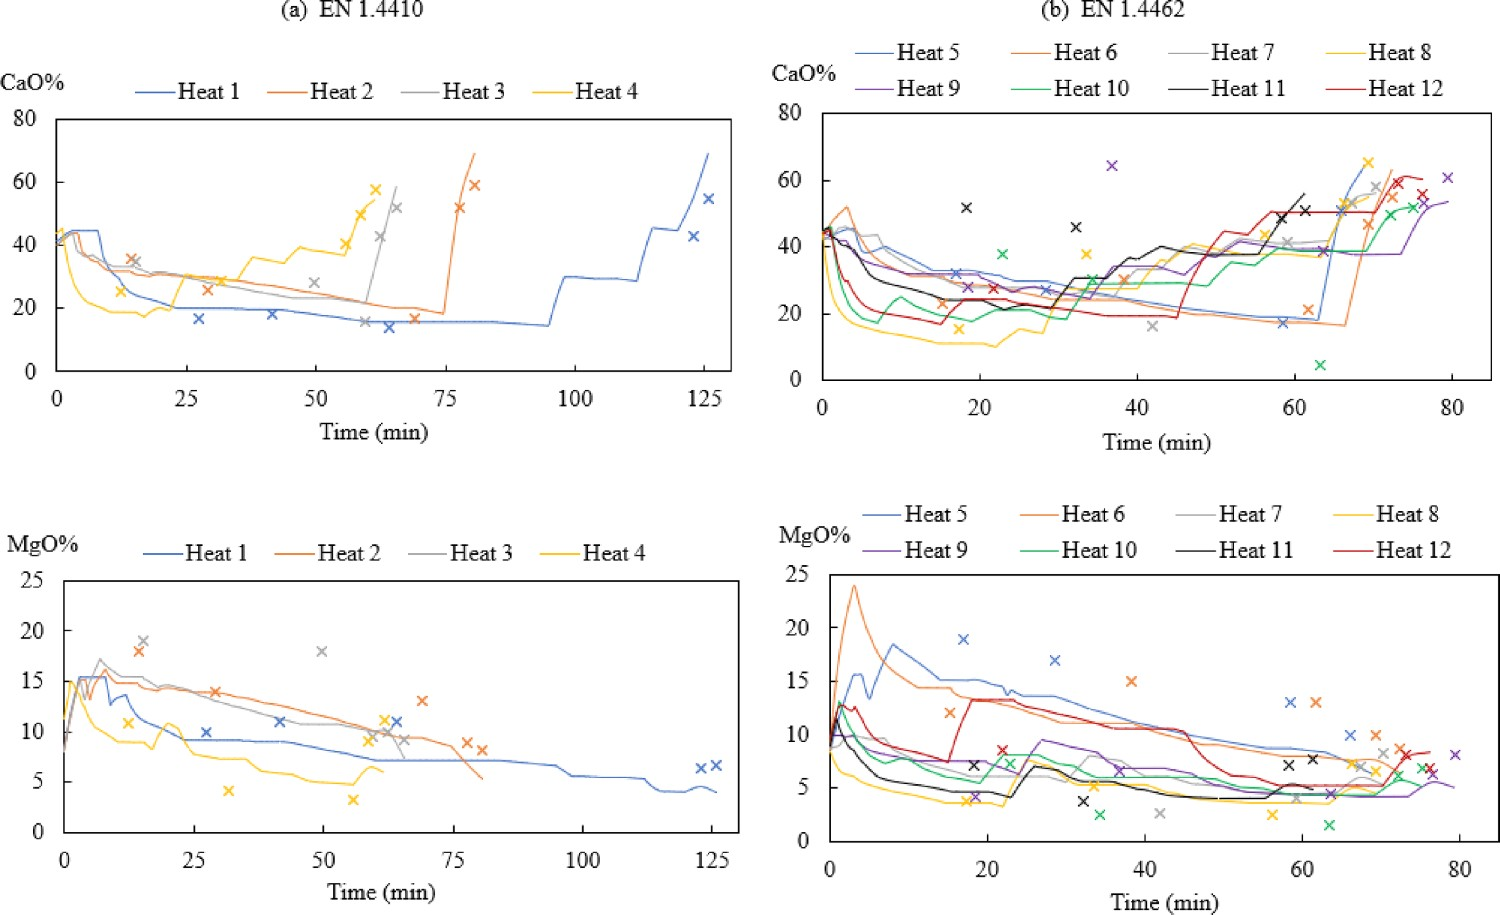
Conclusions
In the current work, a developed AOD model has been developed based on thermodynamic equilibrium calculations to predict the dissolved nitrogen content and other metal/slag compositions. It has been tested on process data of two duplex steel grades from 12 production-scale heats. The following conclusions can be drawn from the comparison between the predicted and measured values: The minor deviation of C content (−0.39 < RE < 0.18) at the beginning of decarburisation shows that the reactions have reached an equilibrium state. The main variance was observed in the low-C concentration range (C < 0.02%), which has a relative error between −0.92 and 1.28. This is probably owing to the role of kinetic mechanisms when the carbon level is low in the system. The model tends to predict a lower C concentration compared to the measured value when the C level is low, and this can be explained by kinetic mechanisms, and in the modelling, it is assumed that the system is homogeneous. The relative error of nitrogen after decarburisation (−0.23 < RE < 0.29) is smaller than that during decarburisation (−0.05 < RE < 1.36). The majority of modelled N% values in comparison to the measured N% value is higher during decarburisation. This suggests that nitrogen is probably governed by a lower total pressure during the decarburisation stage than the total pressure based on the ferrostatic pressure (i.e. 1.8–2.5 atm). In the real situation, the high turbulence together with formed CO gas during decarburisation can flush the dissolved N out of the bath which may result in a lower nitrogen content than the modelled N control. The absolute error of predicted bath temperature and measurement is between −70°C and 95 °C. The model predicts the chromium concentration in the bath quite well compared to the measured data (−0.04 < RE < 0.07). The deviation of Cr2O3%, CaO% and MgO% content in the slag during decarburisation mostly arise from the inhomogeneities of the slag during the decarburisation stage.
In summary, the model is capable of predicting the changes of the dissolved nitrogen content during the entire AOD process of the full-scale heats. One major feature of the model is its application in performing equilibrium computations for multiple phases (liquid metal, liquid slag, solid slag and gas phases) through the AOD process. The model could be used to investigate the influence of parameters on the AOD process and to establish an optimal operational practice. Meanwhile, there are still a few open questions and modifications of the model to be solved, such as the implementation of different total gas pressures for equilibrium reaction of N and C, considering the kinetic mechanism in the model, as well as determining the mineralogy of AOD slags by using XRD.
Author contributions
Investigation, W.W., J.G., P.B.S; Methodology, W.W., J.G., P.B.S; Software and Thermo-Calc integration: J.G.; Data collection, W.W.; Modelling: W.W.; Calibration and validation: W.W.; Writing-original draft preparation, W.W.; Writing-review and editing: P.B.S., J.G., R.G. A.T.; P.G.J.; Supervision: P.B.S., J.G., A.T.; Project administration: R.G.
Footnotes
Acknowledgements
This work is completed during KVÄVESTYR project (nitrogen control during production of stainless steel), financial supported by Jernkontoret (Swedish iron and steel organisation) and Vinnova. The authors would like to thank the project partners’ support from KTH, SMT Sandviken, Outokumpu Avesta, Swerim AB and Kobolde &Partners AB. Besides, the authors are grateful for the software support of Thermo-Calc ® from Thermo-Calc, AB.
Disclosure statement
No potential conflict of interest was reported by the author(s).