
Abstract
The work was aimed at analysing the effect of boron on austenite grain size of low-alloy cast steels during austenitization in the range between 850°C and 1200°C. The effect of boron was investigated in presence of other alloying additives: chromium, vanadium and titanium. Eight melts with various chemical compositions were subjected to heat treatment started from soaking at eight different temperatures. After quenching, former austenite grain size was determined by a method of quantitative metallography. Influence of boron on austenite grain size, especially in presence of other alloying elements, was evaluated by one-way variance analysis ANOVA and the Kruskal–Wallis tests. The analyses showed a significant influence of boron on austenite grain size, which can be compensated by alloying elements creating stable carbides and nitrides.
Introduction
Austenite grain size is one of the basic factors affecting hardenability of steel, as well as its other mechanical properties after heat treatment, like tensile strength, hardness and ductility [1–5]. The parameters affecting grain growth are temperature and time of austenitization, while temperature is of a higher importance [6]. The obstacles inhibiting grain growth are mainly precipitates of aluminium nitride AlN that dissolves at temperatures within 950–1000°C [7]. This is because aluminium added to steel as a deoxidizer shows also high affinity for nitrogen.
In modern micro-alloy and low-alloy steels with higher abrasive-wear resistance, boron is one of the most important microadditives, significantly improving hardenability. However, it was found in several works [8,9] that boron is conducive to austenite grain growth and reduces the grain-growth start temperature. It is assumed that this effect is related to the fact that content of AlN particles decreases with increasing content of BN particles that inhibit grain-growth less effectively. This adverse effect of boron is compensated by suitable additions of nitride-forming elements that prevent creation of boron nitrides, additionally increasing effectiveness of boron as the hardenability intensifier. In most micro-alloy and low-alloy constructional steels, percentages of microadditions of Ti, Nb and V introduced individually or as a whole do not exceed 0.15% [10]. These elements show high affinity for carbon and nitrogen, creating very stable carbides and nitrides. However, improperly selected heat-treatment temperature can result in dissolution of carbides and nitrides blocking grain growth [7]. More stable carbides can dissolve at temperatures much higher than Ac3. In some steels, these carbides are in equilibrium with austenite even at temperatures slightly lower than the solidus temperature. The carbides most sparingly soluble in austenite are those of V, Ti, Nb, Ta and Zr, being MC type compounds with regular lattice. The most readily soluble are M2C and MC type carbides with hexagonal lattice, i.e. W and Mo carbides. The complex carbide M23C6 dissolves very easily, unlike the M6C carbide that exists in equilibrium with austenite up to the very high temperature [11]. On the other hand, nitrides are mostly internodal phases type MN or M2N. In alloyed steels, they are mostly silicon nitrides and boron nitrides [11]. Niobium nitrides and vanadium nitrides play also an important role. Furthermore, a microaddition of vanadium strongly influences mechanical parameters of steel by precipitates VN and V(C,N). Stabilization of austenite is most strongly affected by titanium nitrides TiN that are partially formed during solidification in interdendritic spaces and next in austenite, also as Ti(C,N). With absence of nitrogen, mostly TiC carbides appear in the structure [12]. Grain size of austenite is also limited by carbonitrides type M(C,N) and M2(C,N) that are created due to isomorphicity and mutual solubility of the nitrides and carbides type MN and MC or M2N and M2C [11].
Effect of boron on austenite grain size, especially together with such microadditives as vanadium and titanium, is the particularly important issue, because micro-alloy and low-alloy steels with increased abrasive-wear resistance are often subjected by their users to heat treatment connected, for example, with bonding these materials in a process like welding. However, heat treatment of these steels should be planned and executed carefully, since their special properties could be lost as a result of improperly carried-out heat treatment [13]. In literature, analyses of austenite grain growth can be found, as well as attempts to create a model that would describe grain growth in micro-alloy and low-alloy steels [14–19]. However, there are no available comprehensive data on influence of boron accompanied by other alloying additives and microadditives on dispersion of microstructure of steel. Therefore, this work is aimed at analysing and evaluating effect of boron on austenite grain size, especially in presence of other alloying elements.
Materials and methods
The material for the research consisted of 8 melts with various chemical compositions, prepared in the Foundry Research Institute in Krakow. Moulds were made of bentonite moulding compound using wooden patterns of the agreed shape. The melts with determined chemical compositions were prepared in an induction medium frequency furnace Radyne 100 kW with capacity 120 kg and with neutral lining. Mass of charge was each time ca. 110 kg. Over the crucible, a kind of hood was installed, where argon gas was blown-in to maintain the assumed chemical composition. A charge consisted of ARMCO iron, scrap of low-carbon steel, alloying additives FeMn 80, FeCr 60, Mn and a carbonizer. Depending on the selected chemical composition, the following materials were also added: FeB 8, FeTi 25, FeV 70, Al and Ti. When the charge was molten and the melt reached the set temperature, a sample was taken for chemical analysis. If necessary, chemical composition was corrected. The components that could burn-out were added just before casting. The molten metal was poured to a preheated ladle, temperature was measured and a sample was taken for final chemical analysis. Temperature of pouring the moulds was 1540°C. After cooling-down and cleaning, sprues were removed from the ingots. Ultrasound inspections made with use of a defectoscope CUD 9900 No. 04002 showed no disqualifying defects in the examined ingots.
Chemical composition of analysed melts.
The specimens taken from the ingots were subjected to full annealing at 1200°C and next to normalizing at 900°C. In order to evaluate influence of austenitization temperature on austenite grain size, the specimens were soaked at the temperatures 850°C, 900°C, 950°C, 1000°C, 1050°C, 1100°C, 1150°C and 1200°C for 20 min, quenched in water and next tempered at 250°C for 30 min. Heat treatment was carried-out under protective atmosphere of argon in a conventional furnace FCF 12 SHM/R with a gas-tight retort.
To reveal boundaries of former austenite grains, the prepared metallographic sections were etched with the reagent 81 (2 g of picric acid, 1 g of sodium tridecylbeznzene sulphonate and 100 ml H2O) acc. to ASTM E407, at ca. 55°C. Microstructures were observed with a light microscope Nikon ECLIPSE MA200. Former austenite grain size in representative areas was determined quantitatively with use of the program ImageJ. To that end, cross-section areas (a) of 100 randomly selected grains were determined by the planimetric method and then diameter (d) of a plain grain was determined as 

Influence of boron on austenite grain size was evaluated by means of one-way variance analysis ANOVA and the non-parametric Kruskal–Wallis test. The assigned code value was ‘1’ for boron concentration over 0.0008% and ‘0’ for boron concentration 0.0008% or below. Normality of the distributions was verified with the Kolmogorov–Smirnov test and homogeneity of variances – with the Brown–Forsythe test.
Moreover, Brinell hardness of the quenched not tempered specimens was measured according to EN ISO 6506-1:2014-12 with a hardness tester Zwick/Roell ZHU, using the ball dia. 2.5 mm under the load of 187.5 kg for 15 s.
Results
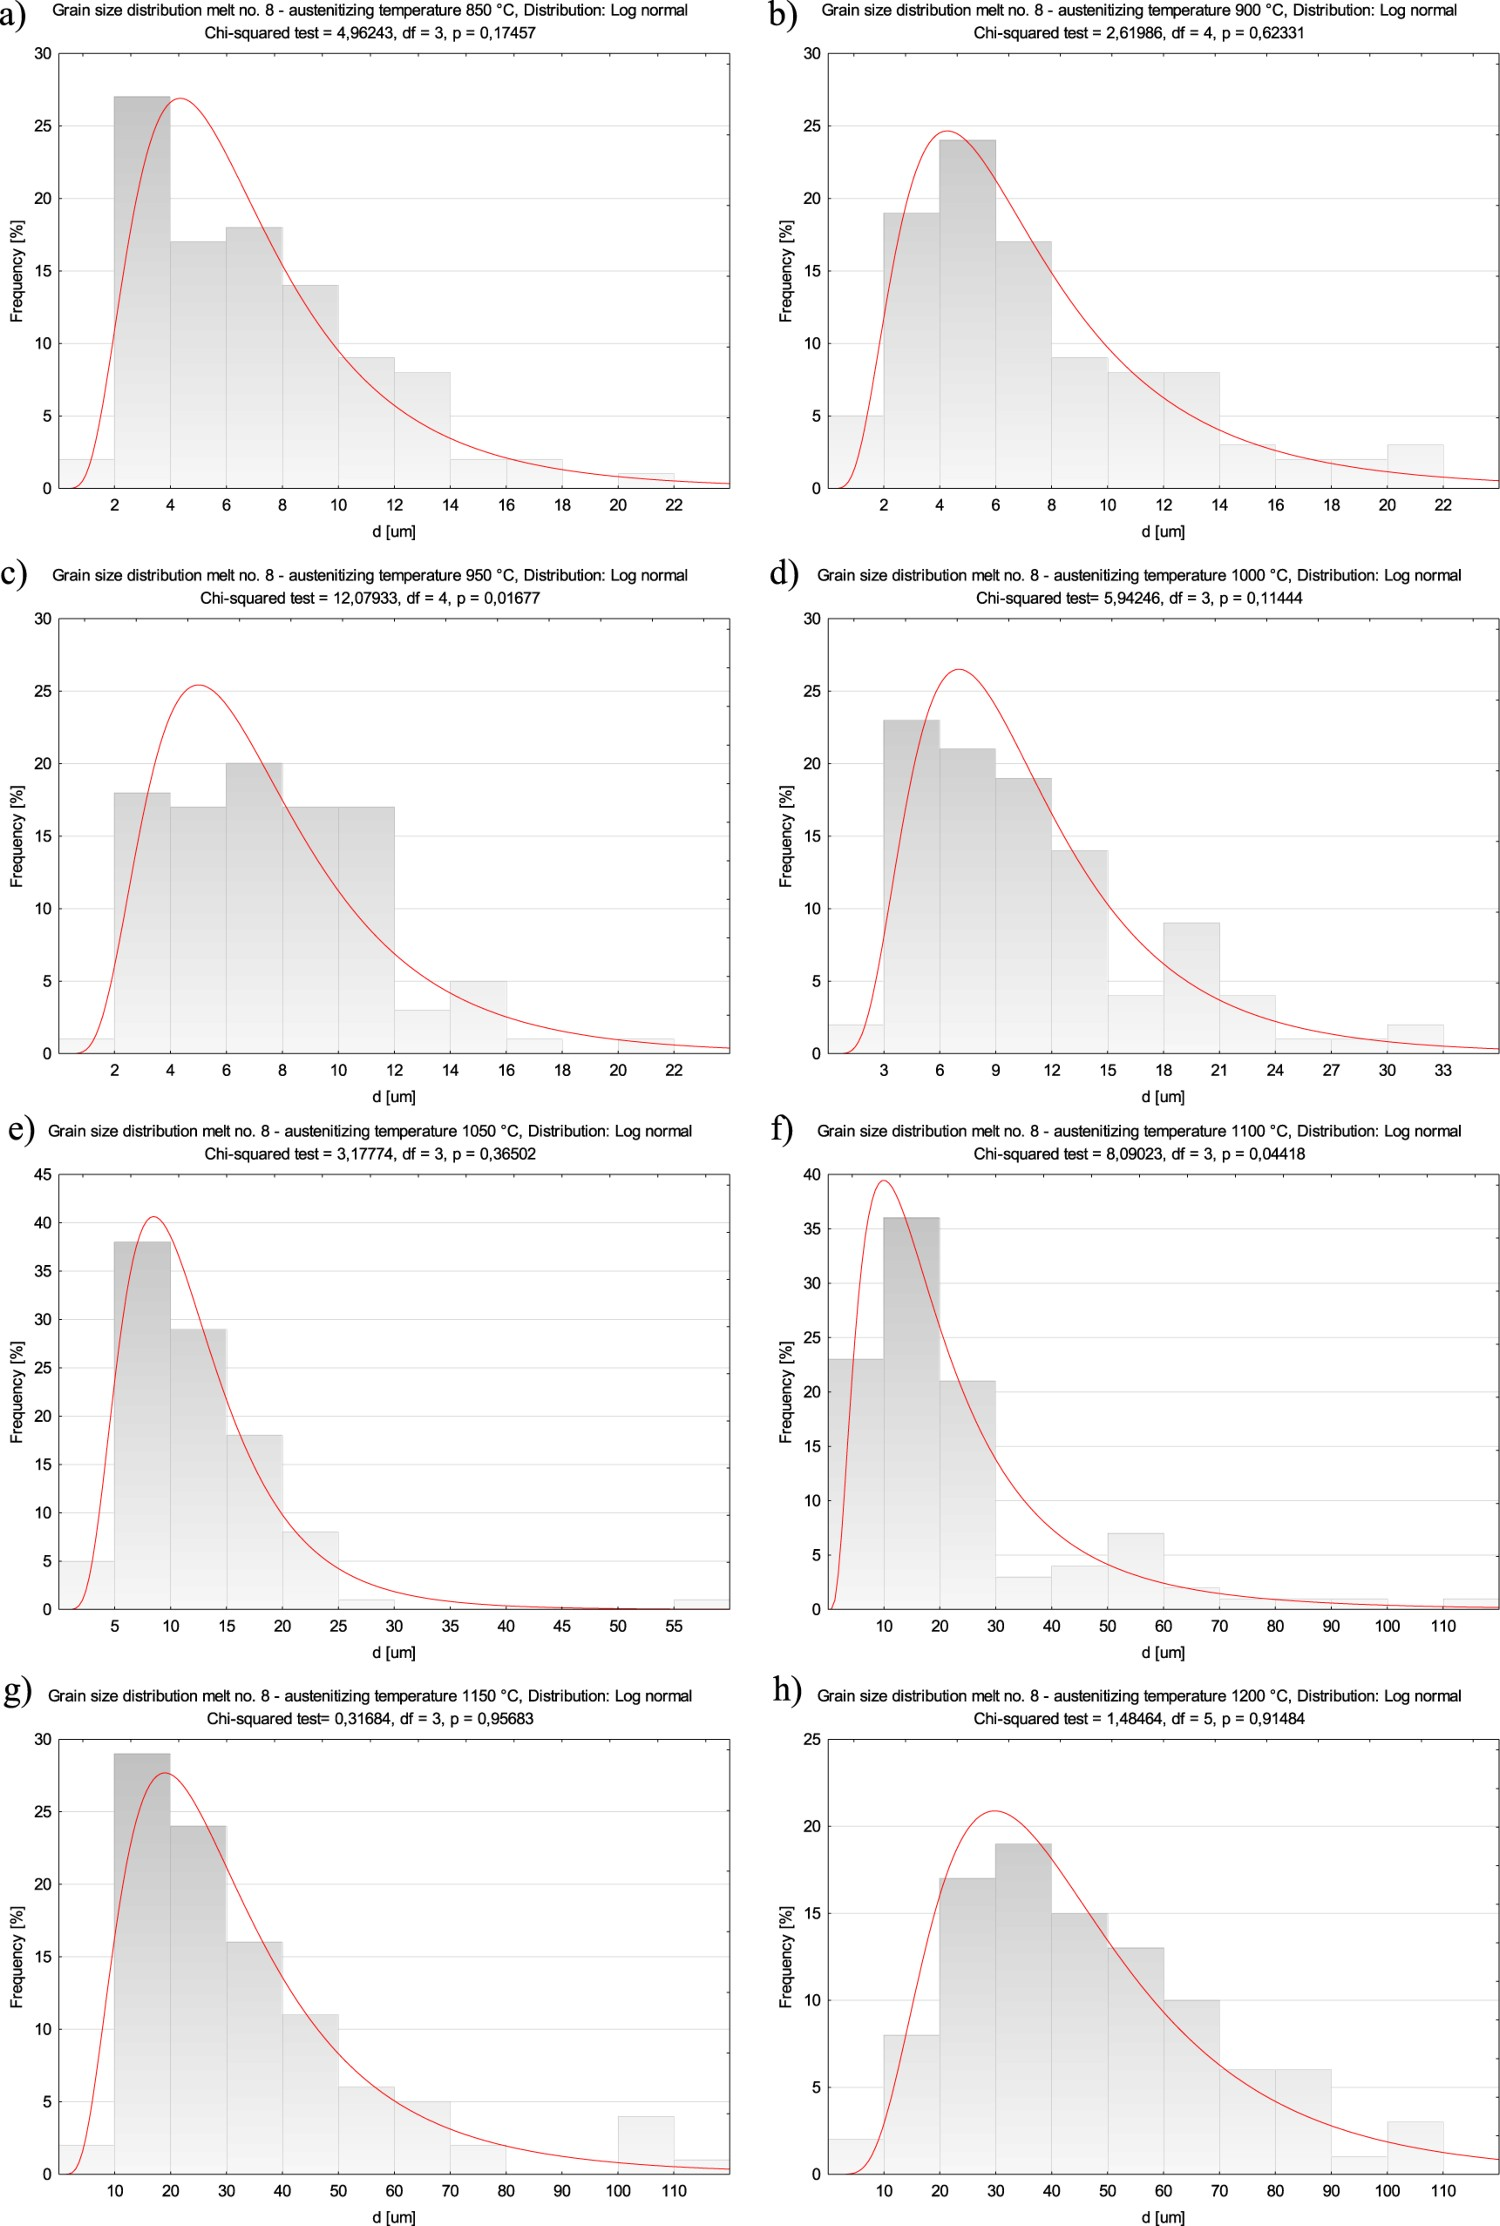
The measured grain size parameters are given in Figure 1. The data include average, median, minimum and maximum values and the lower and quartiles. Figures 2, 4, 6, 8, 10, 12, 14 and 16 show exemplary microstructures of the examined melts with revealed grain boundaries of former austenite, after austenitizing at the temperatures within 850–1200°C. In addition to microstructure photographs for each melt, empirical distributions of former austenite grain diameters are shown, accompanied – where possible – by the nearest theoretical distributions (Figures 3, 5, 7, 9, 11, 13, 15 and 17). Descriptive statistics of grain size distributions obtained for various austenitization temperatures. (a) Melt 1. (b) Melt 2. (c) Melt 3. (d) Melt 4. (e) Melt 5. (f) Melt 6. (g) Melt 7. (h) Melt 8.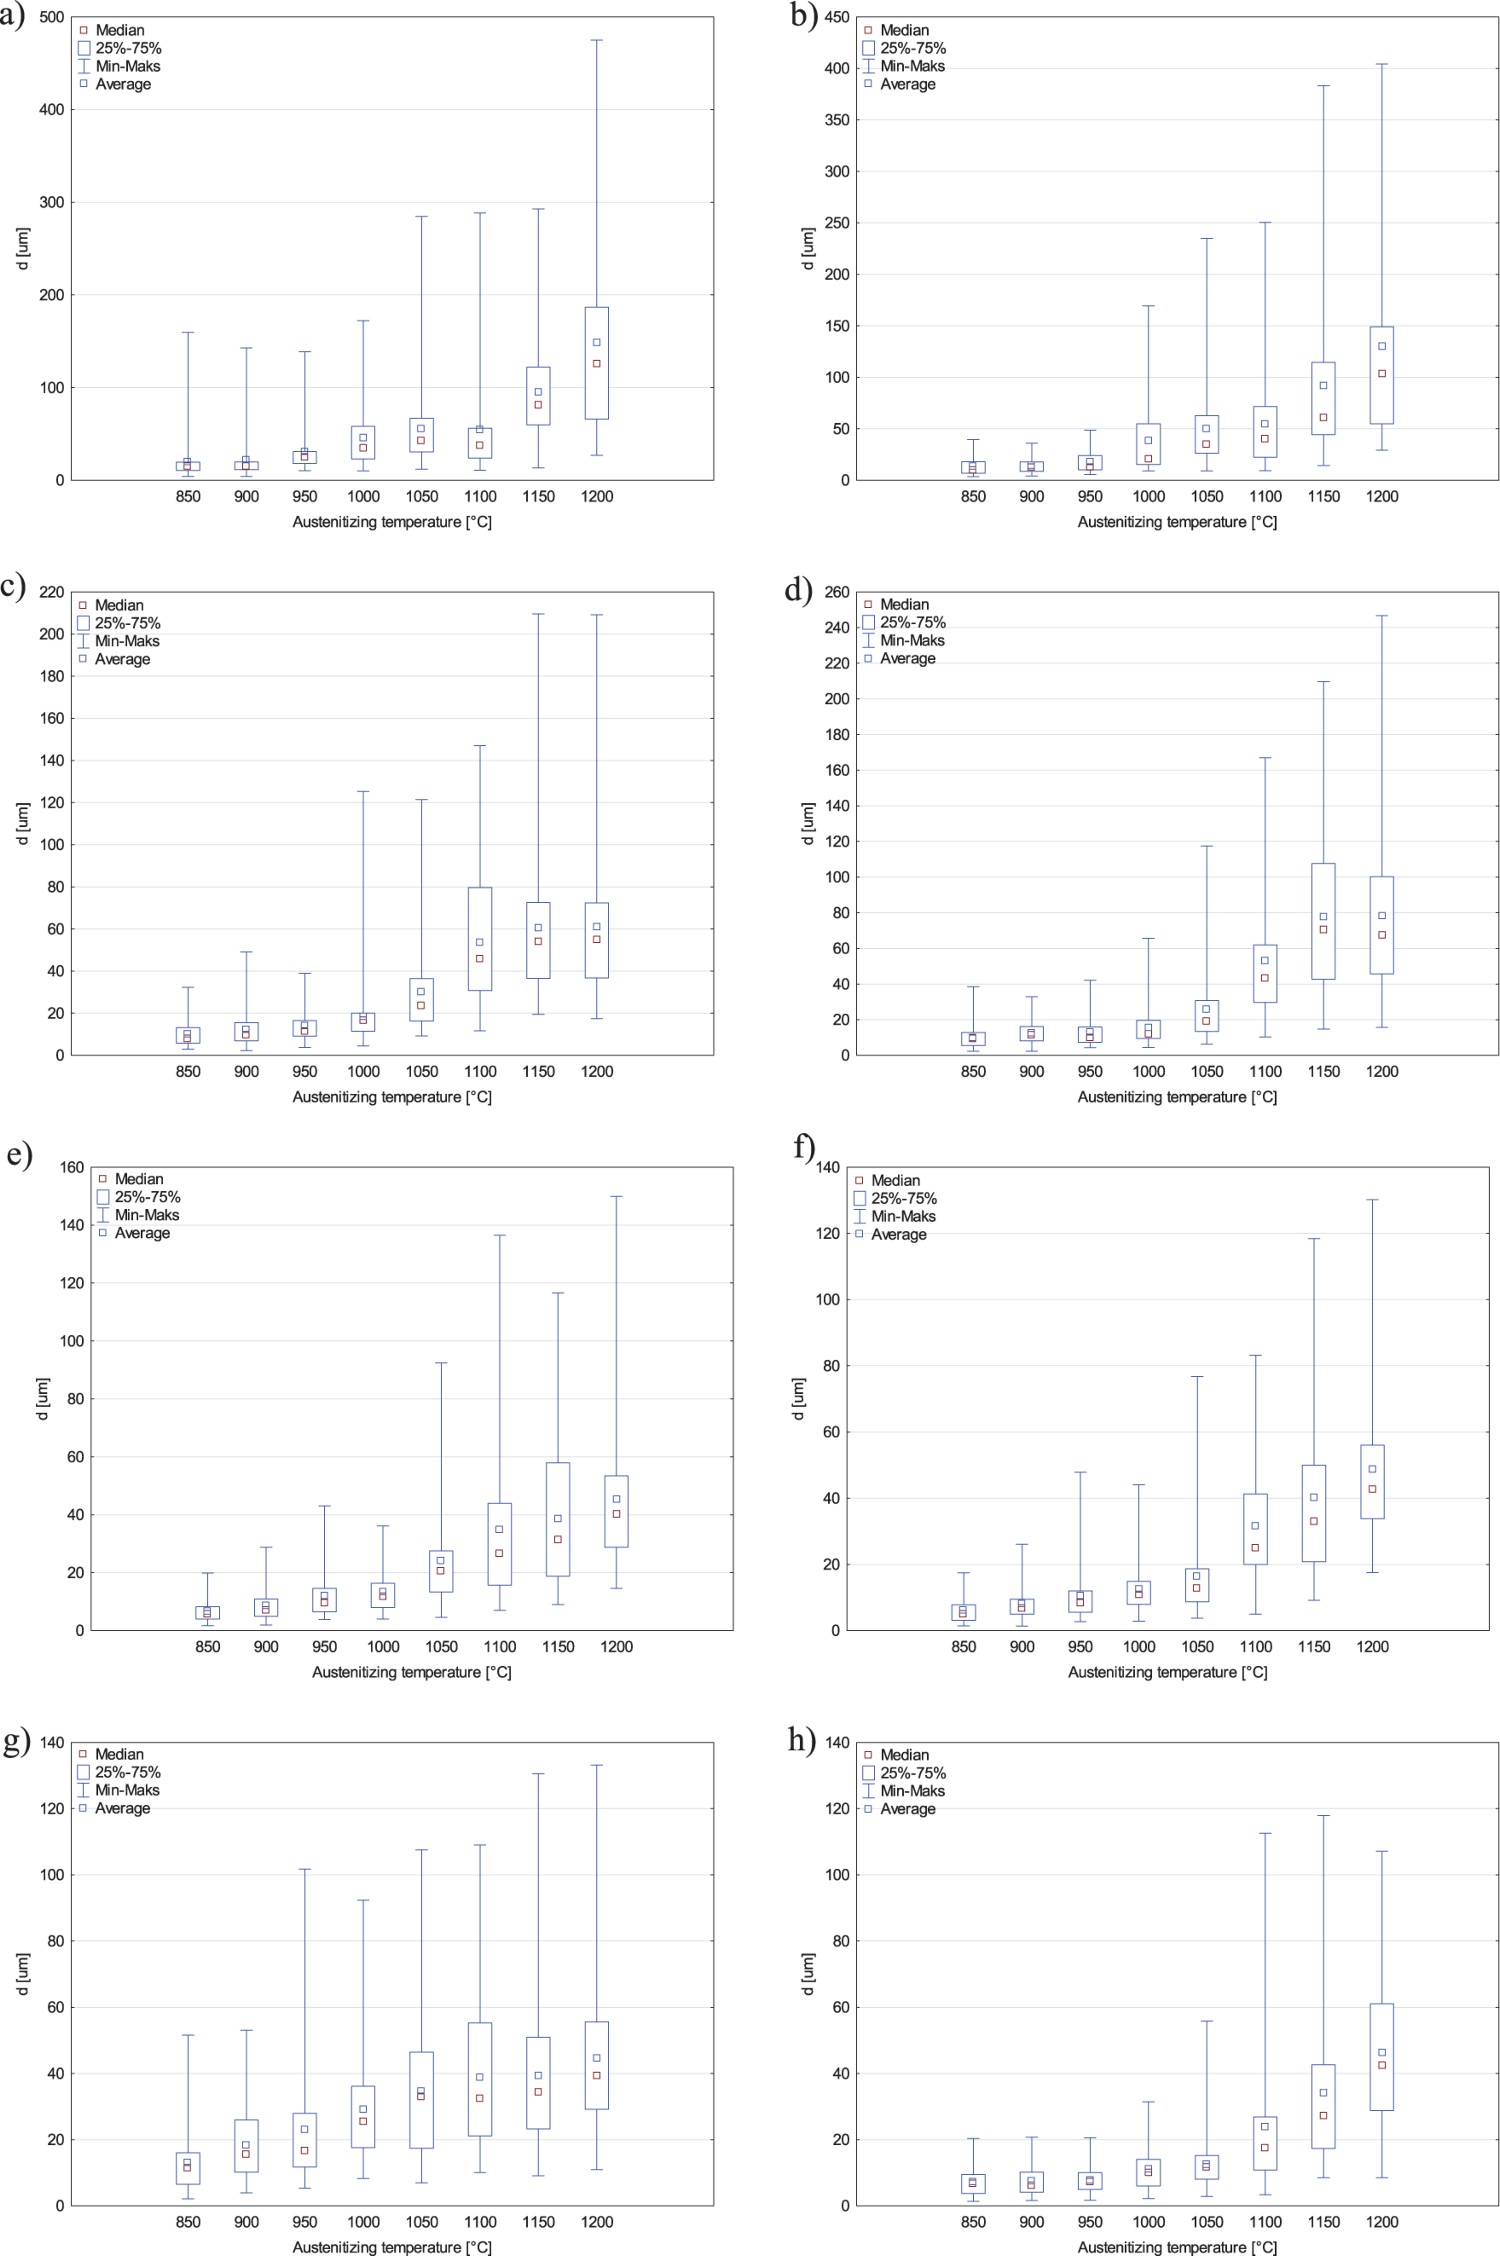
Distributions of austenite grain diameters were mostly asymmetrical, with increased number of smaller diameters. In most cases, and basically for those that could be approximated by the theoretical distribution, the calculated 

Melts 1 and 2
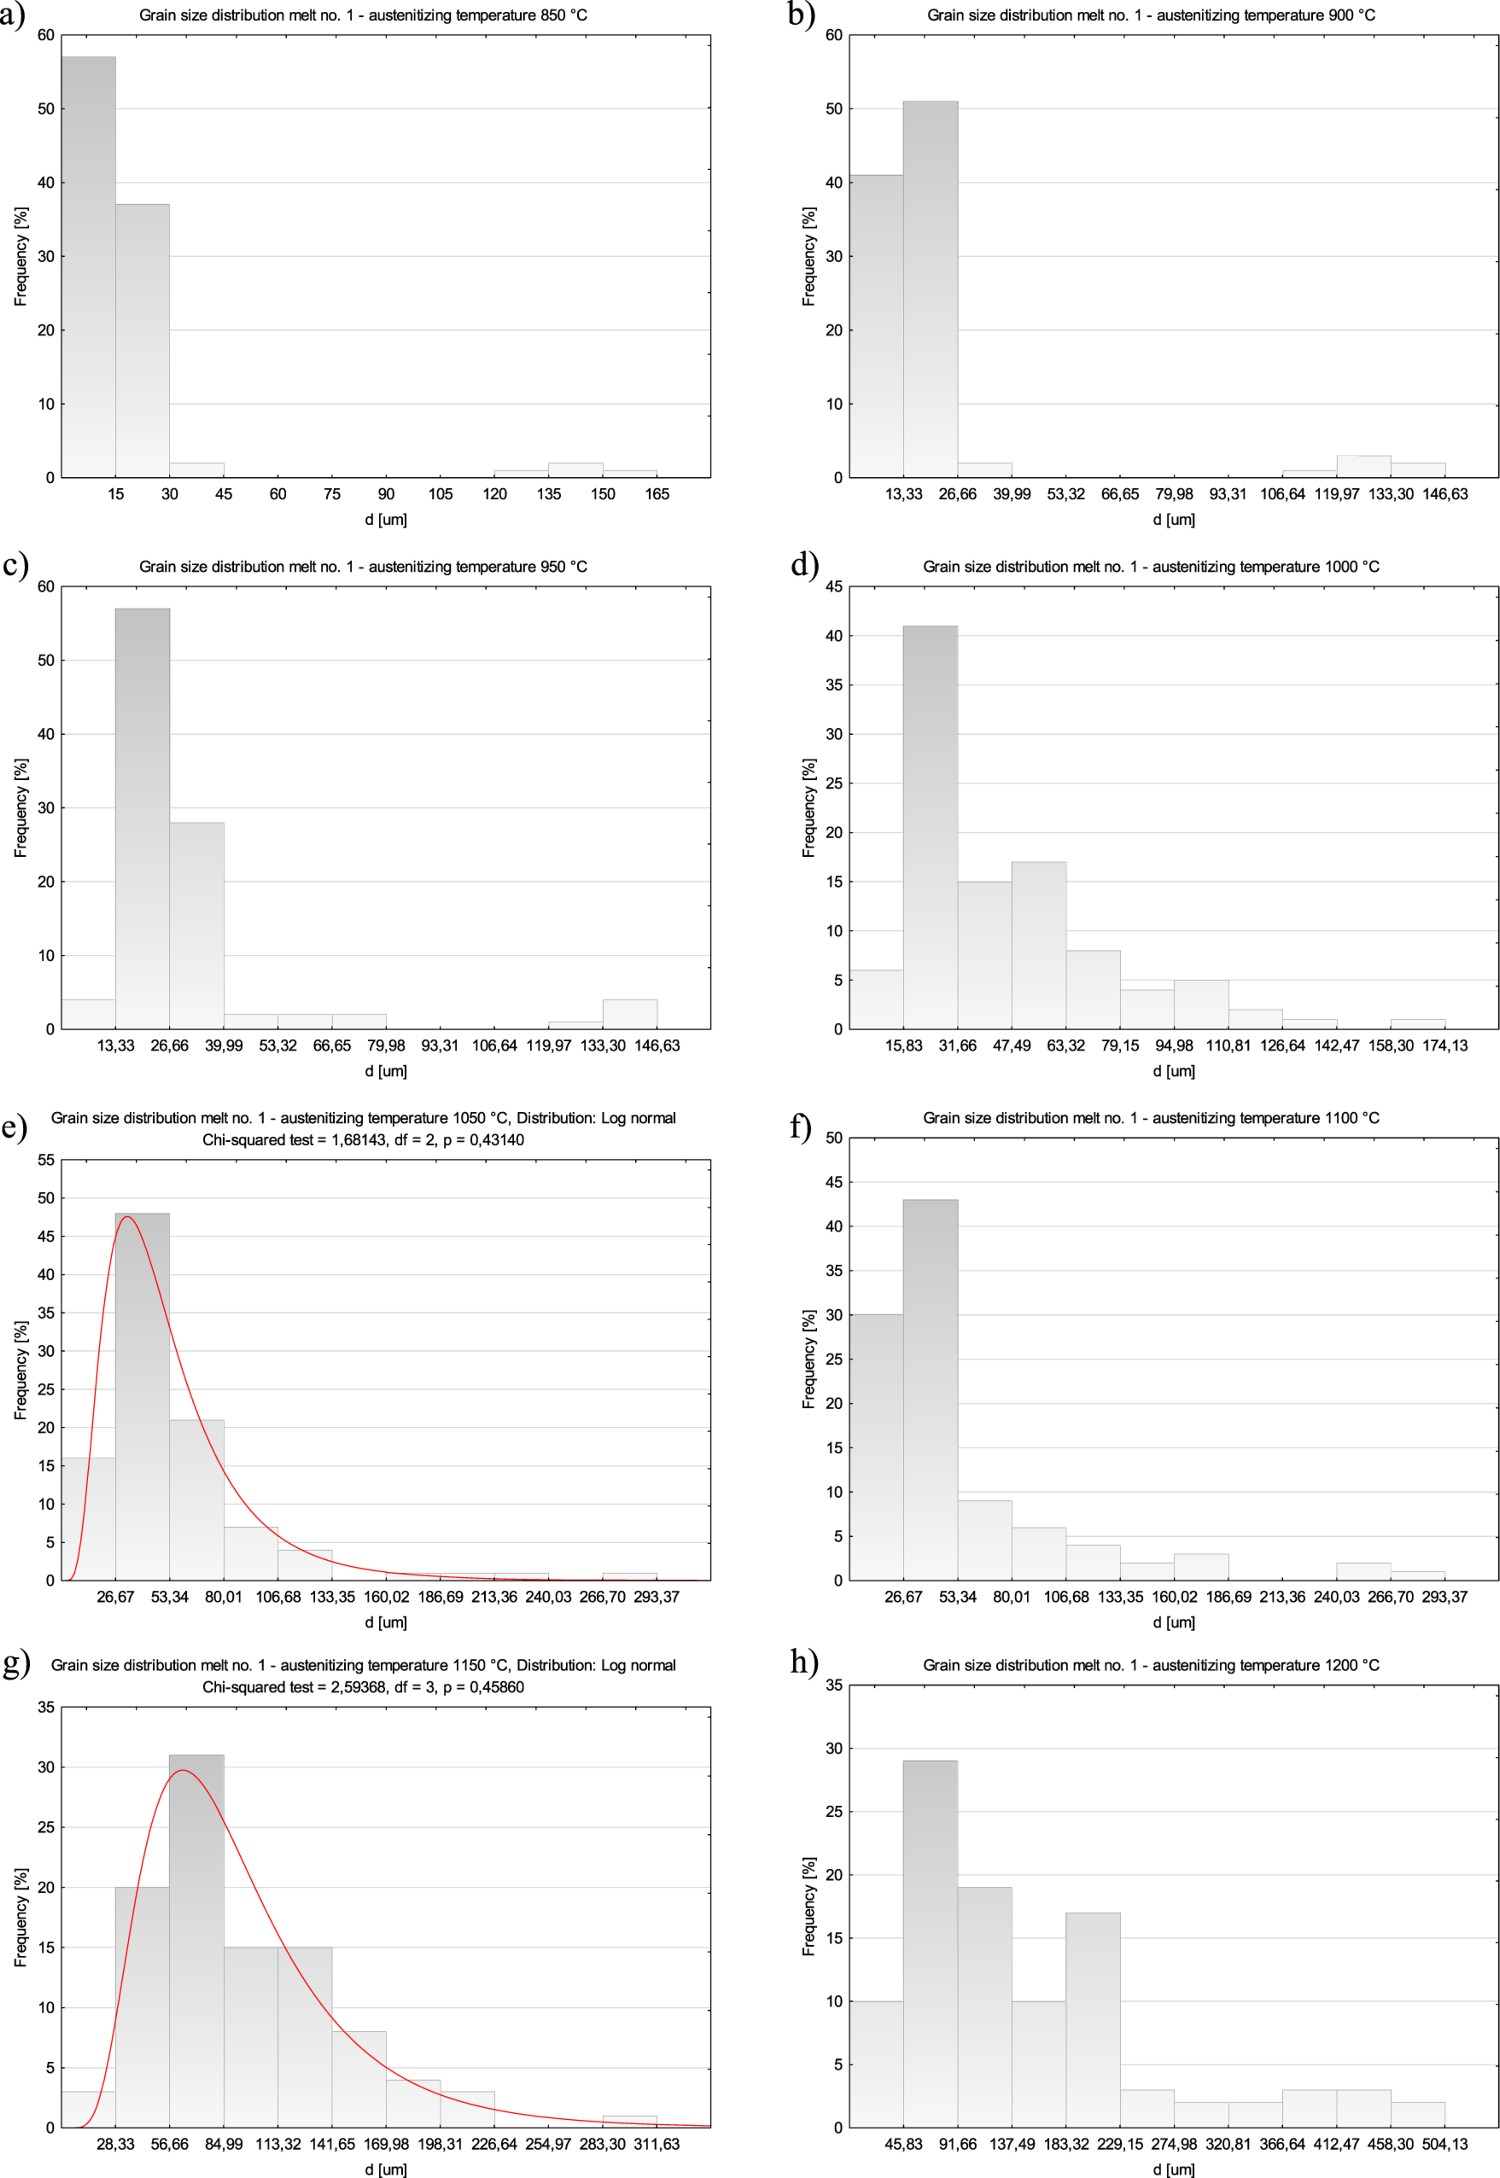
After austenitization at 850°C, numerous abnormally large grains surrounded with colonies of fine grains were observed in microstructure of the melt 1, see Figure 2(a). Average diameter of former austenite grains was 20.31 µm and minimum and maximum values were 4.18 and 159.85 µm, respectively, see Figure 1(a). Irrespective of the abnormal grains, even after austenitization at the lowest temperature, the smallest grains accounted for ca. 60% of all the grains, see Figure 3(a). The results could not be approximated by any theoretical distribution, although the empirical distribution was the nearest to the exponential distribution. Microstructure after austenitization at 900°C was not significantly different, with similar average grain diameter of 21.89 µm, see Figure 1(a). Again, irrespective of the presence of abnormal grains, the smallest grains dominated in the microstructure (Figures 2(b) and 3(b)). Like in the previous case, the obtained distribution could not be approximated by any theoretical distribution. Significant changes of microstructure took place only after austenitization at 950°C, see Figure 2(c). First of all, portion of fine grain colonies decreased to ca. 40% of the microstructure in favour of the abnormal grains, but size of the abnormal grains did not increase in comparison to those found after austenitization at lower temperatures. As a result, average diameter of former austenite grains increased to ca. 31 µm, see Figure 1(a). The empirical distribution of grain size was not approximated by any theoretical distribution. It was similar after austenitization at 1000°C, see Figure 3(c) and (d). In the latter case, the finer grains and the abnormally large grains were significantly smaller, and portion of colonies of the smallest grains was even smaller, see Figure 2(d). Diameter of 25% of the grains was below 23.18 µm. Further microstructure changes occurred after austenitization at higher temperatures, see Figure 2(e). After austenitizing at 1050°C, colonies of the smallest grains were completely absent, grain size ranged between 11.94 and 284.62 µm and the average diameter was slightly above 55 µm, see Figure 1(a). The obtained empirical distribution could be approximated by the log-normal distribution, see Figure 3(e). The next significant quantitative changes occurred only after austenitization at 1150°C (Figures 2(g) and 3(g)). Average grain size was significantly larger at ca. 95 µm and grain diameter ranged from 13.39 to almost 300 µm. After austenitization at the highest temperature of 1200°C, the smallest grains disappeared and the abnormal grains were significantly larger (Figure 2(h)). Maximum grain diameter was 475.02 µm with the average value of 148.25 µm. The empirical grain size distributions after austenitization at 1050°C, 1100°C and 1150°C were approximated by the log-normal distribution, but the distribution after austenitization at 1200 did not comply with any of the theoretical distributions, see Figure 3(h). Microstructures of the melt 1 with revealed former austenite grains after austenitization within 850–1200°C. Etched, light microscopy. (a) TA = 850°C. (b) TA = 900°C. (c) TA = 950°C. (d) TA = 1000°C. (e) TA = 1050°C. (f) TA = 1100°C. (g) TA = 1150°C. (h) TA = 1200°C. Distributions of average former austenite grain diameters for the melt 1 after austenitization within 850–1200°C. (a) TA = 850°C. (b) TA = 900°C. (c) TA = 950°C. (d) TA = 1000°C. (e) TA = 1050°C. (f) TA = 1100°C. (g) TA = 1150°C. (h) TA = 1200°C.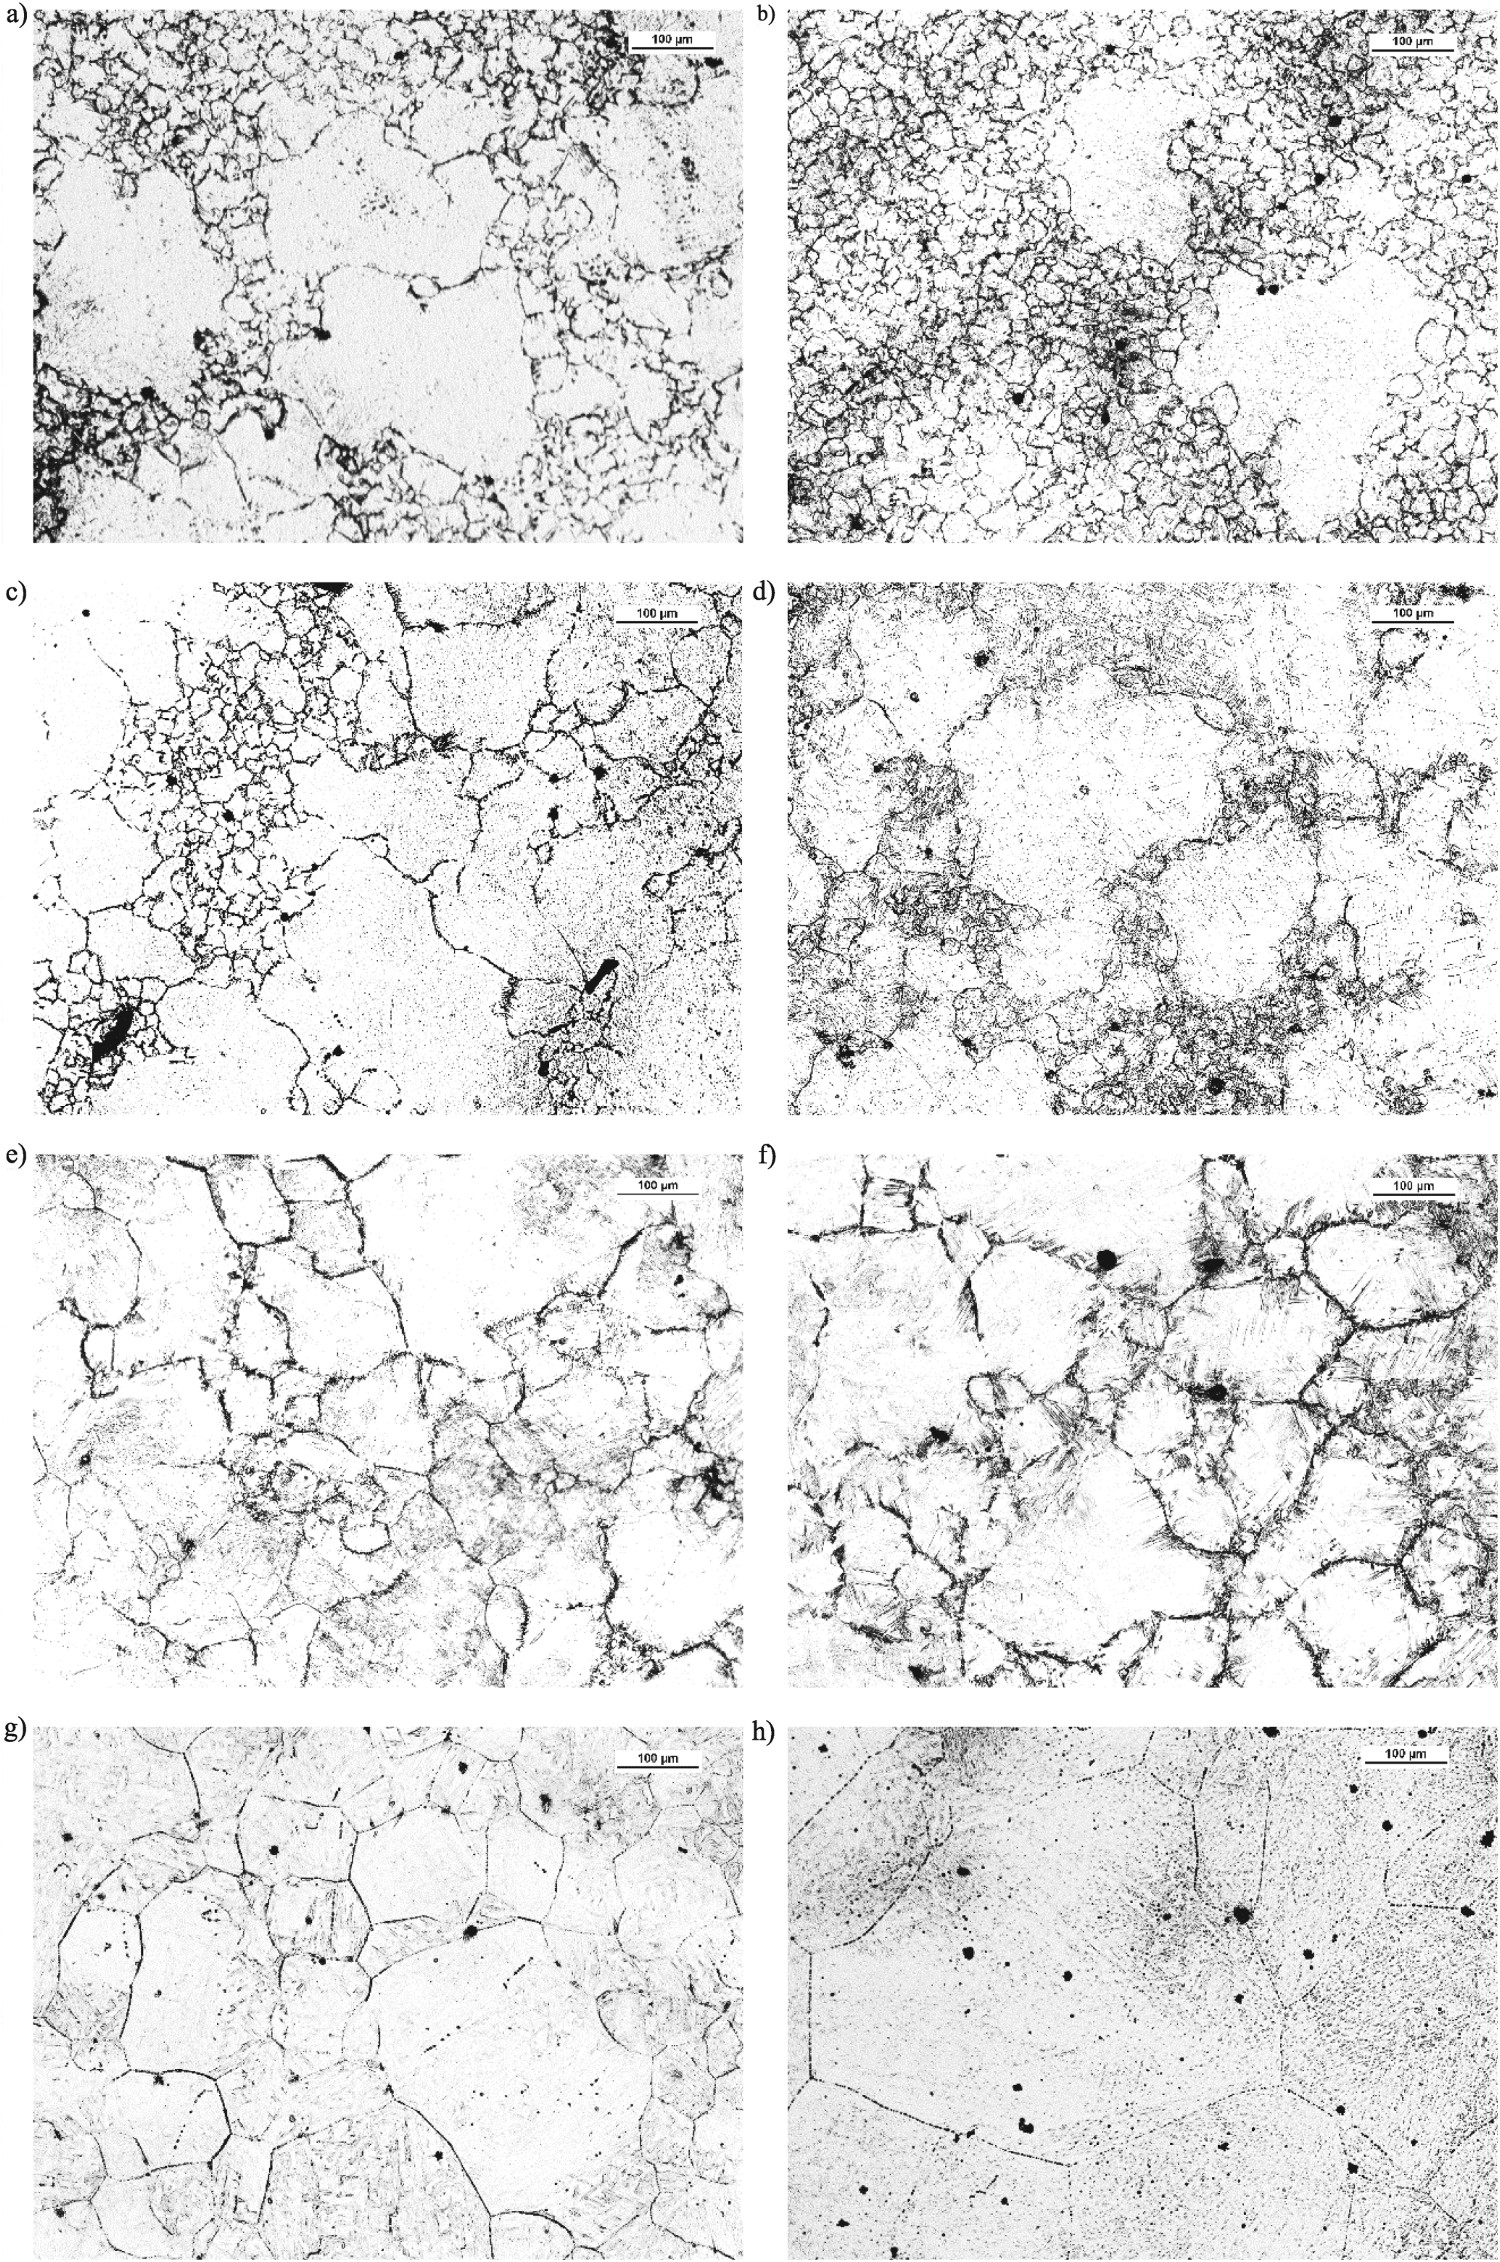
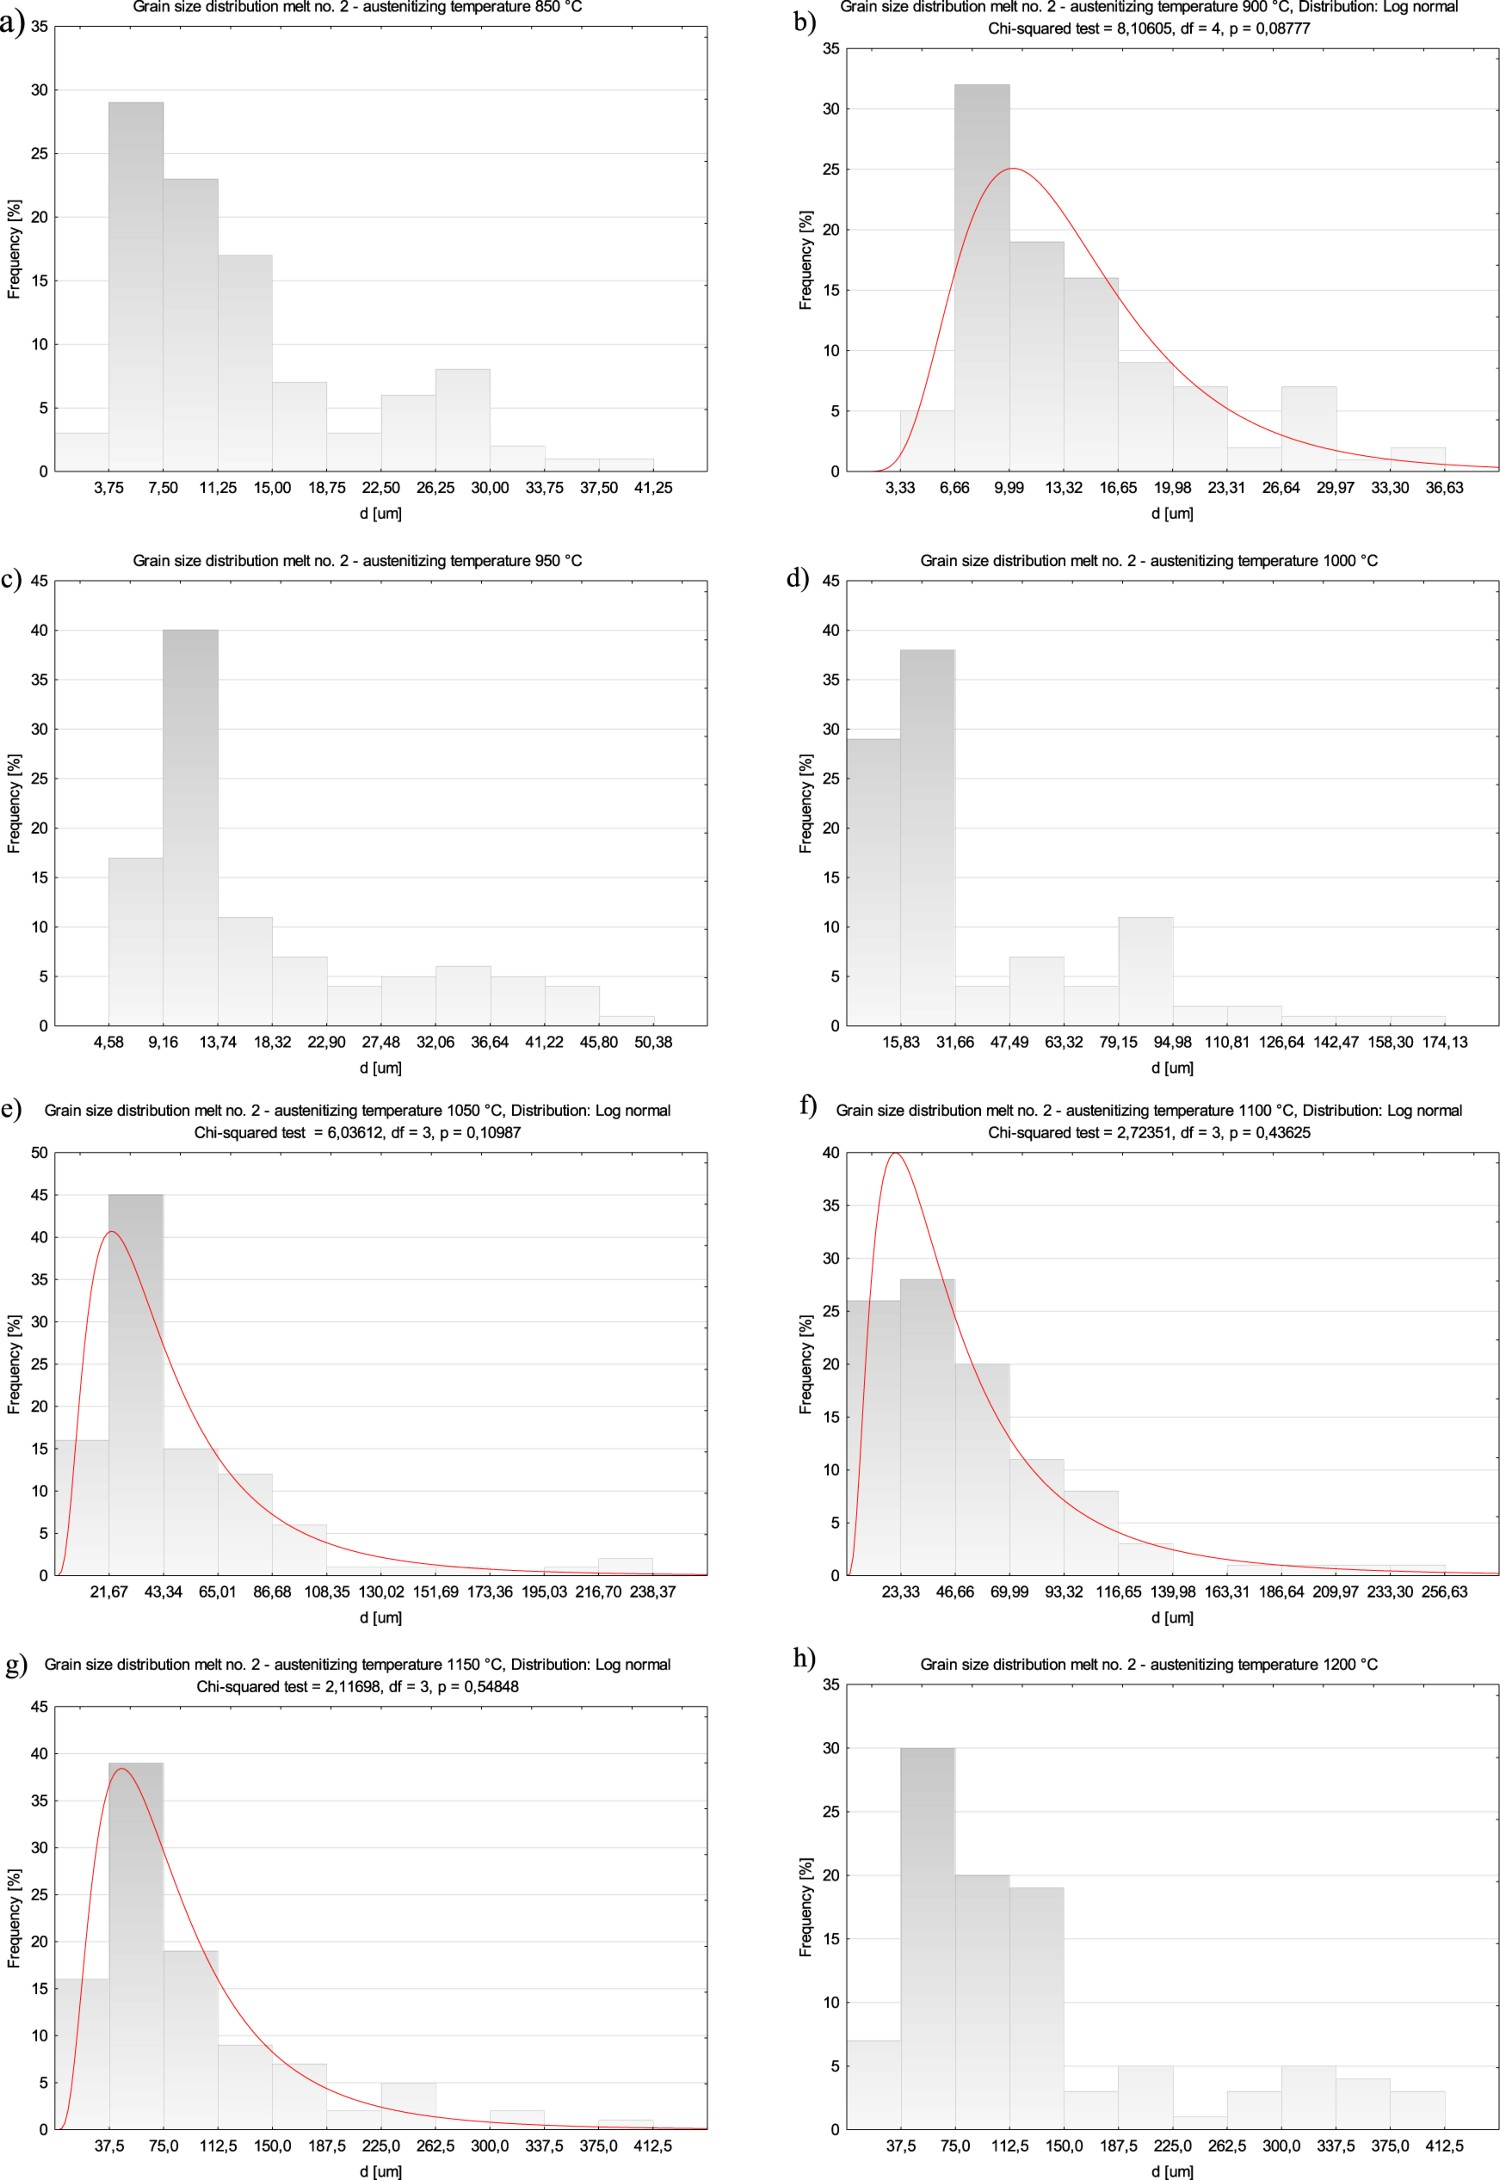
In comparison to the melt 1, the melt 2 did not include boron in its chemical composition, see Table 1. After austenitization at the lowest temperatures, i.e. at 850°C and 900°C, microstructures of the specimens were more homogeneous, with generally small grains and the occurring abnormal grains were smaller and not so numerous, see Figure 4(a) and (b). Average austenite grain diameters were respectively 12.98 and 14.17 µm, and average diameter of abnormal grains was much smaller than that in the melt 1 amounting to ca. 40 µm, see Figure 1(b). The obtained grain size distribution after austenitizing at 900°C could be approximated by the log-normal distribution (Figure 5(b)). Larger abnormal grains started appearing as early as after austenitizing at 950°C (Figure 4(c)) and maximum measured grain diameter was 48.76 µm (Figure 1(b)). The smallest grains also started growing and minimum measured grain diameter was 5.68 µm. The next significant structural changes occurred after austenitizing at 1000°C (Figure 4(d)). The abnormal grains surrounded by colonies of other fine grains occupied larger areas. The largest measured grain diameter was 169.37 µm and the average value was 38.40 µm (Figure 1(b)). Starting from this temperature, structures of the melt 2 were similar to those of the melt 1 obtained for the same temperatures, so average grain diameters were also similar, see Figure 1(b). After austenitizing at higher temperature, colonies of fine grains disappeared completely (Figure 4(e)). Grain diameters ranged between 9.13 and 235.06 µm (Figure 1(b)) and the obtained distribution could be approximated by the log-normal distribution (Figure 5(e)). Grains with diameters up to 26.32 µm accounted for 25% only, but those with diameters up to 35.06 µm accounted for 50% of the structure components. After austenitizing at higher temperatures, grains were also gradually larger (Figure 4(f–h)). The largest average grain diameter of 404.18 µm was found after austenitizing at 1200°C (Figure 1(b)). It was over 9 times larger from that obtained after austenitizing at 850°C. About 50% of grain diameters exceeded 103 µm, of that 23% exceeded 150 µm. The grain size distributions after austenitizing at 900°C, 1050°C, 1100°C, 1150°C could be approximated by the log-normal distribution (see Figure 5(b, e, f and g)). Microstructures of the melt 2 with revealed former austenite grains after austenitizing within 850–1200°C. Etched, light microscopy. (a) TA = 850°C. (b) TA = 900°C. (c) TA = 950°C. (d) TA = 1000°C. (e) TA = 1050°C. (f) TA = 1100°C. (g) TA = 1150°C. (h) TA = 1200°C. Distributions of average former austenite grain diameters for the melt 2 after austenitizing within 850–1200°C. (a) TA = 850°C. (b) TA = 900°C. (c) TA = 950°C. (d) TA = 1000°C. (e) TA = 1050°C. (f) TA = 1100°C. (g) TA = 1150°C. (h) TA = 1200°C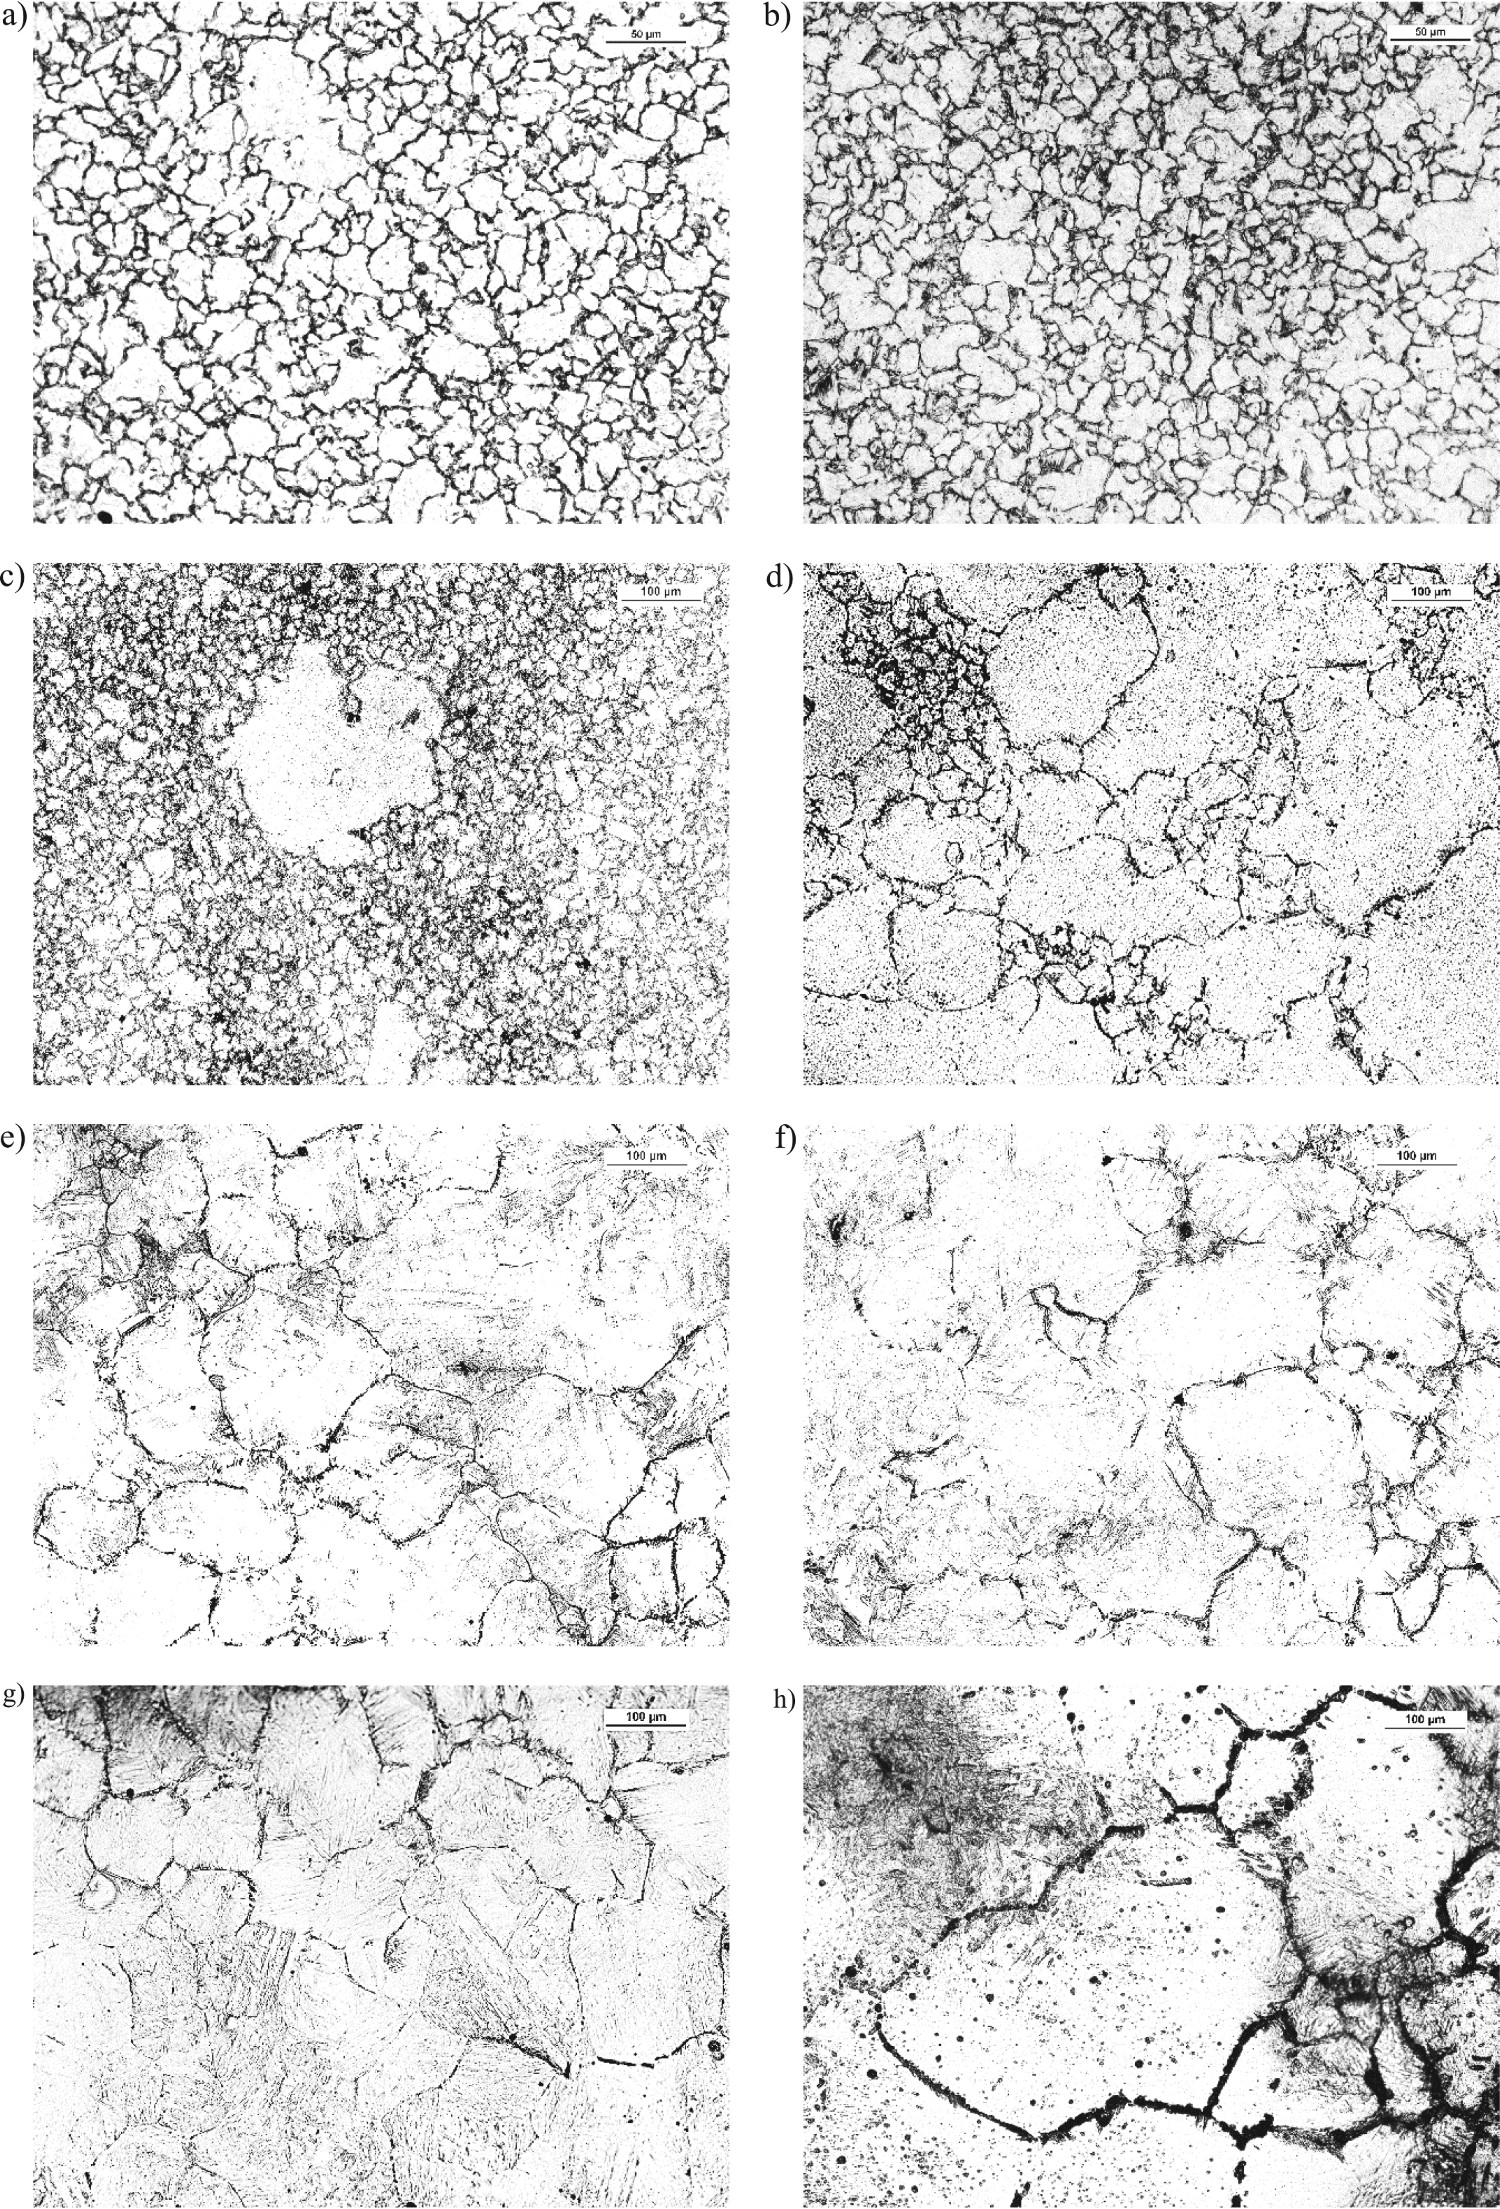
Analysis of former austenite grain sizes in the melts 1 and 2 shows that the boron-rich phases effectively hindered grain growth in the melt 1 selectively only and such a segregation is unfavourable with regard to usable properties. Therefore, action of boron only, with no other alloying elements, is insufficient in the grain growth process.
Melts 3 and 4
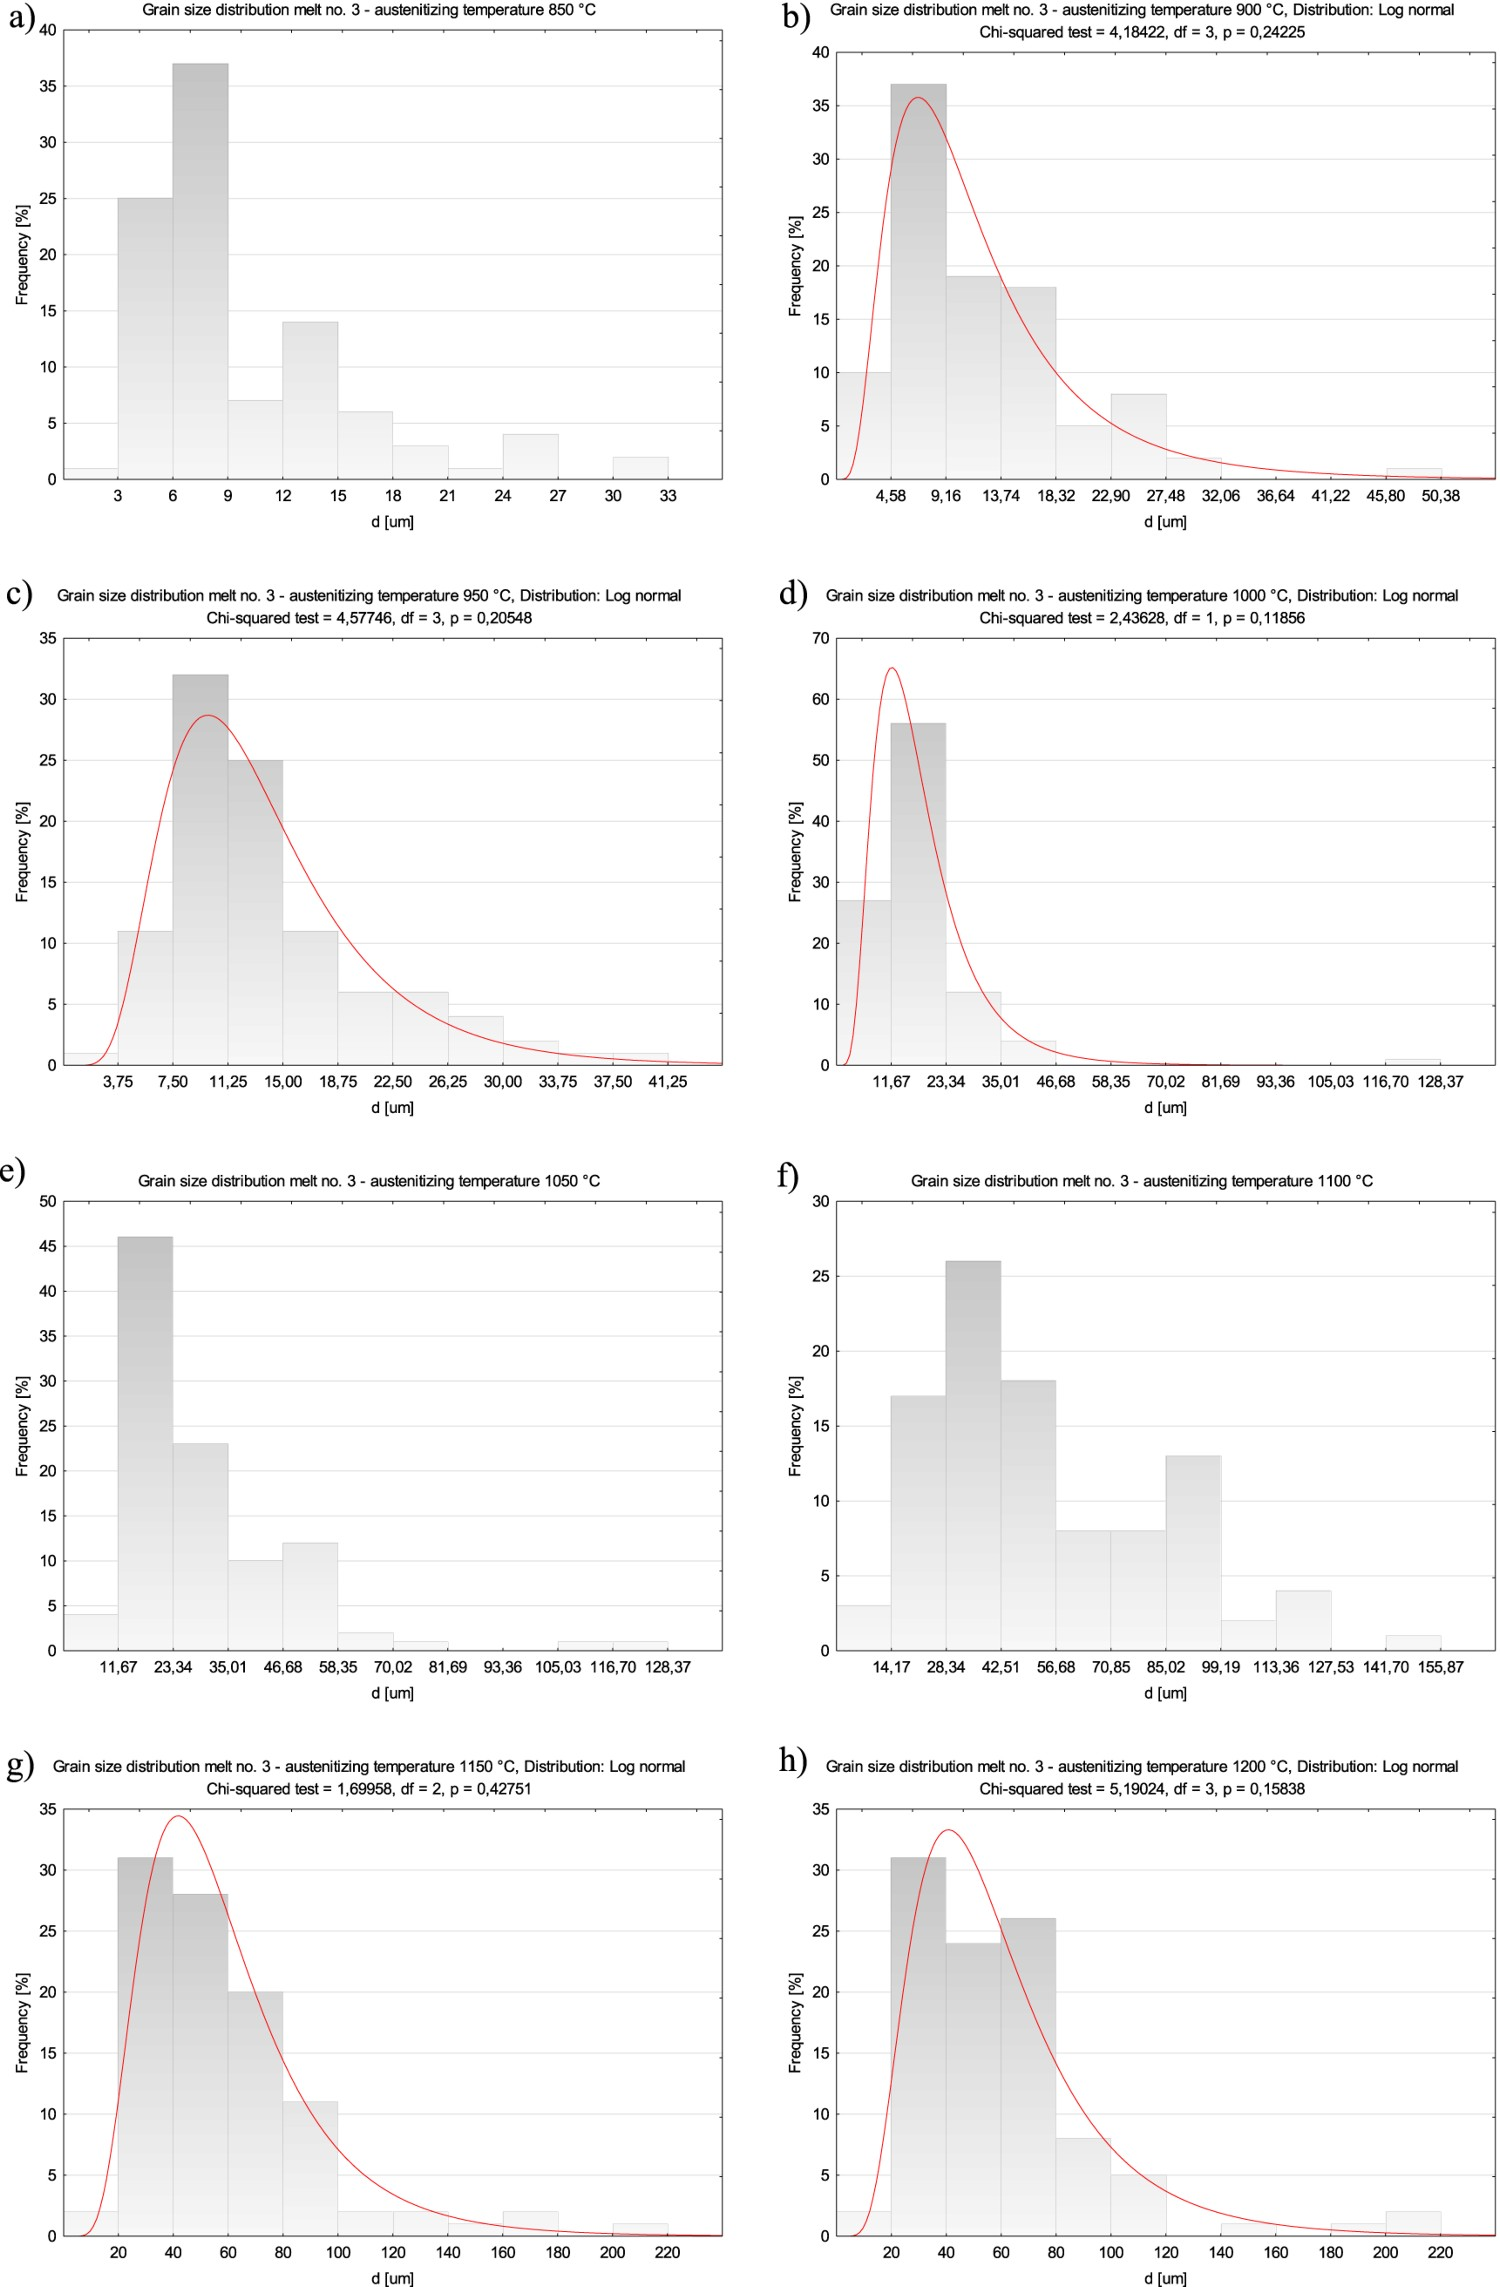
As opposed to the melts 1 and 2, the melts 3 and 4 included chromium as the alloying element. In addition, the melt 3 contained boron, like the melt 1 (see Table 1). The difference between the melts 3 and 1 was clearly visible after austenitizing at the lowest temperature already, which indicates that chromium, as the strongly carbide-forming element, significantly affects fine granularity of microstructure. First of all, no abnormal former austenite grains were found in microstructure of the melt 3 (Figure 6(a)). Even if sizes of the grains were variable, the difference between the largest and the smallest measured diameter was ca. 30 µm, and the average diameter was 10.02 µm. It results from the obtained grain size distribution, which could not be approximated by any theoretical distribution, that the grains smaller than 9 µm accounted for 63% of all grains (Figure 7(a)). After austenitizing at 900°C, a growth of some grains occurred (Figure 6(b)), so the maximum measured diameter was 49.05 μm, 50% larger than that obtained for the lower temperature (Figure 1(c)). It results from the obtained distribution, which could be approximated by the log-normal distribution (Figure 7(b)), that the largest grains accounted for a marginal microstructure component and the structure was still dominated by the grains with diameter below 10 µm, occupying almost 50% of the cross-section area. A similar arrangement was found in the specimens after austenitizing at 950°C (Figure 6(c)). Significant structural changes occurred after austenitizing at 1000°C only, when single abnormal very large grains appeared (Figure 6(d)). Maximum grain diameter was 125.29 µm and average grain diameter was 80% larger than that after austenitizing at the lowest temperature, see Figure 1(c). Values of all the measured parameters increased also after austenitizing at 1050°C. The largest grains became a significant structure component and grains in their surrounding colonies were also larger (Figure 6(e)). The grains with diameters up to 11.67 µm accounted for 4% and those with diameters between 11.67 and 23.34 μm accounted for 46% of the structure components (Figure 7(e)). The next significant quantitative changes occurred after austenitizing at 1100°C. Colonies of fine grains disappeared completely (Figure 6(f)) and the largest grains became the main structure component (Figure 7(f)). It should be noted that such arrangement was found in the melt 1 after austenitizing at the temperature 50°C lower. Average grain diameter was ca. 54 µm and did not significantly change after austenitizing at 1150°C and 1200°C. It should be also added that, after austenitizing at the three highest temperatures, the average value was close to the median, see Figure 1(c). Microstructures of the melt 3 with revealed former austenite grains after austenitizing within 850–1200°C. Etched, light microscopy. (a) TA = 850°C. (b) TA = 900°C. (c) TA = 950°C. (d) TA = 1000°C. (e) TA = 1050°C. (f) TA = 1100°C. (g) TA = 1150°C. (h) TA = 1200°C Distributions of average former austenite grain diameters for the melt 3 after austenitizing within 850–1200°C. (a) TA = 850°C. (b) TA = 900°C. (c) TA = 950°C. (d) TA = 1000°C. (e) TA = 1050°C. (f) TA = 1100°C. (g) TA = 1150°C. (h) TA = 1200°C.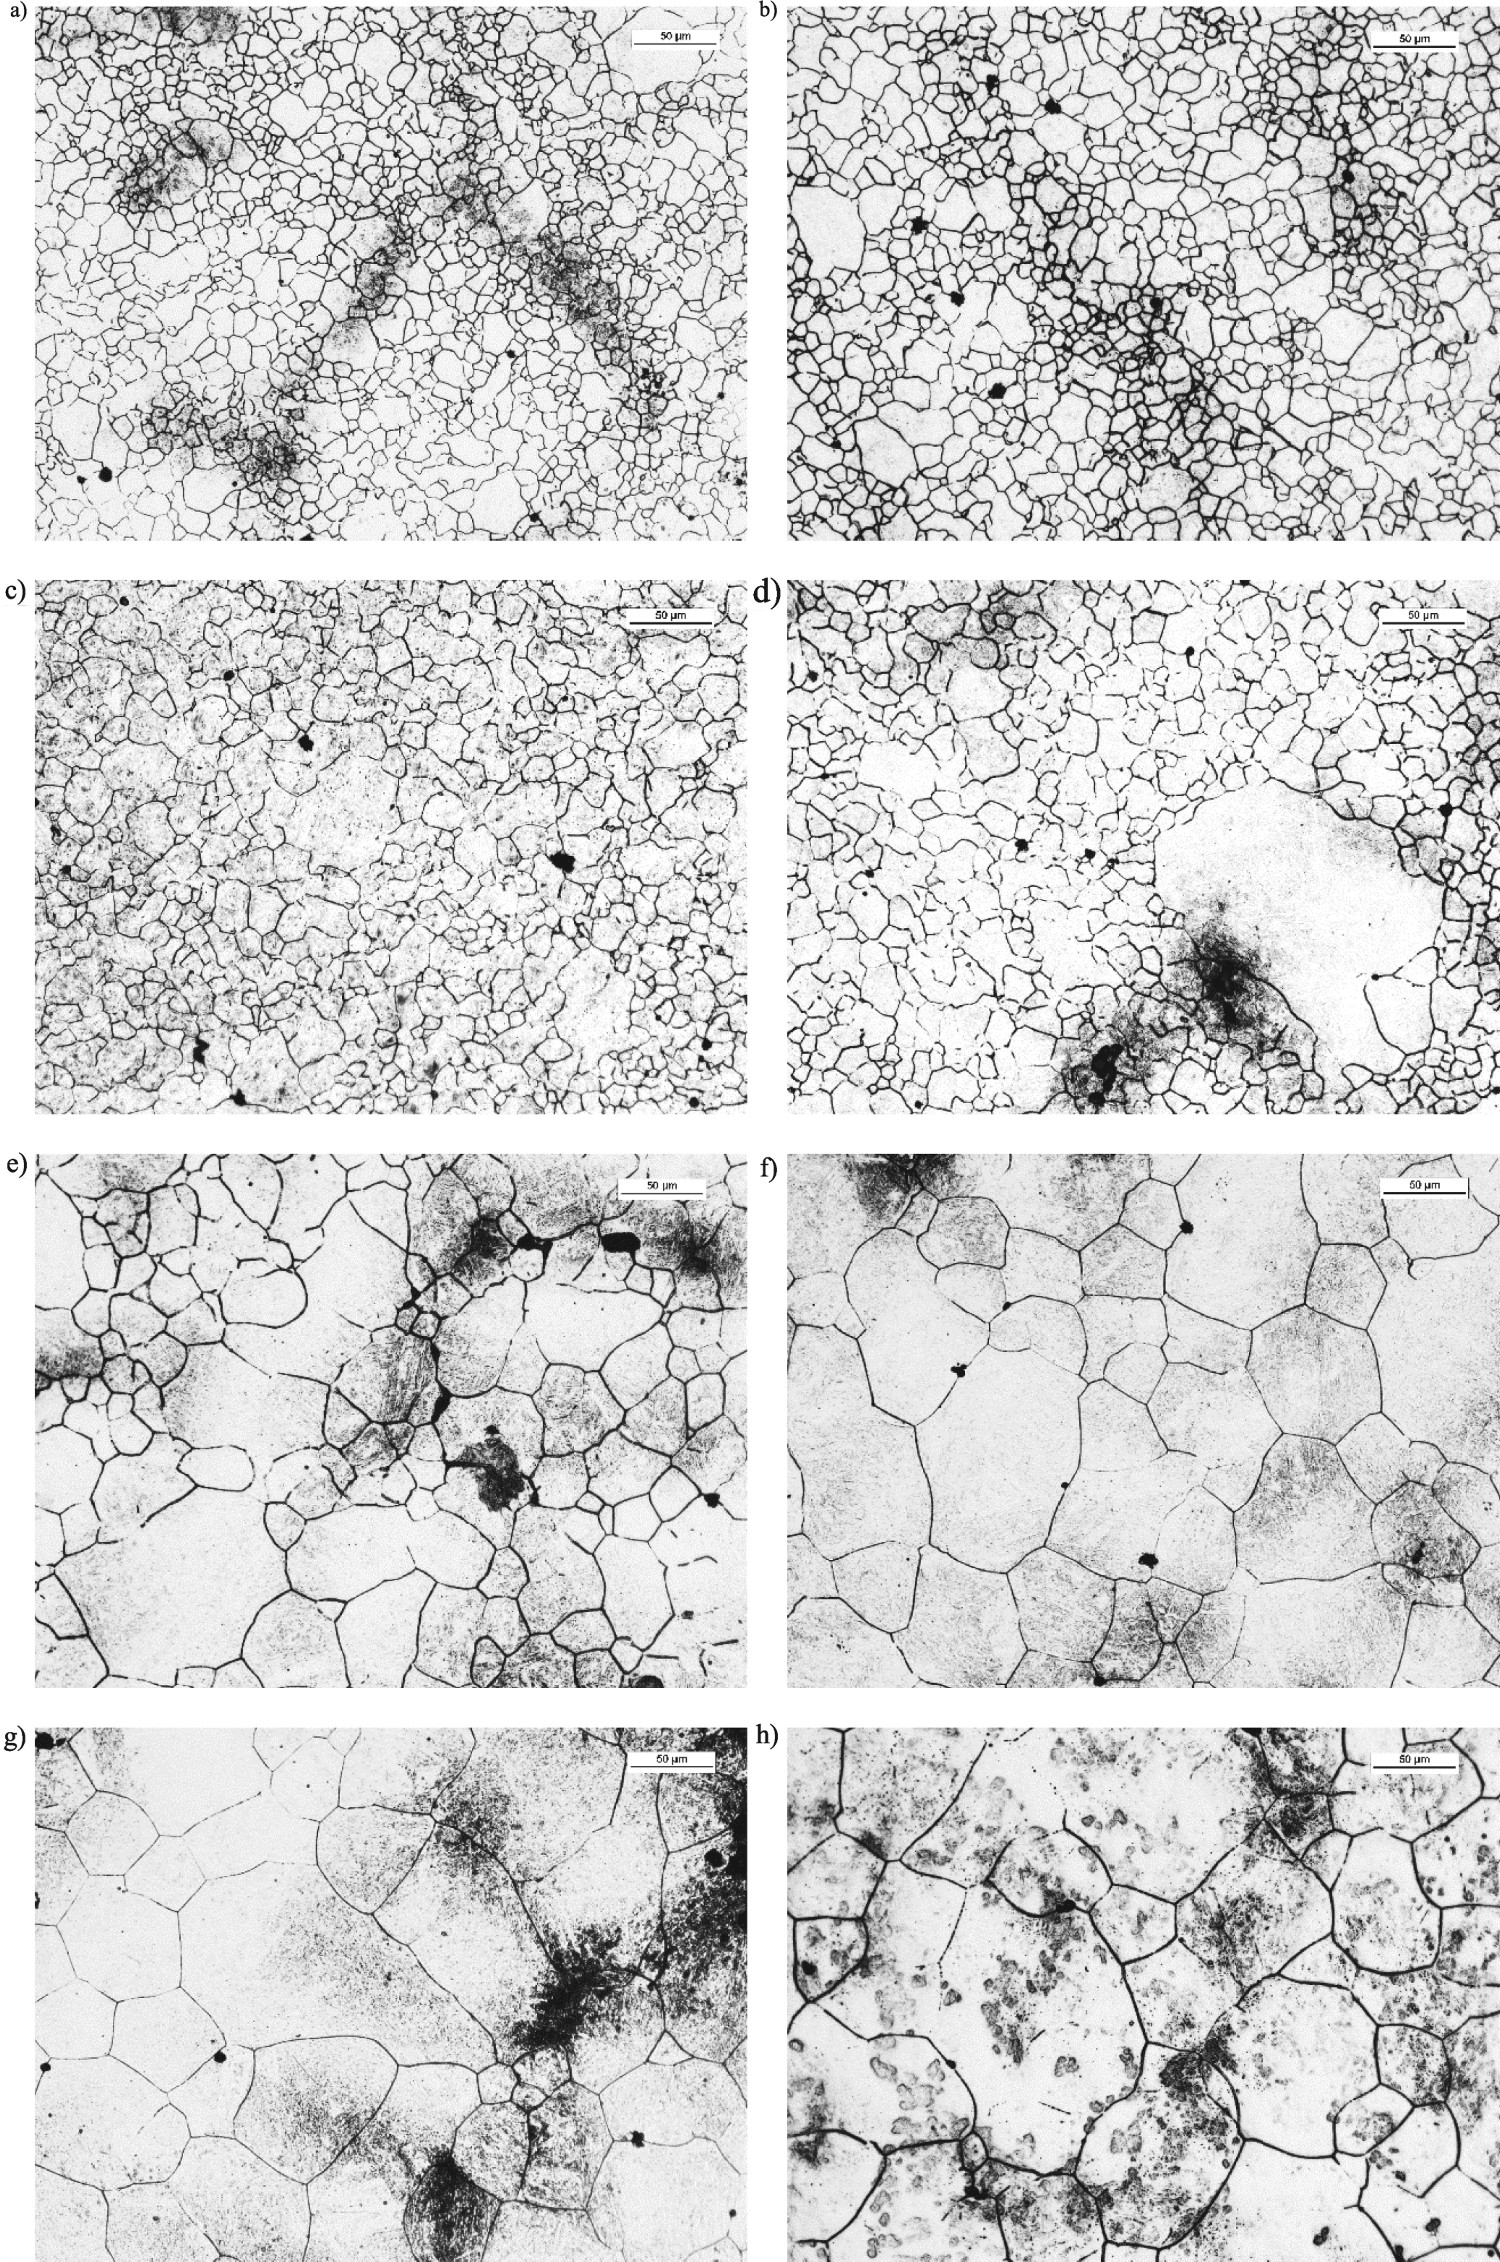
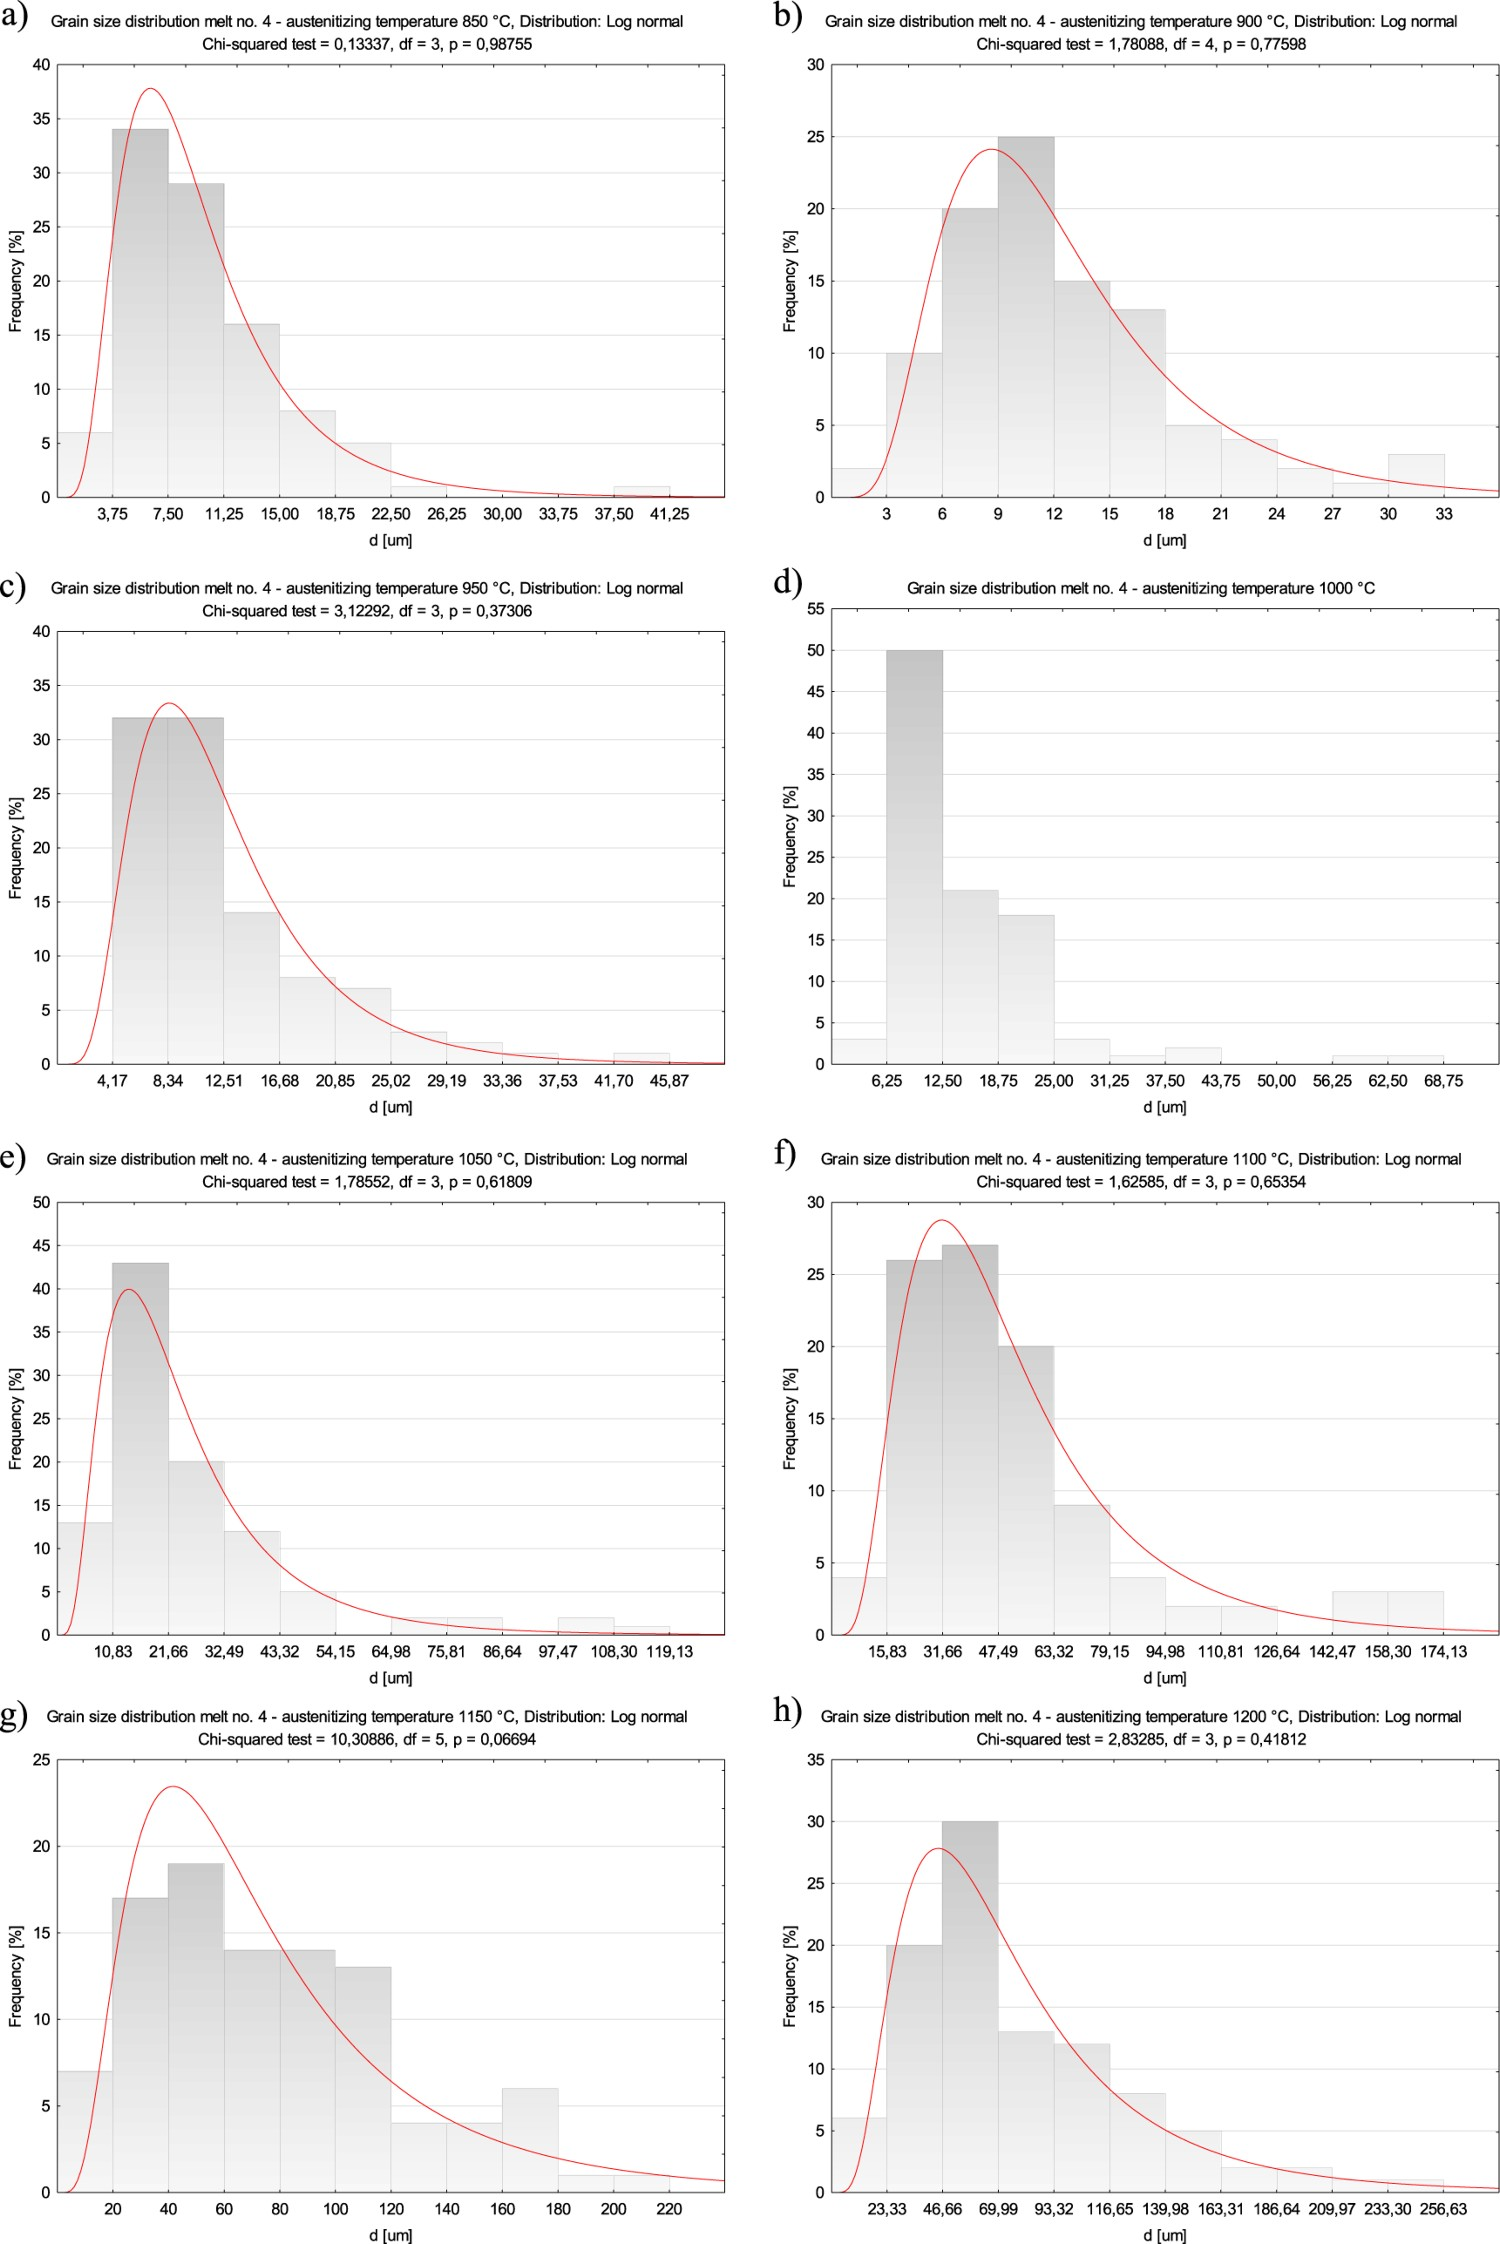
As opposed to the melt 3, the melt 4 did not include boron, so the austenite grain growth was mostly controlled by carbide-forming chromium and nitride-forming aluminium. After austenitizing at 850°C and 900°C, no significant qualitative or quantitative structural changes were found in the melt 4 in comparison to the boron-containing melt (Figures 1(d, 8(a) and (b)). There were no abnormal grains, although the structure was composed of different-size grains, whose diameters ranged from ca. 2 µm to over 30 µm. Small differences in structures of both melts could be observed after austenitization at 1000°C only. In the melt 4, single large grains with diameters up to over 65.60 µm were observed (Figures 8(c) and 9(c)). After austenitizing at 1050°C, abnormally large grains with diameters up to 117.42 µm appeared, see Figures 9(d) and 1(d). Average grain diameters and diameters of the smallest grains were smaller than those in the boron-containing melt, since portion of the fine-grain colonies around abnormal grains was larger and diameters of 25% grains were below 13.42 µm. After austenitizing at 1100°C, microstructures of the melts 3 and 4 became similar to each other qualitatively and quantitatively, see Figures 8(f) and 1(d). However, after austenitizing at the two highest temperatures, former austenite grains in the melt 4 were larger and maximum measured grain diameter was nearly 250 µm (Figures 1(d) and 8(g), (h)). It should be added that almost all grain size distributions for the melt 4 could be approximated by the log-normal distribution (Figure 9). Microstructures of the melt 4 with revealed former austenite grains after austenitizing within 850–1200°C. Etched, light microscopy. (a) TA = 850°C. (b) TA = 900°C. (c) TA = 950°C. (d) TA = 1000°C. (e) TA = 1050°C. (f) TA = 1100°C. (g) TA = 1150°C. (h) TA = 1200°C. Distributions of average former austenite grain diameters for the melt 4 after austenitizing within 850–1200°C. (a) TA = 850°C. (b) TA = 900°C. (c) TA = 950°C. (d) TA = 1000°C. (e) TA = 1050°C. (f) TA = 1100°C. (g) TA = 1150°C. (h) TA = 1200°C.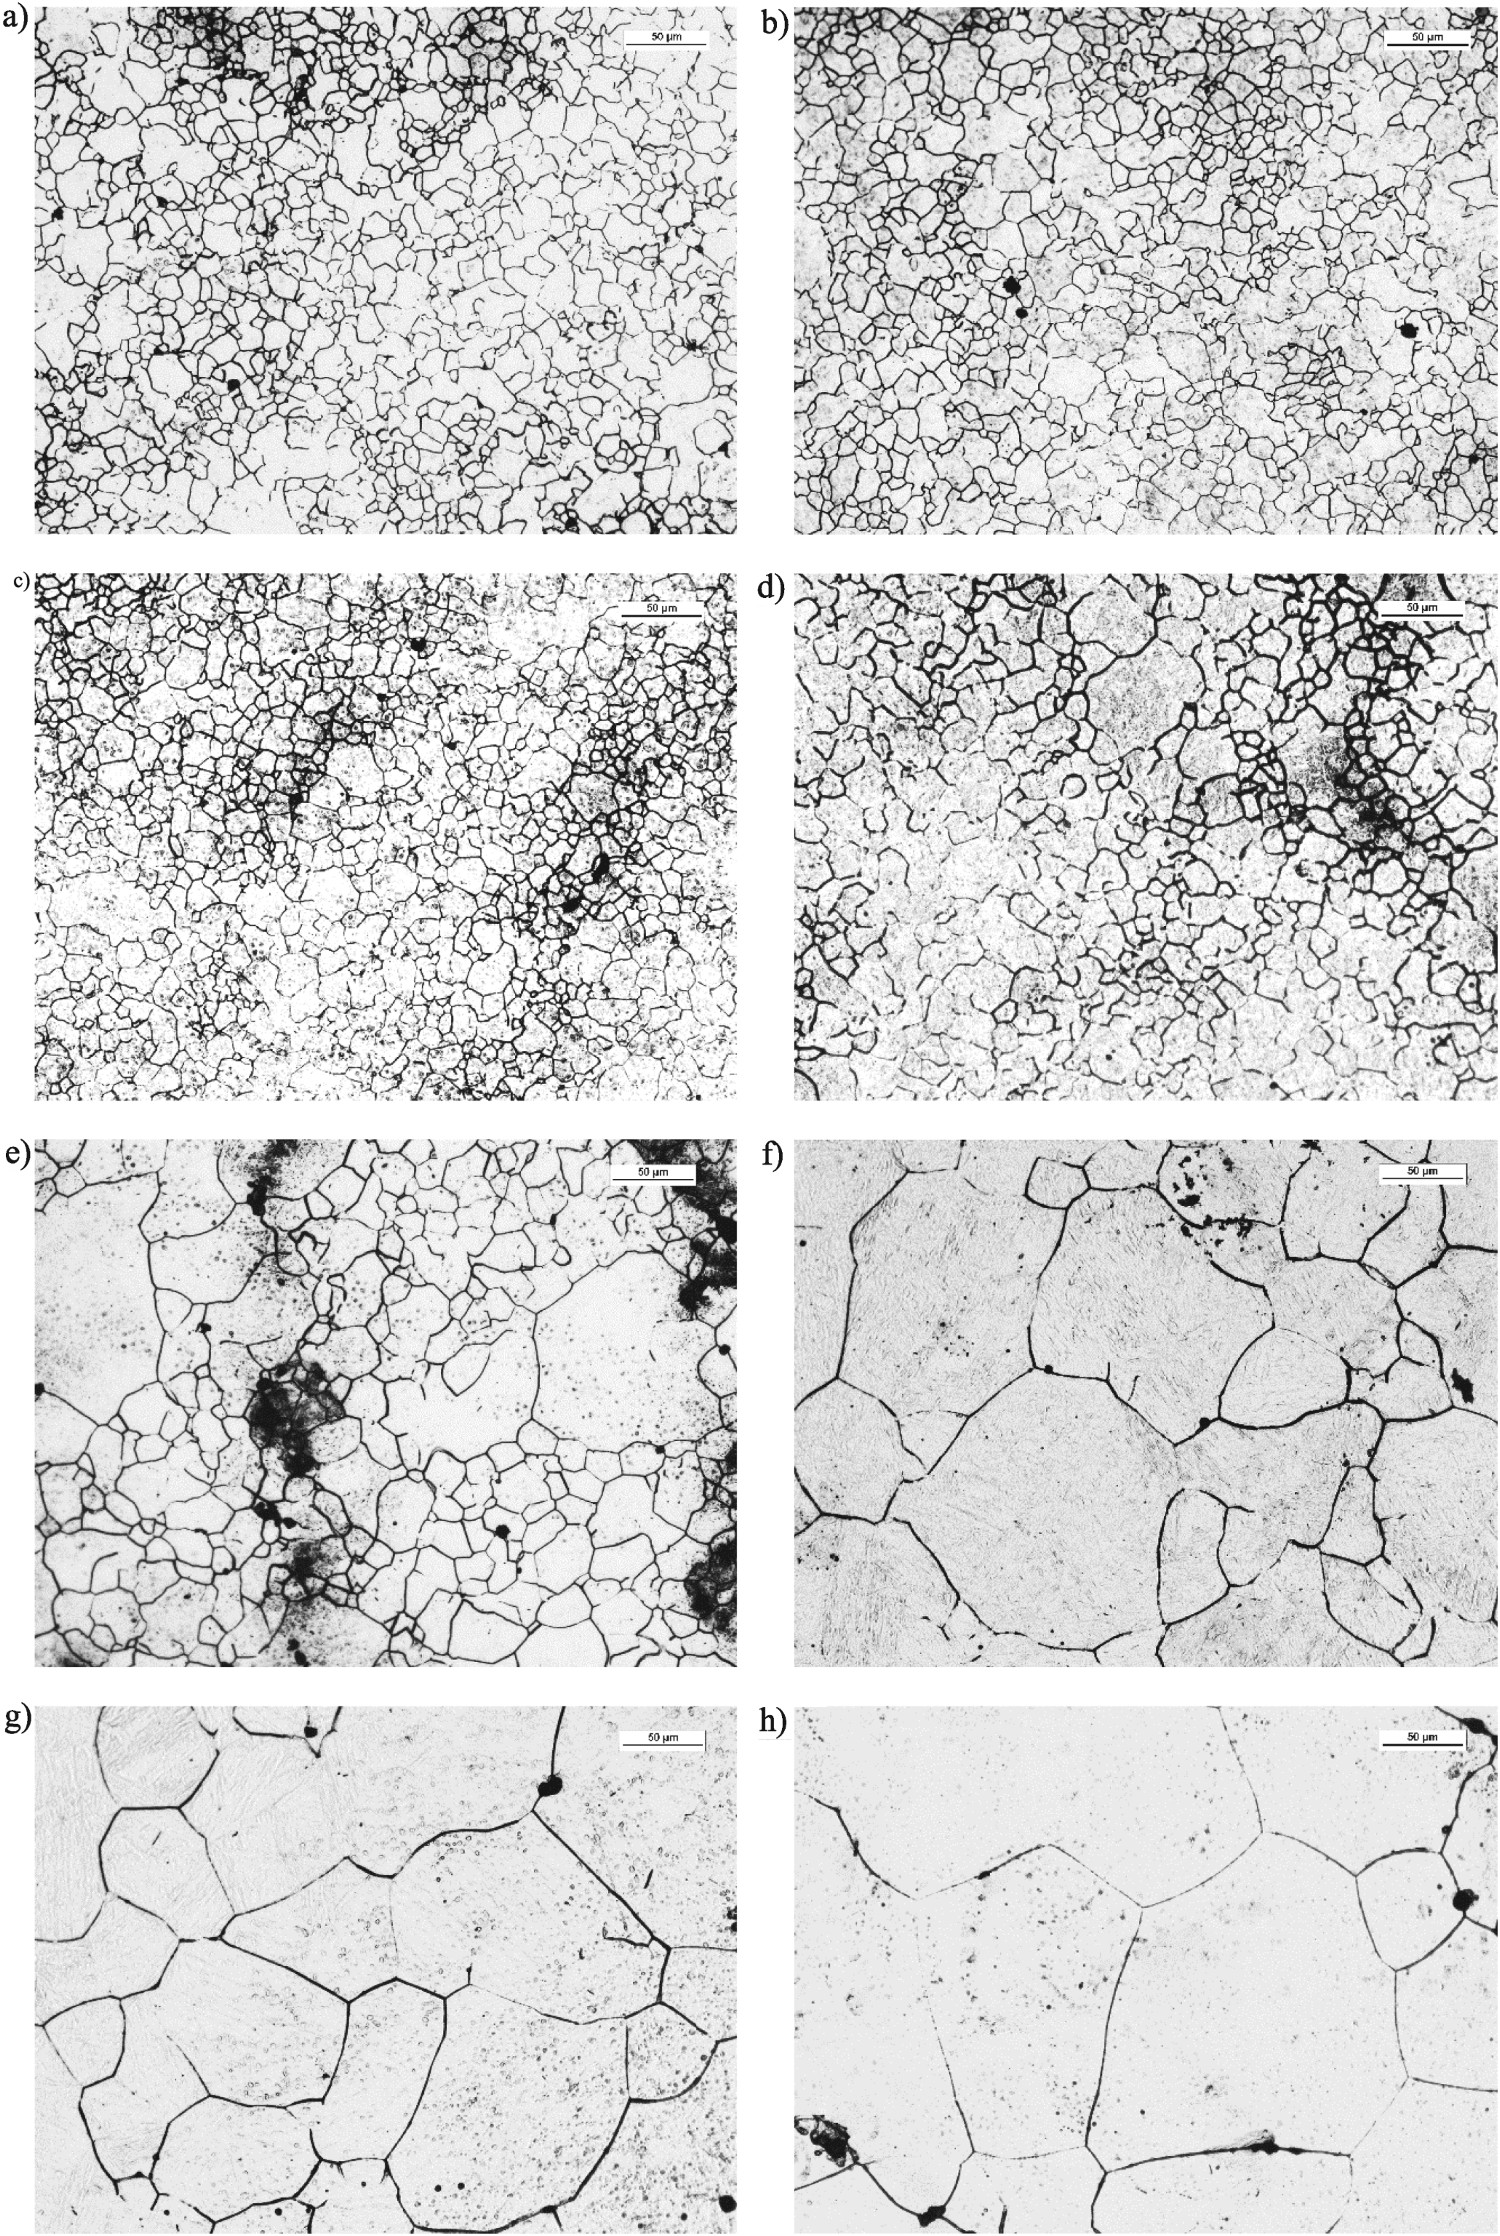
Melts 5 and 6
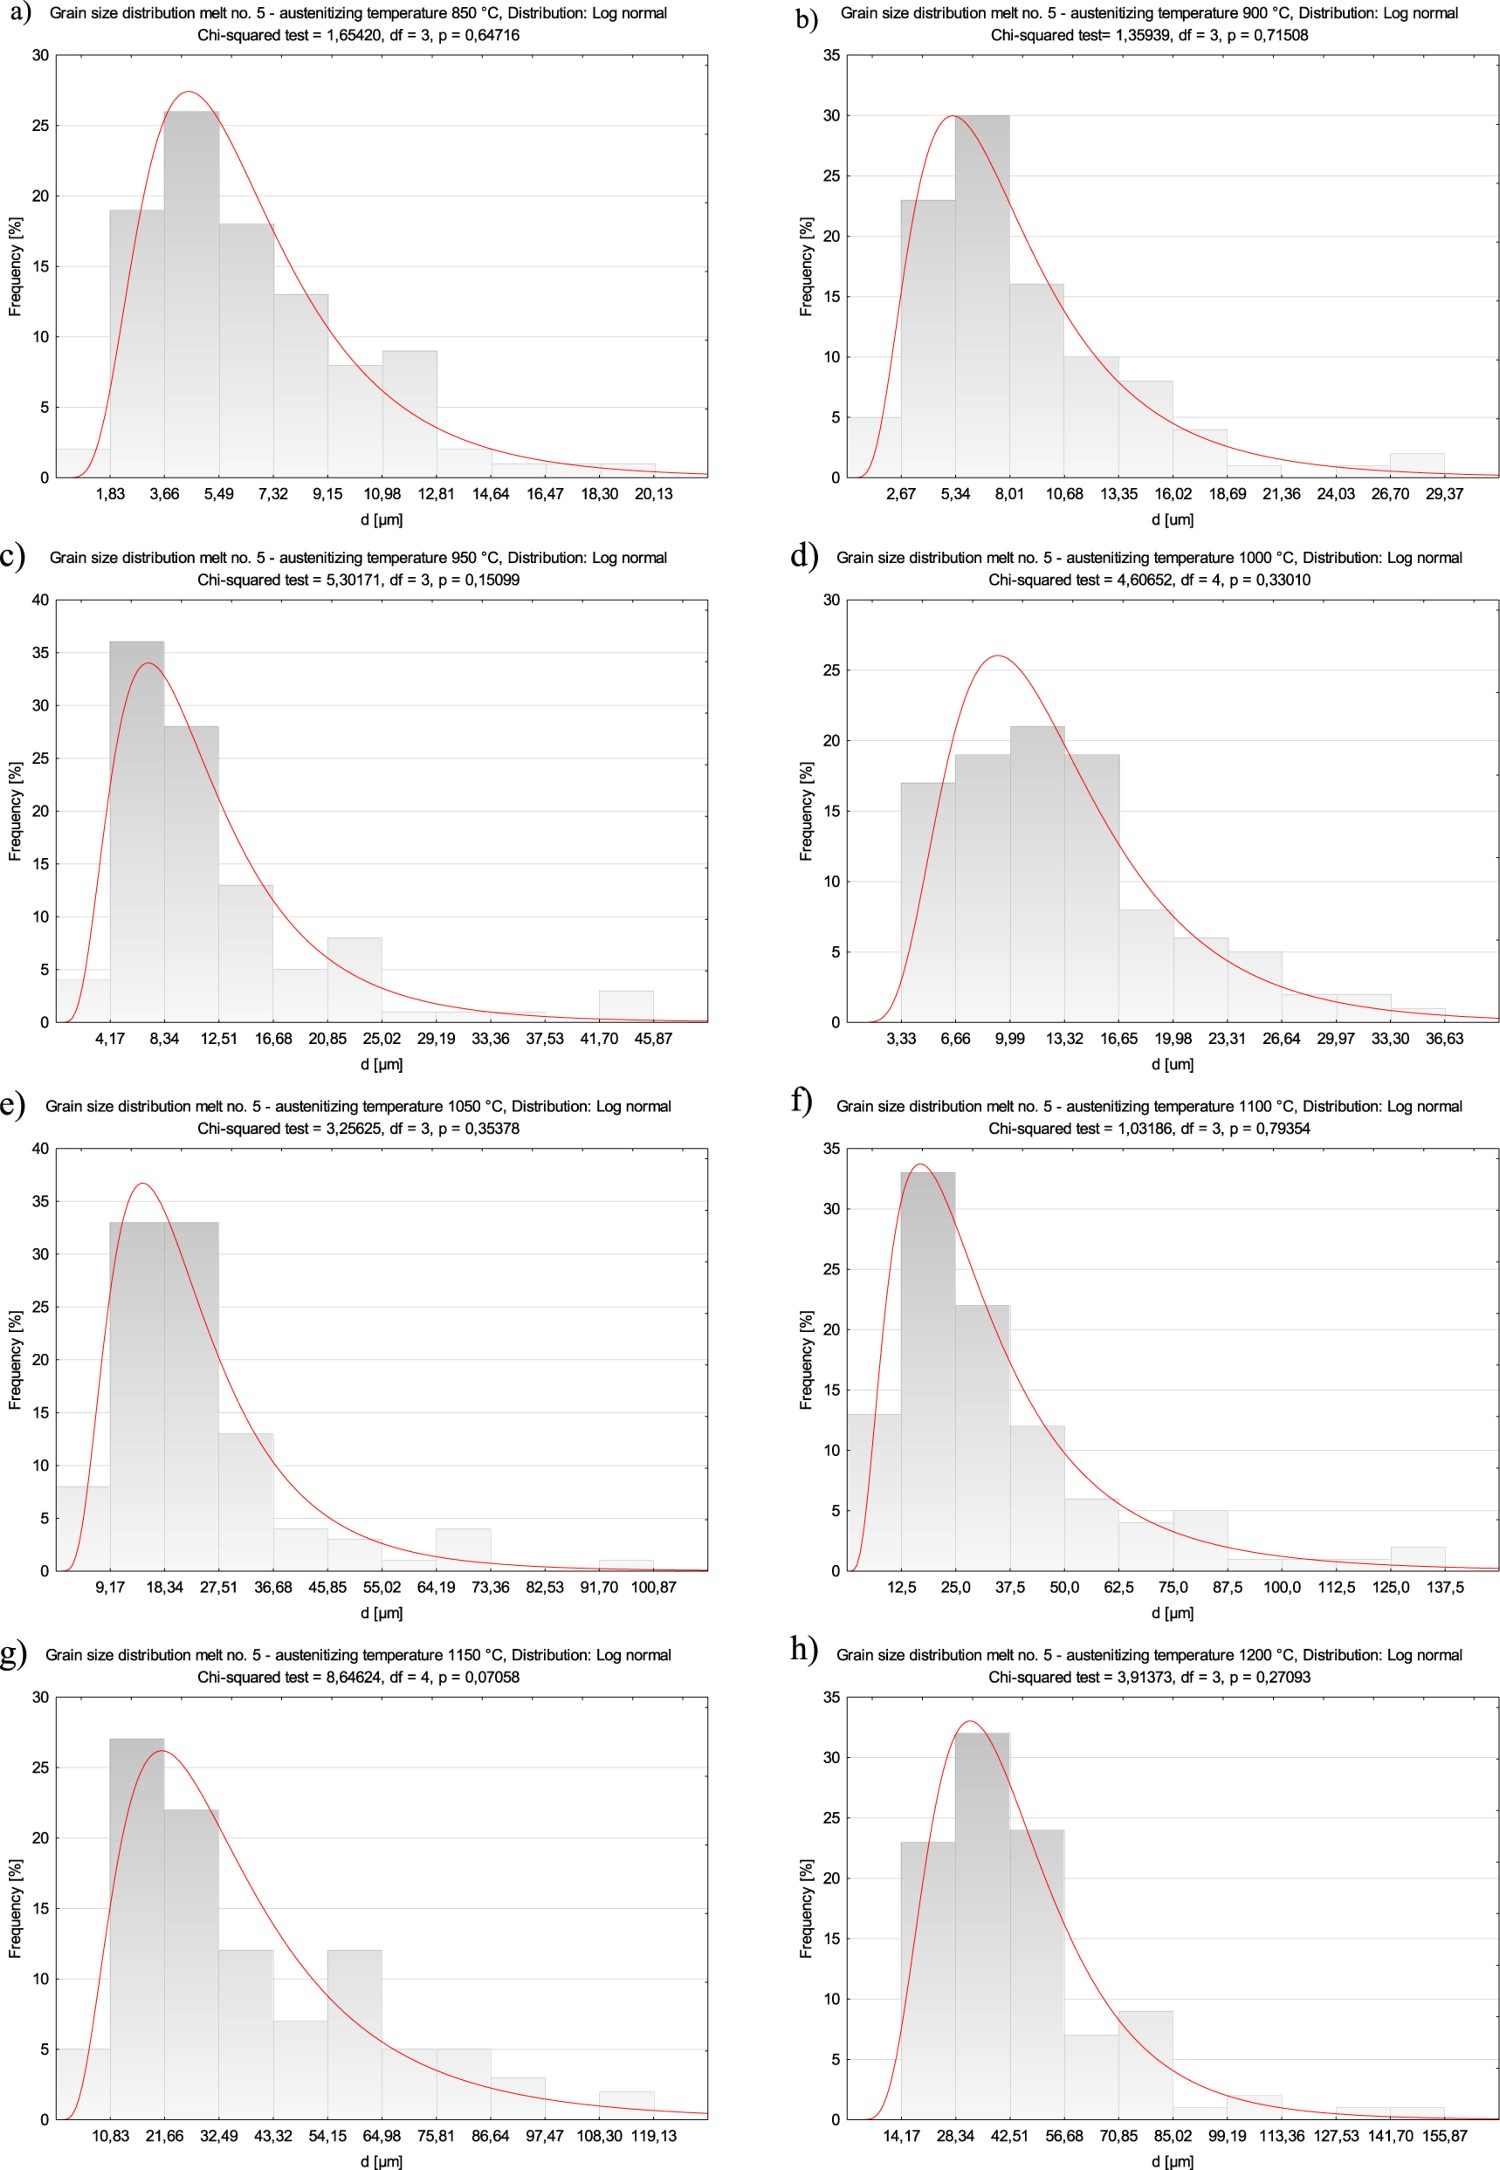
In addition to chromium, the melts 5 and 6 contained vanadium as the alloying element. Moreover, the melt 5 contained boron, but the melt 6, similar with respect to chemical composition, did not contain it. In comparison to the melt 3 with similar chemical composition but not containing vanadium, the melt 5 showed after austenitizing at 850°C smaller and more uniform grains (Figure 10(a)). Minimum diameter of former austenite grains was 1.71 µm and maximum diameter reached ca. 20 µm, see Figure 1(e). After austenitizing at 900°C, no significant structural changes occurred (Figure 10(b)). Significant changes of grain sizes were observed after austenitizing at 950°C only and the parameter values like minimum and maximum grain diameters in the melt 5 became close to those in the melt 3 after austenitizing at the same temperature, see Figure 1(e). Abnormal growth of some grains is clearly visible in Figure 10(c). Such growth was more intensive after austenitizing at 1000°C, where the structure components were clearly divided to abnormal grains and the surrounding colonies of smaller grains (Figure 10(d)). However, the abnormal grains were not so large as those in the melt 3. Even clearer division of the structure components to large abnormal grains and their surrounding colonies of fine grains in the melt 5 occurred after austenitizing at 1050°C (Figure 10(e)). Further growth of abnormal grains occurred after austenitizing at 1100°C (Figure 10(f)) and the entire structure was clearly coarse-grained. Like it was for the melt 3, austenitization of the melt 5 at the two highest temperatures did not cause big qualitative or quantitative changes (Figure 10(g) and (h)). However, it should be remembered that the melt 5 was generally characterized by smaller grains than the melt 3, see Figure 1(e). All the empirical grain size distributions could be approximated by the log-normal distribution (Figure 11). Microstructures of the melt 5 with revealed former austenite grains after austenitizing within 850–1200°C. Etched, light microscopy. (a) TA = 850°C. (b) TA = 900°C. (c) TA = 950°C. (d) TA = 1000°C. (e) TA = 1050°C. (f) TA = 1100°C. (g) TA = 1150°C. (h) TA = 1200°C. Distributions of average former austenite grain diameters for the melt 5 after austenitizing within 850–1200°C. (a) TA = 850°C. (b) TA = 900°C. (c) TA = 950°C. (d) TA = 1000°C. (e) TA = 1050°C. (f) TA = 1100°C. (g) TA = 1150°C. (h) TA = 1200°C.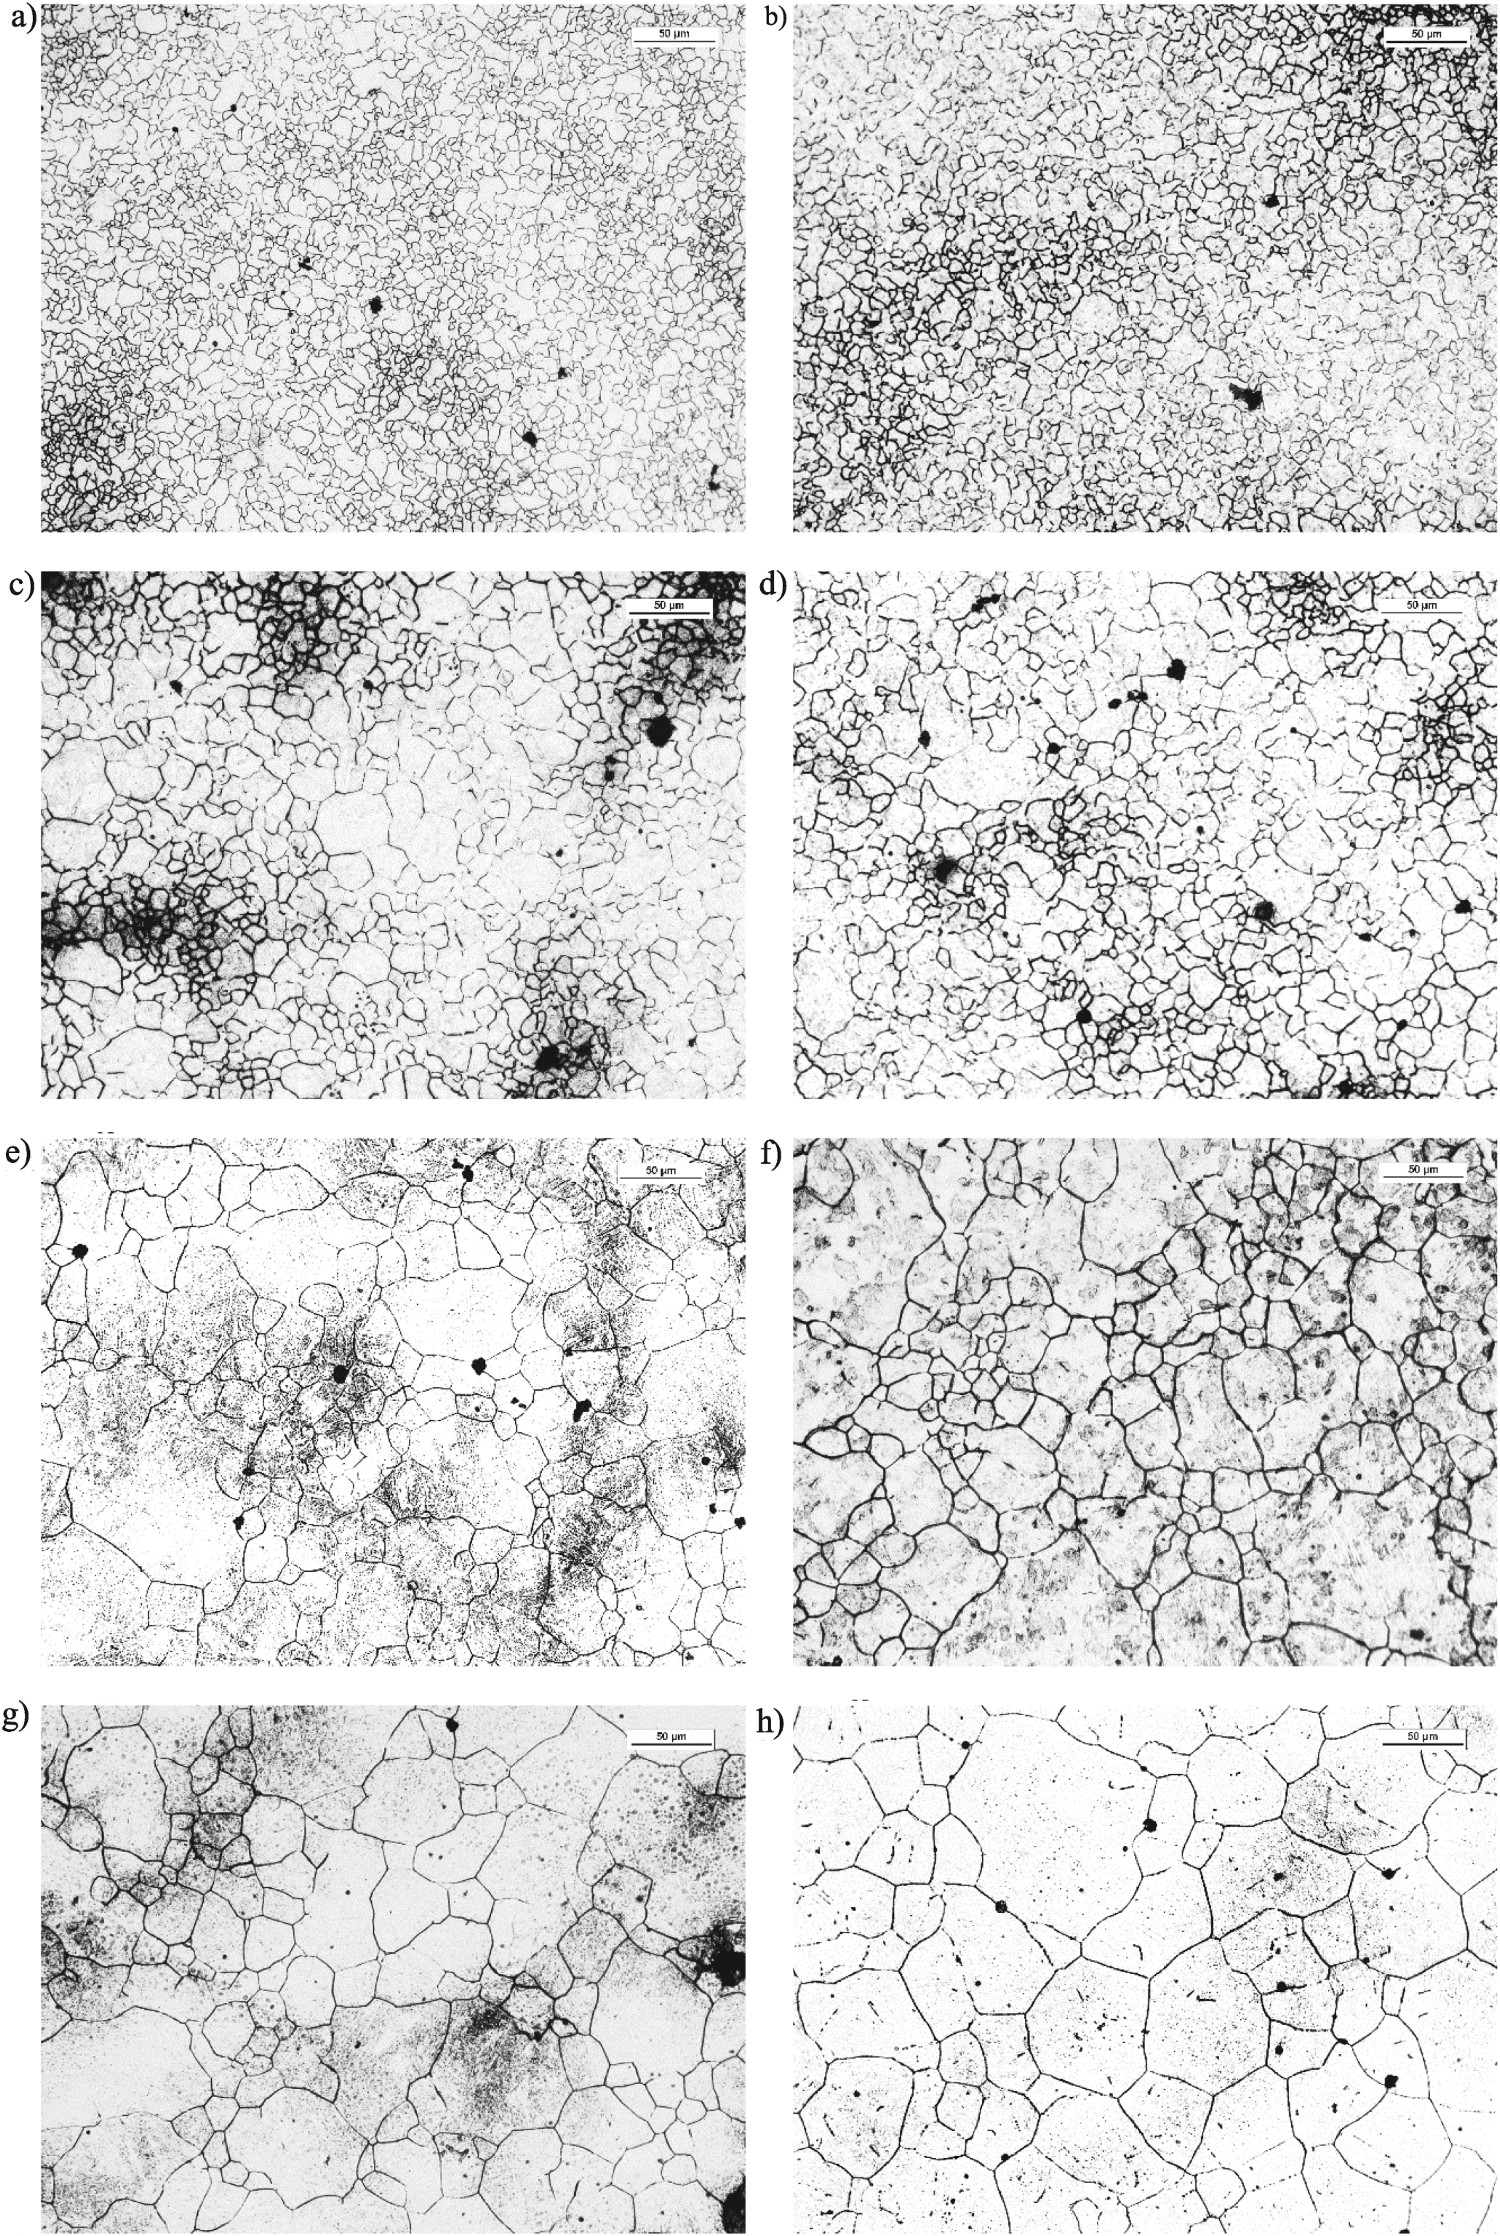
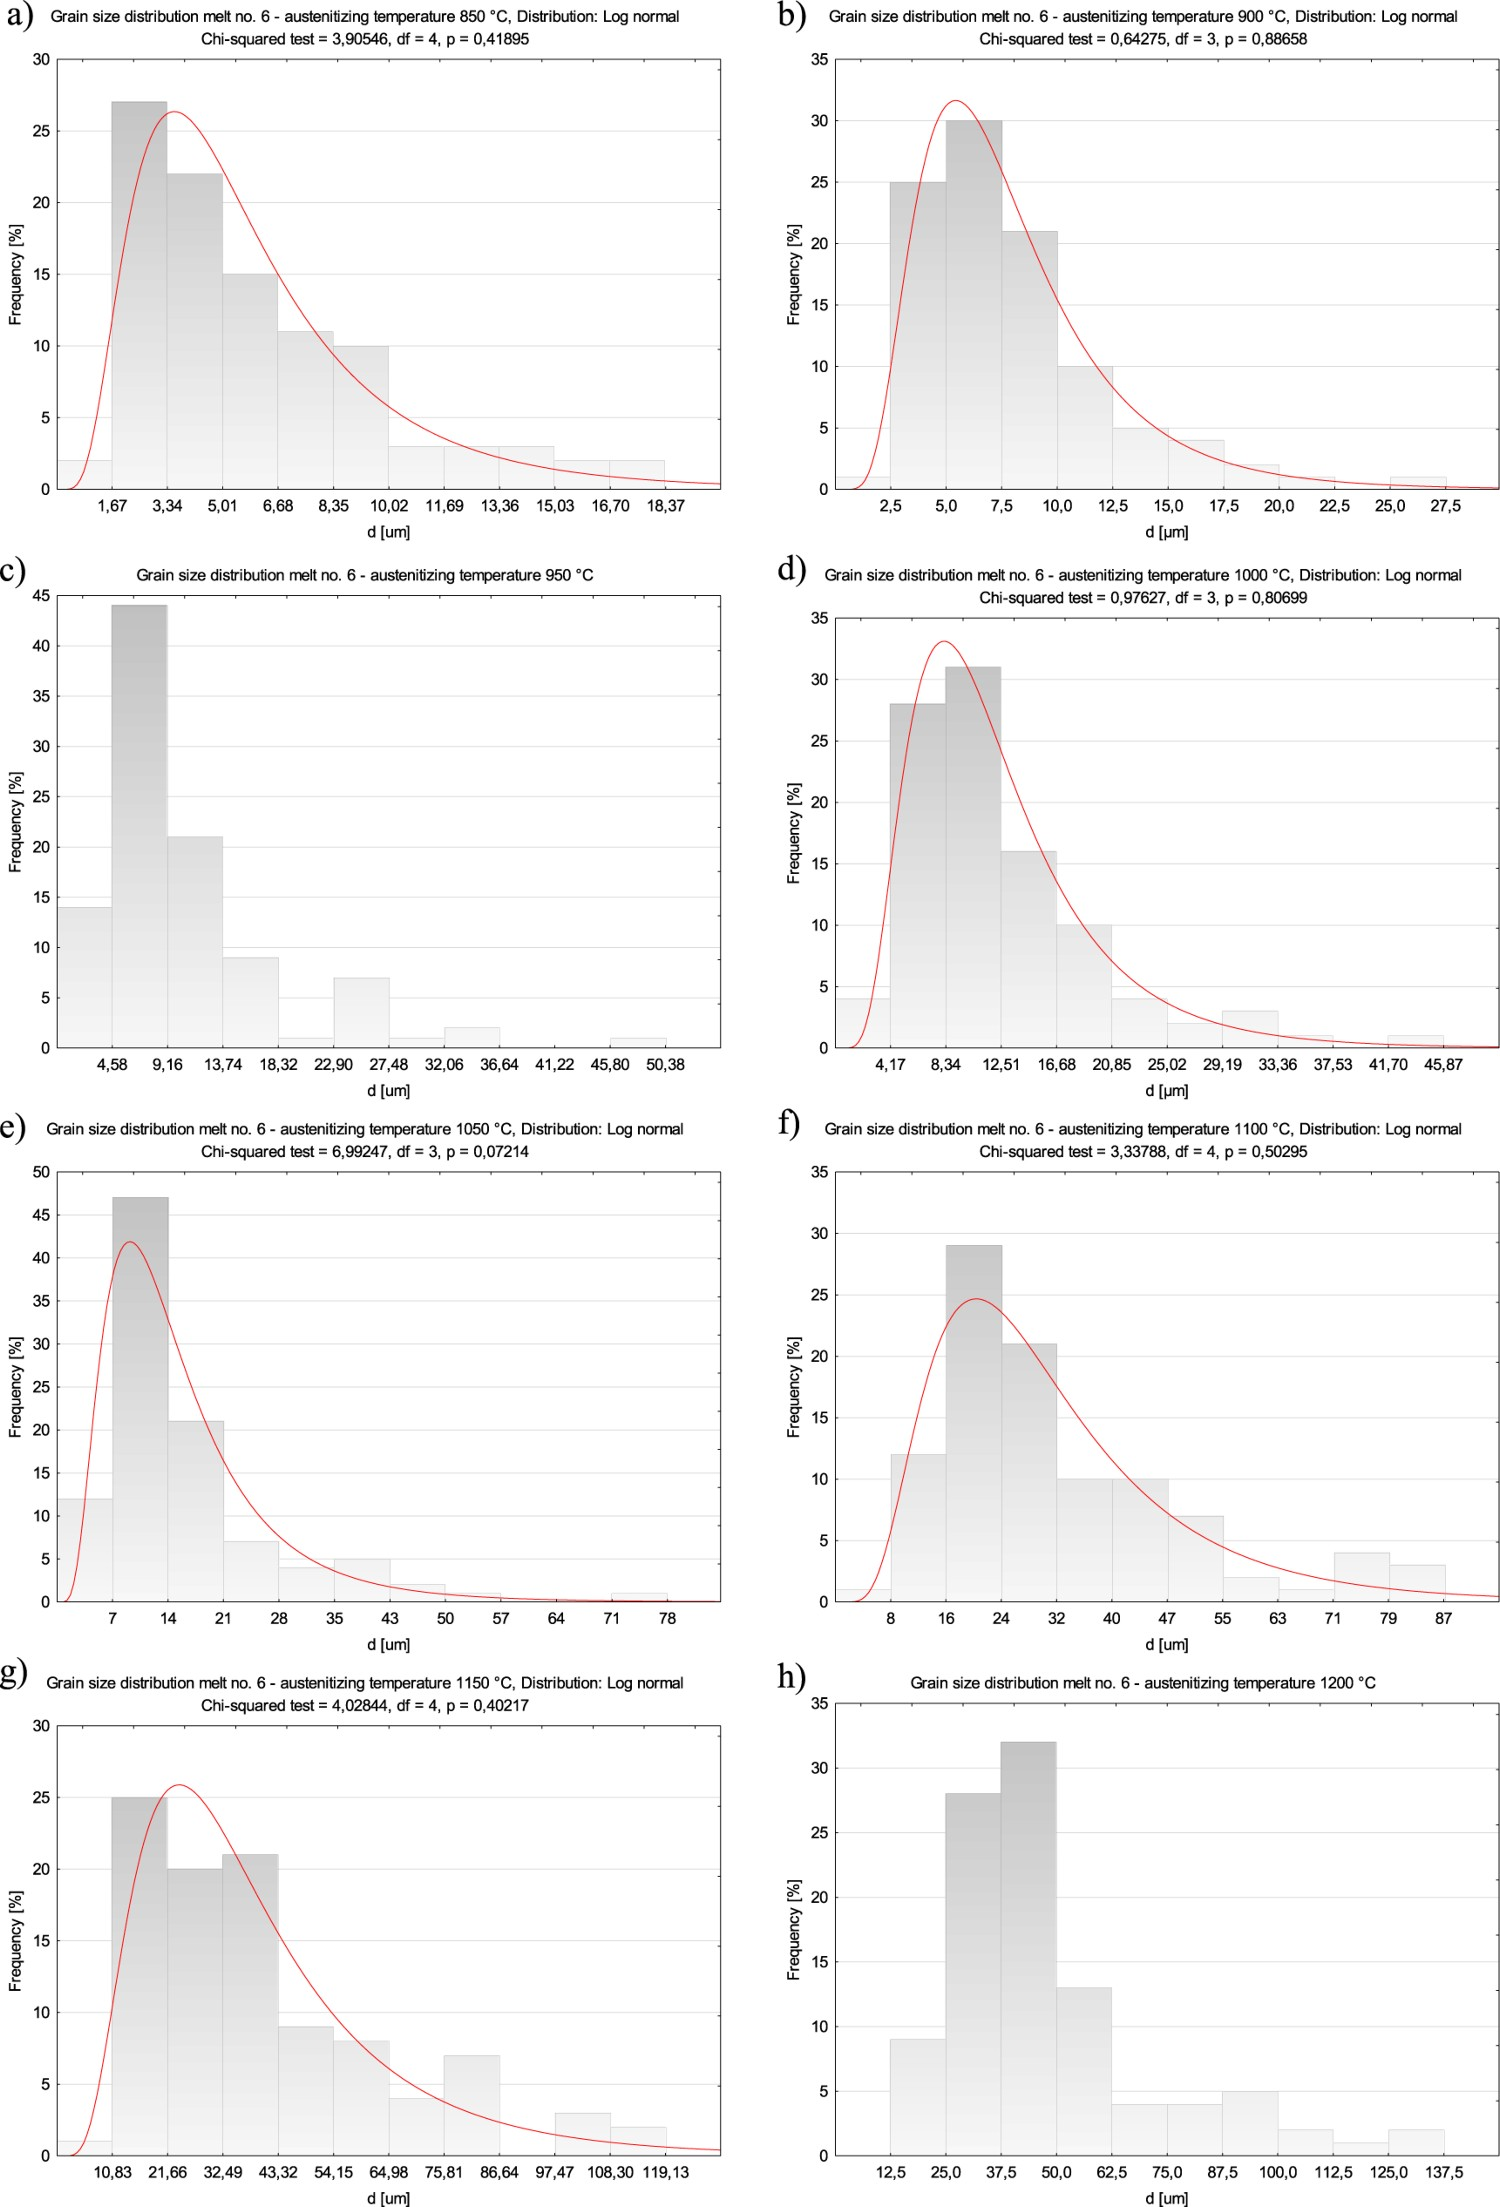
Austenitization of the melt 6 at temperatures from 850°C to 1000°C resulted in similar structural changes as those observed in the melt 5 (Figures 12(a–d)), and so in similar values of average, minimum and maximum grain diameters, see Figure 1(f). Therefore, no significant effect of boron on austenite grain size after austenitizing at these temperatures was observed. Visible structural changes appeared after austenitizing at 1050°C only. Abnormal grains in structure of the melt 6 were smaller and less numerous, see Figure 12(e) and empirical distribution in Figure 13(e). The surrounding fine grains were the smallest among all the melts analysed before, see Figure 1(f). Austenitization at 1100°C intensified grain growth, concerning especially the fine grains aggregated in colonies (Figure 12(f)), as well as the average grain diameter that was twice as big as that for the temperature 1050°C and became close to that observed in the melt 5 after austenitizing at the same temperature, see Figure 1(f). It should be noted, however, that about 70% of grains in the melt 6 were equal or smaller than the average size (Figure 12(f)). Austenitization at 1150°C and 1200°C resulted in further grain growth and the structures became similar to those obtained for the boron-containing melt (Figure 12(g) and (h)). Microstructures of the melt 6 with revealed former austenite grains after austenitizing within 850–1200°C. Etched, light microscopy. (a) TA = 850°C. (b) TA = 900°C. (c) TA = 950°C. (d) TA = 1000°C. (e) TA = 1050°C. (f) TA = 1100°C. (g) TA = 1150°C. (h) TA = 1200°C. Distributions of average former austenite grain diameters for the melt 6 after austenitizing within 850–1200°C. (a) TA = 850°C. (b) TA = 900°C. (c) TA = 950°C. (d) TA = 1000°C. (e) TA = 1050°C. (f) TA = 1100°C. (g) TA = 1150°C. (h) TA = 1200°C.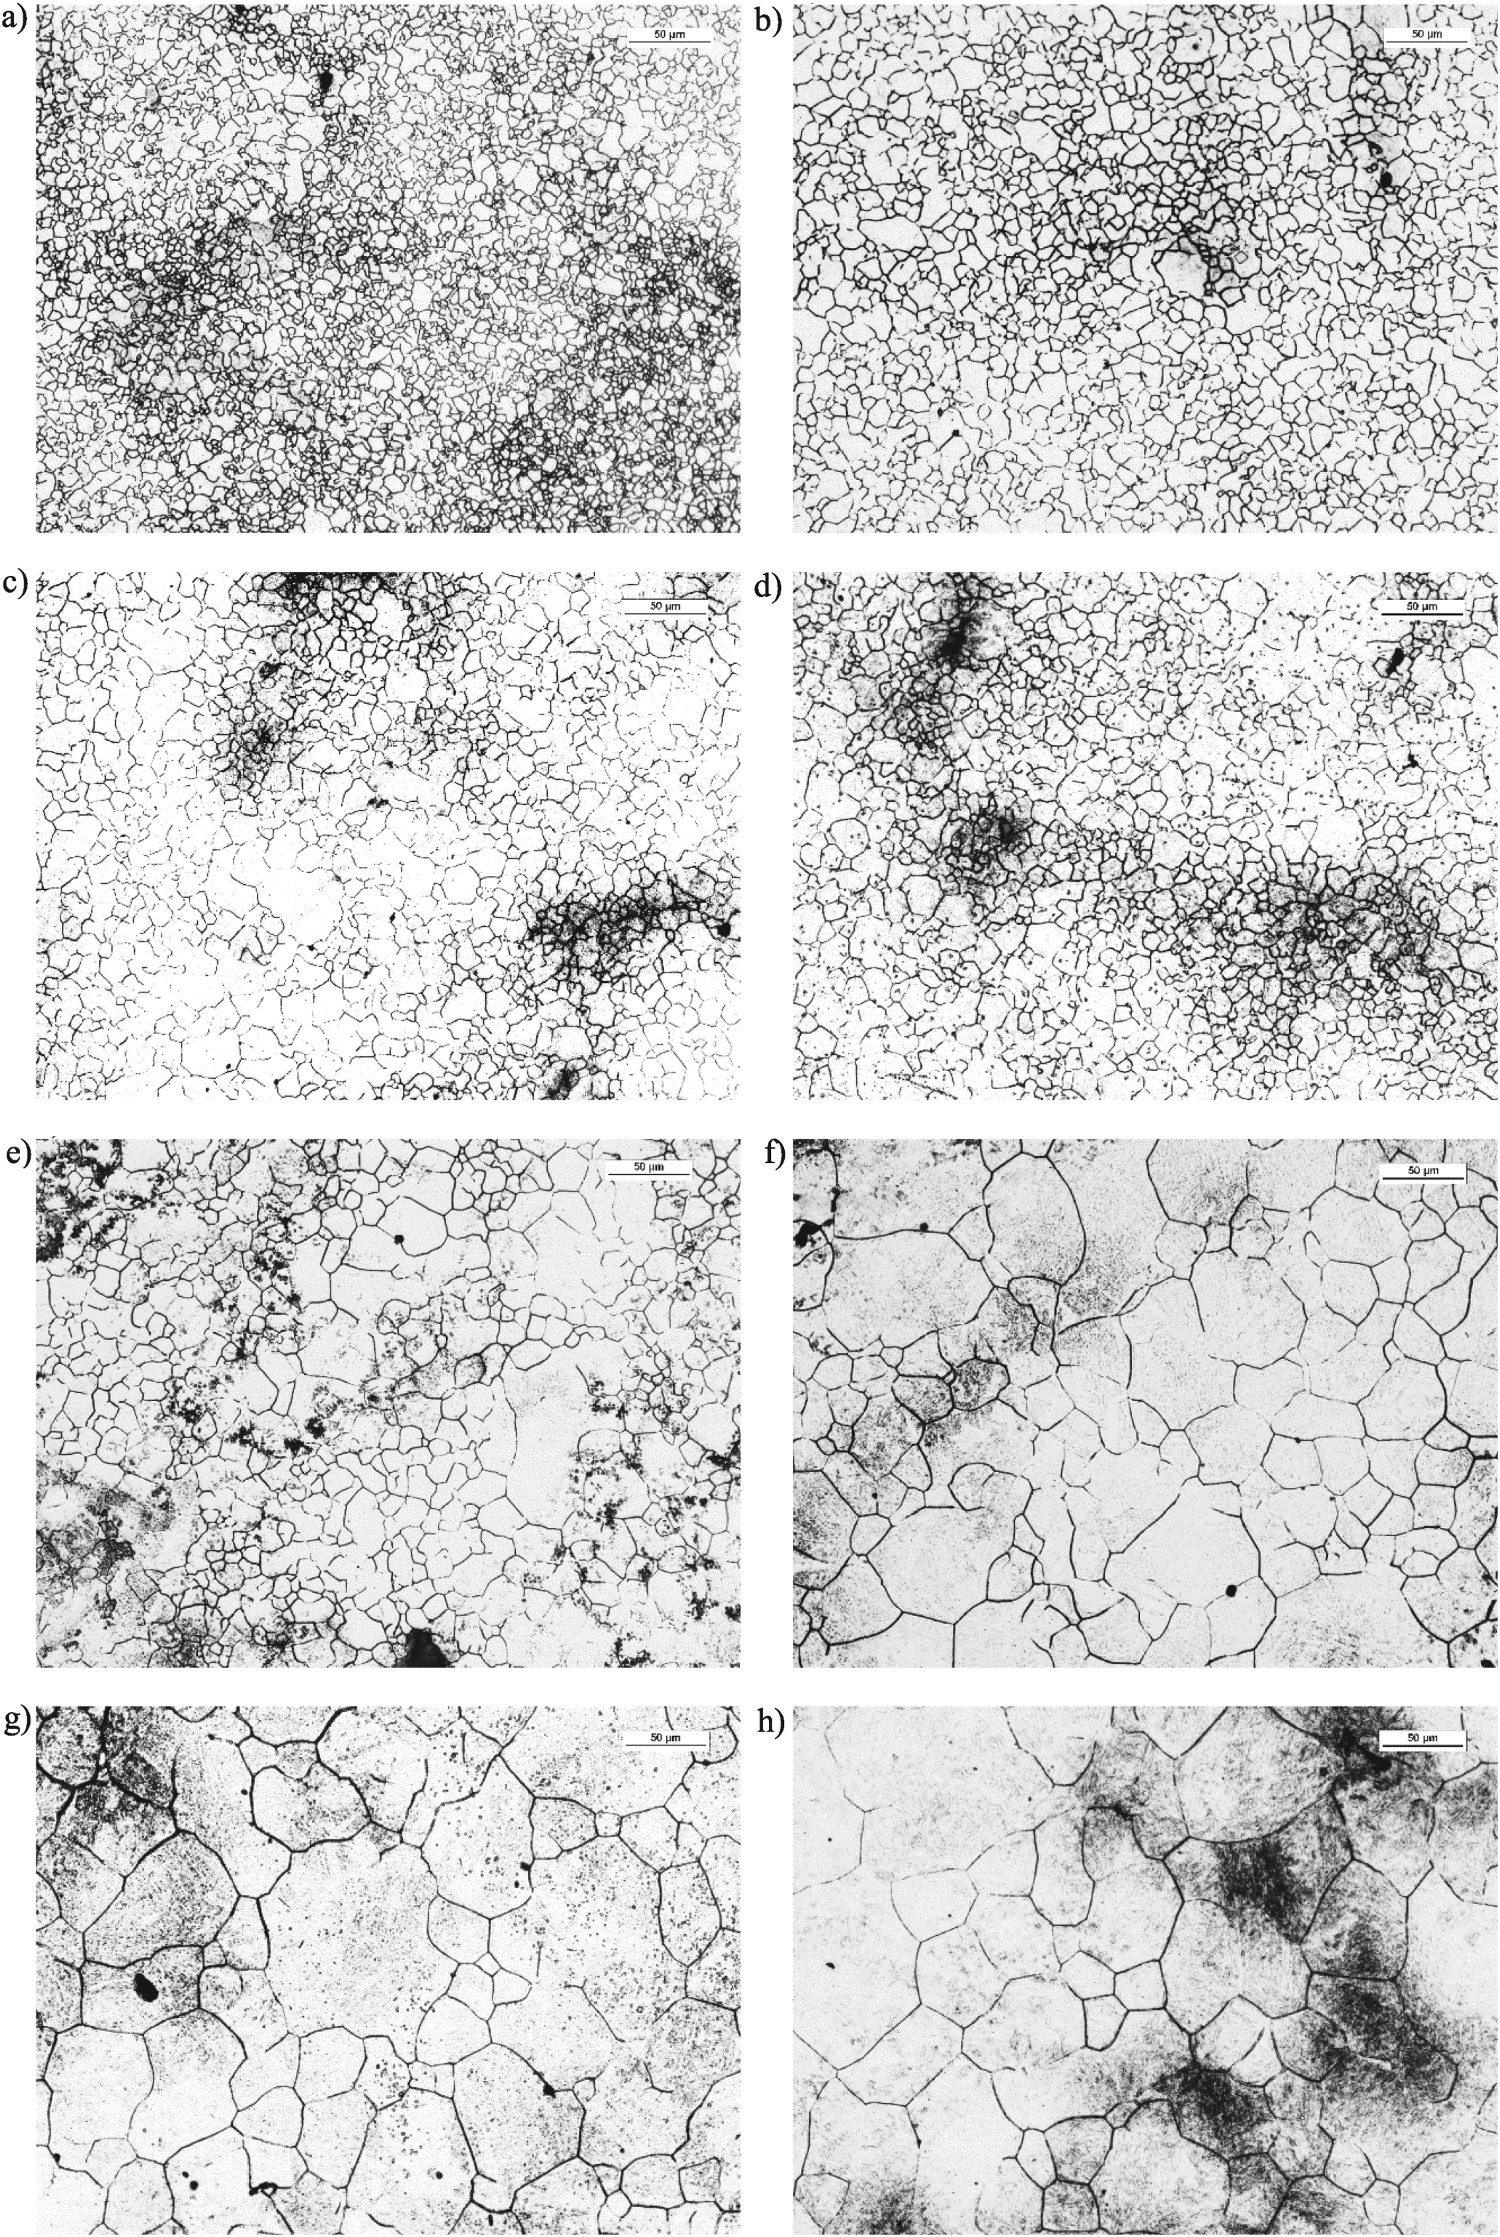
Melts 7 and 8
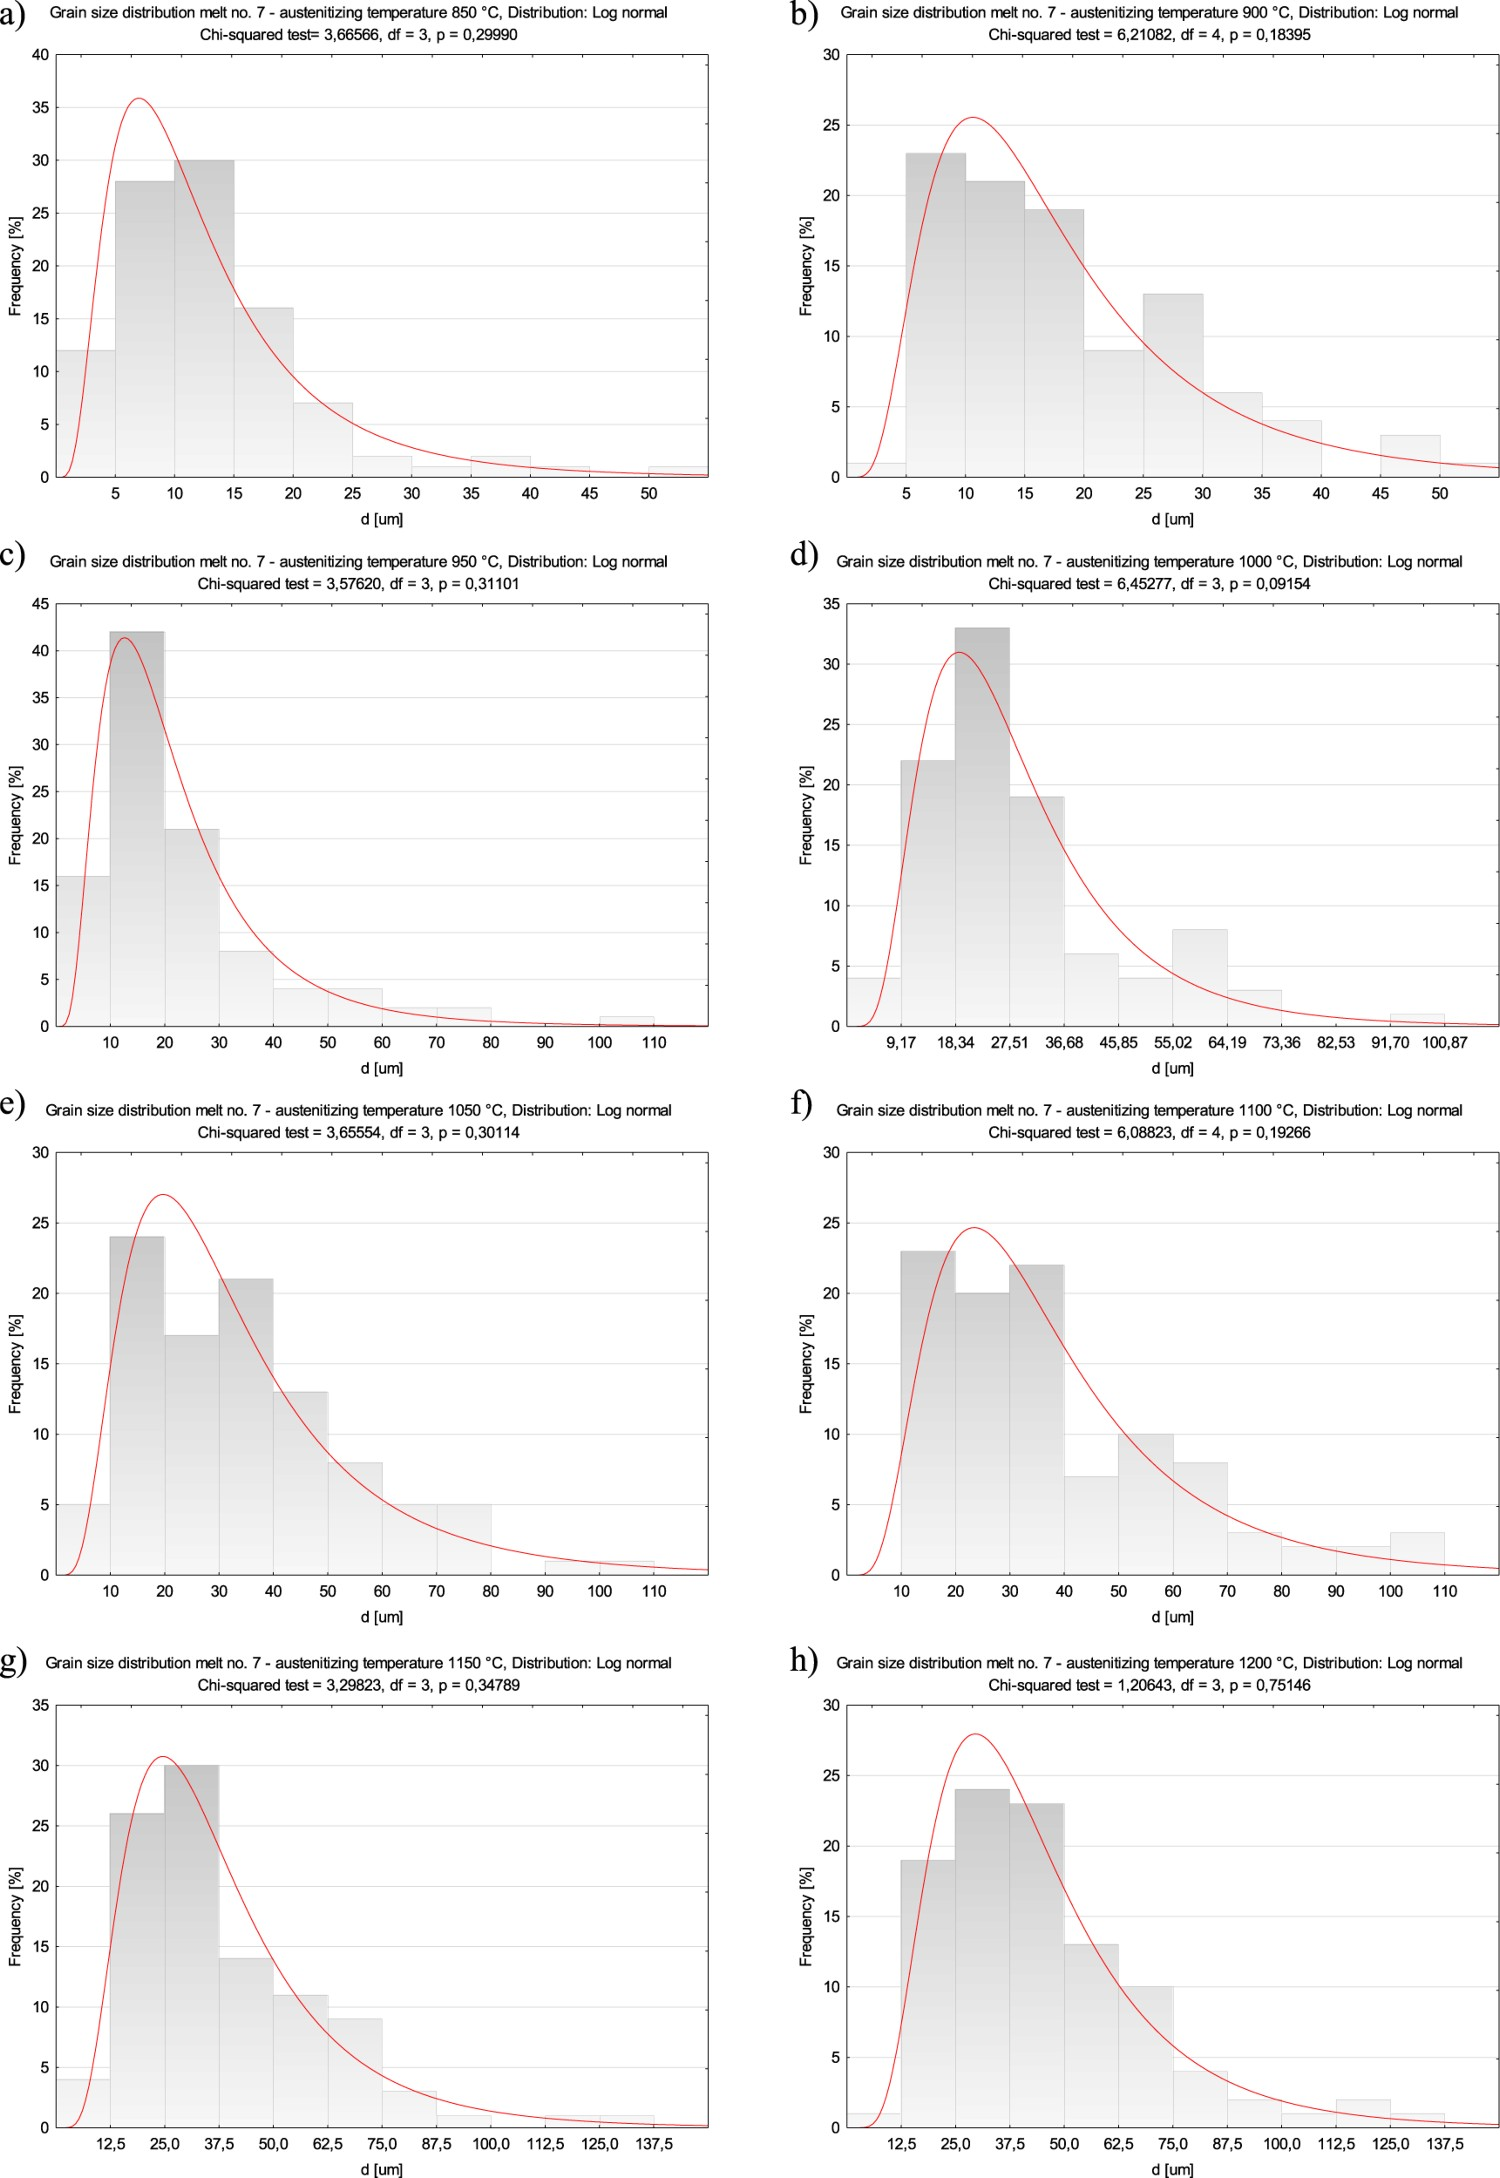
After austenitizing at the lowest temperature, the melt 7 was characterized by quite large, irregular grain (Figure 14(a)), even though, in addition to boron, it contained 0.019% titanium, see Table 1. The structure included abnormal grains surrounded with colonies of smaller grains. Very fine grains with diameters below 5 µm accounted for ca. 12% only (Figure 15(a)). Austenitization at 900°C and 950°C resulted in growth of abnormal grains with diameters even over 100 µm (Figure 1(g)), which developed at the expense of colonies of finer grains (Figure 14(b) and (c)). Values of average and maximum grain diameters obtained after austenitizing at 950°C were smaller than those for the melt 1 after austenitizing at the same temperature, see Figure 1(g). It is worth to note that growth of abnormal grains and reduction of colonies of finer grains became less intensive at higher austenitization temperatures (Figure 14(d–h)). Admittedly, the medium-size grains still grew, but the grains after austenitizing at 1200°C were only 55% larger than those after austenitizing at 1000°C. All the empirical grain size distributions could be approximated by the log-normal distribution (Figure 15). Microstructures of the melt 7 with revealed former austenite grains after austenitizing within 850–1200°C. Etched, light microscopy. (a) TA = 850°C. (b) TA = 900°C. (c) TA = 950°C. (d) TA = 1000°C. (e) TA = 1050°C. (f) TA = 1100°C. (g) TA = 1150°C. (h) TA = 1200°C. Distributions of average former austenite grain diameters for the melt 7 after austenitizing within 850–1200°C. (a) TA = 850°C. (b) TA = 900°C. (c) TA = 950°C. (d) TA = 1000°C. (e) TA = 1050°C. (f) TA = 1100°C. (g) TA = 1150°C. (h) TA = 1200°C.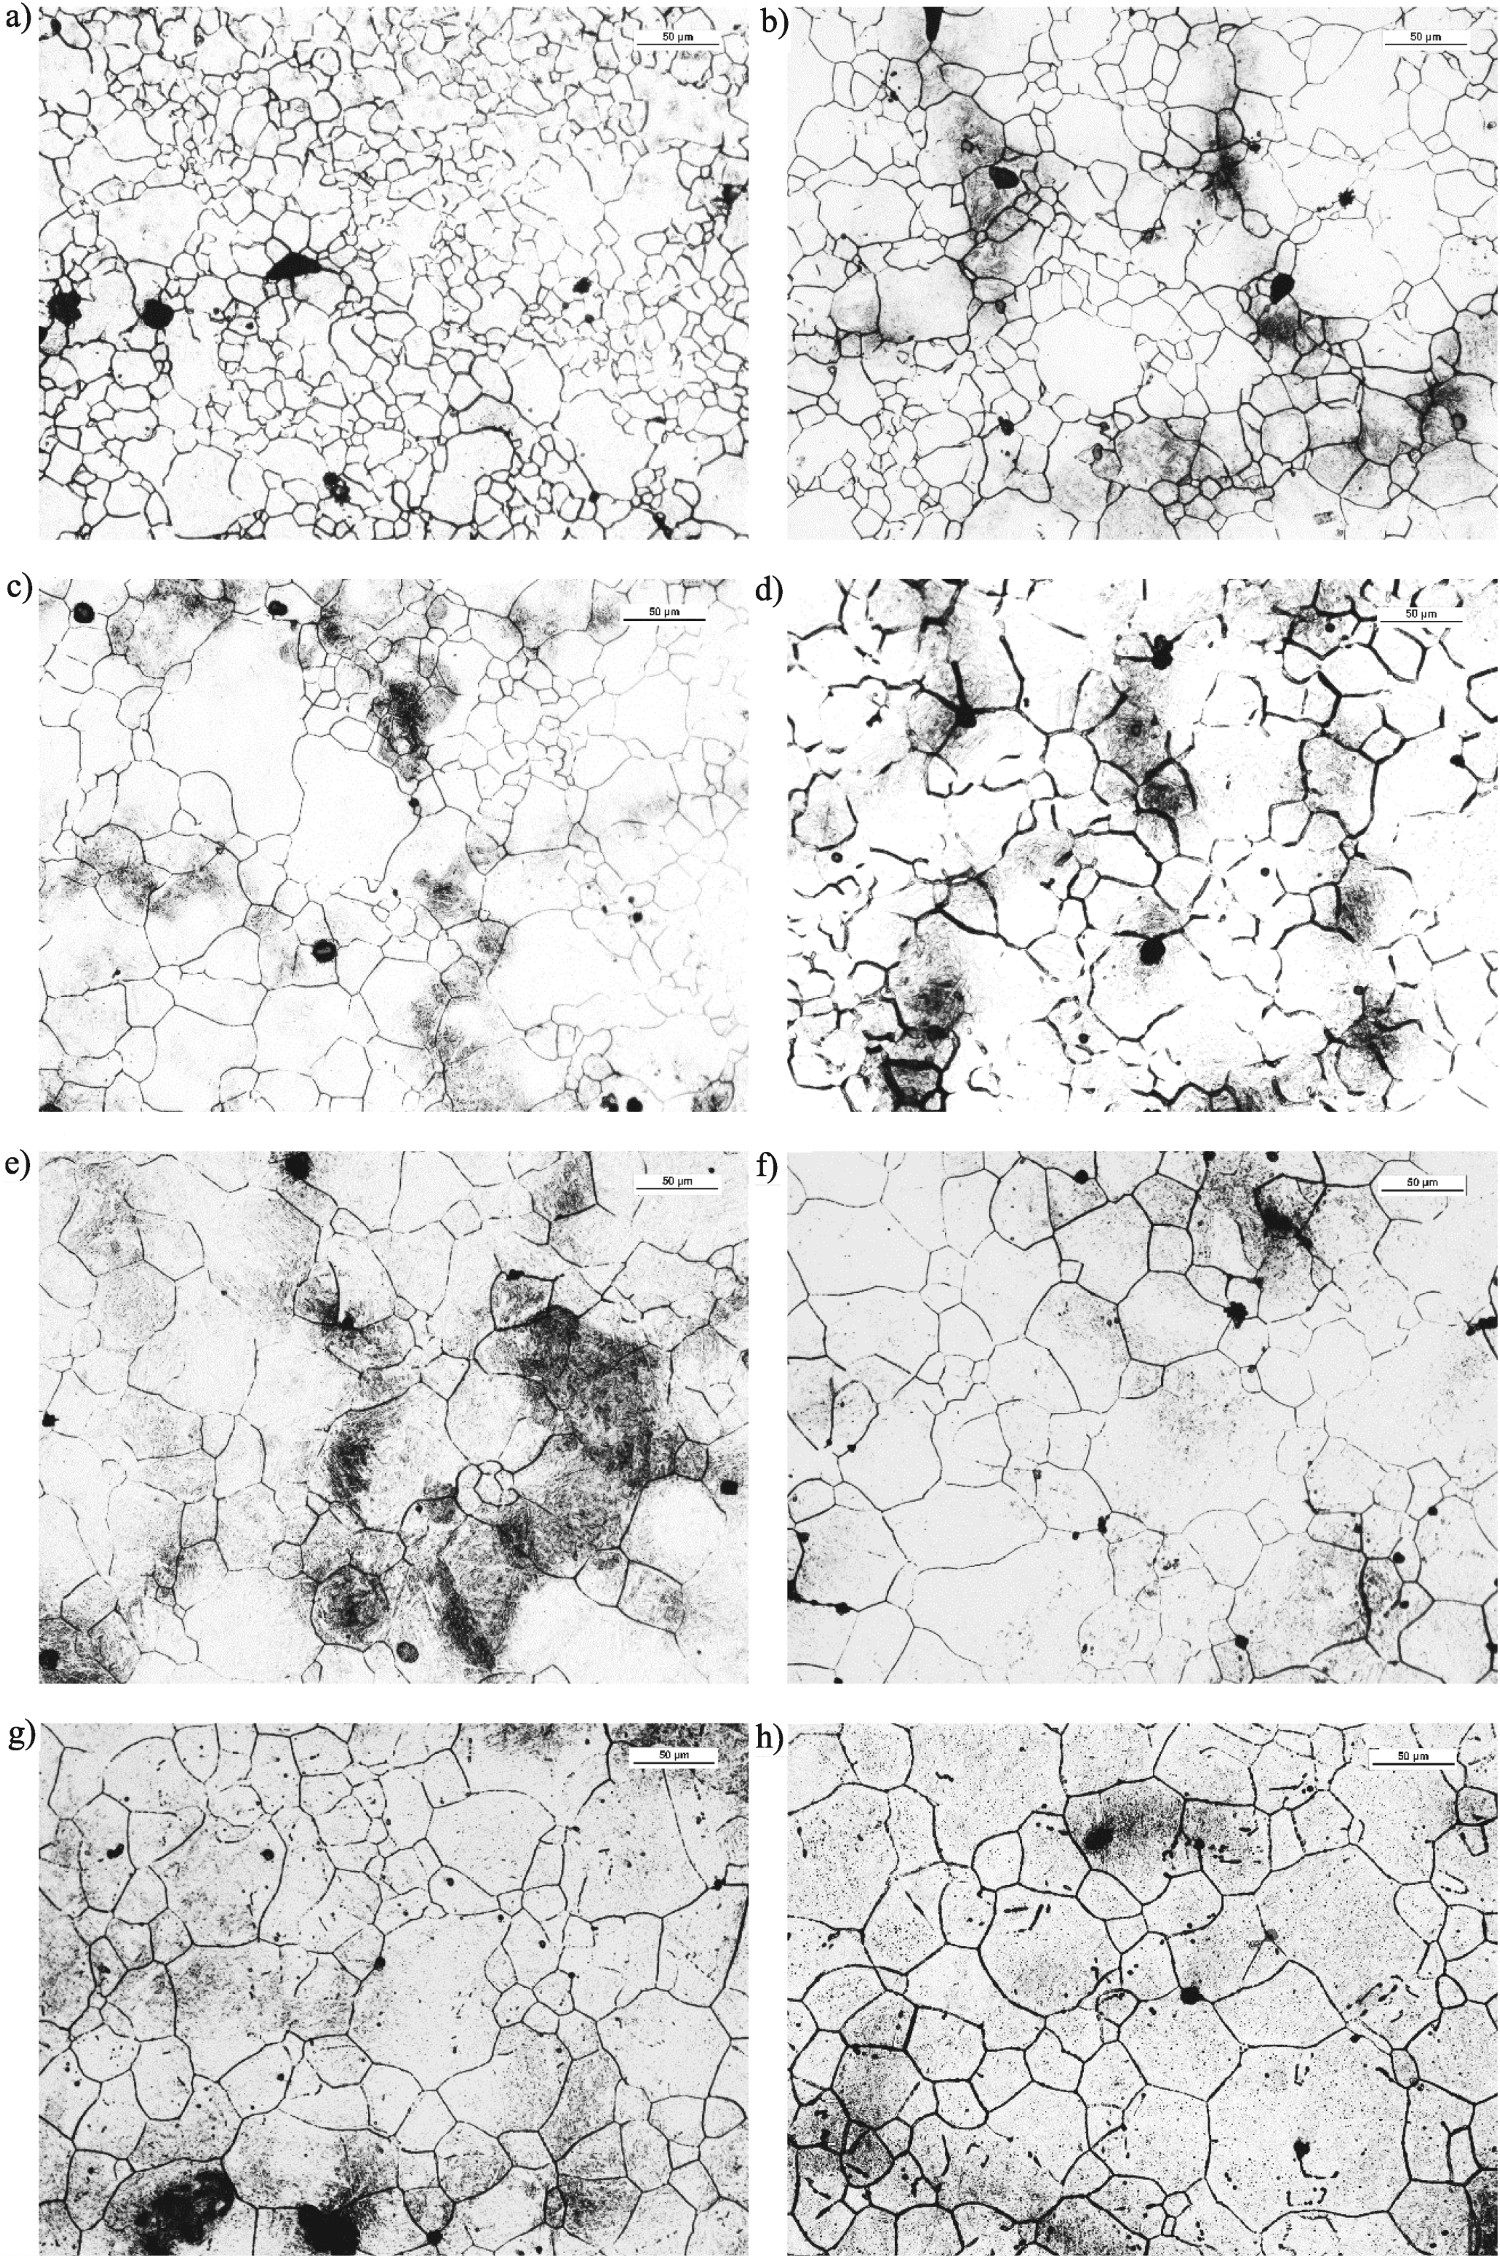
Chemical composition of the melt 8 included titanium as the alloying element, see Table 1. Even after austenitizing at 850°C it could be found that its grain was fine and more uniform and its structure was similar to that obtained in the melt 5. First of all, no abnormal grains were found (Figure 16(a)) and the difference between the smallest and the biggest measured diameter amounted to ca. 19 µm, see Figure 1(g). Average grain diameter was ca. 7 µm, median was close to the average value and the measured minimum and maximum diameters were respectively 1.39 and 20.35 µm. Similar structures were found after soaking at 900 and 950°C, but growth of some grains occurred after austenitizing at 1000°C (Figure 16(d)). It results from the grain size distribution that the grains with diameters below ca. 10 µm accounted for 50% of the structure components, see Figures 1(g) and 17(d). No significant structural changes were found after austenitizing at 1050°C. The average diameter was slightly larger (see Figure 1(g)) as a result of occurrence of some abnormal grains (Figure 16(e)) with maximum diameter of ca. 55.82 µm. Significant changes of grain size were observed after austenitizing at 1100°C only (Figure 16(f)), but the average grain diameter was the smallest among all the analysed melts, even if diameters of individual abnormal grains exceeded 100 µm (Figure 17(f)). Colonies of fine grains progressively disappeared and there remained 2% only of the grains with diameters below 10 µm. After austenitizing at the two highest temperatures, the structure was similar to that obtained in the melt 7 (Figure 16(g) and 16(h)). Growth of the abnormal grains was not so intensive, but their number increased as a consequence of consuming the smaller grains. The grains with diameters over 100 µm accounted for 3% of the structure components (Figure 17(g) and (h)). All the obtained empirical grain size distributions could be approximated by the log-normal distribution (Figure 17). Microstructures of the melt 8 with revealed former austenite grains after austenitizing within 850–1200°C. Etched, light microscopy. (a) TA = 850°C. (b) TA = 900°C. (c) TA = 950°C. (d) TA = 1000°C. (e) TA = 1050°C. (f) TA = 1100°C. (g) TA = 1150°C. (h) TA = 1200°C. Distributions of average former austenite grain diameters for the melt 8 after austenitizing within 850–1200°C. (a) Melt 1. (b) Melt 2. (c) Melt 3. (d) Melt 4. (e) Melt 5. (f) Melt 6. (g) Melt 7. (h) Melt 8.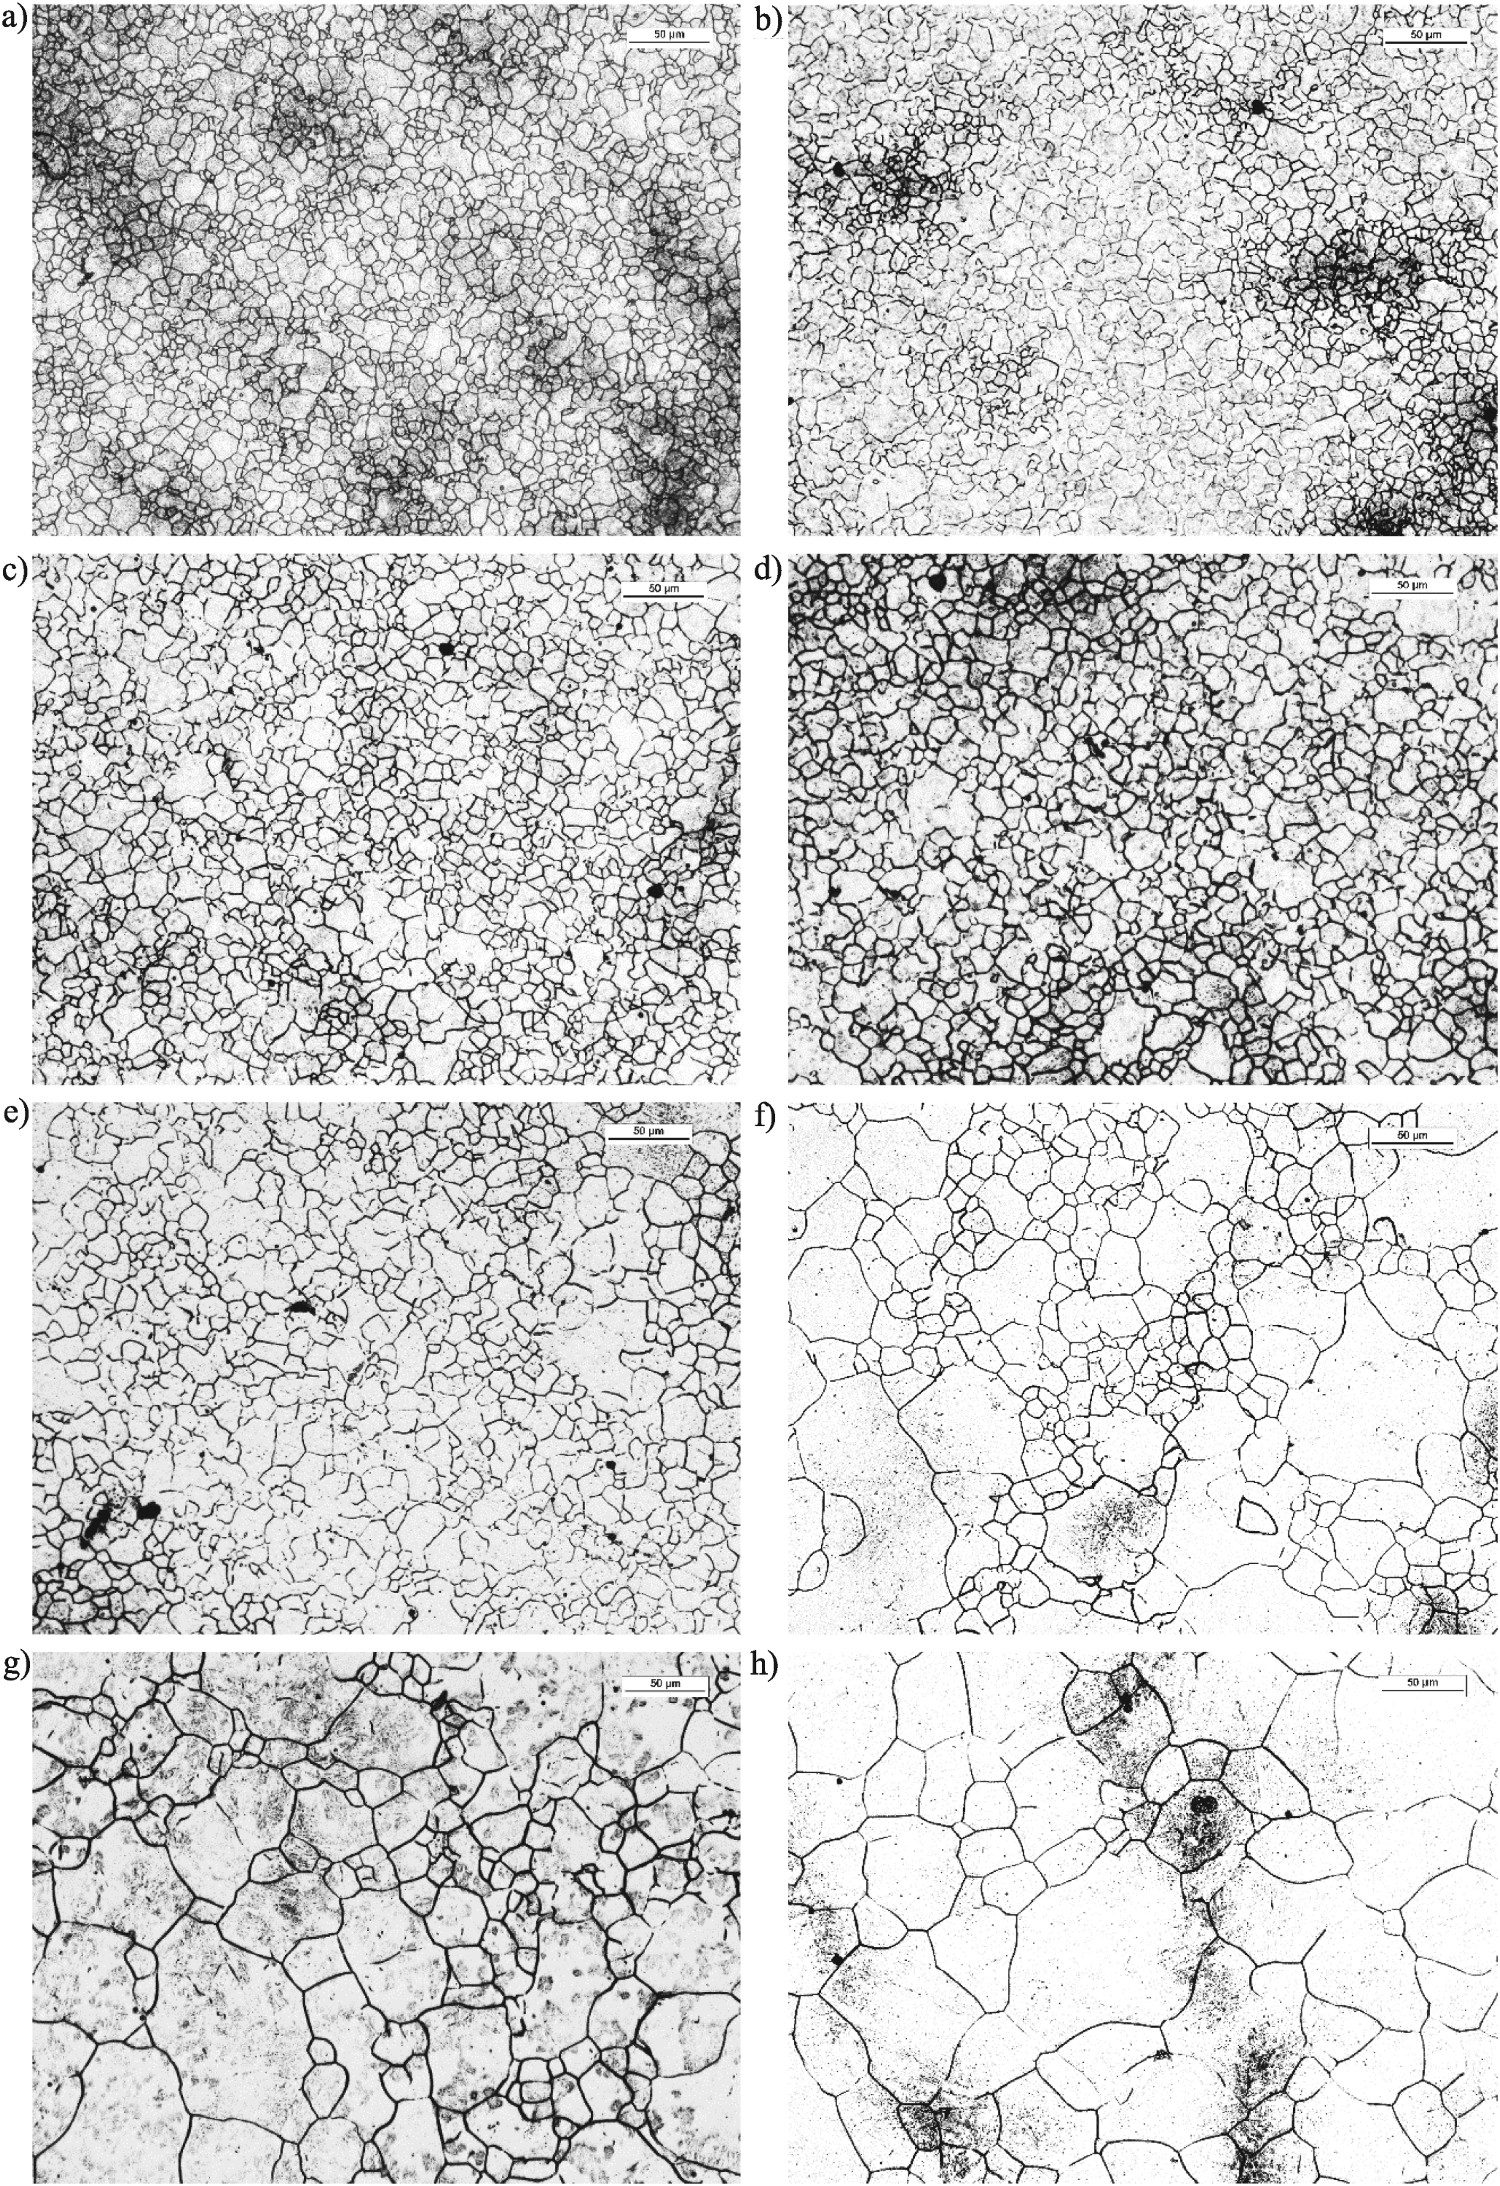
Hardness
Generally, growth of austenite grains should result in lower mechanical properties, but it was shown in the author’s own research [13] that plastic properties like impact strength are especially sensitive to growth of primary austenite grains. For the other mechanical properties like hardness, influence of austenite grain size is not so obvious and explicit.
Hardness of the melt 1 (Figure 18(a)) after austenitizing at 850°C was 460 HB, but after austenitizing at 900°C it was 419 HB. After austenitizing at 950°C and 1000°C, hardness of the melt increased to 473 and 497 HB, respectively. Then, austenitization at 1050°C resulted in lower hardness of 487 HB. Some increase of hardness to 508 HB was observed after austenitizing at 1100°C, but hardness after austenitizing at 1150°C was again lower at 488 HB. The highest hardness was measured after austenitizing at 1200°C, when former austenite grain was the largest. Hardness of the melt reached 516 HB and was over 12% higher than the value obtained after austenitizing at the lowest temperature. Hardness of the analysed melts after austenitizing within 850–1200°C. (a) TA = 850°C. (b) TA = 900°C. (c) TA = 950°C. (d) TA = 1000°C. (e) TA = 1050°C. (f) TA = 1100°C. (g) TA = 1150°C. (h) TA = 1200°C.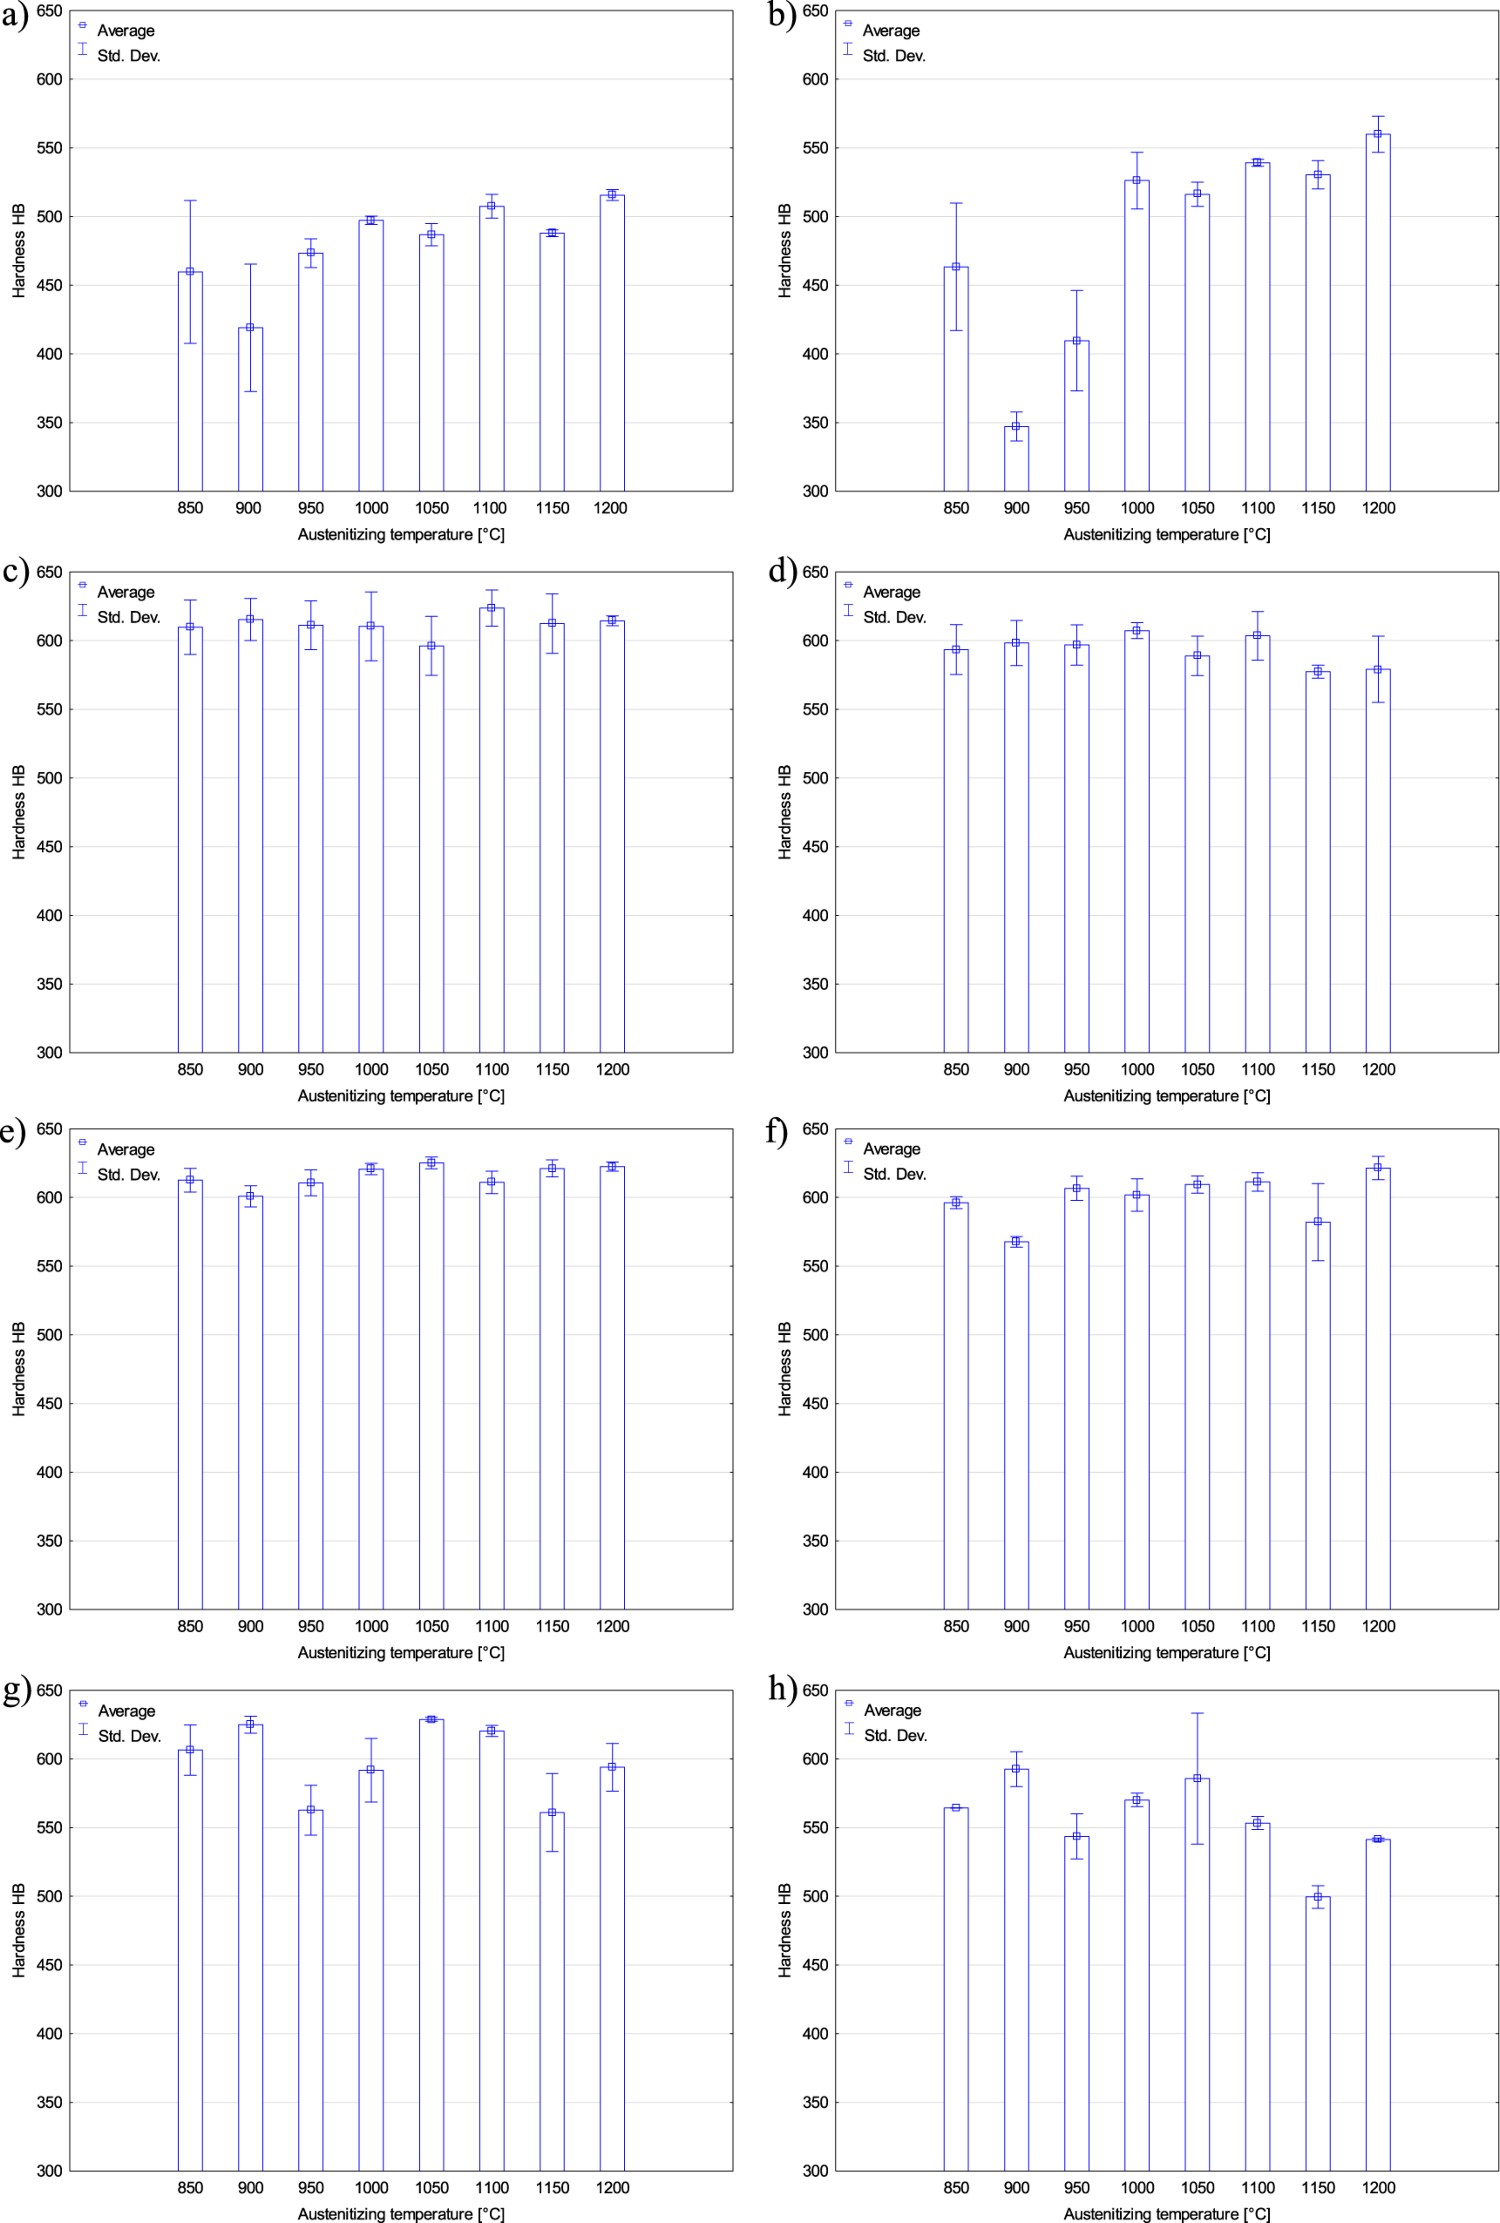
The phenomena were similar for the melt 2 (Figure 18(b)). Hardness after austenitizing at the lowest temperature was 463 HB. After austenitizing at 900°C, it dropped by 25%. After austenitizing at 950°C, hardness increased to 410 HB, but was still 11% lower than the initial value. Higher hardness than that after austenitizing at 850°C was measured after austenitizing at 1000°C and at higher temperatures. Like in the melt 1, hardness values were alternately higher and lower for the same austenitizing temperatures. The highest hardness of 560 HB was also obtained after austenitizing at the highest temperature, when grain size of the melt 2 was the biggest.
Changes of hardness after austenitizing at various temperatures were different in the melts 3 and 4 (Figure 18(c) and (d)). Average hardness values of the melt 3 containing boron were higher than average hardness values of the melt 4. Hardness of the melts 3 and 4 after austenitizing at 850°C was 610 and 594 HB, respectively. Austenitization at the higher temperature resulted in higher hardness values of 615 HB (melt 3) and 598 HB (melt 4). Hardness of these melts was closer to the initial value after austenitizing at 950°C. The melt 4 reached the highest hardness after austenitizing at 1000°C and the melt 3 – after austenitizing at 1100°C.
The melt 5 (Figure 18(e)) after austenitizing at 850°C reached the highest hardness of 613 HB among all the analysed melts at the same austenitization temperature. After austenitizing at 900°C, hardness decreased to 601 HB, but it showed increasing tendency for subsequent austenitization temperatures. This melt reached maximum hardness of 625 HB after austenitizing at 1050°C. After austenitizing at the two highest temperatures, its hardness was 621 and 622 HB.
For the melt 6, the highest hardness of 621 HB (Figure 18(f)) was obtained after austenitizing at 1200°C, and its lowest hardness of 568 HB was obtained after austenitizing at 900°C. The subsequent lower hardness was obtained after austenitizing at 1150°C. Hardness after austenitizing at 950–1100°C stayed over 600 HB.
The melt 7 (Figure 18(g)) was characterized by quite big scatter of hardness from 561 to 629 HB after austenitizing at 1150°C and 1050°C, respectively. The next high hardness values were obtained after austenitizing at 850°C, 900°C and 1100°C. Hardness below 600 HB was measured after austenitizing at 950°C, 1000°C, 1150°C and 1200°C.
The melt 8 (Figure 18(h)), even if composed of very fine grains, did not show the highest hardness among all the melts containing alloying elements. After austenitizing at 850°C, its hardness was 564 HB and it was the highest after austenitizing at 900°C, although it did not exceed 600 HB and reached 593 HB only. The lowest hardness of 500 HB was measured after austenitizing at 1150°C. Hardness of the melt 8 increased and decreased at the same temperatures as hardness of the melt 7, but reaching lower values.
Generally, it can be observed that the boron-containing melts, except the melt 1, reached higher hardness values. This can indicate higher hardenability caused by larger quantity of boron dissolved in austenite, because the nitride-forming elements (especially titanium and vanadium) prevent bonding it to boron nitride.
Discussion
Statistical analysis
The ANOVA variance analysis belongs to the parametric tests. The key assumptions required for the ANOVA are normality of distribution and homogeneity of variances (it is assumed that variances in groups are the same). It can happen that these assumptions are not met. This not necessarily means that the parametric test cannot be used. A simple way to stabilize variances and to normalize data is transforming them [20]. The most popular one is the logarithmic transformation that makes it possible to normalize data for almost every variable having non-normal distribution. Thanks to such a transformation, power of the parametric test is maintained or even increased, being sometimes higher than that of equivalent non-parametric tests, and thus probability of a mistake is reduced [21].
However, it can happen that, in spite of the used transformation, neither normality of distribution nor homogeneity of variances can be obtained. Then, the non-parametric Kruskal–Wallis test can be used, or after all the ANOVA can be applied, with awareness that the assumptions are violated. This is possible, because the test F being the base of ANOVA is to a large extent resistant to deviations from normality [22,23]. When kurtosis is bigger than 0, the F value tends to small values and the zero hypothesis cannot be rejected, even if it is not true. When the number n per cell is big enough, then declinations from the normal distribution are of no importance at all with regard to the central limit theorem, according to that distribution of mean values of the sample tends to the normal distribution, irrespective of distribution of the variable in the population. Moreover, Lindman [23–25] showed that the F statistics is also completely resistant to violation of the assumption about homogeneity of variances. In this paper, the ANOVA analysis was carried-out for the data that were tried to be stabilized by the logarithmic transformation. Moreover, results of the Kruskal–Wallis test were also shown, because the applied transformation did not give the expected result in each case.
Values p in the Kolmogorov–Smirnov test.
Values p in the Brown–Forsythe test for logarithmed data.
Values p in the one-way variance analysis ANOVA for logarithmed data.
Values p in the in the Kruskal–Wallis test for not-transformed data.
Melts 1 and 2
The data were divided to eight groups with respect to the austenitization temperature. The Kolmogorov–Smirnov test for not-transformed data showed that, in all the analysed groups, the zero-hypotheses about normal distribution had to be rejected, see Table 2. Use of the logarithmic transformation did not make it possible to normalize the data in one group only, for the data obtained after austenitizing at 1000°C, see Table 2. The Brown–Forsythe test (Table 3) showed non-homogeneity of variances in two groups of data, after austenitizing at 850 and 1150°C. So, in addition to the one-way variance analysis ANOVA (Table 4), the non-parametric Kruskal–Wallis test was carried-out, see Table 5. The variance analysis showed that the hypothesis about equality of average values must be rejected in four groups, for the data obtained after austenitizing at 850°C, 900°C, 950°C and 1000°C (Table 4). Therefore, statistically significant differences in grain size exist between the melts 1 and 2. At these temperatures, average grain diameters were smaller in the melt 2 (Figure 19(a–d)). The obtained results were confirmed by the Kruskal–Wallis test that showed statistically significant differences in grain size between the melts 1 and 2 for the temperatures indicated by ANOVA, see Table 5. The differences in grain size were probably caused by decreased number of aluminium nitride particles by creation in the melt 1 boron nitride particles that prevent austenite grain growth less effectively. On the other hand, influence of aluminium nitride precipitates remained up to the soaking temperature 1000°C, i.e. to the highest austenitization temperature for that the zero hypothesis about equality of average values between groups was rejected. At higher temperatures, particles of aluminium nitride are subjected to coagulation and dissolution, lose their effectiveness in obstructing grain growth and the differences in grain size between the analysed melts become unimportant. Therefore, the conclusion can be drawn that boron, showing higher affinity for nitrogen than aluminium, is conducive to grain growth up to ca. 1000°C. Effect of boron on average austenite grain diameter in the melts 1 and 2 after austenitizing within 850–1200°C. (a) TA = 850°C. (b) TA = 900°C. (c) TA = 950°C. (d) TA = 1000°C. (e) TA = 1050°C. (f) TA = 1100°C. (g) TA = 1150°C. (h) TA = 1200°C.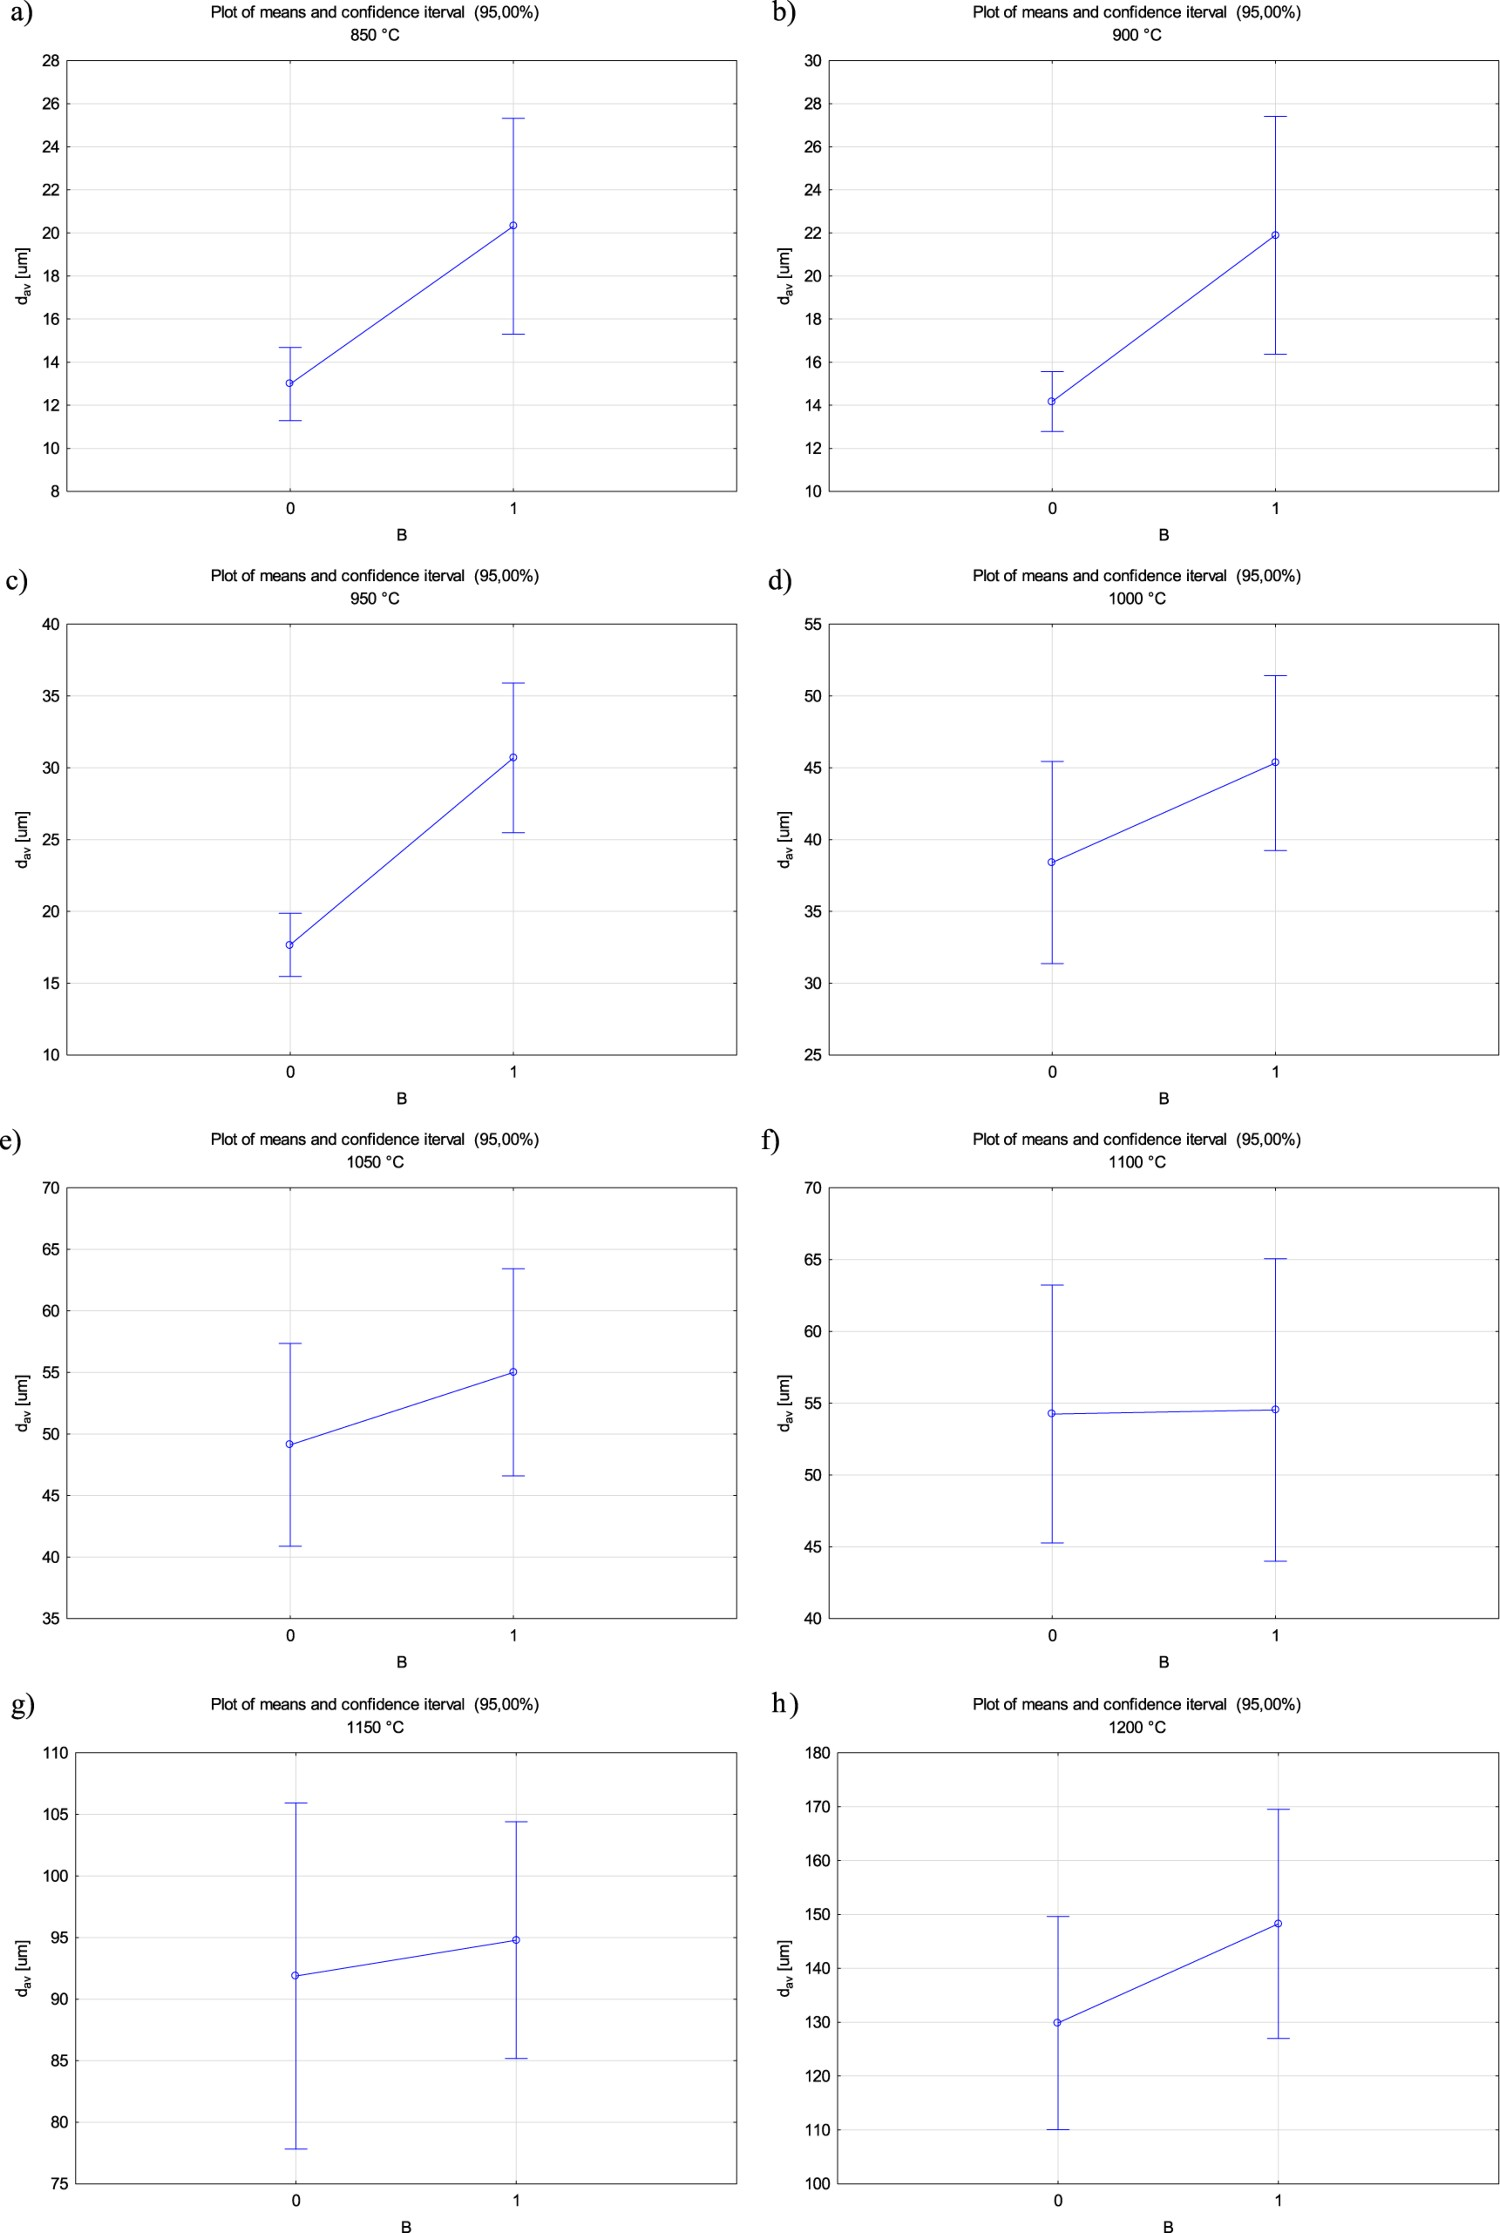
Melts 3 and 4
For the data divided to eight groups with respect to the austenitization temperature, the Kolmogorov–Smirnov test showed that the zero hypotheses about normality of the distribution must be rejected, see Table 2. The logarithmic transformation made it possible to normalize the data in all groups (Table 2), but the Brown–Forsythe test showed non-homogeneity of variances in two groups of data (Table 3), so the non-parametric test was carried-out in addition to variance analysis. The ANOVA analysis showed significant differences in grain size between the melts 3 and 4 after austenitizing at 1000°C, 1050°C, 1150°C and 1200°C, see Table 4. In turn, the Kruskal–Wallis test showed significant differences after austenitizing at 950°C, 1050°C, 1150°C and 1200°C, see Table 5. It was the only case among all the analysed melts, when the p values for ANOVA and the non-parametric test were different. The non-parametric test is a weaker test and analysis of the obtained structures showed qualitative differences after austenitizing at the temperatures indicated as significant in the variance analysis, so the ANOVA results will be taken into account in further considerations. After austenitizing at the three lowest temperatures, differences in grain size between the melts were not significant, so effectiveness of chromium carbides was similar and independent on content of boron. Differences between the melts became statistically significant after austenitizing at 1000°C and 1050°C, and grains in the boron-containing melt were larger than in the melt free of boron (Figure 20(d) and (f)). After austenitizing at the two highest temperatures, differences in grain size became statistically significant again, but in these cases the boron-containing melt showed smaller grains (Figure 20(g) and (h)). Chromium is a strongly carbide-forming element creating a few kinds of carbides, and mutual dissolution of alloying elements can lead to forming complex carbonitrides that can contain also boron, which can affect morphology and stability of chromium carbides. For example, it was shown that boron, after saturating the matrix, dissolves in the M23C6 carbide to replace carbon and stabilizes the carbide [26]. Therefore, the differences in grain size between the analysed melts can result from morphology of chromium carbides and carbonitrides and from their stability, especially at high austenitization temperatures. Effect of boron on average austenite grain diameter in the melts 3 and 4 after austenitizing within 850–1200°C. (a) TA = 850°C. (b) TA = 900°C. (c) TA = 950°C. (d) TA = 1000°C. (e) TA = 1050°C. (f) TA = 1100°C. (g) TA = 1150°C. (h) TA = 1200°C.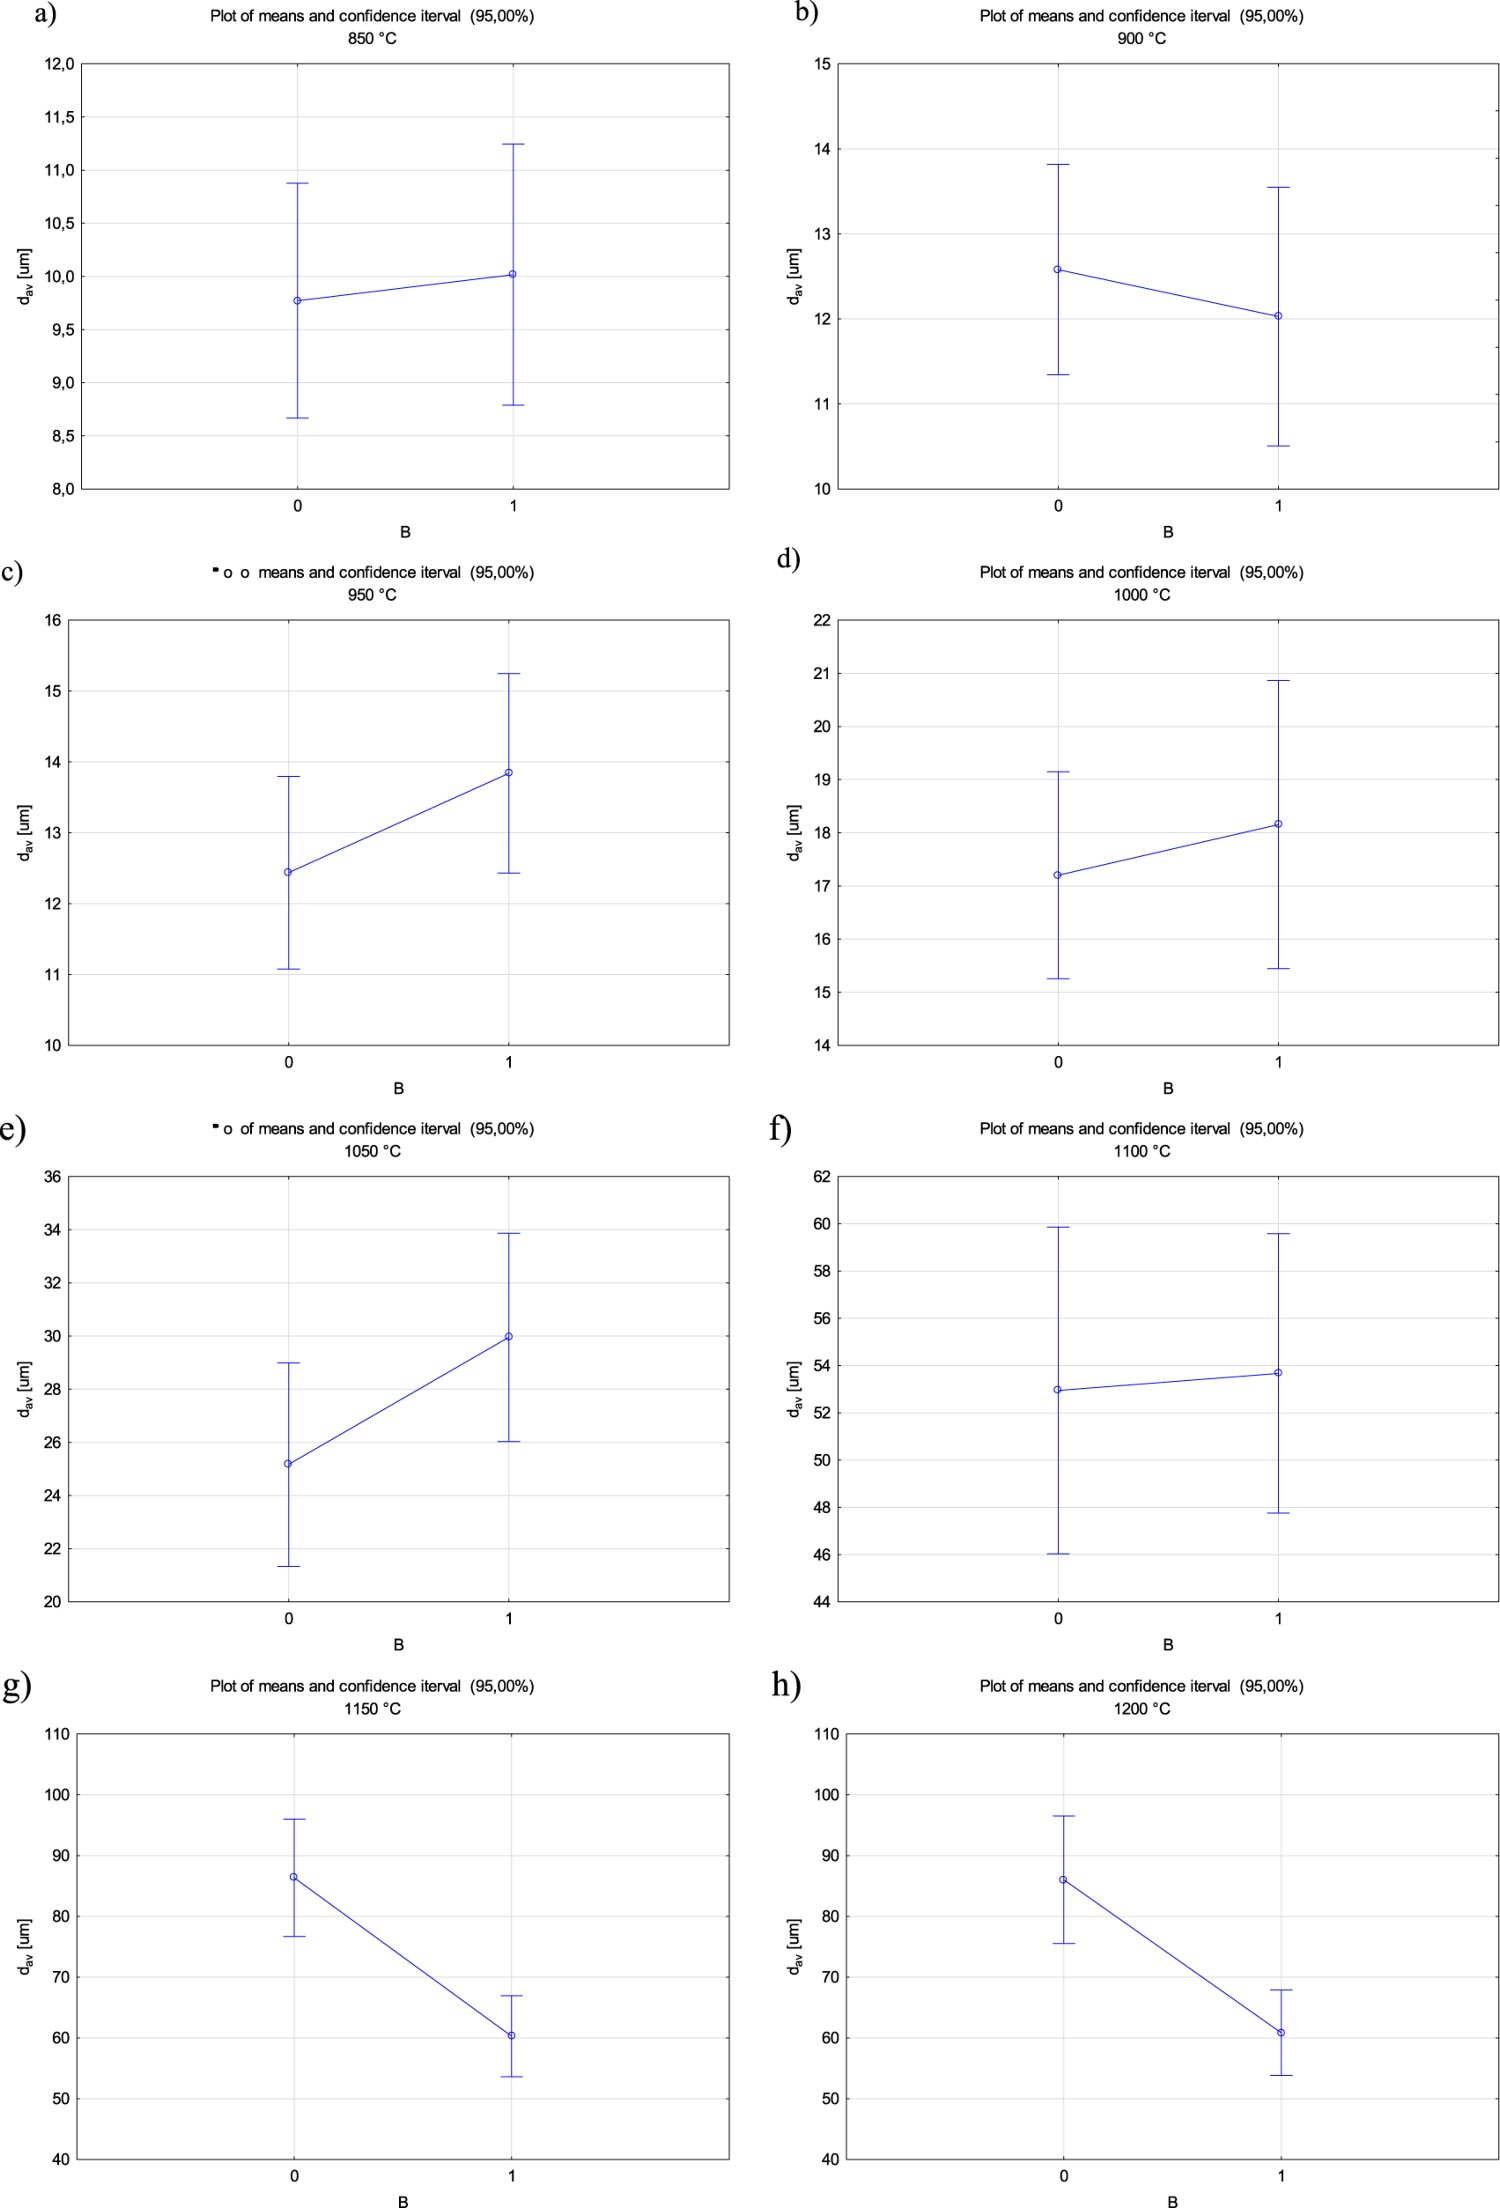
Melts 5 and 6
The Kolmogorov–Smirnov test for not-transformed data showed that, in all the analysed groups, the hypothesis about normality of the distribution must be rejected, see Table 2. After the logarithmic transformation, the variables were normalized in all the eight groups, but homogeneity of variances was shown in almost all groups except that of the data obtained after austenitizing at 1100°C, see Table 3. So, the non-parametric test was carried-out in addition to the one-way variance analysis. It should be stressed that vanadium shows higher affinity for carbon, forming more stable carbides and carbonitrides. The variance analysis showed that the differences in grain size between the melts 5 and 6 are statistically significant after austenitizing at 1050°C only, see Table 4. The Kruskal–Wallis test showed significant differences for the same austenitization temperature, see Table 5. In the boron-containing melt, particles of vanadium carbonitride counteracted grain growth up to 1000°C, but in the melt free of boron this action continued up to 1050°C. Therefore, vanadium carbonitrides less effectively prevent grain growth when the alloy contains a microaddition of boron, but at higher temperatures only. It is also possible that some quantity of boron is dissolved in vanadium carbonitrides like V(B,C,N), which can affect effectiveness of vanadium components in preventing grain growth [27]. In the case of carbonitrides, inclination of precipitates to coagulation depends on concentration of the substitutionary elements in austenite. Moreover, along with increasing austenitization temperature, vanadium carbonitride is rebuilt towards higher concentration of nitrogen and lower concentration of carbon. Therefore, at lower austenitization temperatures, grain size in the boron-containing melts is controlled by precipitates of vanadium carbonitrides, supported to a smaller extent by precipitates of boron nitrides. At the highest austenitization temperatures 1150°C and 1200°C, no statistically significant differences were found between the melts containing and not-containing boron, as it was in the melts 3 and 4 (Figures 21(g) and 20(h)). Effect of boron on average austenite grain diameter in the melts 5 and 6 after austenitizing within 850–1200°C. (a) TA = 850°C. (b) TA = 900°C. (c) TA = 950°C. (d) TA = 1000°C. (e) TA = 1050°C. (f) TA = 1100°C. (g) TA = 1150°C. (h) TA = 1200°C.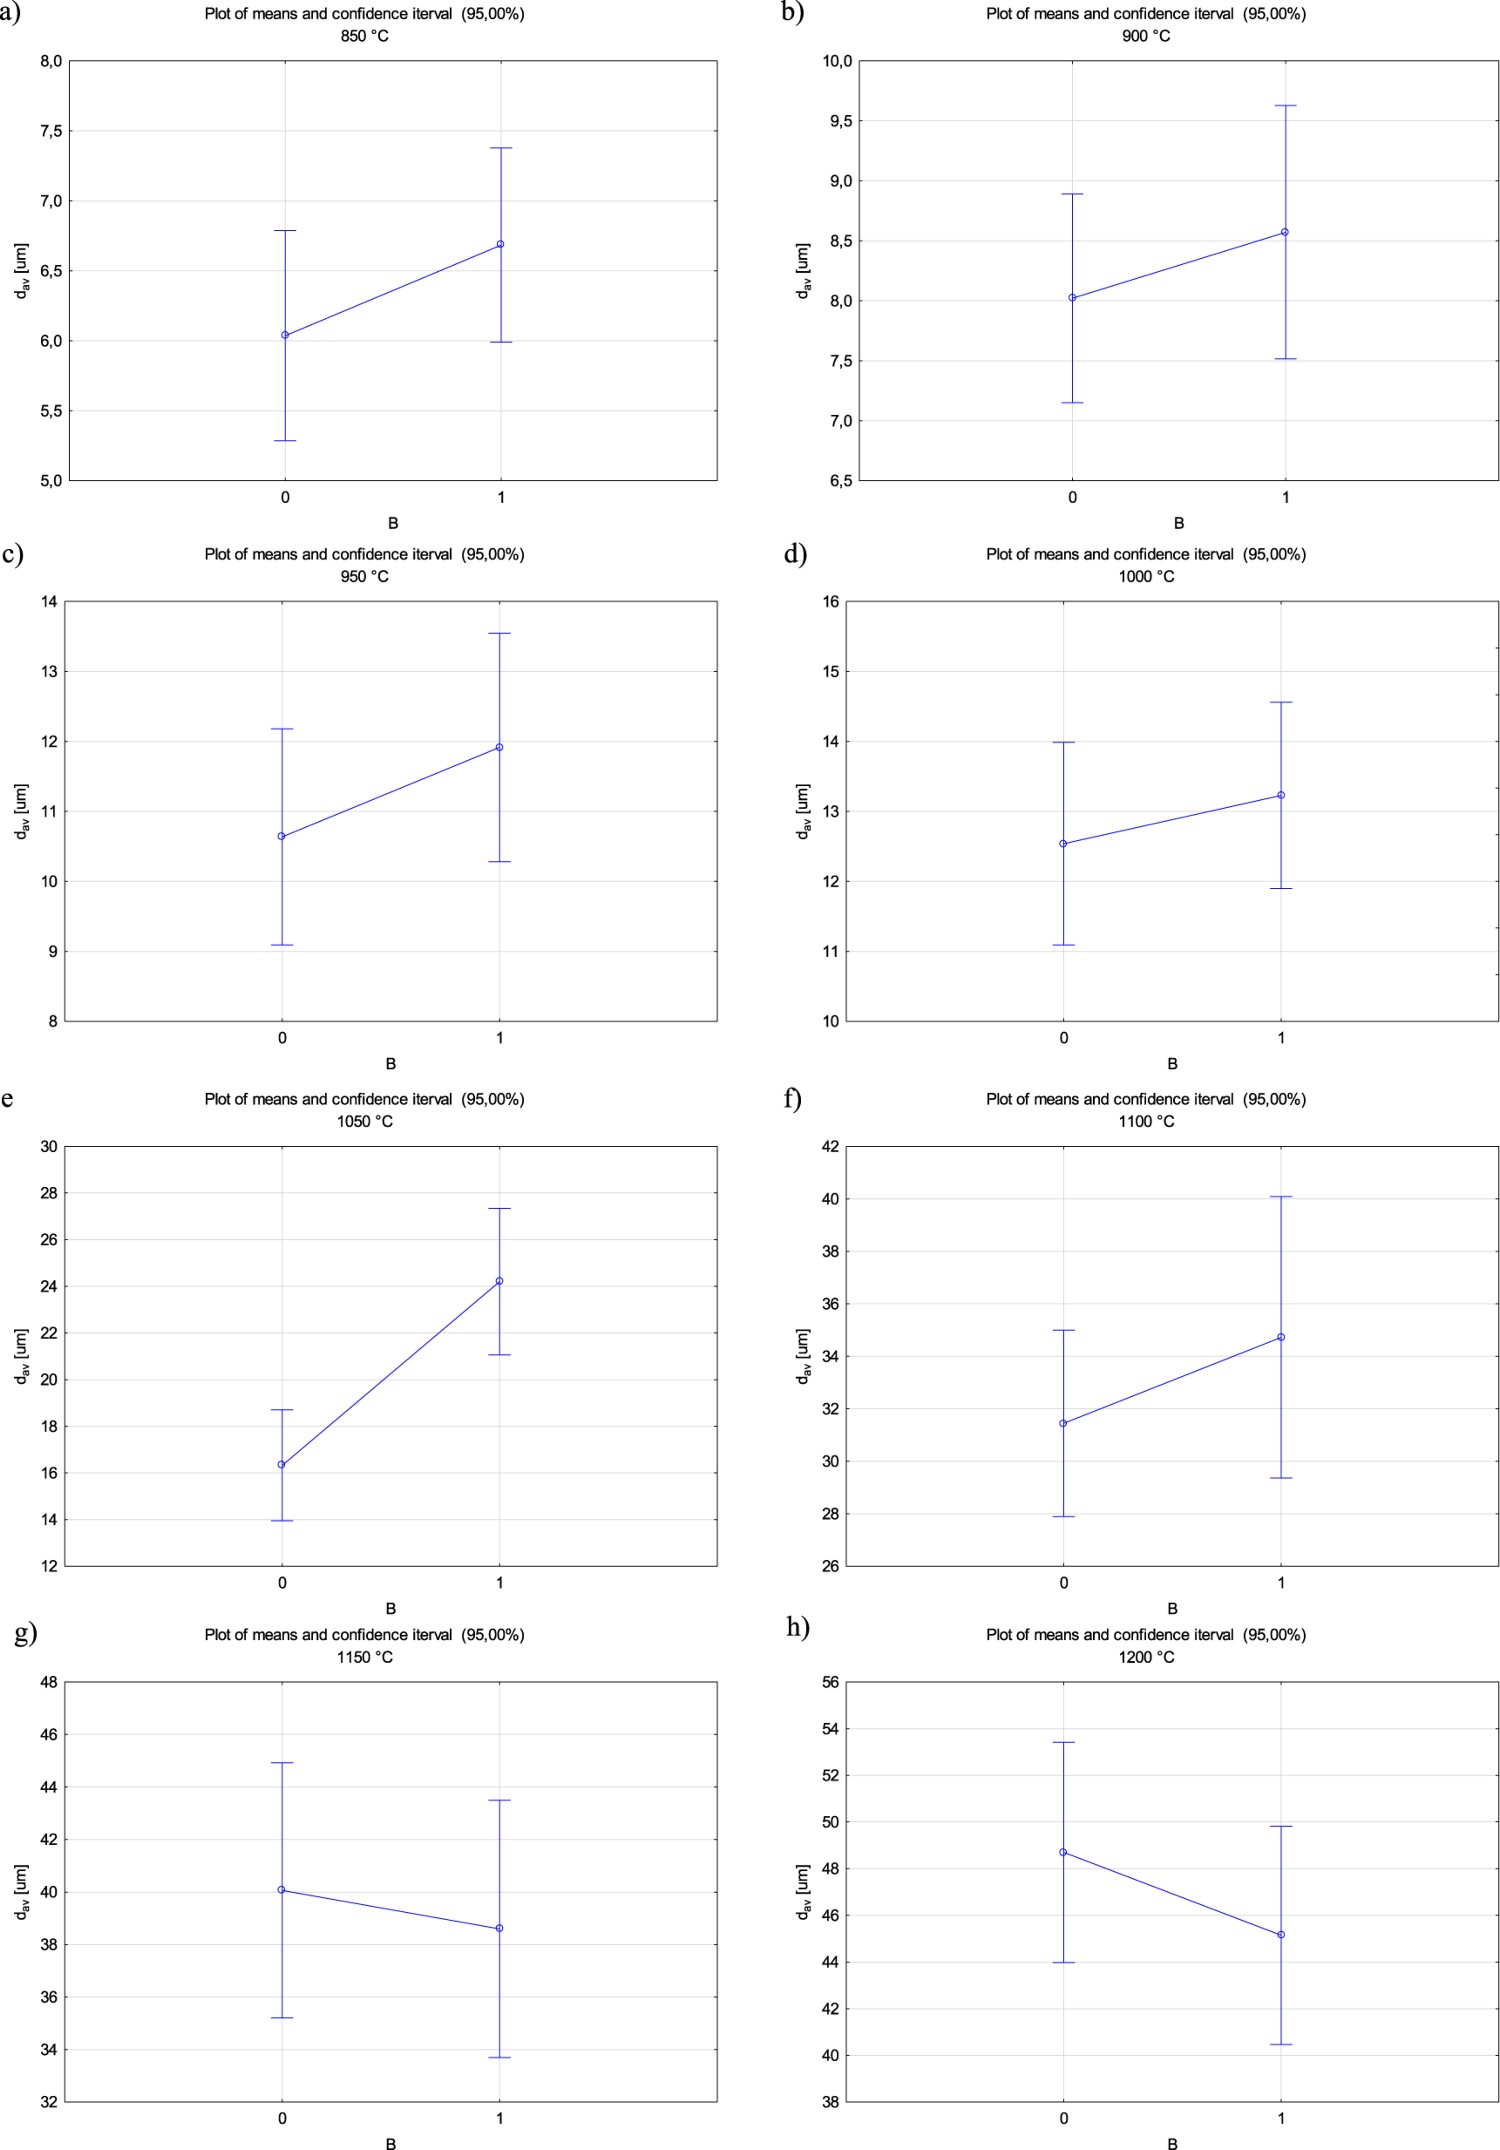
Melts 7 and 8
Like in the former case, the Kolmogorov–Smirnov test showed that, in all the analysed groups, the hypothesis about normality of the distribution must be rejected, see Table 2. After the logarithmic transformation, the variables were normalized in all the eight groups, but the Brown–Forsythe test showed that the hypothesis about homogeneity of variances cannot be rejected in two groups of variables only, see Table 3. In addition, the Kruskal–Wallis test was carried-out. The boron-containing melt 7 contained 0.019% of titanium only, since such amounts of titanium are added to one of the most popular low-alloyed steel. Concentration of titanium in the melt 8 was 0.059% that exceeds the alloying concentration of 0.05%. The ANOVA analysis and the Kruskal–Wallis test showed statistically significant differences in grain size between the analysed melts after austenitizing within 850–1150°C, see Table 4, 5 and Figure 22. Therefore, titanium concentration lower than the alloying percentage was not sufficient to prevent grain growth in the boron-containing melt. In the melt 8, at lower austenitization temperatures, austenite grain growth was more effectively controlled by AlN precipitates, but at higher austenitization temperatures grain growth was controlled by TiN precipitates of larger sizes, which dissolved and coagulated more slowly. Effect of boron on average austenite grain diameter in the melts 7 and 8 after austenitizing within 850–1200°C. (a) TA = 850°C. (b) TA = 900°C. (c) TA = 950°C. (d) TA = 1000°C. (e) TA = 1050°C. (f) TA = 1100°C. (g) TA = 1150°C. (h) TA = 1200°C.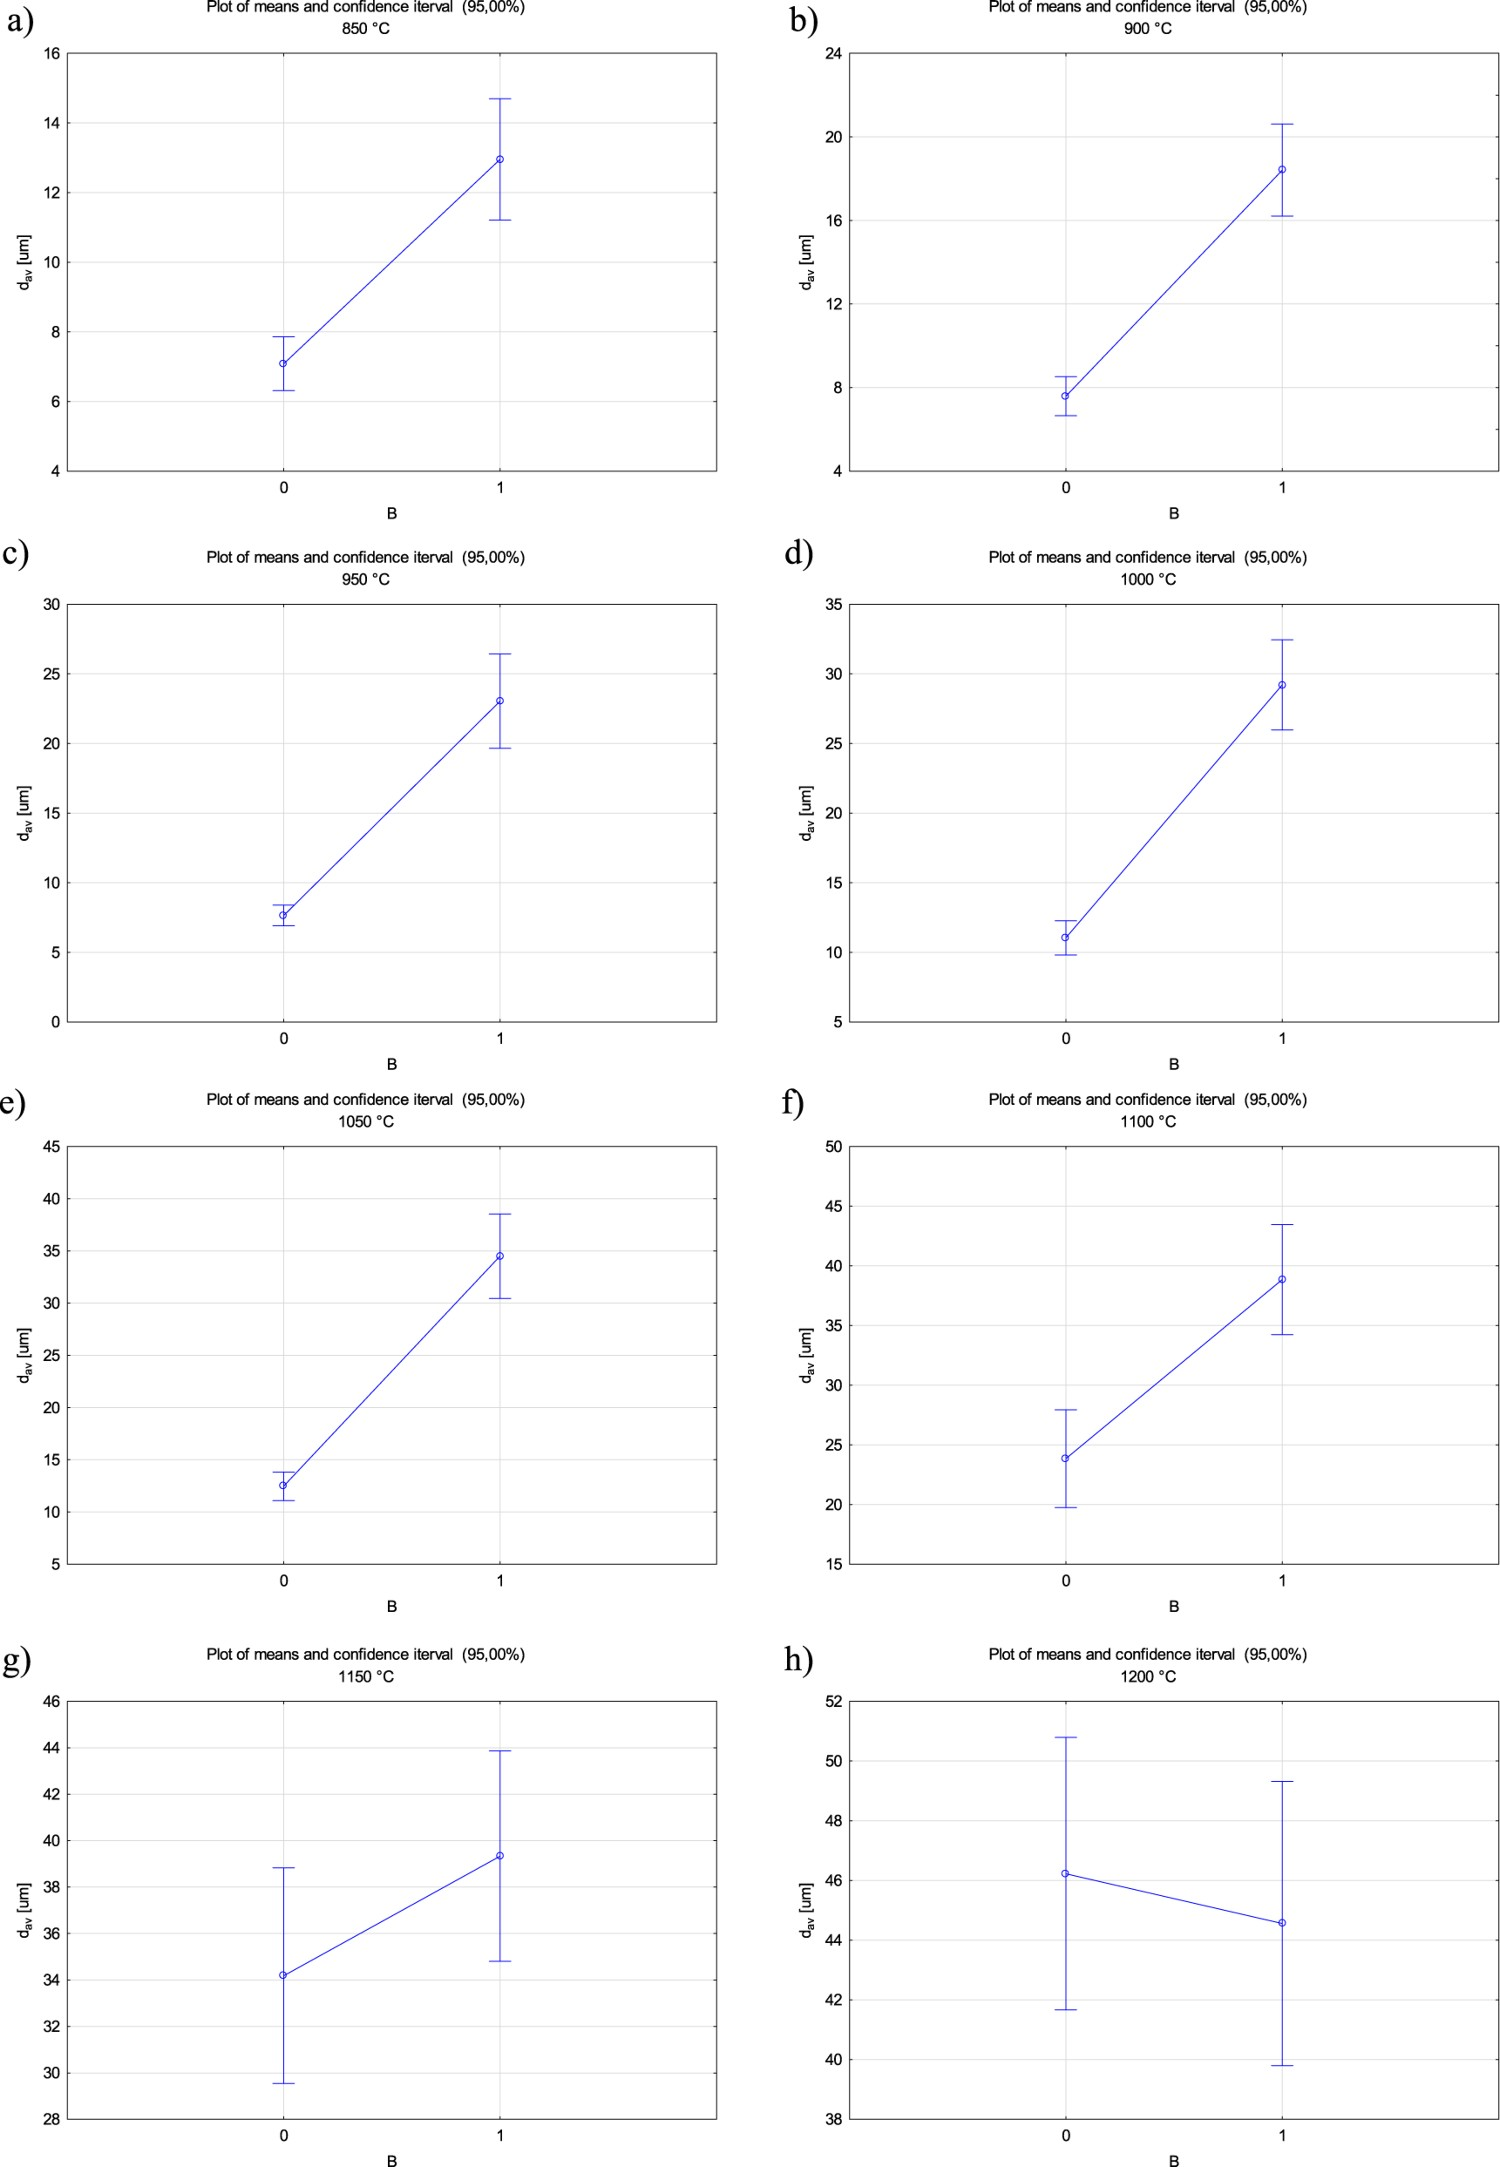
Summary
After austenitizing at 850°C, the smallest former austenite grain size was obtained for the melt containing 0.275% of vanadium and 0.970% of chromium and the largest grain size was obtained for the melt containing 0.002% of boron with no other alloying elements.
In the melt 1, abnormally large grains appeared just after austenitizing at 850°C.
Most of the grain size distributions could be approximated by the log-normal distribution. Most data that could not be approximated by any distribution, were obtained for the melts 1 and 2.
The melts containing boron were characterized by larger grain than those with no boron. It is 0.260% of vanadium only that compensated adverse effect of boron on grain growth up to the austenitization temperature 1050°C.
Growth of austenite grains was inhibited by precipitates of aluminium and titanium nitrides, by precipitates of vanadium and chromium carbonitrides, and – to the lowest degree – by precipitates of boron nitrides.
At lower austenitization temperatures up to 1000°C, growth of austenite grains was inhibited mostly by aluminium nitrides and by vanadium carbonitrides, and at higher austenitization temperatures up to 1150°C – mostly by titanium nitrides.
Concentration of titanium lower than the alloying percentage was not effective in inhibiting grain growth in the melts containing a microadditive of boron.
The boron-containing melts containing also other alloying additives and microadditives reached higher hardness than the melts free of boron.