
Abstract
Alloy development on a commercial scale in recent years has become much more costly and as such has adopted a more iterative approach, making small refinements while keeping within known limits. Laboratory-based rapid alloy development is therefore a key in pushing new grade boundaries. This work shows the rapid alloy development (RAP) facilities at WMG, including capability, sizes and time required for each stage of the process, which have been mapped against the relevant industrial process. A case study of a dual-phase steel grade DP800 has been used for this work. It has been shown that through knowledge of the strengthening mechanism of the alloy (2nd phase distribution for DP800) is critical with respect to mechanical properties and that specific changes and optimisation to the laboratory production casting and subsequent reduction allows for the final product microstructure and mechanical properties to match the production product. This gives confidence in upscalability.
Introduction
New grade/process parameter development for mass-produced steel strip via large scale 2 × 30 kg pilot plant and mill trials is a time- and cost-intensive process. This has imposed up to now restrictions in view of turn-around, lead time and operator/equipment capacity. A lot of the current developments to a more iterative approach and limited to selected changes in composition and/or process parameters with a risk-averse approach. Many laboratories that developed steels have focussed on novel high-alloy steels where composition and/or heat treatment dominate properties as commercial cast microstructures and thermo-mechanical processing is difficult to replicate. There is, therefore, a need to develop a high throughput processing and testing route, representative and benchmarked to commercial strip steel production, for simulation of new chemistries, and evaluation of associated downstream processing requirements to reduce the time between an alloy design idea and the final evaluation of mechanical and microstructural properties from months to days [1].
Rapid alloy prototyping (RAP) allows for fast investigation of systematic variations or completely new alloy systems through the combination of small-scale processing and mechanical testing and simulation-based modelling. Enabling testing within research laboratories and virtual environments rather than in the steel plant means hundreds of samples can be produced and tested in the time it currently takes to test one new steel composition via pilot plant and mill trials and a lot less material is wasted [2].
RAP has been widely applied as an experimental approach to develop bulk structural materials through compositional and thermo-mechanical design processing and validation based on scaled-down samples. For example, Springer [3] established a lab-based through-process replication methodology to investigate the influence of alloying elements (e.g. Al) on the strengthening mechanism in 30-Mn-1.2C-xAl triplex steels during aging. Five alloy compositions, nine different aging treatments as well as 45 samples for microstructure characterisation and mechanical tests can be made from a single master 20 kg cast trial, utilising a specially designed VIM cast mould. QuesTek [4] established a proven systems-based Integrated Computational Materials Engineering (ICME) approach and a ‘Materials by Design’ methodology to design and deploy new metallic materials (e.g. ultra-high strength and stress corrosion-resistant steel grades, fracture toughness enhanced forged alloy steel grades) in a fraction of time and at much lower cost than traditional empirical trial and error approach. The key factor for their success is the ability to predict the effect of composition and heat treatment histories on microstructure using computational modelling tools and validate by additive manufacturing processes. Therefore, the link between that microstructure to key properties can be determined within a shorter period than the conventional research and development cycle.
The previous rapid alloy developments mentioned above focused around small batch and producing one off components. These materials obtain the majority of their properties from the chemical composition rather than process (thermal plus mechanical) history and therefore don’t need to consider the implications of lab-based trials scaling up to full production. Work by the University of Swansea has shown that taking this rapid production approach to steel alloy development can yield extremely fast results and show clear trends in properties that would be expected [5]. This rapid alloy assessment approach (both computationally and experimentally) can be seen in the development of creep-resistant steels [6] and microalloyed steels [7]. Again, current alloy assessment has been laboratory-based with little/no comment of scalability.
In contrast, the RAP in this study not only aims to be able to rapidly assess a wide range of compositions but additionally address the scientific challenges associated with commercial processing for strip steels, however, to achieve this appropriate benchmarking is needed to confirm that both the microstructural development and final properties in the laboratory RAP material are representative of the commercial material.
A steel grade that relies on both chemistry as well as processing conditions is the family of dual-phase steels. DP800 is a cold-rolled and annealed dual-phase steel with a high ultimate tensile strength (UTS) of approximately 800 MPa combined with good formability (around 14% total elongation) that makes it suitable for light deep drawn or crash formed components such as body-in-white structural and reinforcement components and light-weight seat structures [8]. These properties stem predominantly from the phase balance and distribution of the ferrite and martensite [3]. The soft ferrite phase is generally continuous, providing high ductility, and allows a high build-up of strain during deformation, giving high work hardening; the hard martensite phase provides strengthening. Behaving like a composite material, the correct proportion (and distribution) of the two phases allows a continuous yield point, high elongation value and a smooth flow stress curve up to a high ultimate strength, combined with a high strain hardening coefficient, plasticity and formability [9]. For this reason, DP800 was chosen as the case study for the RAP process reported here.
Steel RAP route
Established in 2017, the RAP process aims to simulate the compositions, microstructures and main processing conditions seen in full-scale production of commercial strip steels.
For casting a selection for induction furnaces allowing ingots of between 200 g and 8 kg are available to produce targeted compositions. In addition, steel/slag interactions, liquid contraction during solidification and heat transfer can be considered for alloys where these aspects limit commercial production.
Hot and cold rolling is carried out in a Hille mill (using a two high or four high configurations), rolling up to 80-mm wide strips. The 80-mm width allows whole expansion test samples, as well as both longitudinal and transverse ASTM E8 sub-sized tensile specimens to be assessed. Controlled cooling simulating coiling post hot rolling is carried out using a fluidised bed where large samples (typically around five strips of 500 × 80 × 3 mm) can be accommodated. Hot rolling with laboratory equipment (within a maximum speed of 0.2 m s−1) results in higher temperature losses (around 50°C in conduction to the rolls and radiative to the atmosphere) than are seen during commercial rolling (albeit at larger rolling speed), therefore, intermediate heating between rolling passes in a furnace is required to maintain sample temperature, for example above the no-recrystallisation temperature (TNR). If a greater control during rolling is needed, for specific strip grades, then the Gleeble HDS-V40 is used which provides precise thermo-mechanical control for the assessment of precipitation, recrystallisation and grain growth kinetics during processing.
The hot-rolled strip samples are cold rolled to the required final product thickness then annealing can be performed using a combination of muffle furnaces and fluidised beds. For the rapid assessment of the impact of commercial heat treatments, such as continuous annealing processing line parameters where annealing temperatures, times and rate vary then the Gleeble HDS-V40/Gleeble 3800 or Phoenix electro-thermo-mechanical-tester (ETMT) can be used with the latter two having direct tensile testing capability of the heat-treated samples.
Process route and number of samples available at each stage.
Materials and methodology
Commercial DP800
Measured key microstructure features of the DP800 commercial 1.2 mm product.
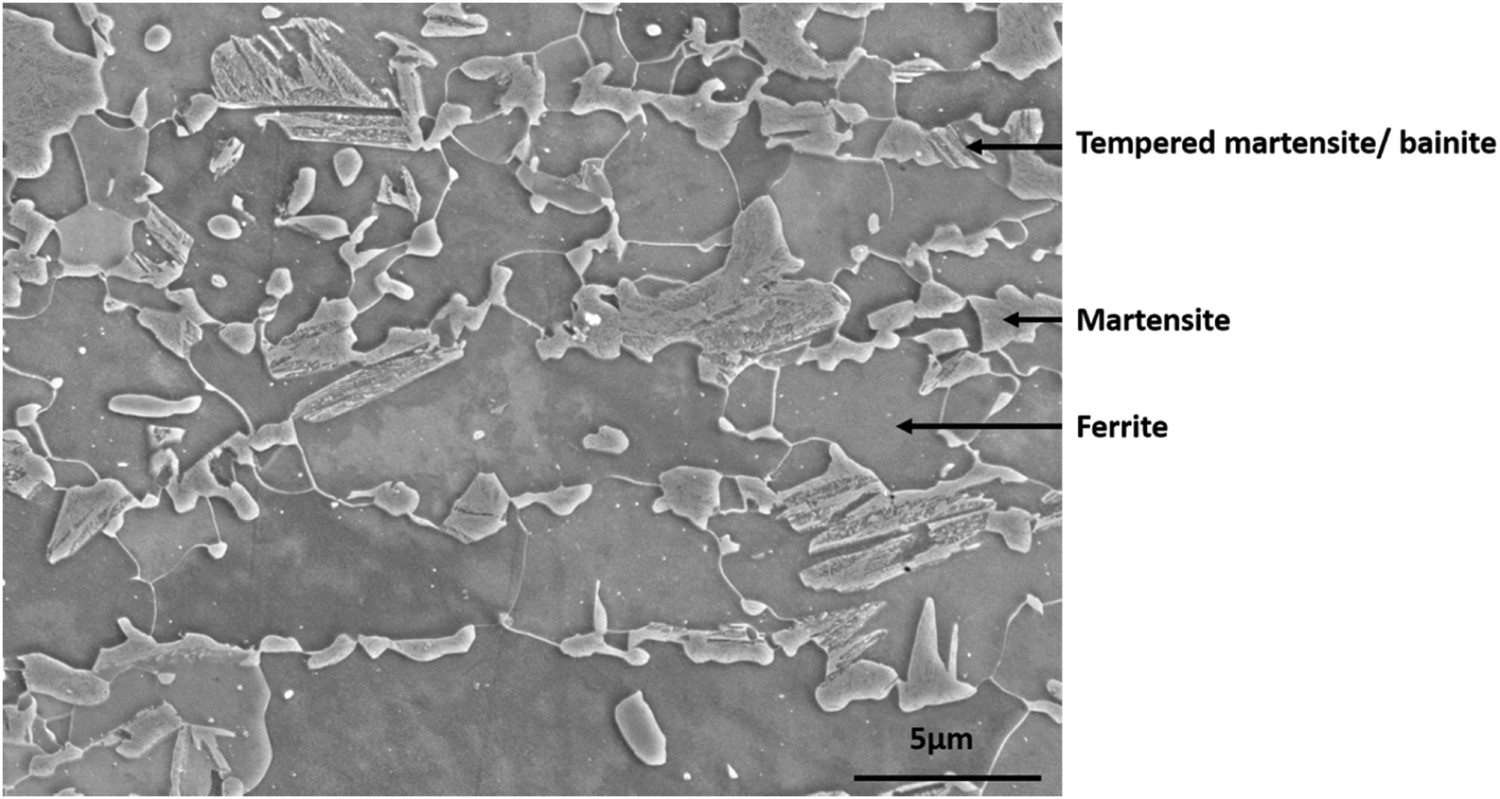
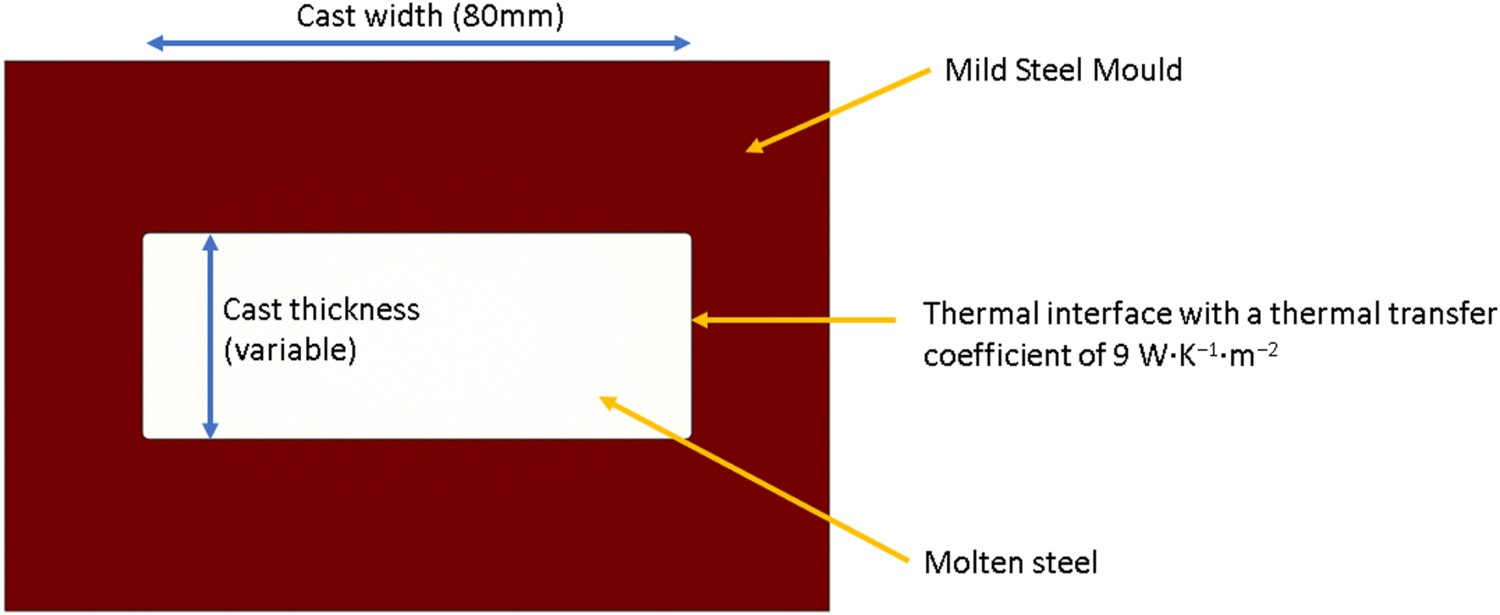
Typical microstructures of this product can be seen in Figures 1 and 2. The contrast between martensite bands and ferrite grains is clearly seen in the optical micrograph, Figure 3. Some bainite or tempered martensite can be seen from the SEM image (SE detector used) on a lighter etched surface, as shown in Figure 2, where the total fraction of second phase is 30.8%. This is typical for a DP800 where second phase fractions have been seen to vary between 20% and 40% [10]. The microstructures show the characteristic banded structure due to segregation during casting and heavy rolling reduction. The banded second phase affects the ferrite grain size with restriction of ferrite growth in the normal direction on recrystallisation/grain growth during continuous annealing as seen by the >1 aspect ratio of the ferrite grains. Optical micrograph of commercial DP800 steel showing ferrite grains and martensite bands. Secondary electron micrograph of commercial DP800 steel, the tempered martensite/bainite phase are differentiated from the martensite grains by the presence of internal contrast. Schematic diagram to show the COMSOL model setup used to simulate the cast ingot cooling rate and hence SDAS.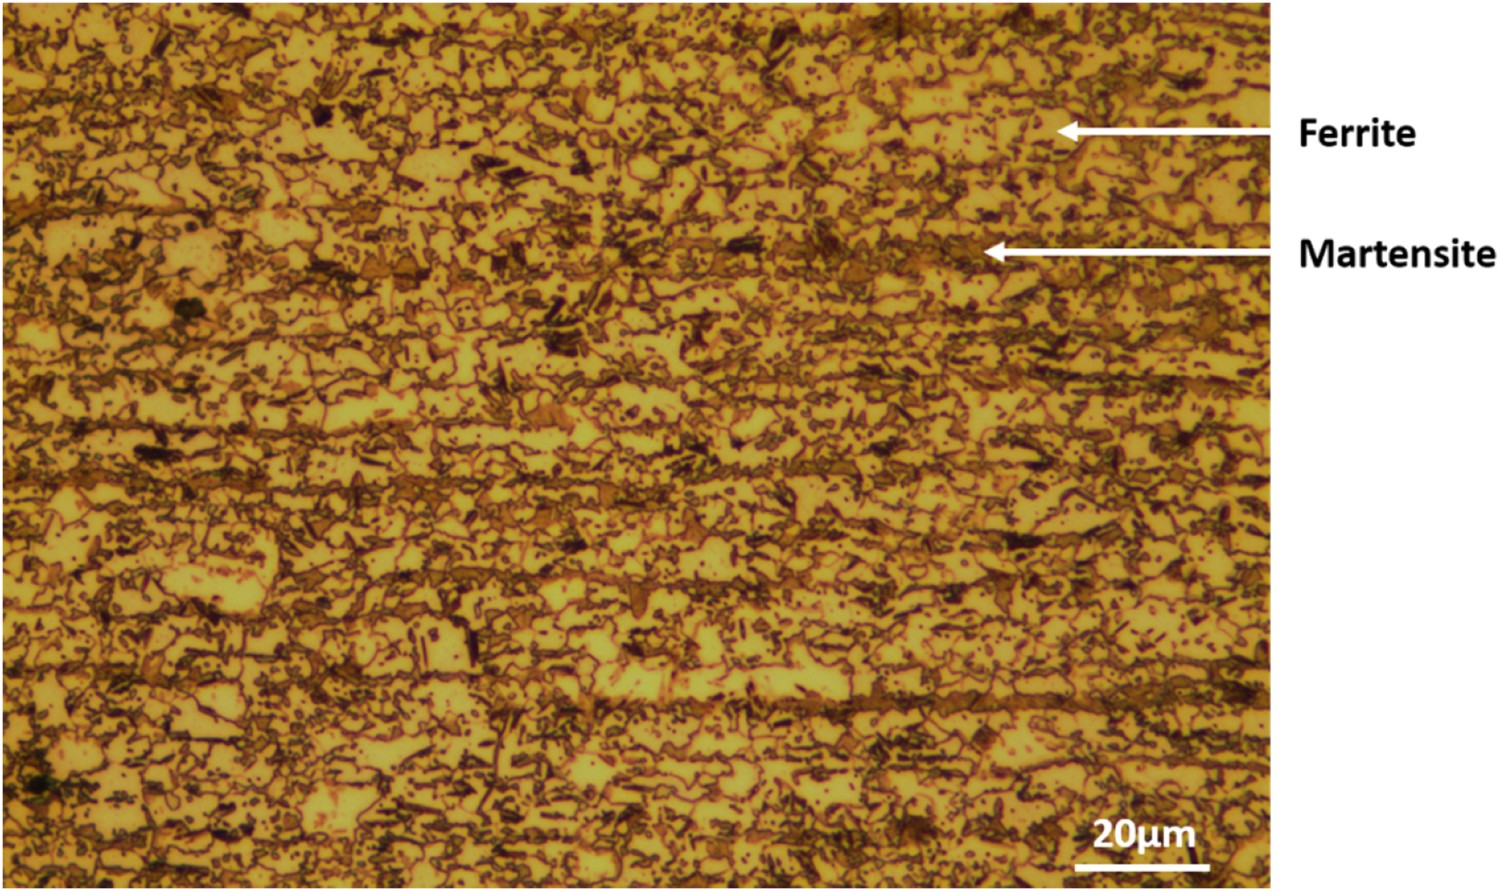
RAP process: casting
Table 2 shows the band spacing in the final commercial product is around 4.5 µm. For a commercial product, this will have come from the segregation in a 230-mm thick cast slab that has then had around x192 rolling reduction (for a 1.2-mm final product). With the limitation of cast/rolling thickness on the lab scale, then the amount of reduction achievable is reduced. Therefore, rather than trying to replicate the commercial cast product, the lab cast needs to achieve microstructural characteristics (dendrite spacing and segregation in this case) that will result in the final laboratory product having similar properties to the commercial final product. This can be achieved through mould design considering the cooling rate required to achieve a segregation spacing that, with the laboratory rolling reduction, gives the required final product band spacing. It is well understood that increasing cooling rate reduces the secondary dendrite arm spacing (SDAS) of solidifying material and therefore the segregation pattern [11]. A cooling rate/rolling reduction combination can be chosen that results in a final band spacing of around 4.5 µm. A COMSOL 5.5 Multiphysics was used to determine the cooling rate for different ingot sizes. The setup to model solidification in the mould can be seen in Figure 3, where the mould width is set to 80 mm due to rolling limitations downstream, however, the thickness is variable affecting the cast cooling rate and therefore the SDAS.
The cooling profile for a range of mould thickness from 10 to 50 mm is seen in Figure 4(a), with the cooling rate during solidification being shown in Figure 4(b) (using the liquidus and solidus temperatures defined by Thermo-Calc TCFe10). Prediction of the (a) time/temperature curves and (b) cooling rate during solidification for five different mould thicknesses.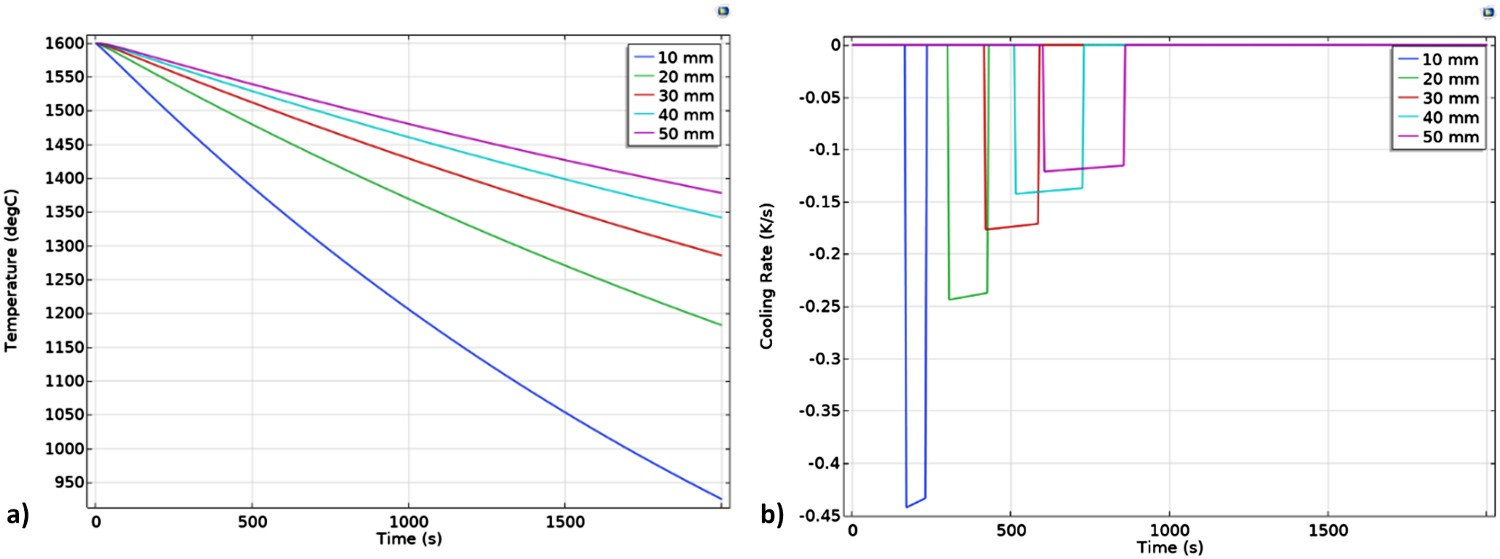
The relationship between SDAS and cooling rate is known for many alloys. For DP800, both literature [11] and internal testing has shown this to be: Prediction of (a) the cast SDAS and (b) final band spacing, by using different mould thicknesses in the VIM.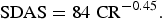

It can be seen that in order to achieve a final band spacing in the region of 4.5–5 µm in a 0.8-mm rolled strip then a 30-mm thickness mould should be used. This mould was machined from a mild steel block with a 5-mm radius in the corners to allow for easy removal of the cast.
Master alloys used for the 4.5 kg DP800 benchmark cast.
The cast ingot was cooled down in the mould and then sectioned into 35-mm long transfer bars (width and thickness remain the same) and reheated in a muffle furnace before hot rolling at ≈1200°C for 1 h for homogenisation. The rolled sample required reheating between passes with the reheat furnace being set at 900–1000°C allowing the transfer bars to be reheated in around 60–120 s. The reheat temperature is above TNR for the DP800 grade (the commercial rolling schedule for the DP800 steel is above the TNR but is low enough to minimise grain growth.
The reheated DP800 transfer bar was hot rolled from 30 to 3 mm in 10 passes which mimic the commercial rolling from a transfer bar to a finished HR gauge, however in the lab setup an initial ‘optimised’ cast structure. Rolling was performed in a single direction with the strip being passed from the roll exit back to the roll entrance between each pass to simulate the continuous commercial process, just in case that strain path effect on recovery/recrystallisation is not developed. Typical geometries produced after the Hille hot rolling are multiple sheets (typically six) of 300 × 80 × 3 mm and this takes around 1.5 h to process.
Air cooling of the hot-rolled sheet from the finishing mill exit temperature to the coiling starting temperature (600°C) is monitored via a hand held pyrometer. An alumina Techne FB-08 fluidised bed furnace set at 600°C ensures slow cooling of the sheet to the room temperature in 12 h, simulating commercial coil cooling.
The hot-rolled and coil cooled material (e.g. 3 mm sheet) is then descaled using a sandblaster. The surface conditions are inspected by optical microscopy to ensure 100% removal of black oxide. The scale-free strip is then passed through the Hille mill at room temperature for the cold rolling simulation, typically producing around 12 sheets of 300 × 80 × 1 mm and taking less than 1 h to process. In this study, two cold-rolled sheets were made, the first one was rolled from 30 mm to 1.2, and 30 mm to 0.8 mm for the second one. The aim was to validate the relationship between the product band spacing and rolling thickness reduction ratio/SDAS segregation spacing (Figure 5). During reheating and recrystallisation of the ferrite, grain growth is impeded by the formation of austenite in the banded regions (previous inter-dendritic region), this therefore means the ferrite grain size is directly dictated by the band spacing and hence amount of rolling reduction for the cast ingot meaning this RAP stage is important to assess.
ThermoCalc was used before the annealing simulation to determine the Ac1, Ac3, Ms and Mf based on the DP800 composition. The results are Ac1 ≈ 682°C, Ac3 ≈ 804°C, Ms ≈ 400°C and Mf ≈ 305°C. These values are compared to the industrial annealing profile used and to guide the RAP heat treatments. The cold-rolled sheet was sectioned and heated to above Ac3 in a muffle furnace set at 820°C (primary reheating temperature) for 2 min. The aim is for the pearlitic carbides to become spheroidised and the deformed ferrite to recrystalise before austenite forms during the holding period. The sheet was then air cooled to the secondary temperature (320°C, between Ms and Mf ). Ferrite starts to form and the rapid cooling promotes martensite formation, although some bainite is also desired. The sample was finally put into the fluidised bed set at 320°C for 200 s which autotempers the martensite that forms. No temper pass rolling was applied post auto-tempering.
In summary, the production and assessment of a single grade can be carried out in <2 weeks using the RAP method, with a single 4.5 kg cast producing enough final product material for the equivalent of 72 tensile specimens, or 20 hole expansion tests allowing a wide range of heat treatments, thermo-mechanical processing variables etc to be investigated in a rapid turn-around time. The route offers opportunities to assess sensitivities to production variations and ‘what if’ scenarios when developing new alloys/new processing methods.
Characterisation and testing
Elemental analyses were carried out on the as-cast billet by a combination of an Oxford Instrument Optical Emission Spectrometry (OES) and ELTRA CS-2000 Carbon Sulphur (C–S) analyser. For both techniques, a minimum of five measurements were made.
Samples for optical and SEM imaging were sectioned, mounted in conductive Bakelite and ground/polished to a 0.05-µm finish using Buehler MasterMet 2 non-crystallised collodial silica solution. 2% nital was used to etch the polished surface before optical microscope imaging and/or SEM imaging. A JEOL 7800F Scanning Electron Microscope with energy dispersive spectroscopy (EDS) capability was used.
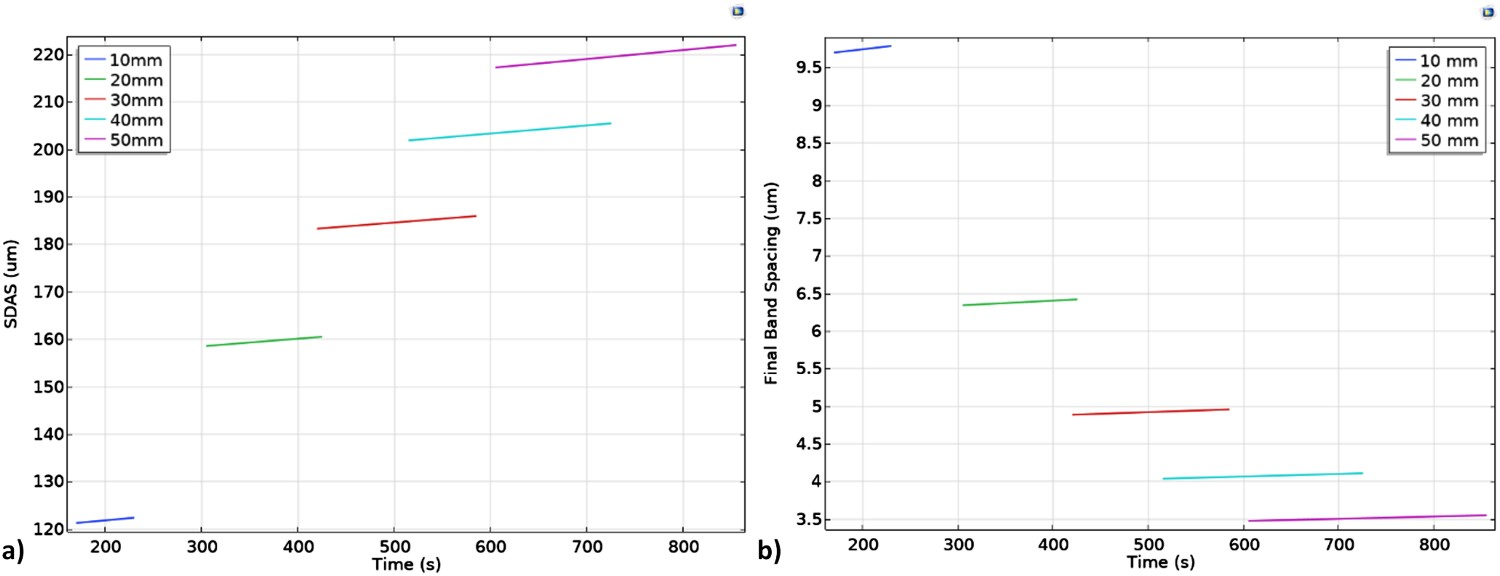
Samples were cut via EDM to sub-sized tensile specification (ASTM E8M [12]) with 6 mm gauge width, Figure 6, and tested following ISO 6892-1:2016 standard with a strain rate of 0.04 mm min−1 until yield and 2 mm min−1 beyond this. An Instron 30kN tensile tester was used and the strain measured using an Instron 260–107 clip-on extensometer with a gauge length of 25 mm. The data load, displacement, stress and strain values were collected and analysed by the Instron Bluehill 3 software. ASTM E8 subsize specimen geometry used for all mechanical testing (adapted from [12]).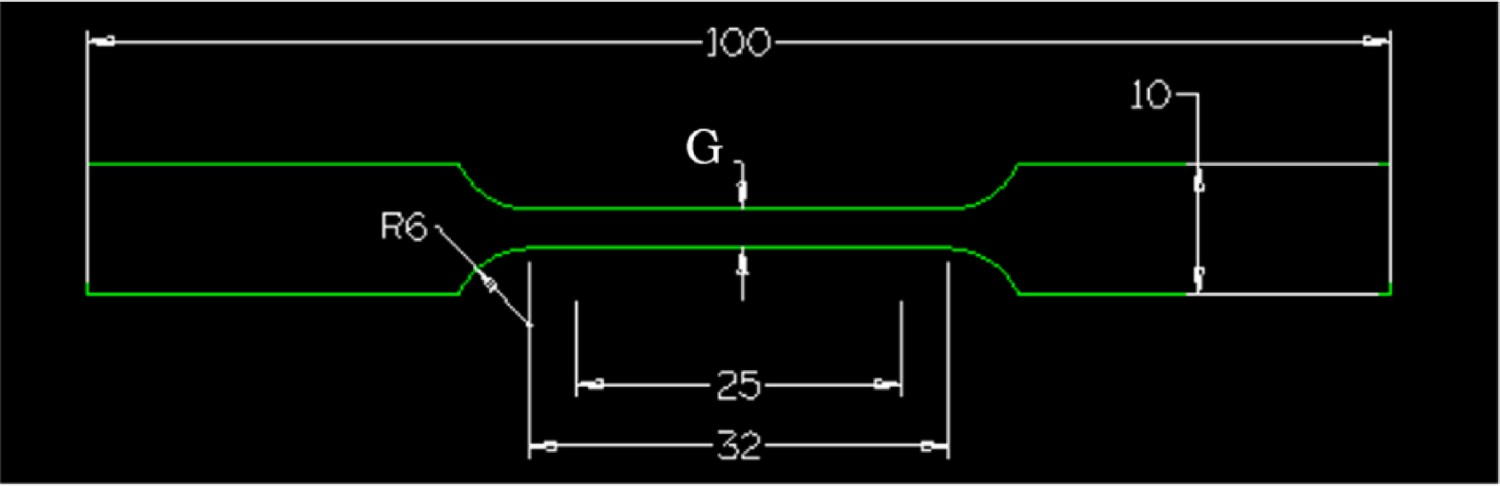
Results and discussion
Compositions
Table 4 shows the composition of the cast produced in this study. A comparison between the range of industrial product compositions (four main alloying elements) with those of the benchmark cast can be seen in Figure 7. Manganese, silicon, phosphorus, sulphur, niobium and chromium concentrations lie within the range. Both the carbon and aluminium contents are slightly low. This is due to the trace amount of oxygen present in the VIM chamber during casting from a small leak found during a vacuum leak check, which results in oxide formation and loss in carbon and aluminium. Compositions of the lab DP800 benchmark alloy, compared with the commercial product compositional range. OES, EDS (for Mn) and C–S analyser results of the lab-produced DP800 benchmark alloy. Values in wt-%.
Microstructural analysis
The as-cast microstructure was analysed and showed evidence of dendritic solidification. Figure 8(a) shows the SDAS formed during solidification with a spacing of 183 ± 35 µm (measured using line intercepts perpendicular to the secondary dendrite arms). This SDAS agrees well with the COMSOL modelling predictions for the mould size and cooling rate (183–187 µm). (a) As-cast microstructure showing segregation revealing the dendritic solidification structure.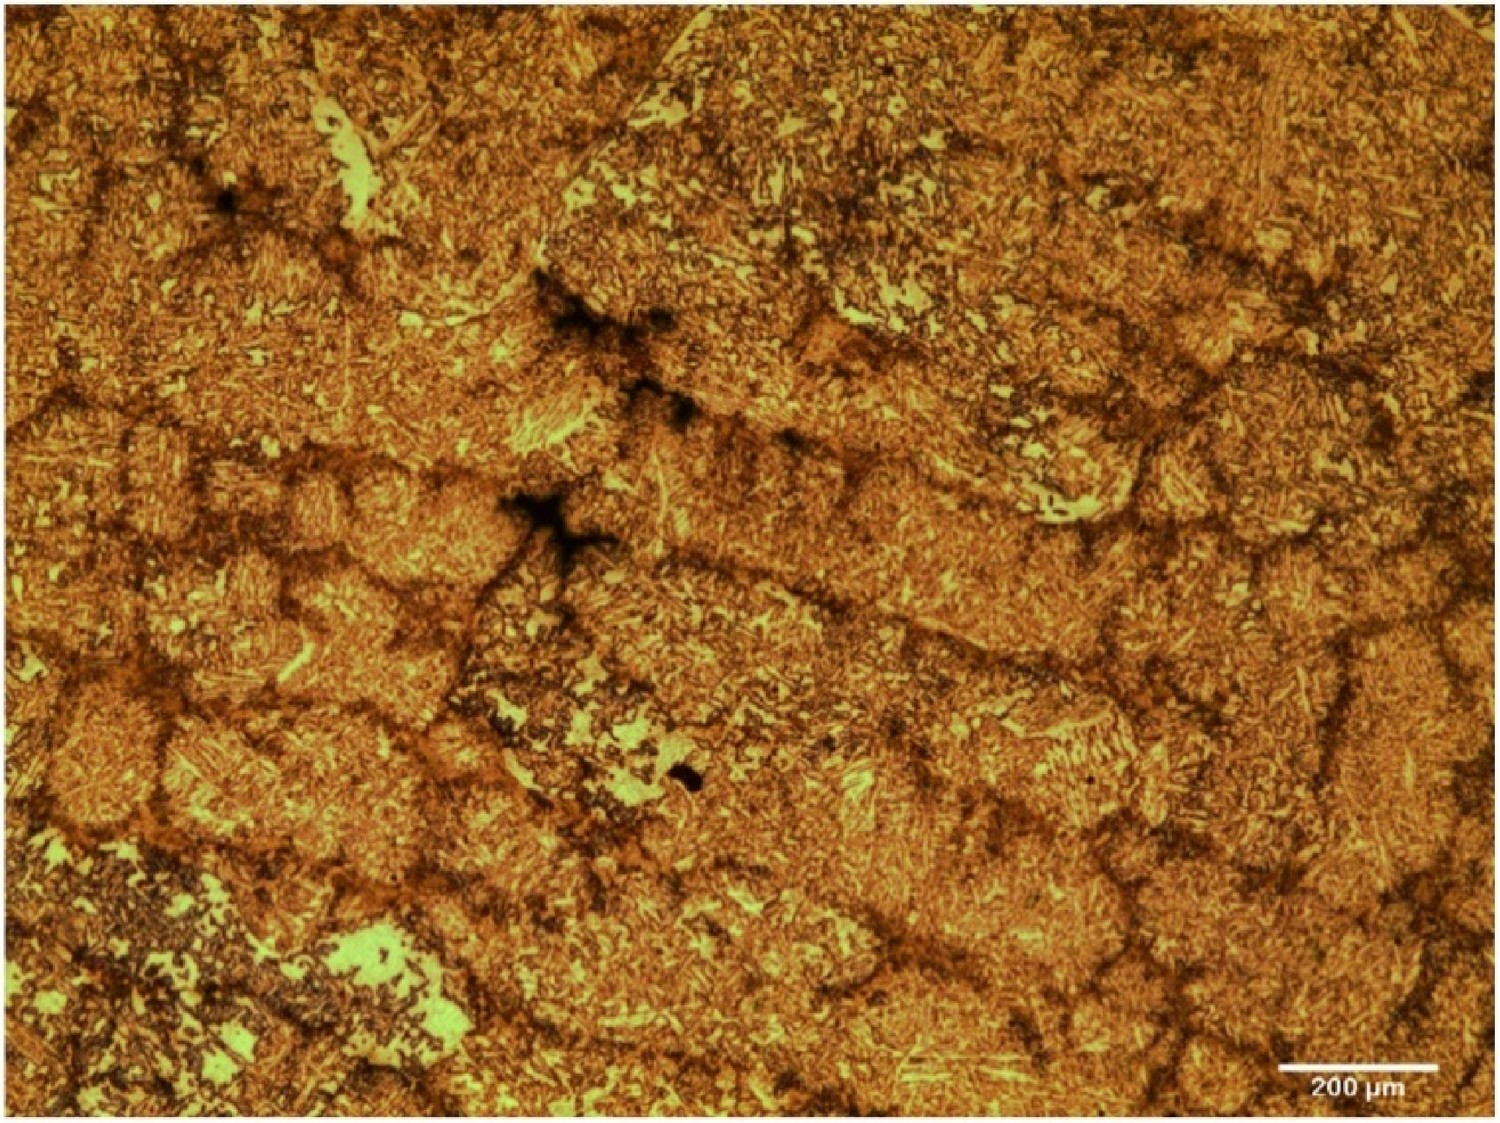
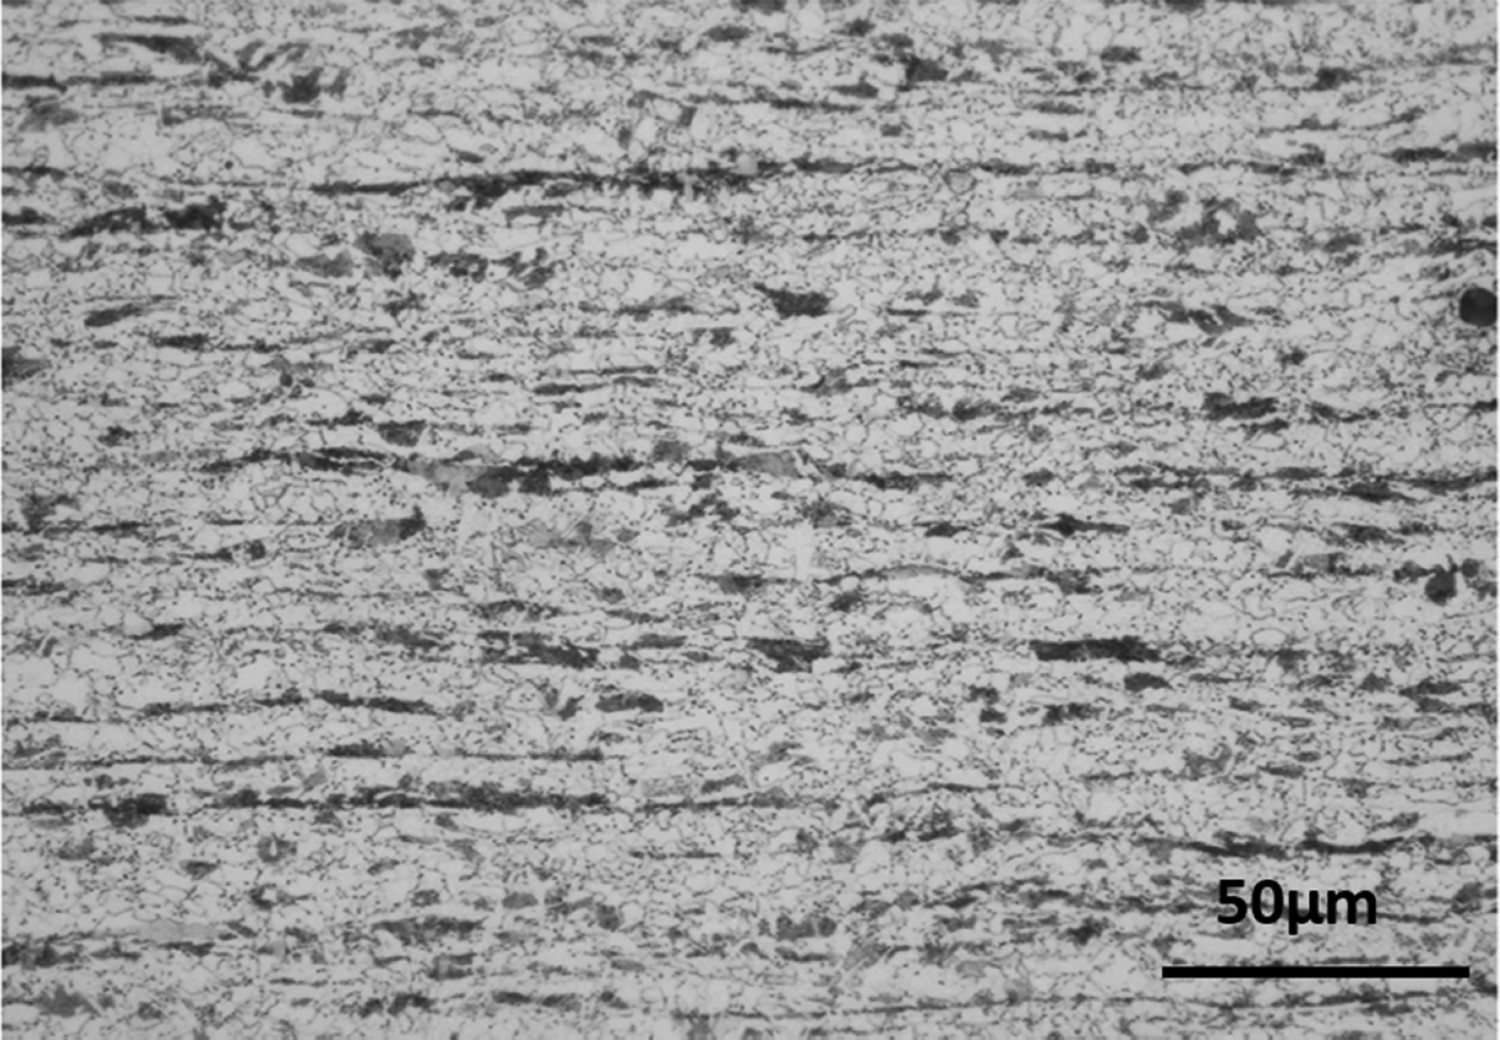
The microstructures generated after hot rolling and coil cooling simulation is shown by optical microscopy in Figure 9. A typical dual-phase hot-rolled microstructure is seen with ferritic grains (8.7 ± 4 µm with aspect ratio of 2.17) separated by bands of pearlite. This microstructure indicates that the slow cooling in fluidised bed furnace simulating the coil cooling inhibits martensite formation giving a microstructure that compares favourably to the industrial hot band product (shown in Figure 10), although the lab simulated material has a slightly greater band spacing (8.9 ± 3.2 µm) than the industrial material (8 ± 2.2 µm). The commercial hot-rolled material has experienced greater thickness reduction ratio (over 98%) during hot rolling than the lab-scale trial (90%) when rolled to the same 3 mm thickness. Therefore, slightly higher cold rolling reduction in the lab route compared to the commercial route is required to match the commercial final product band spacing. Alternatively, modifications to the cast thickness to better match the SDAS/rolling reduction could be used. Optical micrograph of the hot-rolled microstructure following coiling simulation in the fluidised bed furnace. Optical micrograph of industrial hot-rolled product.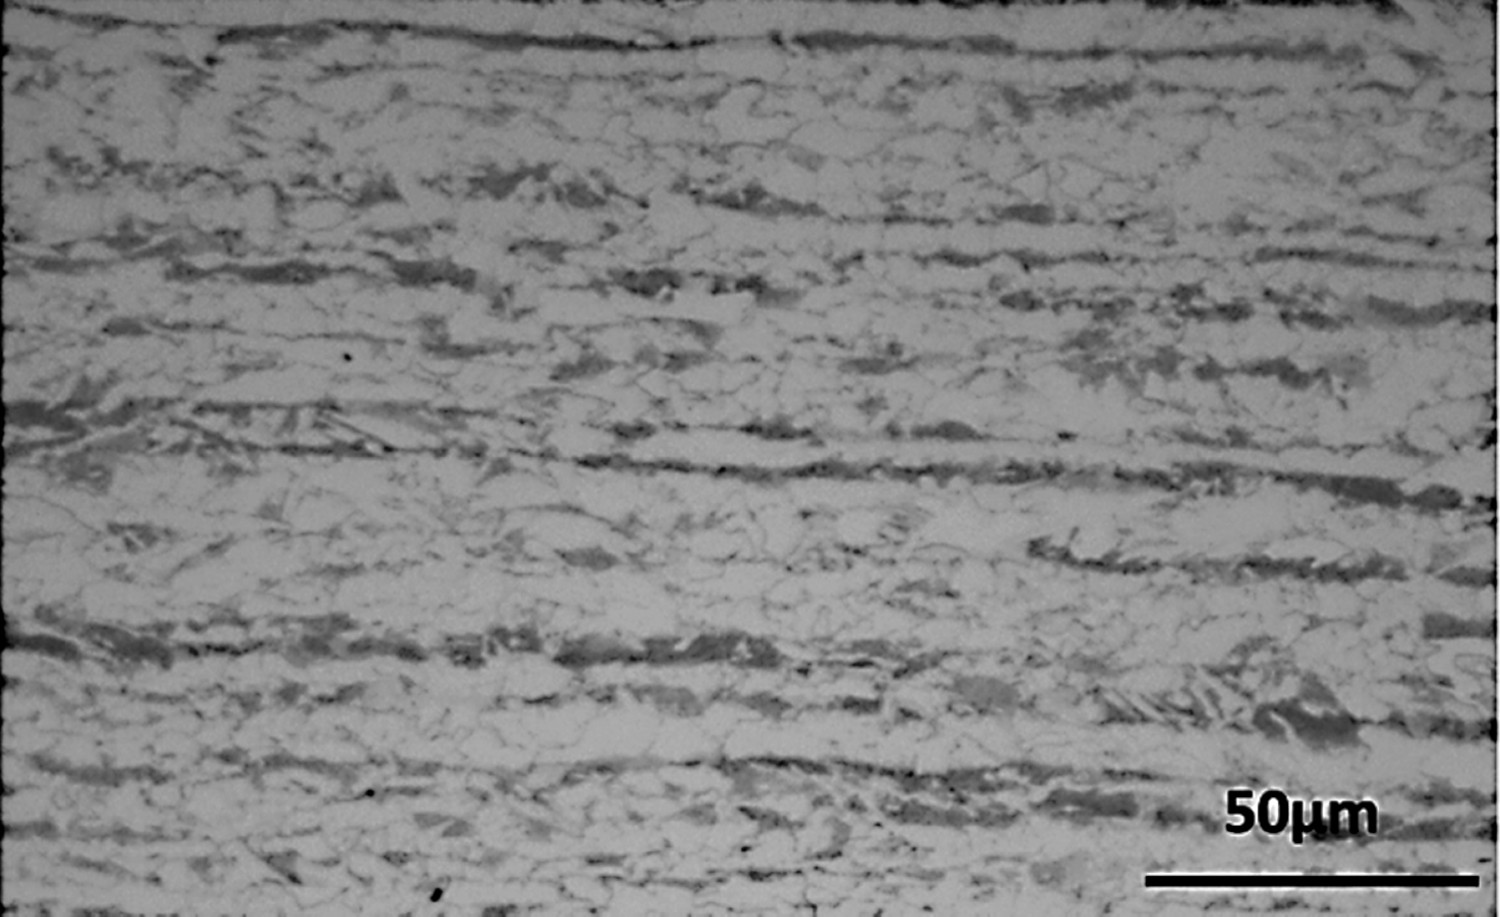
The strip is then descaled and samples were cold rolled from 3.0 to 1.2 mm or to 0.88 mm. The model predictions indicated that the correct band spacing should be achieved by rolling to 0.8 mm; a 1.2-mm thick strip was also produced as a direct comparison to the commercial product thickness.
After following the commercial annealing cycle, SEM micrographs from the RAP and commercial 1.2-mm thick materials are compared in Figure 13 and show very similar microstructures. Detailed data analyses showed a difference in bainite and tempered martensite fraction between these two samples, as summarised in Table 5. Although the ferrite fraction is the same between the two samples, the amount of tempered martensite plus bainite doubled in the commercial product, although is a low fraction. This might be expected to give greater elongation but lower UTS for the industrial product (Figure 11). SEM secondary electron images of (a), industrial DP800 product, 1.2 mm thick; (b), lab simulated DP800, 1.2 mm thick. Fractions of the ferrite, martensite and tempered martensite + bainite within the commercial DP800 and lab benchmark trial.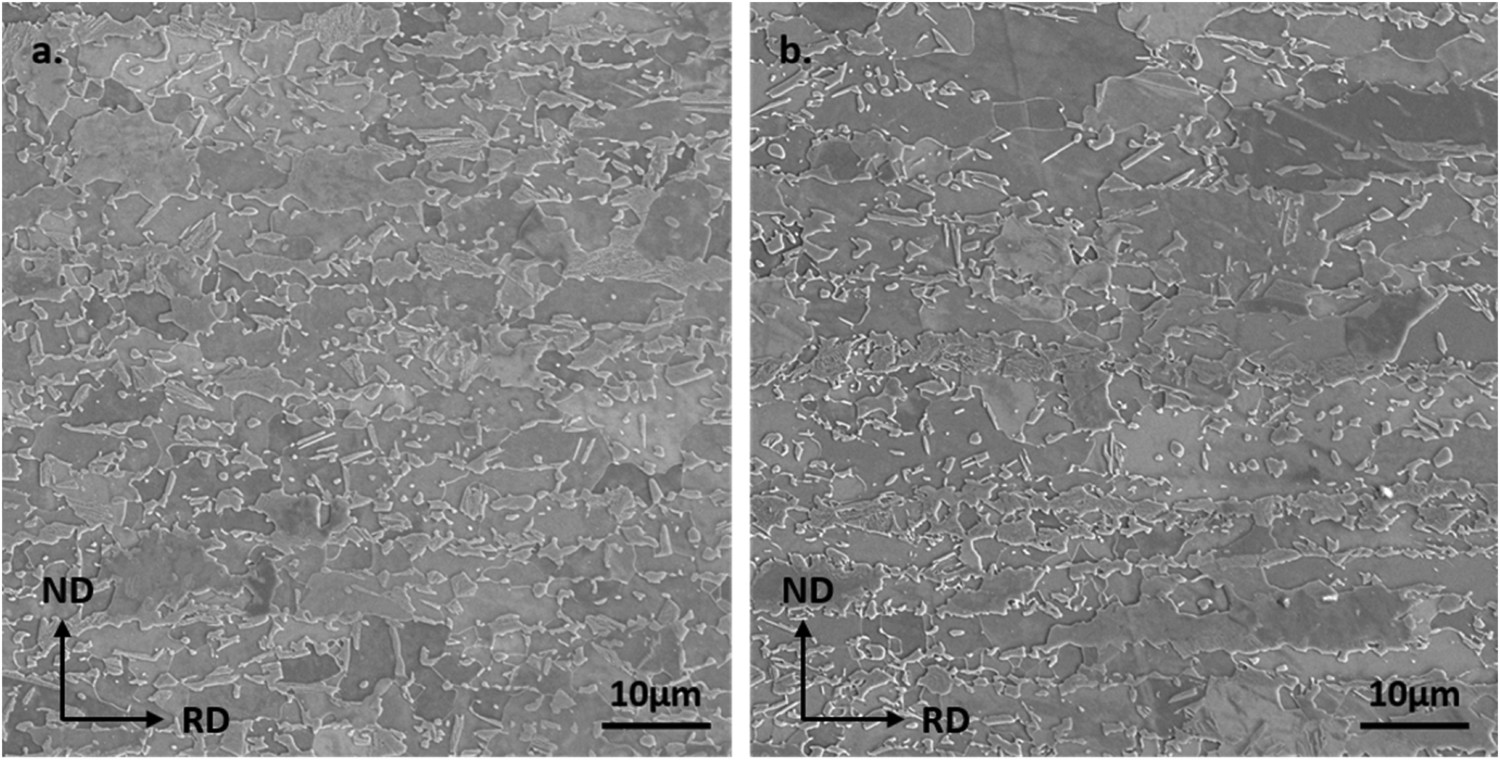
Relationship between the secondary holding time during annealing and the tempered martensite + bainite phase fraction.
Hardness and ferrite grain size values of the commercial DP800 and lab benchmark materials. The ferrite grain size is measured along the normal direction.
It is clear that the lab-produced 1.2 mm sample not only has a greater ferrite grain size but also shows a lower amount of TM + bainite. The second lab sample with a higher amount of cold rolling reduction (from 3 to 0.88 mm) and longer secondary holding period at 320°C during annealing (from 200 to 500 s), had 5.4% of TM + Bainite and 3.5 µm ferrite grain size) effectively increasing the hardness value to within the standard deviation of the commercial product.
Band spacing values of the commercial and lab-produced DP800 samples.
During the annealing heat treatment, the strip material is heated at a rapid rate during which the ferrite initially undergoes recrystallisation and then grain growth can occur. In dual-phase steel, the ferrite grain size is restricted by the presence of the Mn-rich bands (initially pearlite bands and then transforming to austenite). When the bands act to transform to austenite during heating they either prevent ferrite grains from further growth in the normal direction, or any ferrite grains that have grown to span a band is likely to be dissected by a newly formed austenite grain, effectively reducing the ferrite grain size. This shows the importance of understanding the metallurgical principles controlling the microstructure and properties of a steel alloy when using an RAP-based approach to simulate the process.
Mechanical properties
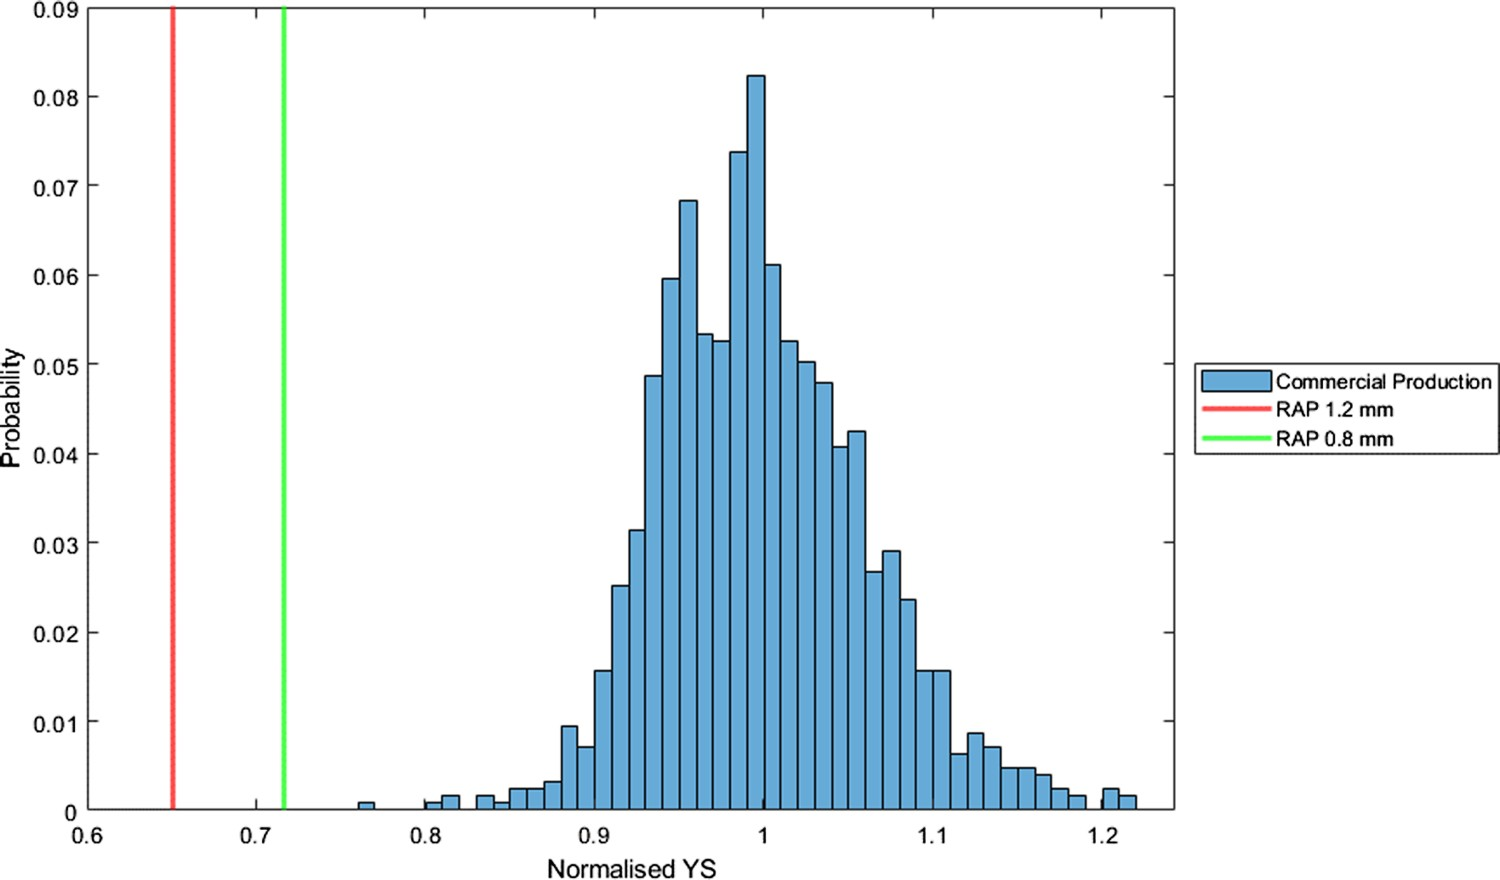
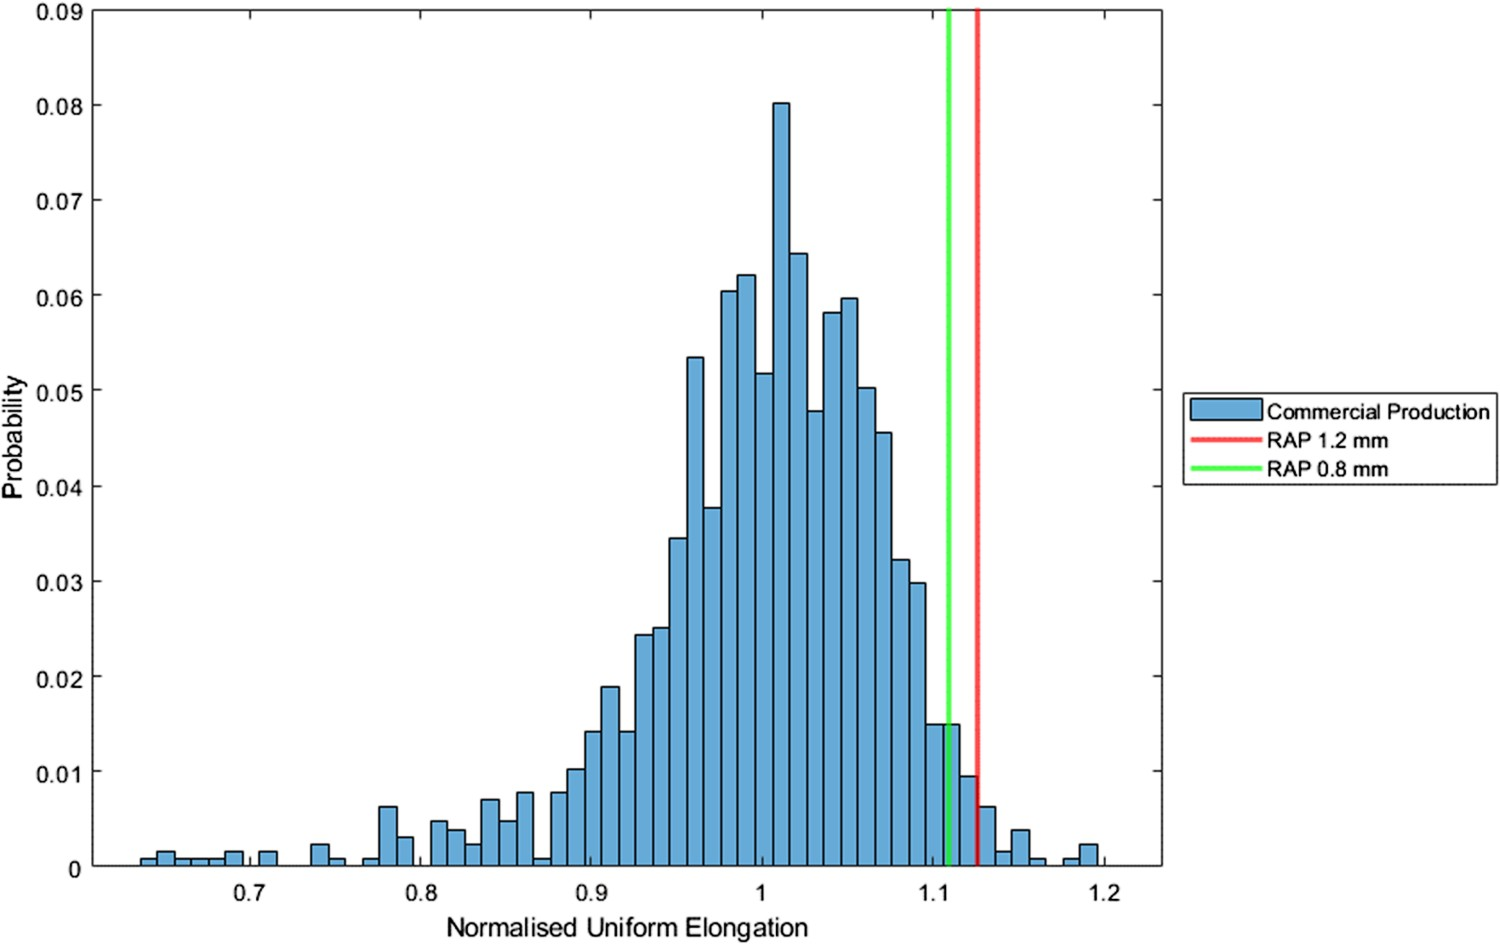
The sub-scale tensile samples were EDM cut and tested with the results summarised in Table 9. By comparing with the commercial product, the RAP produced 1.2 mm sample has a lower value in both UTS and YS. The 7% reduction in the UTS can be explained by the larger grain size in the lab material compared to the industrial sample. However, when looking at the UTS variations from the DP800 industrial product data (as shown in Figure 12), the UTS of the 1.2-mm lab benchmark alloy is within the distribution range. Similar to the hardness value, the 0.88-mm sample show improvements in both the UTS and YS. Significant difference in the YS between the lab material and the industrial material (and range of industrial data) is seen in Figure 13, this is discussed below. The reduction in sample thickness and the slight difference in TM + bainite fraction is not expected (or seen to) give any change in uniform elongation. Comparing to the commercial product uniform elongation range (as shown in Figure 14), both the as-received product and the lab benchmark samples have their uniform elongation value above the average but within range. Normalised UTS of the lab DP800 benchmark alloy samples, compared with the commercial product range. Normalised YS of the lab DP800 benchmark alloy samples, compared with the commercial products range. Normalised uniform elongation of the lab DP800 benchmark alloy samples compared with the commercial product range. Tensile test properties of the commercial DP800 and lab benchmark material.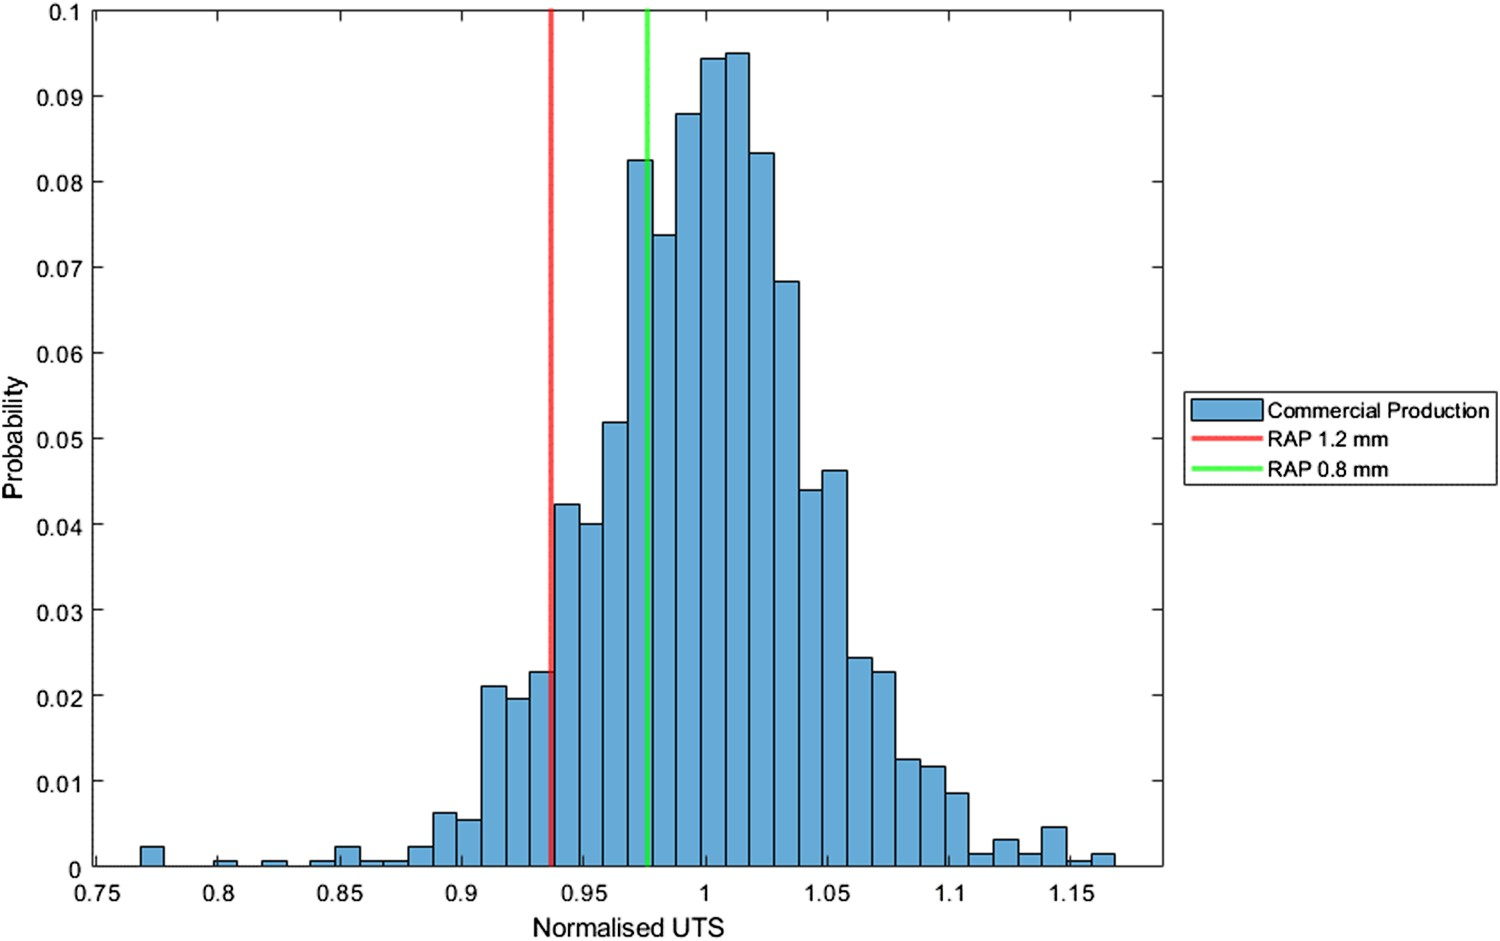
A comparison between the stress – strain curves of the lab and commercial materials is shown in Figure 15. The lab trial 1.2 mm sample has lower tensile properties than the reference material (orange line). The modified 0.88 mm lab trial shows an improvement in strength levels, owing to its closer ferrite grain size and phase fractions to the commercial product. Stress –strain curves of the lab benchmark alloy, with 1.2 and 0.88 mm thickness, compared to the commercial 1.2 mm thick material. Samples were cut based on ASTM E8 standard and tested based to ISO 6892-1:2016 standard.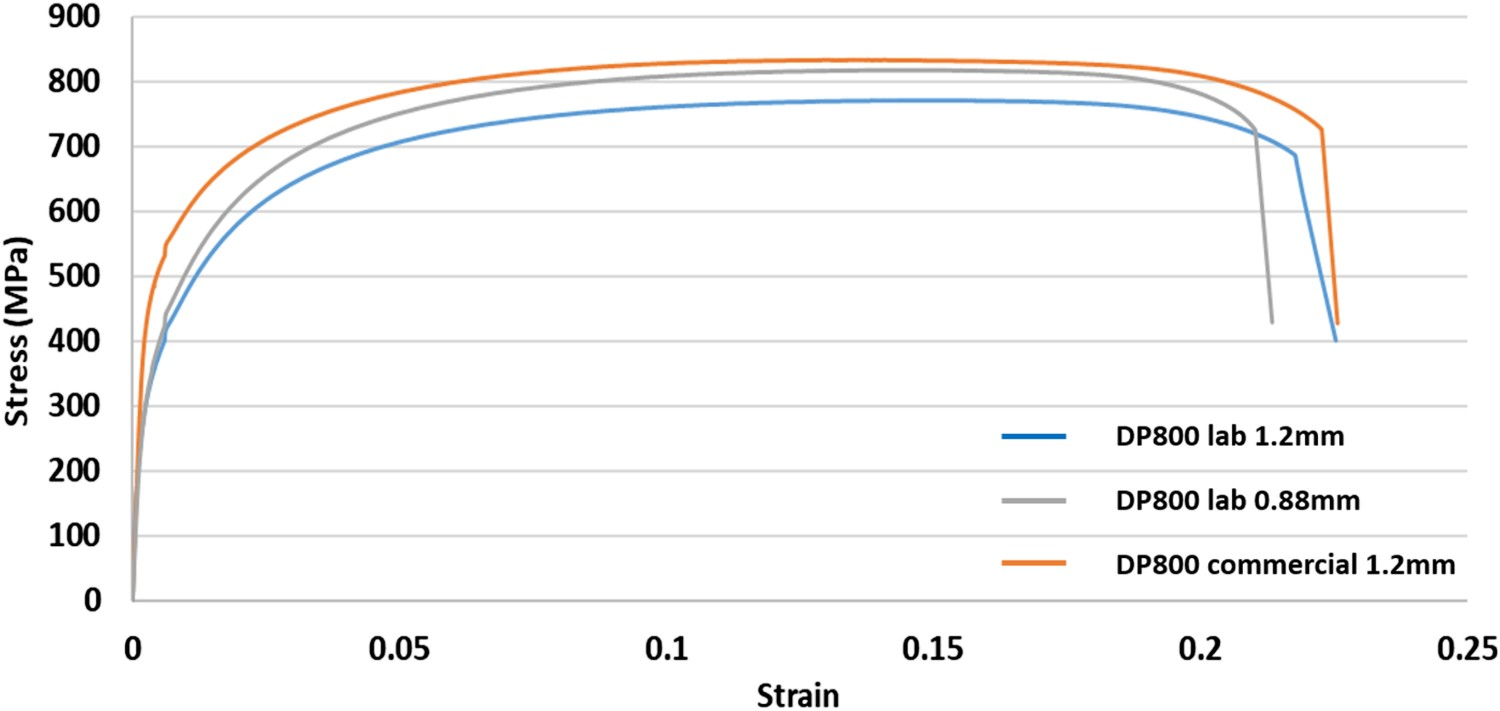
The larger grain size and lower carbon content of the lab-produced samples tend to lower the UTS, YS and hardness compared to the industrial material. The Hall-Petch relationship in dual-phase steels has been studied in many research work [14–16]. The variations in σ
o (resistance of lattice to dislocation motion) and k (strengthening coefficient) are large due to the complex nature of dual-phase steels. Many factors such as carbon concentration, volume fraction of martensite and the martensite distribution will all change the σ
o and k value. Based on the literature [14–16], the following equation has been selected for this study, where d is the ferrite grain size (refer to Table 7). Although some variation in these parameters is seen in the literature and thus obtaining accurate absolute values is difficult, the relative change in strength due to grain size is much more consistent: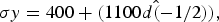

As a result, by comparing the commercial 1.2 and 0.88 mm lab benchmark samples, a 0.4-µm smaller ferrite grain size in the 0.88-mm sample should increase the UTS and YS by approximately 28 and 31 MPa, respectively. This is consistent with the 33 MPa difference seen for both UTS and YS experimentally in Table 9 for the two lab samples. This suggests that the vast majority of the strength difference is due to the reduction in band spacing (and therefore grain size). When comparing with the commercial product, however, the 0.5-µm difference in grain size does not account for the large discrepancy between the YS measurements. The lab benchmark trial ends at the annealing simulation. However, a temper rolling process is usually introduced to the DP grades after the industrial annealing process to improve the continuous yielding behaviour and shape/flatness. If an annealed DP800 sheet passes through the temper rollers, usually 1% strain is applied. This pre-strain of the commercial product should increase the YS in a tensile test but not the UTS. By considering 1% of strain applied to the lab-produced 1.2 mm sample in the tensile data, then the new effective YS will increase to 525 MPa, and the 0.88-mm sample will raise the YS further to 571 MPa. This brings the yield strength much more in-line with commercial variability considering 1% is a typical applied pre-strain (Figure 16(a)), with the elongation showing improved agreement also (Figure 16(b)). Normalised (a) yield strength and (b) uniform elongation of the lab DP800 benchmark alloy samples, before and after 1% pre-strain is considered. Compared with the commercial products range.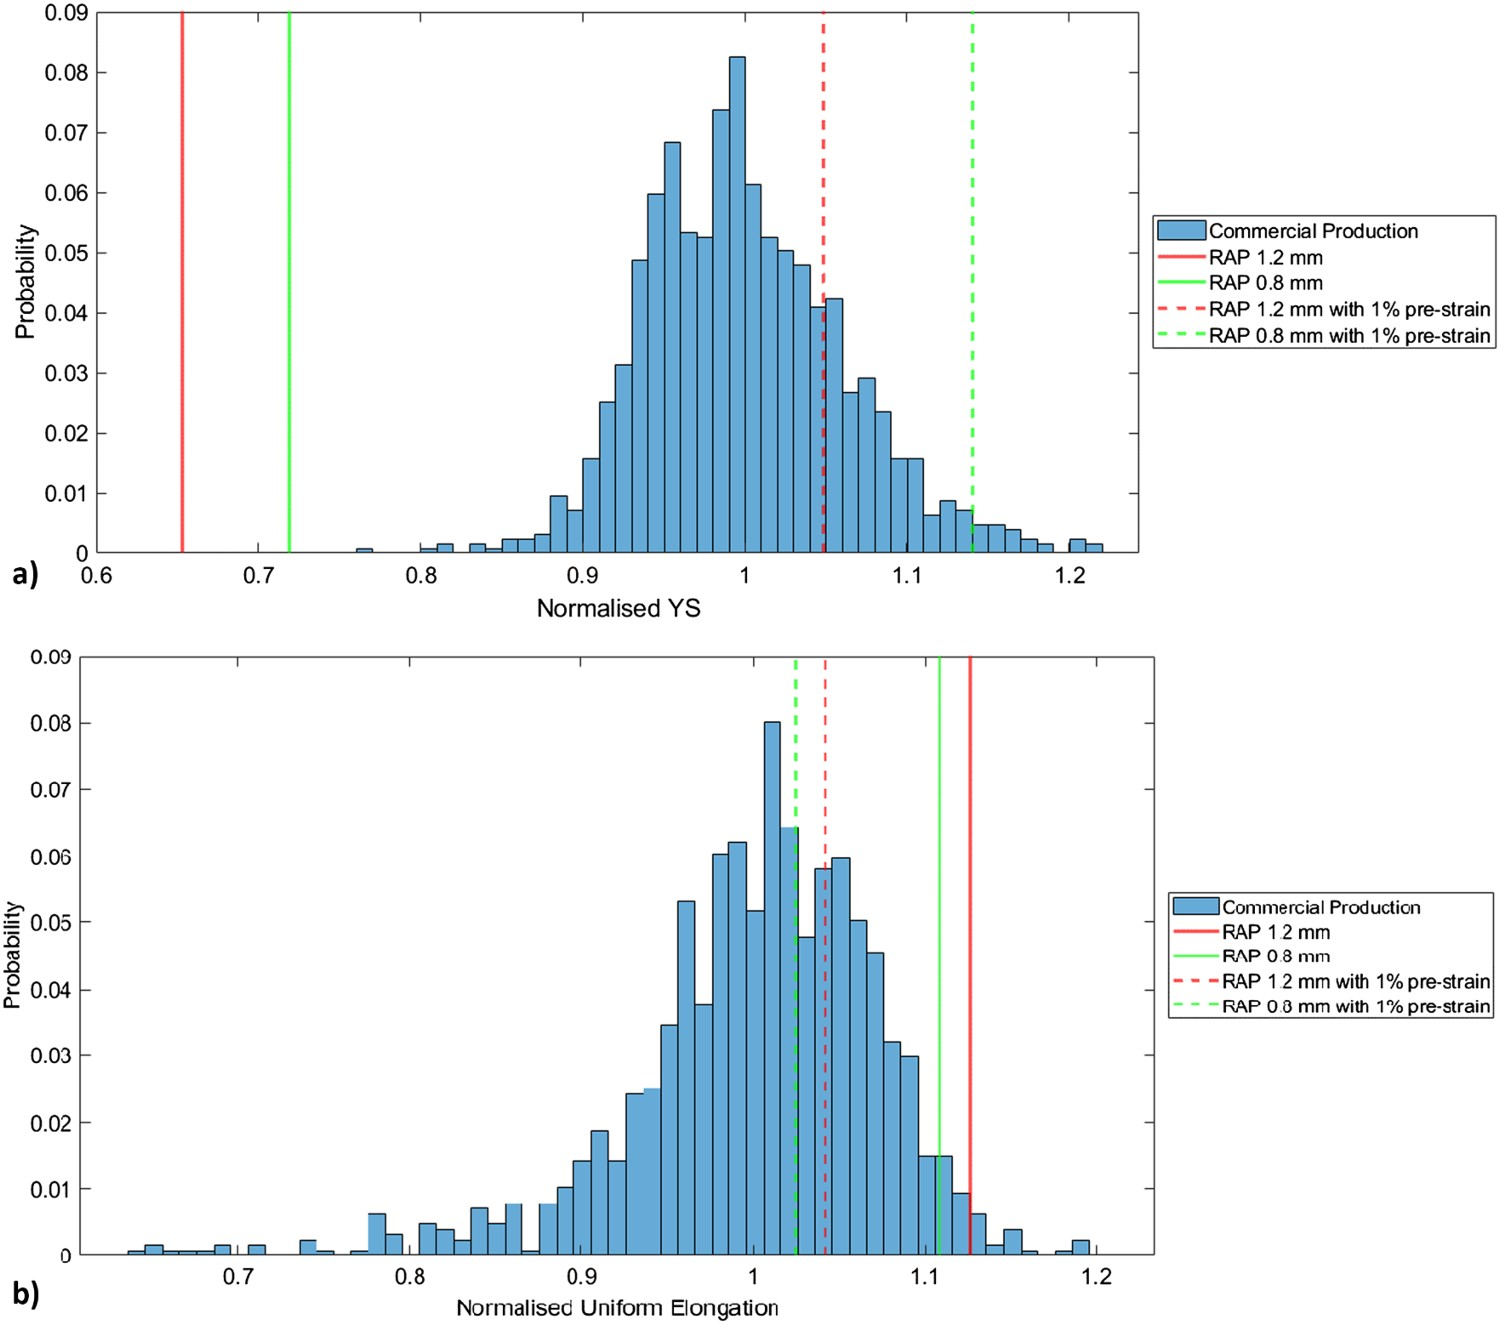
Conclusions
RAP enables testing within research laboratories and virtual environments rather than in the steel plant. The benchmark lab trial assessed here proved that the replication of the industrial DP800 product within the lab can be done within approximately two weeks testing time, from experimental design to comprehensive characterisation, allowing significant turn-around time for product development (72 tensiles or 20 hole expansion tests). More importantly, the scientific challenges that need to be considered to successfully produce the lab benchmark DP steel have been determined and overcome, giving confidence in the upscalability of laboratory findings for mass-produced steel products.
After initial characterisation of the commercial product, thermal modelling for different ingot designs and prediction of SDAS was used in order to determine the cooling rate required on casting to achieve the same final band spacing after rolling from the RAP process as in full-scale production. The final band spacing achieved agreed well with the model prediction but due to limitations in the rolling process, a minimum thickness of 0.88 mm was achieved (rather than the desired 0.8 mm) and as such the resultant band spacing was slightly coarser than in the commercial product.
Mechanical testing of the strip samples shows very good agreement in UTS, with the small discrepancy between the commercial and RAP lab 0.88 mm strip being attributed to the small difference in band spacing (and therefore grain size), as shown by Hall-Petch predictions. The as-annealed yield strength for the RAP-produced materials was significantly lower than that of the commercial product. This was attributed to the pre-strain given commercially via a final temper rolling process, which had no influence on the UTS and elongation. The consideration of the temper rolling process post auto-tempering further demonstrates the accuracy and benefits of the RAP process developed at WMG as well as the importance of ensuring for the most influencing processes, full through-process replication when comparing lab and commercial products.
The successful replication of an alloy such as DP800 which replies both compositional and thermo-mechanical aspect for performance, gives confidence going forward that alteration/improvements made during this RAP process will show consistent properties when upscaled to full production, thus speeding up alloy development for commercial level production.