
Abstract
The continuous casting process of steels is mainly influenced by the infiltration of mould slag into the gap between the strand and the mould and the temperature-dependent solidification behaviour of the slag. Thus, measurements of the temperature-dependent viscosity and the determination of the break temperature, TBr, which is related to the formation of the first solids in the liquid slag, based on the recorded viscosity data are essential to characterizing mould slags. To enable automatic, person-independent data analysis method, a procedure must be developed that calculates TBr based on the log η versus 1/T representation. This aim was achieved by detecting the maximum absolute value of the second derivative of log η after regression and relating the associated temperature to TBr; comparisons between these values and the manually determined values showed good agreement. Furthermore, the error was assessed by statistical analysis and the effect of sampling frequency was analysed.
Introduction
In the continuous casting process of steels, mould powder is added to the top of the liquid steel pool in the mould, wherein the powder liquefies and infiltrates into the gap between the strand and the mould. This process is influenced by the casting conditions (e.g. mould oscillation parameters, casting velocity), and the slag viscosity has a particularly substantial influence [1]. Depending on the temperature profile, three layers (glassy, crystalline and liquid) are formed within the gap [2]. The horizontal heat transfer is mainly influenced by the formation of crystals and their corresponding amounts and morphologies [3], which are affected by the temperature when the first solids form from the liquid phase and by the history of cooling [1]. For lubrication, the viscosity of the liquid film close to the strand is important. Consequently, the viscosity at 1573 K and the break temperature T Br, which is related to the formation of the first solids in the liquid slag resulting in a substantial increase in viscosity [4,5], are characteristic values for mould slags. Both of the variables are identified from the temperature dependence of the viscosity η [Pa s], which is determined by a rotating bob viscometer at defined cooling rates [4,6–10]. The break temperature is defined by the intersection of the two tangents of the linearized curve branches within a logarithmic plot of viscosity versus the reciprocal Kelvin temperature [K−1] [11]. This process is performed manually by drawing a straight line that approximates the viscosity curve from the beginning of the recorded data until the temperature where a deviation from the constant slope is observed; this line is extended beyond this temperature. A second straight line is plotted that reproduces the linearized viscosity curve at temperatures just below the break temperature. This second line shows a substantially greater slope than the first line. The intersection of these two lines indicates the break temperature according to the graphical data evaluation, T G. This result may be influenced by the individual performing the technique. Thus, a systematic procedure is needed to overcome the disadvantage of the influence of operation variation and to provide an automatic determination method.
Experimental procedure
Mould slags were investigated with a rotational viscometer VIS403 from the company Bähr Thermoanalyse GmbH. The rotor has a diameter of 19 mm and a height of 22.5 mm. The inner diameter of the crucible is 22.9 mm. Both are made from a platinum/gold 95/5 alloy. Approximately 27 g of specimen mass is used for each measurement to ensure the rotor is completely immersed in the liquid slag. The slag is heated with the maximum furnace power to a temperature of 1673 K within 30 min and held for 15 min for homogenization. The non-rotating rotor is immersed in the liquid and begins to rotate at a speed of 150 min−1 at the end of the dwell. Then, the sample is cooled at a rate of 10 K min−1 while the viscosities are recorded at 1 K intervals, which means data are stored every 6 s.
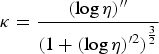
The selected set of specimens contained commercial virgin mould powders, mould slags sampled after use and mould powders modified by the addition of oxides relevant to operational aspects. A total of 80 specimens were used for the measurements and evaluations described below. The mould powders were decarburized at 700°C and premelted at 1400°C from the as-received state to prevent crucible corrosion. On the one hand, the break temperature was identified manually via the tangent method by a single person. On the other hand, an automated evaluation was performed. For this purpose, the data were exported into a spreadsheet program. Second-order polynomials were determined from three consecutive pairs of log η versus 1/T values, from which the second derivative of log η at the centre point was calculated. Afterwards, the maximum absolute value was identified for a later comparison with the break temperature. This procedure was sensitive to errors. In a minor percentage of cases, the scatter of log η caused maxima in the second derivative, which obviously did not agree with the break temperature. As a consequence, a regression of log η was performed. Intervals of Ti
± 25 K (T ≥ 1573 K) and Ti
± 5 K (T < 1573 K) were chosen for the determination of third-order polynomials following the calculation of the first and second derivatives of log η at Ti
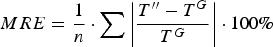
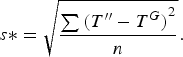
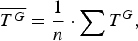
. Different interval sizes were selected to ensure sufficient reduction in scatter especially at the start of the experiment (high temperatures) without influencing the result of the break temperature. If the temperature interval is too small scatter will not be smoothed at high temperatures (Figure 1(a,b)), but a too large interval will misrepresent the measured viscosity curve close to the break temperature (Figure 1(c,d)) Effect of fixed regression intervals for the total measurement on T
Br evaluation with a too small (a) and its related magnification (b) and a too large interval (c) and its related magnification (d).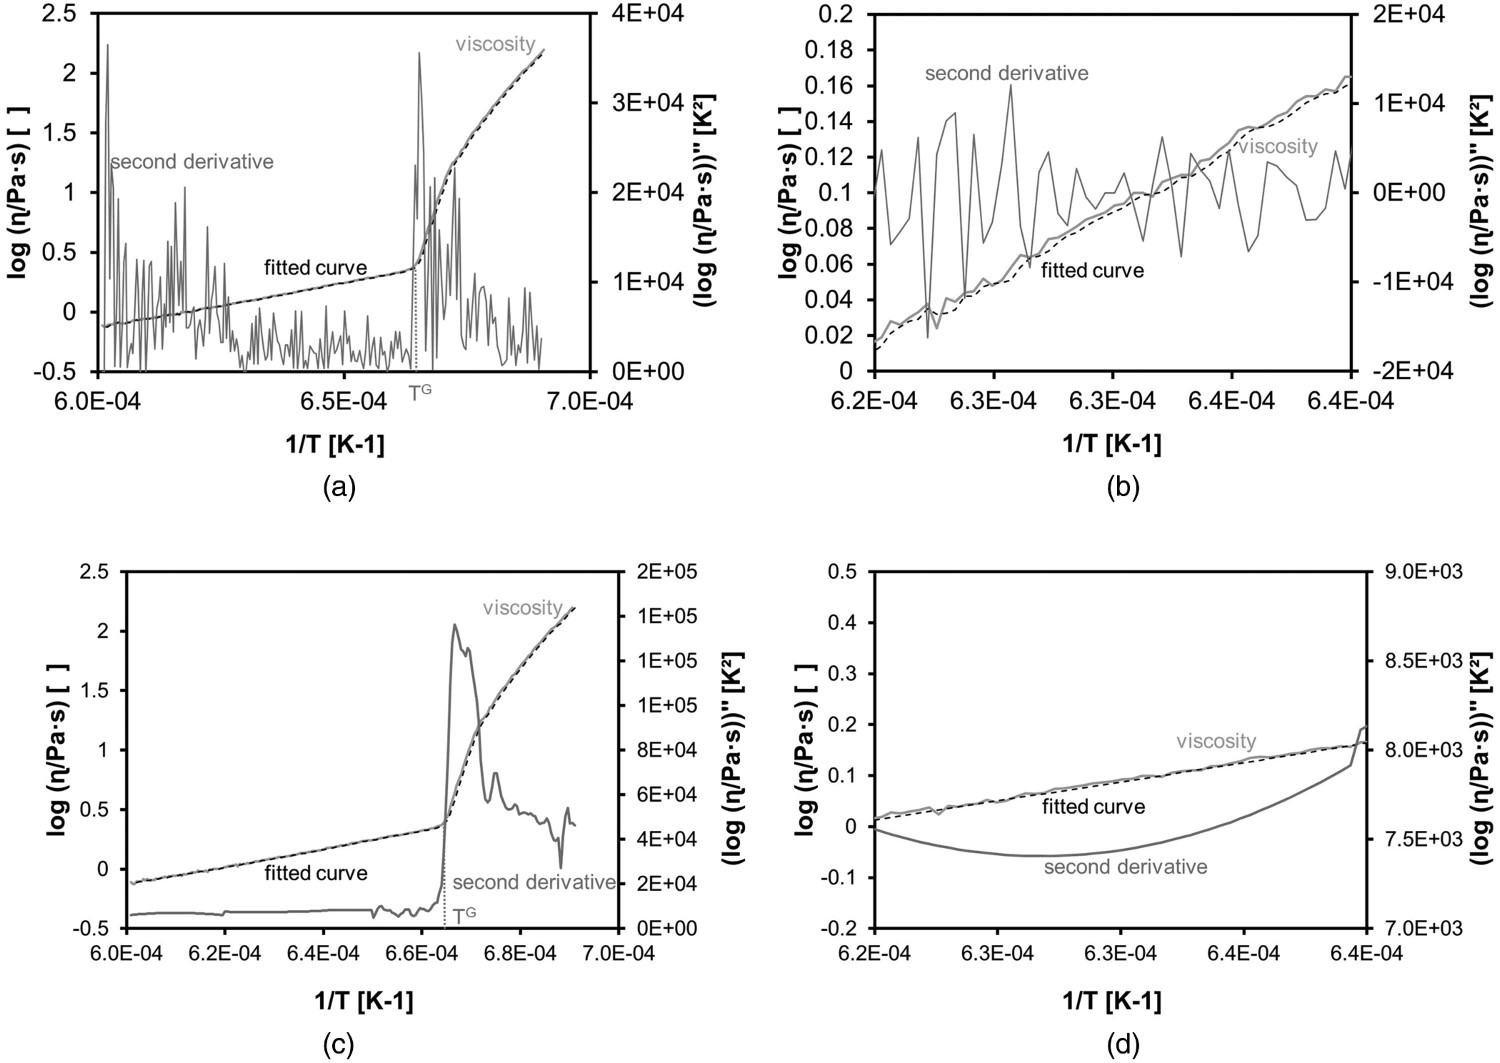
Furthermore, the curvature, 

Results and discussion
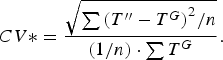
It was expected that the maximum absolute value for the second derivative of log η with respect to 1/T would be observed at the manually determined break temperature (tangent method). While Figure 2(a) illustrates the coincidence of (log η) with the break temperature, whereas Figure 2(b) shows the experimental verification of this assumption. The results verify that there is a reasonable agreement between the manual and graphical evaluation methods. This verification is also confirmed by the calculated values from Equations (2)–(5). Here, the MRE is 0.22%, s* is 4.89 K and CV* is 0.34%. All three quantities show that the two methods are in good agreement. Moreover, this method can be implemented into the software of the viscometer, enabling accurate data analysis independent of a person as soon as the measurement has been completed. (a) Example of the temperature-dependent viscosity curve of a mould slag and the corresponding graphical data analysis and 2nd derivative and (b) comparison of the calculated (2nd derivative) and manual analysis of the break temperature based on log η versus 1/T curves.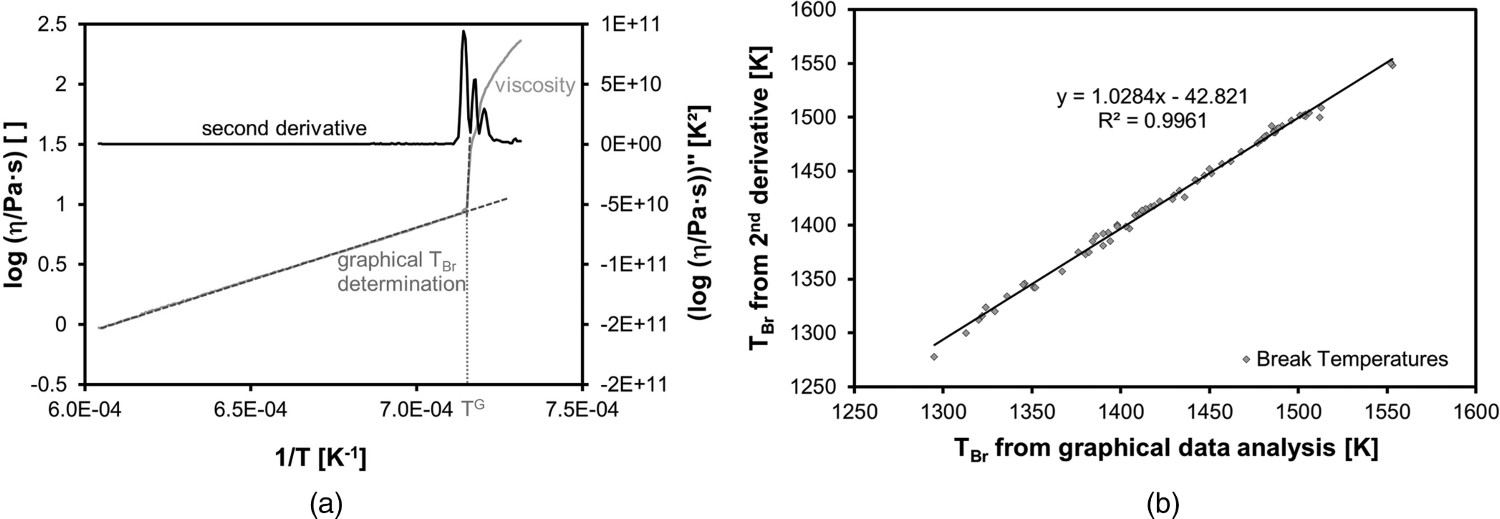
Accuracy of the break temperature depending on the frequency of data capturing based on 50 randomly selected measurements.
Attempts to achieve similar accordance of graphical analysis with the maximum absolute value of the curvature were not successful for all of the investigated samples without further improvements (Figure 3(a)). Good agreements could be achieved only for curves showing hardly any scatter within the measured data and a distinct increase of viscosity at the break temperature (Figure 3(b)). If the curve of the recorded data exhibits distinct fluctuations, discontinuities may arise due to the limited data sampling rate. There, a maximum of the absolute value of the curvature is observed, and this value may be considerably higher than that obtained at the break temperature. Thus, this approach is not suitable for break temperature determination without further improvement in the data evaluation technique. Since the first method results in reliable values, the application of κ was not further investigated. Examples of the temperature-dependent viscosity curve, the corresponding graphical data analysis and the curvature for (a) a smooth and (b) for a distinct increase of viscosity at T
Br.
Conclusion
Eighty data sets of temperature-dependent viscosity measurements were investigated to find an automatic procedure to simplify the analysis of the break temperature. This automatic detection could be successfully achieved by determining the maximum absolute value of the second derivative of the log η versus 1/T curves and relating the associated temperature to the break temperature. These results showed good agreement with the manually determined values; this agreement was also confirmed by statistical analysis.