
Abstract
The effect of tempering conditions on the carbides in P110 casing steels with two different Cr compositions was studied. Local Mo and Cr concentrations varied from the nominal compositions by ≈± 0.05 wt-% Mo and ≈± 0.07 wt-% Cr. The size of the fine (<20 nm) MC carbides remained relatively unaffected by tempering. Fe-based carbides exhibited a large increase in mean log-normal size from 65 to 102 nm when tempered at 650 and 715°C for 45 min, respectively. This rapid carbide coarsening is attributed to the dissolution of M23C6 carbides at 715°C. Associated with this significant increase in carbide size was an increase in the rate of hardness reduction with increasing Hollmon-Jaffe parameter for temperatures above 650°C.
Introduction
P110 is a heat-treatable (quench and temper (Q&T)) low alloy steel that is used extensively in service conditions at temperatures >80°C as casing in downhole oil and gas applications. There is an interest in applying P110 in mild-sour wells. However, the combination of H2S and elevated temperature in a mild-sour environment can result in hydrogen damage to the steel and potentially premature failure. Therefore, there is an impetus to develop P110 casing steel that is resistant to hydrogen embrittlement (HE) while maintaining the required strength. Metallurgical factors that affect the performance of P110 in mild sour well applications include the martensite fraction after quenching, prior austenite grain (PAG) size, elemental segregation, dislocation density, grain boundary misorientation, and carbides [1,2].
Carbide size, fraction, shape, and distribution have been deemed important with regard to HE [1,2]. Carbides can potentially act as irreversible (effective) hydrogen traps that increase resistance to HE by hindering the movement of hydrogen and reducing the content of diffusible hydrogen [3]. Depover and Verbeken [4] found that the carbides with a size of 70 nm or larger will completely lose their hydrogen trapping ability because of the incoherent carbide/matrix interface, whereas carbides less than 30 nm in size normally retain (semi)coherent interfaces acting as effective hydrogen traps. In addition to carbide size and fraction of carbides, carbide shape and distribution affect HE resistance. It has been observed that carbides with elongated shapes located on PAG boundaries facilitate intergranular failure [5], while elongated carbides along the lath and block boundaries lead to sub-boundary strengthening [6].
Carbides can be modified through the addition of carbide-forming elements such as Cr and Mo and/or adjusting tempering conditions [7-9]. Studies have shown that the coarsening kinetics of M3C carbides can be retarded by an increase in Cr and Mo content [10,11]. However, excess Cr and Mo additions can lead to the formation of lenticular M23C6 carbides along PAGs that generally deteriorate HE resistance [12]. In addition, a rather complex interplay between the potential carbides (e.g. M3C, M7C3, and M23C6) can further complicate the evolution of carbides during tempering [13,14]. A critical assessment of the changes that carbides undergo with various tempering conditions (i.e. time and temperature) is required to develop casing steels suitable for sour service.
In this regard, the current work presents a systematic study on the influence of tempering temperature and time on carbides for Cr–Mo alloy P110 steels. Two as-rolled P110 steels with a Cr composition of either 0.52 wt-% or 0.77 wt-% were austenitised and quenched from 950°C for 15 min (min) and then tempered between 550 and 715°C for 15–390 min. The effects of tempering time and temperature on the carbide shape, spatial location in the microstructure, chemical composition, and size were investigated. Emphasis was put on the quantitative study of carbide population (i.e. size distribution). The mechanisms behind the variation in carbides were elucidated with full consideration of the thermodynamic stability of carbides, pre-tempering carbides, elemental segregation, micro-hardness, and carbide coarsening kinetics.
Materials and testing
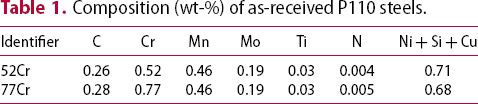
Composition (wt-%) of as-received P110 steels.
Full-thickness (7.3 mm) samples from each steel were austenitised at 950°C for 15 min and subsequently quenched into water to obtain a fully martensitic structure. A 15 min austenitising time was undertaken as a balance between minimising austenite grain growth while allowing for carbide dissolution. The measured PAG size for both steels at 15 min austenitising time was ≈11 µm [15]. With increased austenitising time (e.g. 90 min), the PAG size of the 52Cr (14.9 µm) was larger than the 77Cr (12.7 µm). The quenched samples were tempered between 550 and 715°C for times ranging from 15 to 390 min. The samples were air-cooled after tempering.
The quenched and tempered samples were mounted and polished and the microstructure was analysed using a Zeiss Sigma field emission scanning electron microscope (FESEM) with electron backscatter diffraction/energy dispersive X-ray spectroscopy (EBSD/EDS) capabilities. In addition, carbon replica samples were extracted and analysed using a JEOL JEM-2100F TEM/STEM equipped with an EDS detector. Micro-hardness measurements were conducted using a Wilson VH3100 Vickers indenter with an applied load of 2 kg and a dwell time of 15 s. All the metallographic and carbon replica samples and hardness testing were taken from the quarter through thickness position.
To facilitate the analysis of hardness as a function of tempering temperature and time, the time and temperature of each tempering process were converted to a Hollomon-Jaffe (HJ) value using the following equation [16]:
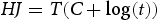
For the quantification of carbide size, particles with various shapes (e.g. rod, elliptical, and spherical shape) were all considered with the spherical equivalent diameter regarded as the carbide size. Approximately 250–350 random particles were measured from TEM micrographs for each sample and each condition. The measured carbide size distributions were fitted using the density function of a log-normal distribution [17].
Results
Electron microprobe analysis (EMPA) of quenched steels
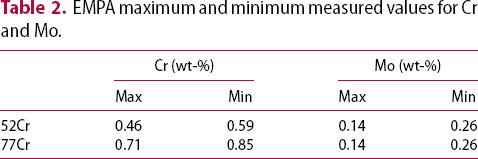
EMPA point line scan measurements of Cr and Mo were undertaken at the quarter thickness of an austenitised and quenched sample for both 52Cr and 77Cr steels. Figure 1(a and b) show the Mo and Cr concentration profiles obtained along the line scan in the as-quenched 52Cr steel, respectively. Peaks and troughs associated with microsegregation are readily observed. The local Mo composition ranges from 0.14 to 0.26 wt-%, and the local Cr composition ranges from 0.46 to 0.59 wt-%. The maximum and minimum values of Cr and Mo for both 52Cr and 77Cr steels are summarised in Table 2.
(a) Mo and (b) Cr point line scans for the 52Cr steel. The horizontal lines indicate the nominal compositions for Mo and Cr. EMPA maximum and minimum measured values for Cr and Mo.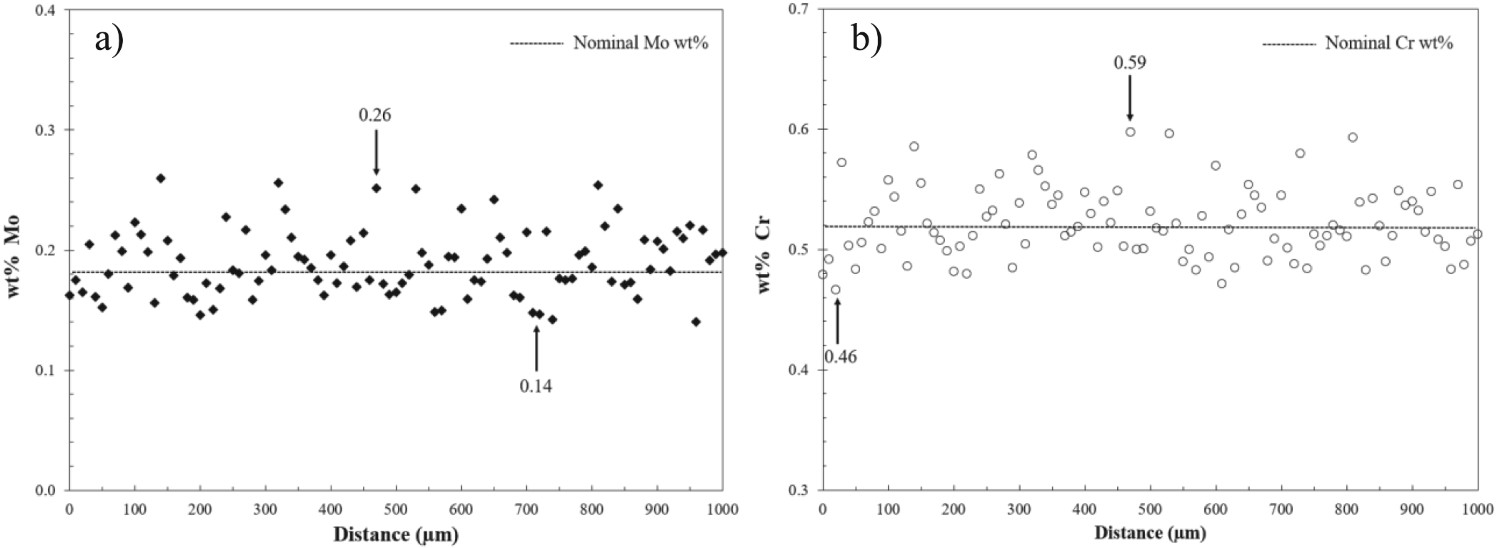
The observed cyclic variations in concentration imply that the thermodynamic driving force for carbide precipitation is location dependent. There are reports in the literature that the microsegregation of Mo facilitates the nucleation of Laves phase particles per unit area compared with negatively segregated regions [18]. In this study, the nominal composition of P110 steels (which is an average value) may not be representative of all areas; e.g. the carbide type and size distribution in solute-rich regions may be different from the ones in solute-poor regions. Therefore, TEM analysis on carbides was performed in multiple locations to order to minimise bias.
Microstructure of quenched steels
The microstructures of the quenched 52Cr and 77Cr steels were analysed by EBSD and are shown in Figure 2(a and b), respectively. Both steels exhibit a martensitic structure. The grain and lath orientations are randomly distributed, indicating that the texture of as-quenched martensite is weak. In addition, less than 0.2 vol.-% of retained austenite was detected in both samples [15]. The measured micro-hardness for both samples was ≈ 550 HV.
EBSD inverse pole figures and grain boundary maps of the as-quenched (a) 52Cr and (b) 77Cr. The low angle grain boundaries (misorientation θ between 2° and 15°) are depicted in grey and the high-angle grain boundaries (misorientation θ ≥ 15°) in black.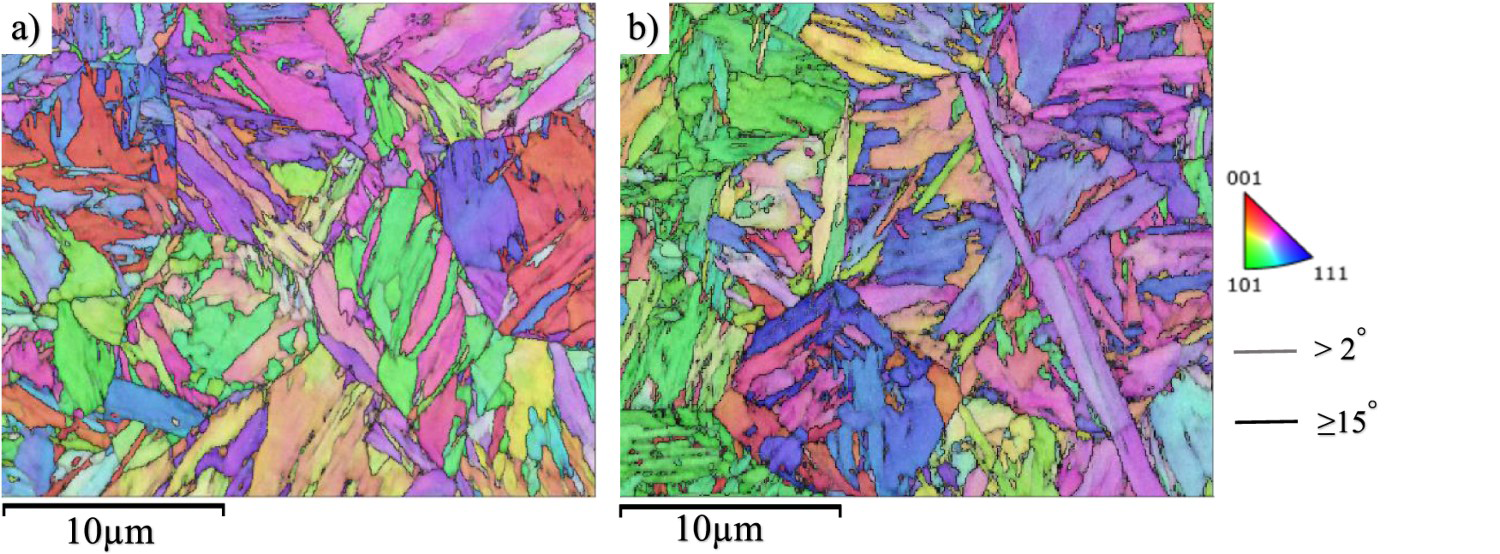
Micro-hardness of tempered steels
Figure 3 plots Vickers hardness vs the HJ parameter for all tempered samples. Included in the graph are labels providing the tempering times and temperatures for specific points. As expected, the hardness decreases with increasing HJ value. The variation in hardness with tempering conditions is similar for both the 52Cr and the 77Cr samples. However, of particular note (for both alloys) is an observable change in the rate of hardness variation with HJ that occurs at approximately HJ = 17.9 (650°C and 45 min.). Specifically, for tempering temperatures ≤ 650°C the rate of hardness variation with HJ is lower than for tempering temperatures > 650°C. This change in hardness reduction will be correlated with the evolution of carbides during tempering.
Micro-hardness vs HJ parameter for both the 52Cr and 77Cr steels.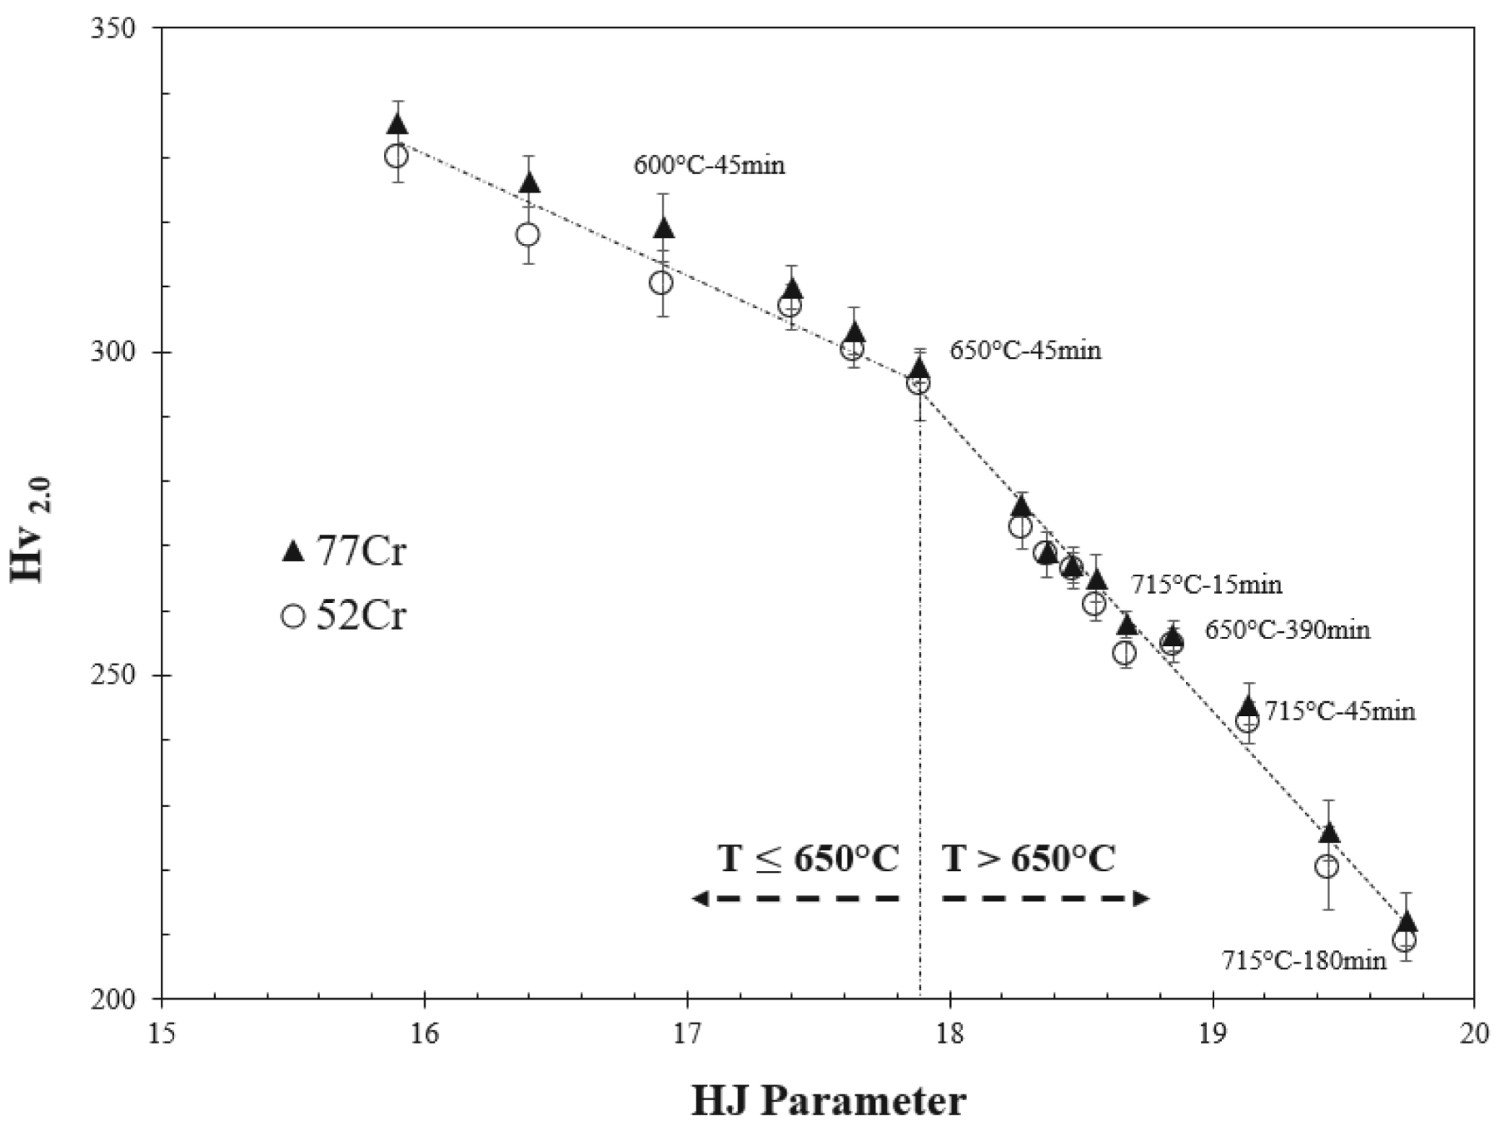
Carbides in quenched steels
STEM high-angle annular dark-field (HAADF) imaging of a carbon replica extracted from the as-quenched 52Cr steel is shown in Figure 4(a). In general, most of the precipitates were globular in shape and were typically less than 20 nm in diameter, although a few larger precipitates (40–50 nm) were observed. The EDS maps for Mo, Ti, and Cr are shown in Figure 4(b–d), respectively. Qualitatively, the precipitates are composed primarily of Ti and Mo with very little or no Cr. Both the 52Cr and 77Cr steels exhibited similar precipitate compositions.
(a) HAADF image and EDS mapping of (b) Mo, (c) Ti, and (d) Cr for the as-quenched 52Cr sample, (e) DF high resolution-STEM image and corresponding FFT image of MC type carbide.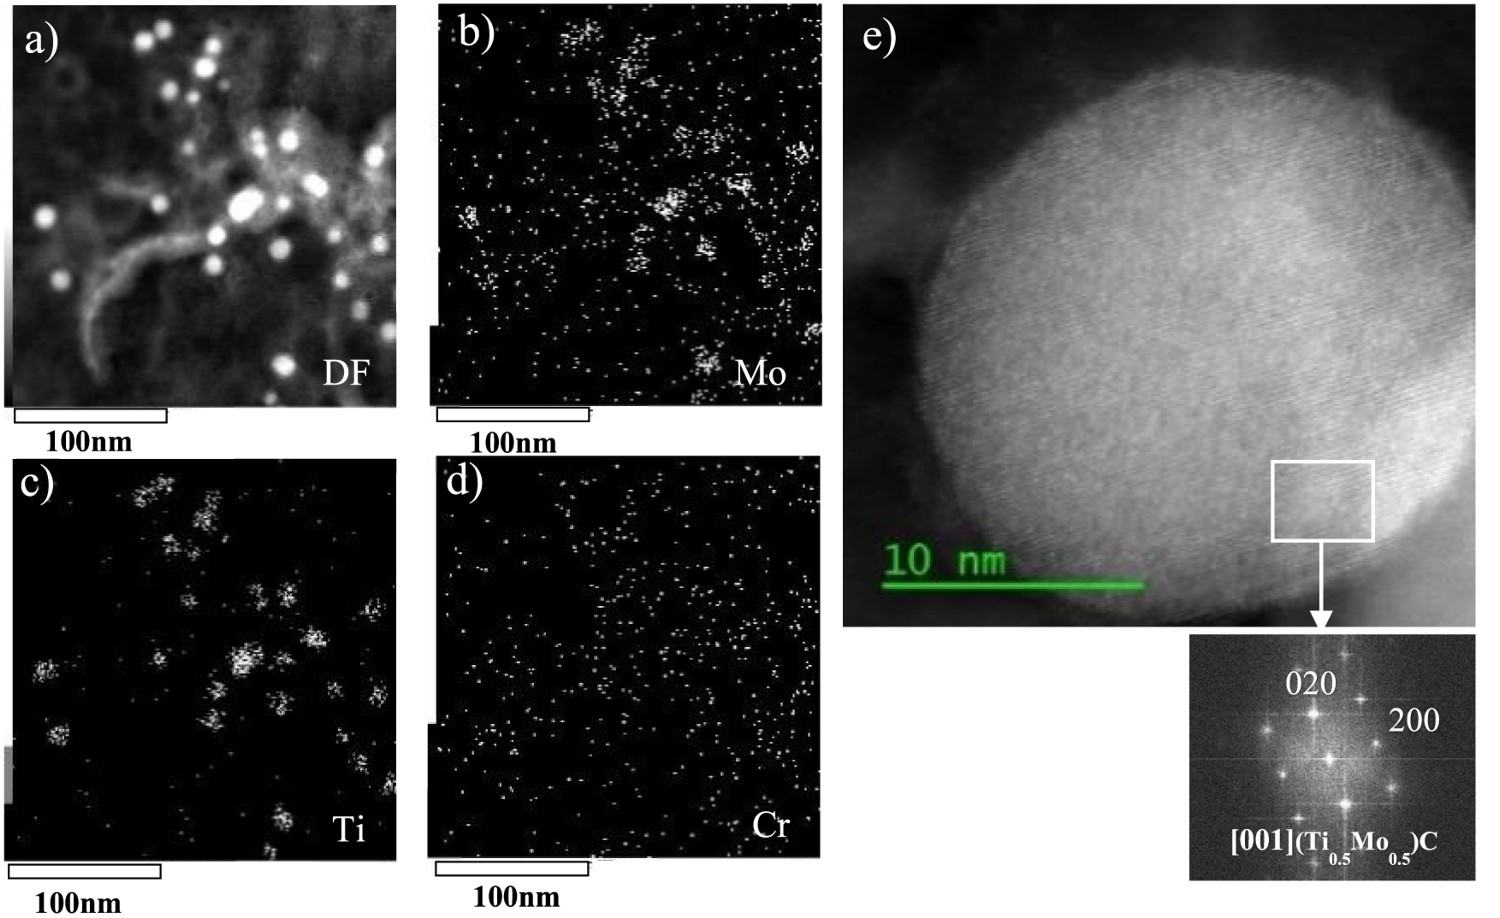
The precipitates observed in the as-quenched steels were analysed using electron diffraction and were indexed to a NaCl crystal structure and presented in Figure 4(e). This confirms that the as-quenched precipitates are primarily MC carbides. Compositional analysis using EDS of over 40 carbides showed the metallic content is 24–64 wt-% Mo with the balance being Ti. According to Miyata et al. [19], MC carbides can maintain their NaCl-type structure for Mo compositions up to ≈60 wt-%.
The equivalent diameter of more than 300 MC carbides was measured for both the quenched 52Cr and 77Cr steels. Figure 5(a) plots the number of carbides as a function of diameter for the 52Cr steel. The solid line in Figure 5(a) is the fitted log-normal distribution [17] to the data. The calculated log-normal mean size and standard deviation for the quenched 52Cr steel are 9.5 nm and 4.4, respectively. A comparison between the log-normal fitted curves for the 52Cr and 77Cr steels is shown in Figure 5(b). Both 52Cr and 77Cr steel exhibit a similar MC size distribution. This similarity was expected as both the Ti composition and the processing of the two steels are similar.
(a) Measured and fitted log-normal size distribution of MC size for the as-quenched 52Cr steel and (b) comparison of the fitted log-normal size distribution for the as-quenched 52Cr and 77Cr steels.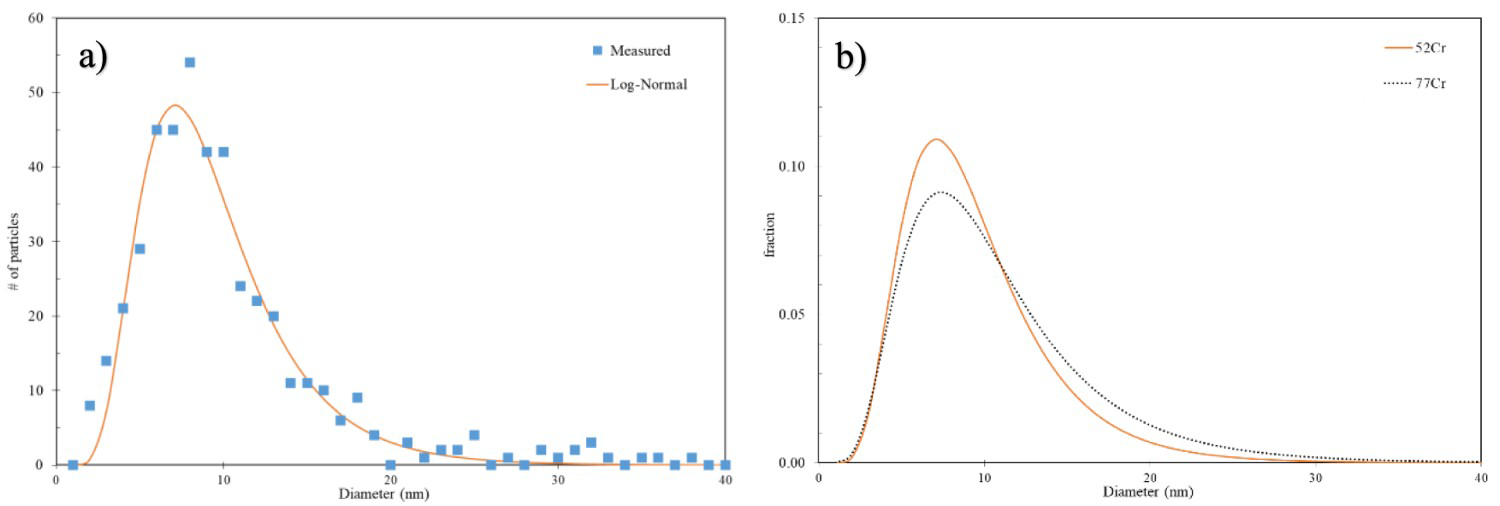
Carbides in tempered steels
FESEM micrographs of the etched 77Cr samples tempered at four different conditions are shown in Figure 6. Qualitatively, the carbides are larger with the higher tempering temperature. It is worth noting that an increase in temperature from 600 to 650°C resulted in the precipitation of elongated carbides along the laths, while the overall precipitate size remained approximately the same (Figure 6(b)). As temperature increased to 715°C, the elongated carbides were rarely seen while more elliptical ones appeared (Figure 6(c)). With extended tempering time from 45 to 180 min at 715°C, individual carbide size increased, while the number density decreased considerably, indicating carbide coarsening at the expense of dissolution of the finer carbides (i.e. Ostwald ripening). Coarsened carbides were mainly located at PAG boundaries due to faster short-circuit diffusion. Furthermore, traces of nanosized MC carbides were encountered in the matrix, as opposed to the coarse carbides that were mostly found at interfaces (i.e. PAG boundaries and lath boundaries).
FESEM secondary electron (SE) images of the 77Cr steel after tempering at (a) 600°C – 45 min (HJ = 16.9), (b) 650°C – 45 min (HJ = 17.9), (c) 715°C – 45 min (HJ = 19.1), and (d) 715°C – 180 min (HJ = 19.7).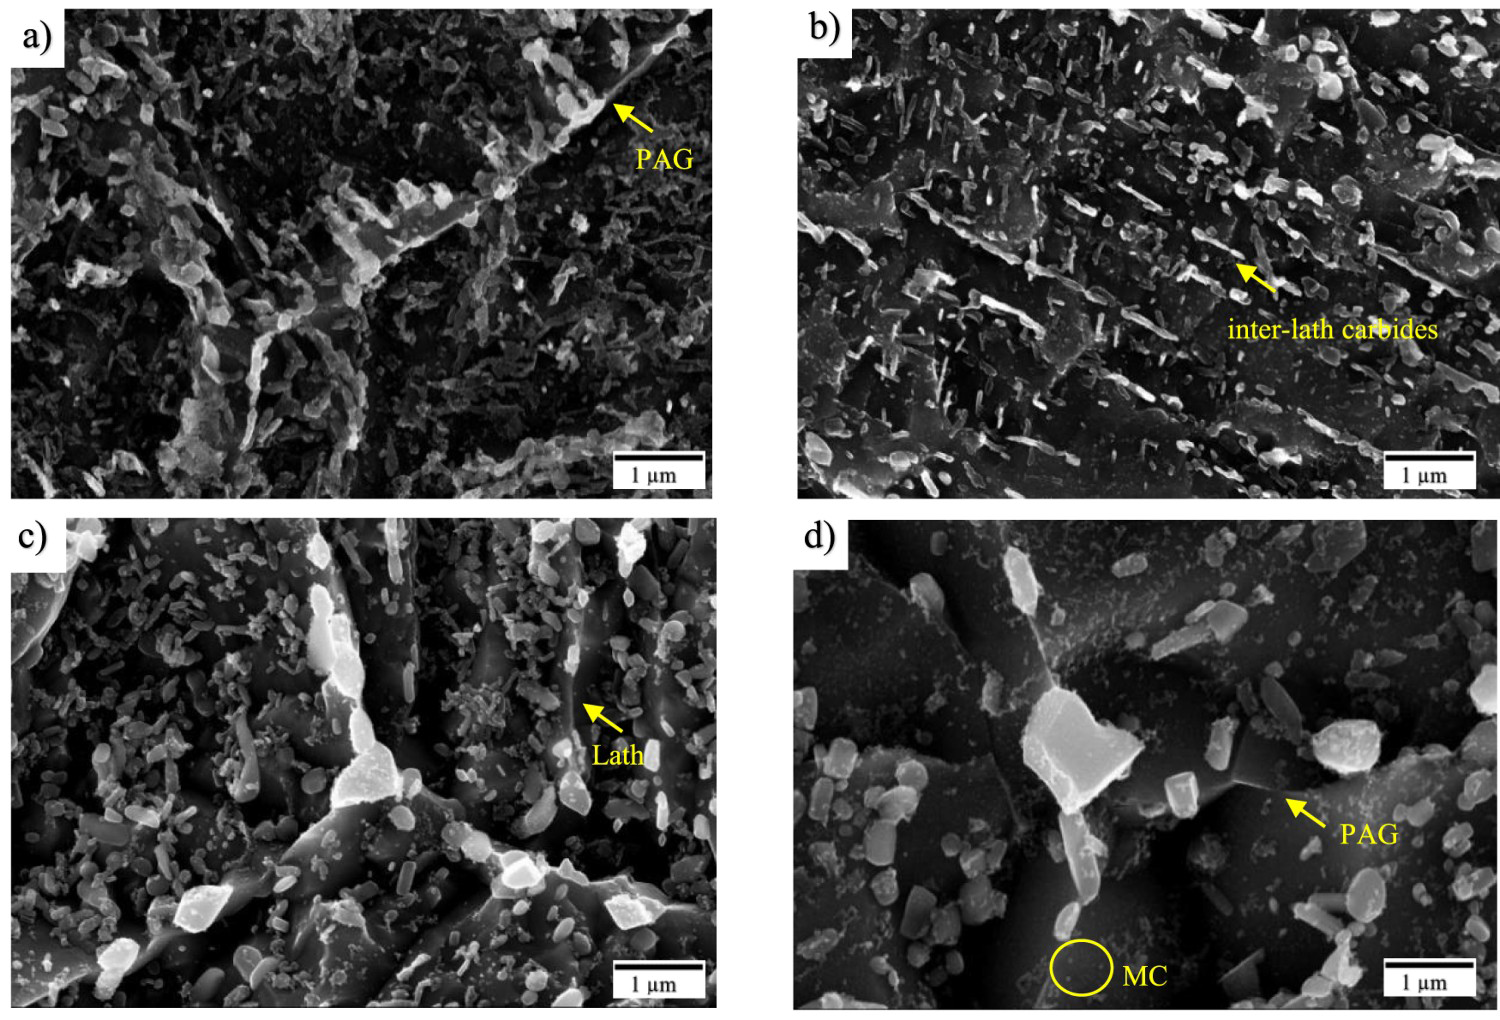
Figure 7 shows a STEM-HAADF image and the corresponding elemental maps for Mo, Cr, and Fe from a carbon replica sample extracted from the 77Cr steel tempered at 715°C for 45 min. Figure 7(a) shows the presence of a significant number of relatively large (>50 nm) elongated/rodlike carbides. The EDS maps indicate that the metallic elements are primarily Fe, Cr, and Mo. Similar carbides and EDS maps were observed for the 52Cr steel tempered under the same condition.
(a) STEM-HAADF image of the tempered 77Cr steel (715°C – 45 min) and corresponding EDS maps for (b) Mo, (c) Cr, and (d) Fe; (e–f) SAD patterns for the M3C carbides identified under the same condition.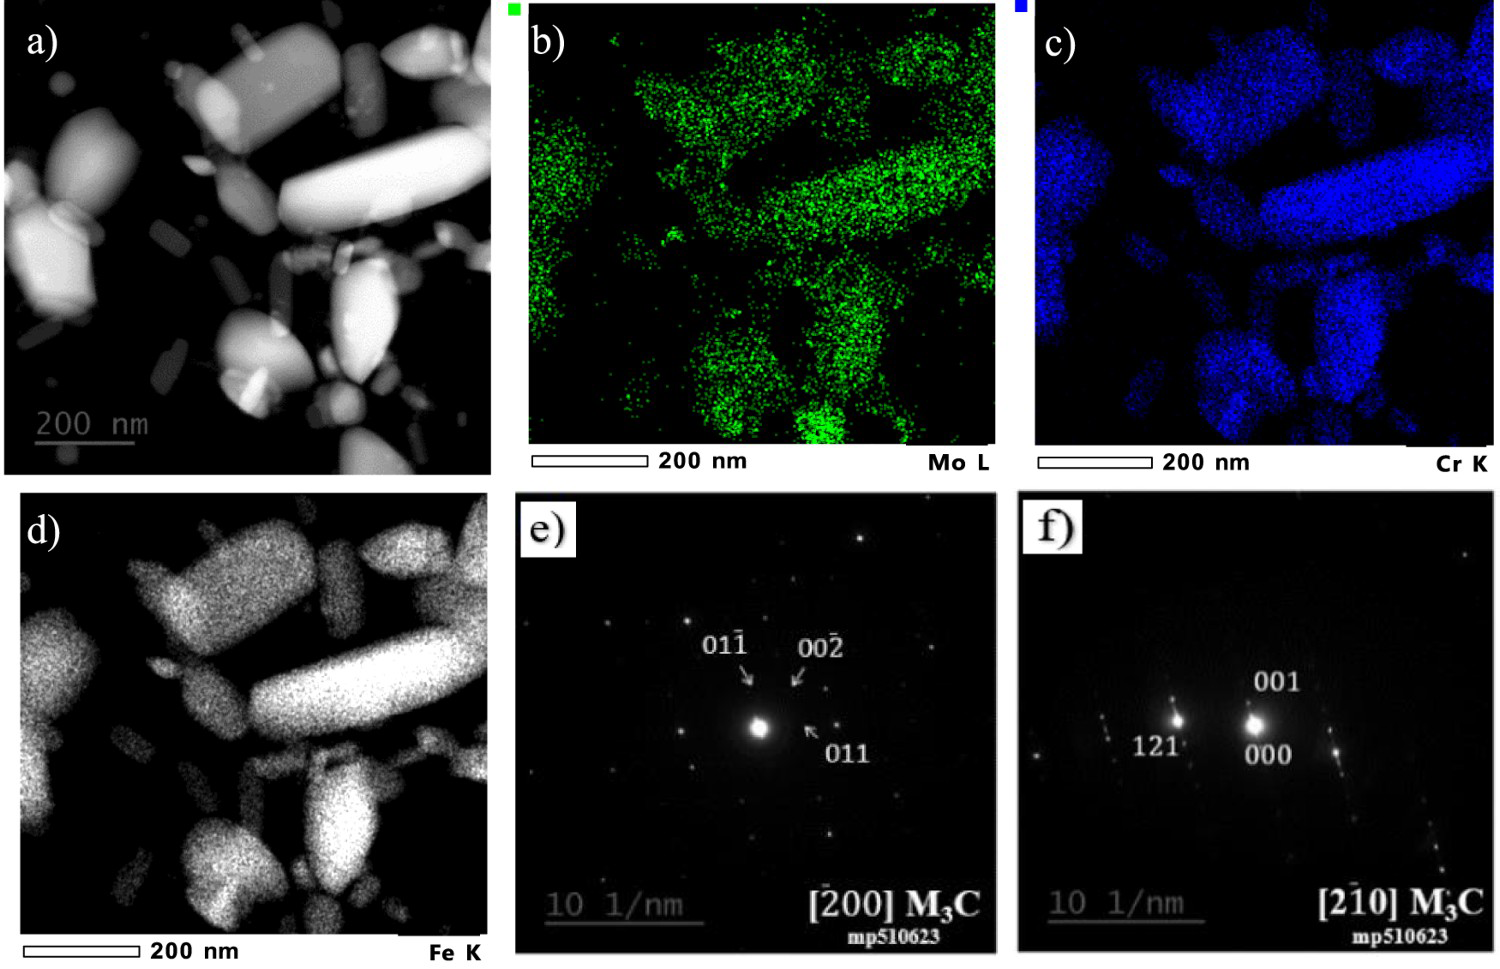
TEM electron diffraction patterns of selected carbides from both 52Cr and 77Cr steels at 600, 650, and 715°C were analysed to determine the crystal structure. In all samples, M3C carbides were identified. Selected area diffraction (SAD) patterns show an orthorhombic structure with lattice parameters a = 4.53 Å, b = 5.03 Å, and c = 6.74 Å (Figure 7(e and f)). Furthermore, M23C6 carbide with a cubic structure and a lattice parameter of 10.7 Å was identified in the 77Cr tempered at 650°C for 45 min (Figure 8). M23C6 particles appeared to have elongated shapes, corresponding to the elongated carbides found on lath boundaries (Figure 6(b)). Both the shape and spatial location of M23C6 are consistent with the characteristics reported in literature [14].
(a) STEM-Bright-Field (BF) image and (b) corresponding diffraction pattern of M23C6 carbide.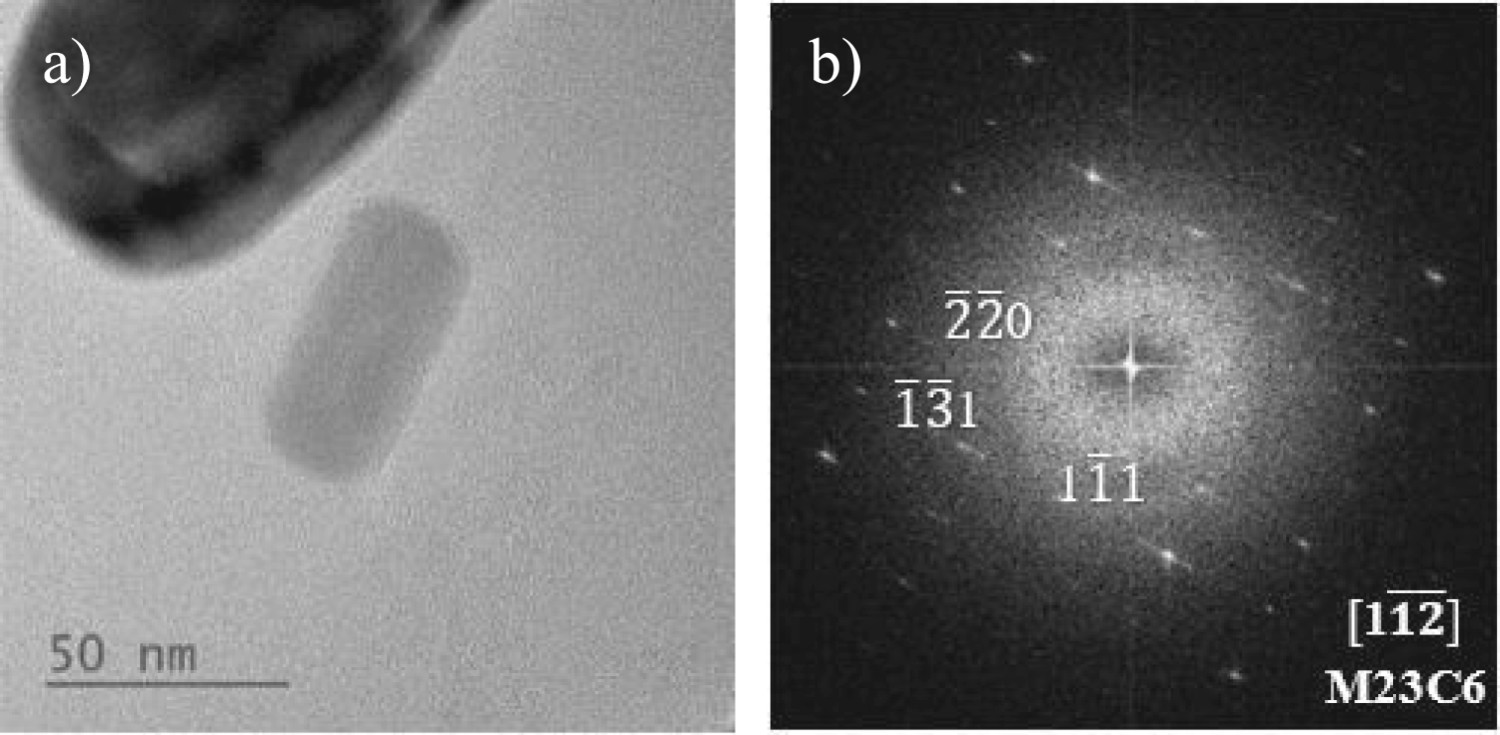
Compositional analysis of the Fe-based carbides was undertaken for both 52Cr and 77Cr steels tempered at 600, 650, and 715°C (45 min). Between 20 and 60 carbides were analysed for each condition. Figure 9(a) plots the number of carbides vs the wt-% Cr for the 77Cr sample tempered at 650°C for 45 min Figure 9(b) plots the number of carbides vs the Fe/Cr ratio for the 77Cr sample, also tempered at 650°C for 45 min. The solid lines are the log-normal distribution fitted to the measured composition data. A multimodal distribution in the composition is observed for both the wt-% Cr and the Fe/Cr ratio. The 52Cr sample exhibited a similar multimodal distribution for the sample tempered at 650°C. In addition to the two pronounced peaks fitted by the log-normal distribution, minor peaks can be seen in both Figure 9(a and b). These can be associated with precipitation from solute-poor or solute-rich regions confirmed by EMPA (Figure 1). The analysis technique shown in Figure 9 was repeated for both the 52Cr and 77Cr samples tempered at 600 and 715°C (45 min). A similar multimodal distribution was not observed at either temperature.
(a) Number of carbides vs wt-% Cr and (b) number of carbides vs Fe/Cr ratio in the 77Cr steel tempered at 650°C for 45 min.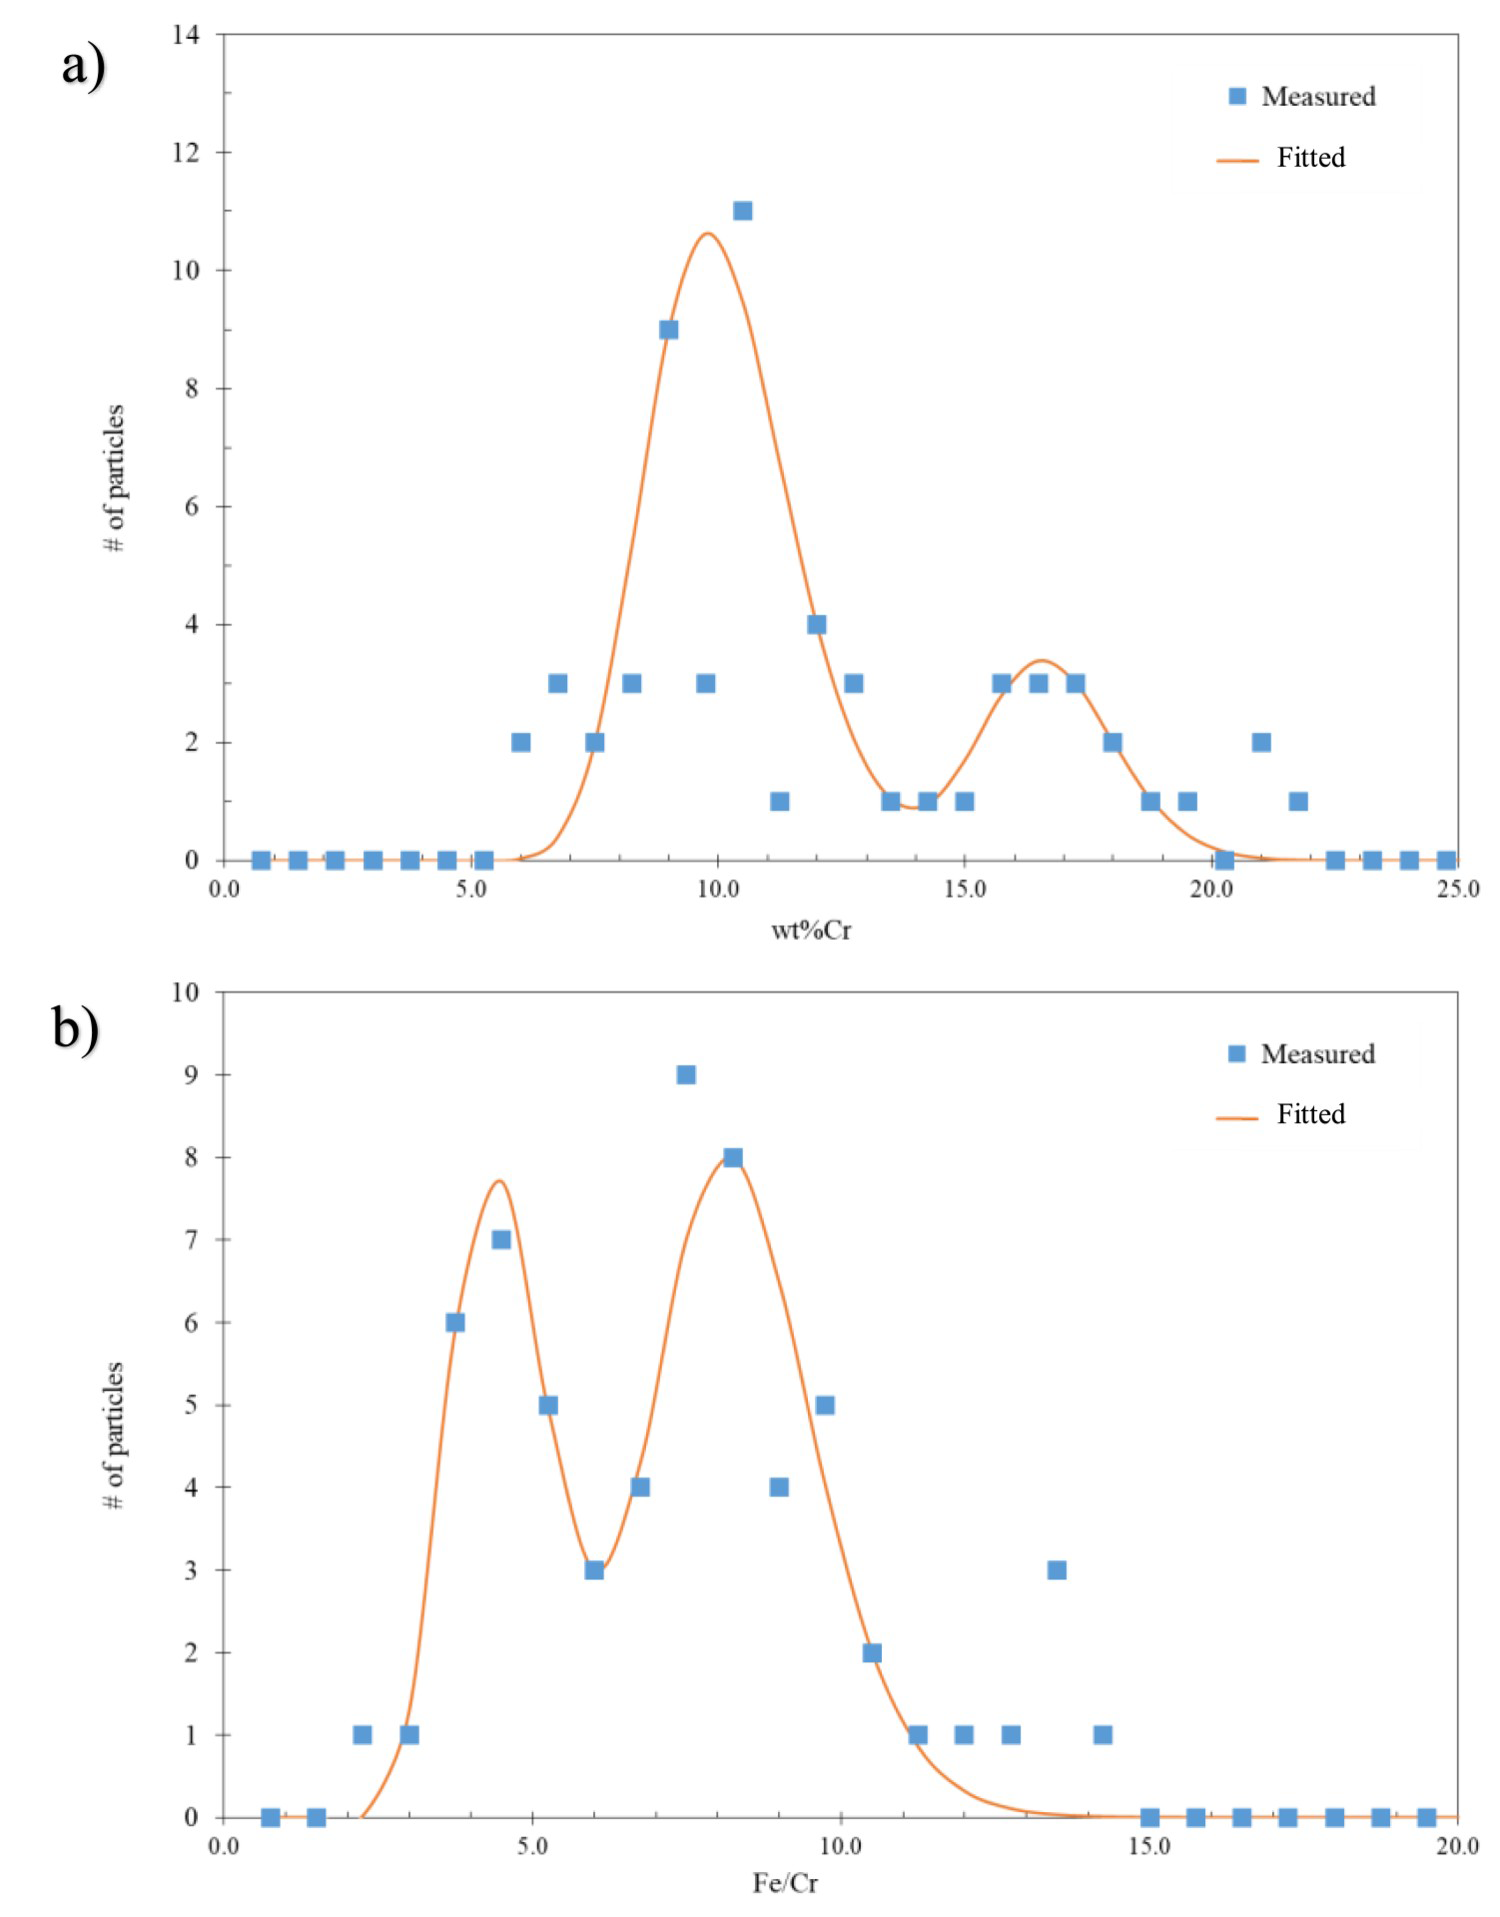
The Mo content for all the Fe-based carbides was observed to vary. For samples tempered at 600 and 715°C, the content varied between ≈ 0.5 and 7.5 wt-% Mo with a log-normal mean between 1.4 and 2.7 wt-%. The Mo content for the steels tempered at 650°C showed a wider range in values between ≈ 1.0 and 11.5 wt-% Mo.
Evolution of MC carbide size upon tempering
Figure 10 compares the as-quenched MC carbide size for the 77Cr steel (shown as a solid line) with the MC carbide size measured after tempering at 715°C for 45 min (symbols). A slight coarsening of the MC carbides is observed with the mean diameter increasing from 9.5 µm in the as-quenched condition to 10.6 µm in the tempered sample. This relatively small amount of MC carbide coarsening was also observed for the 52Cr sample for the same tempering condition.
Comparison of the number fraction vs MC carbide diameter for the as-quenched 77Cr steel (fitted log-normal size distribution) and tempered 77Cr steel at 715°C for 45 min (symbols).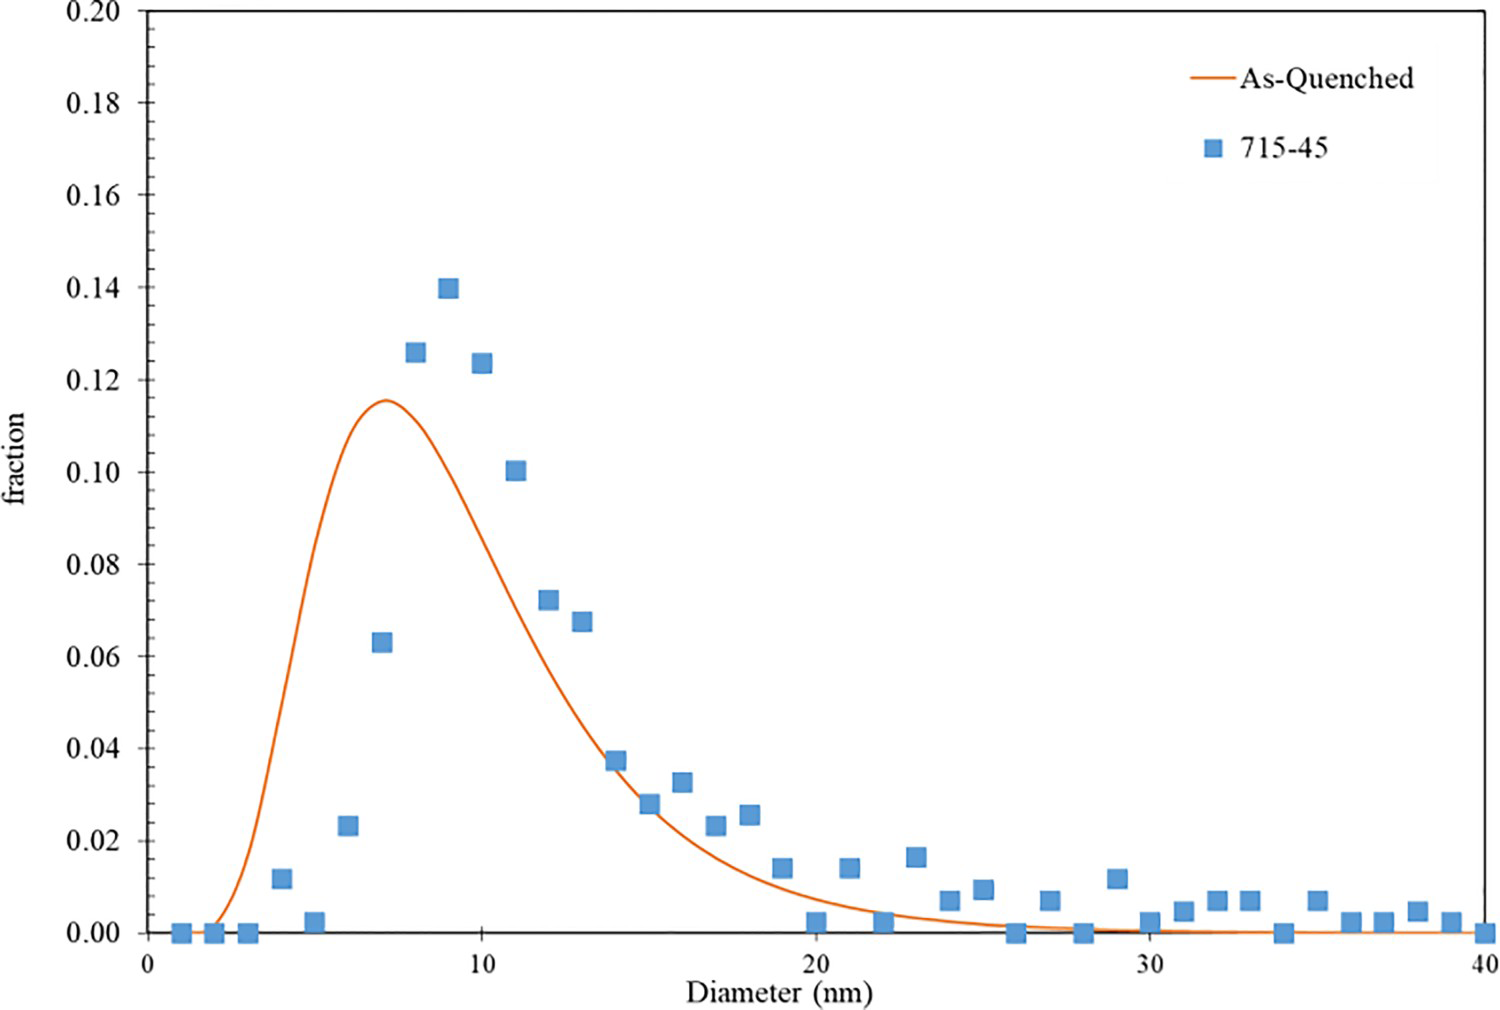
Evolution of Fe-based carbide size upon tempering
Figure 11(a) compares the measured carbide size (equivalent diameter) and the fitted log-normal distribution in the 77Cr steel tempered at 650°C for 45 min. Figure 11(b and c) compares the log-normal fitted carbide size distributions in the 52Cr and 77Cr steels tempered at 600, 650, and 715°C (45 min). In both steels, the size distribution curves shift to larger carbide sizes with increasing tempering temperature. The change in the carbide size distribution is relatively small when the tempering temperature is increased from 600 to 650°C. Conversely, a prominent increase in overall carbide size distribution is observed when the tempering temperature is increased from 650 to 715°C.
(a) Measured and fitted log-normal distribution vs equivalent carbide diameter for the 77Cr steel tempered at 650°C for 45 min; (b) log-normal size distributions for the 52Cr steel tempered at 600, 650, and 715°C for 45 min; and (c) log-normal size distributions for the 77Cr steel tempered at 600, 650, and 715°C for 45 min.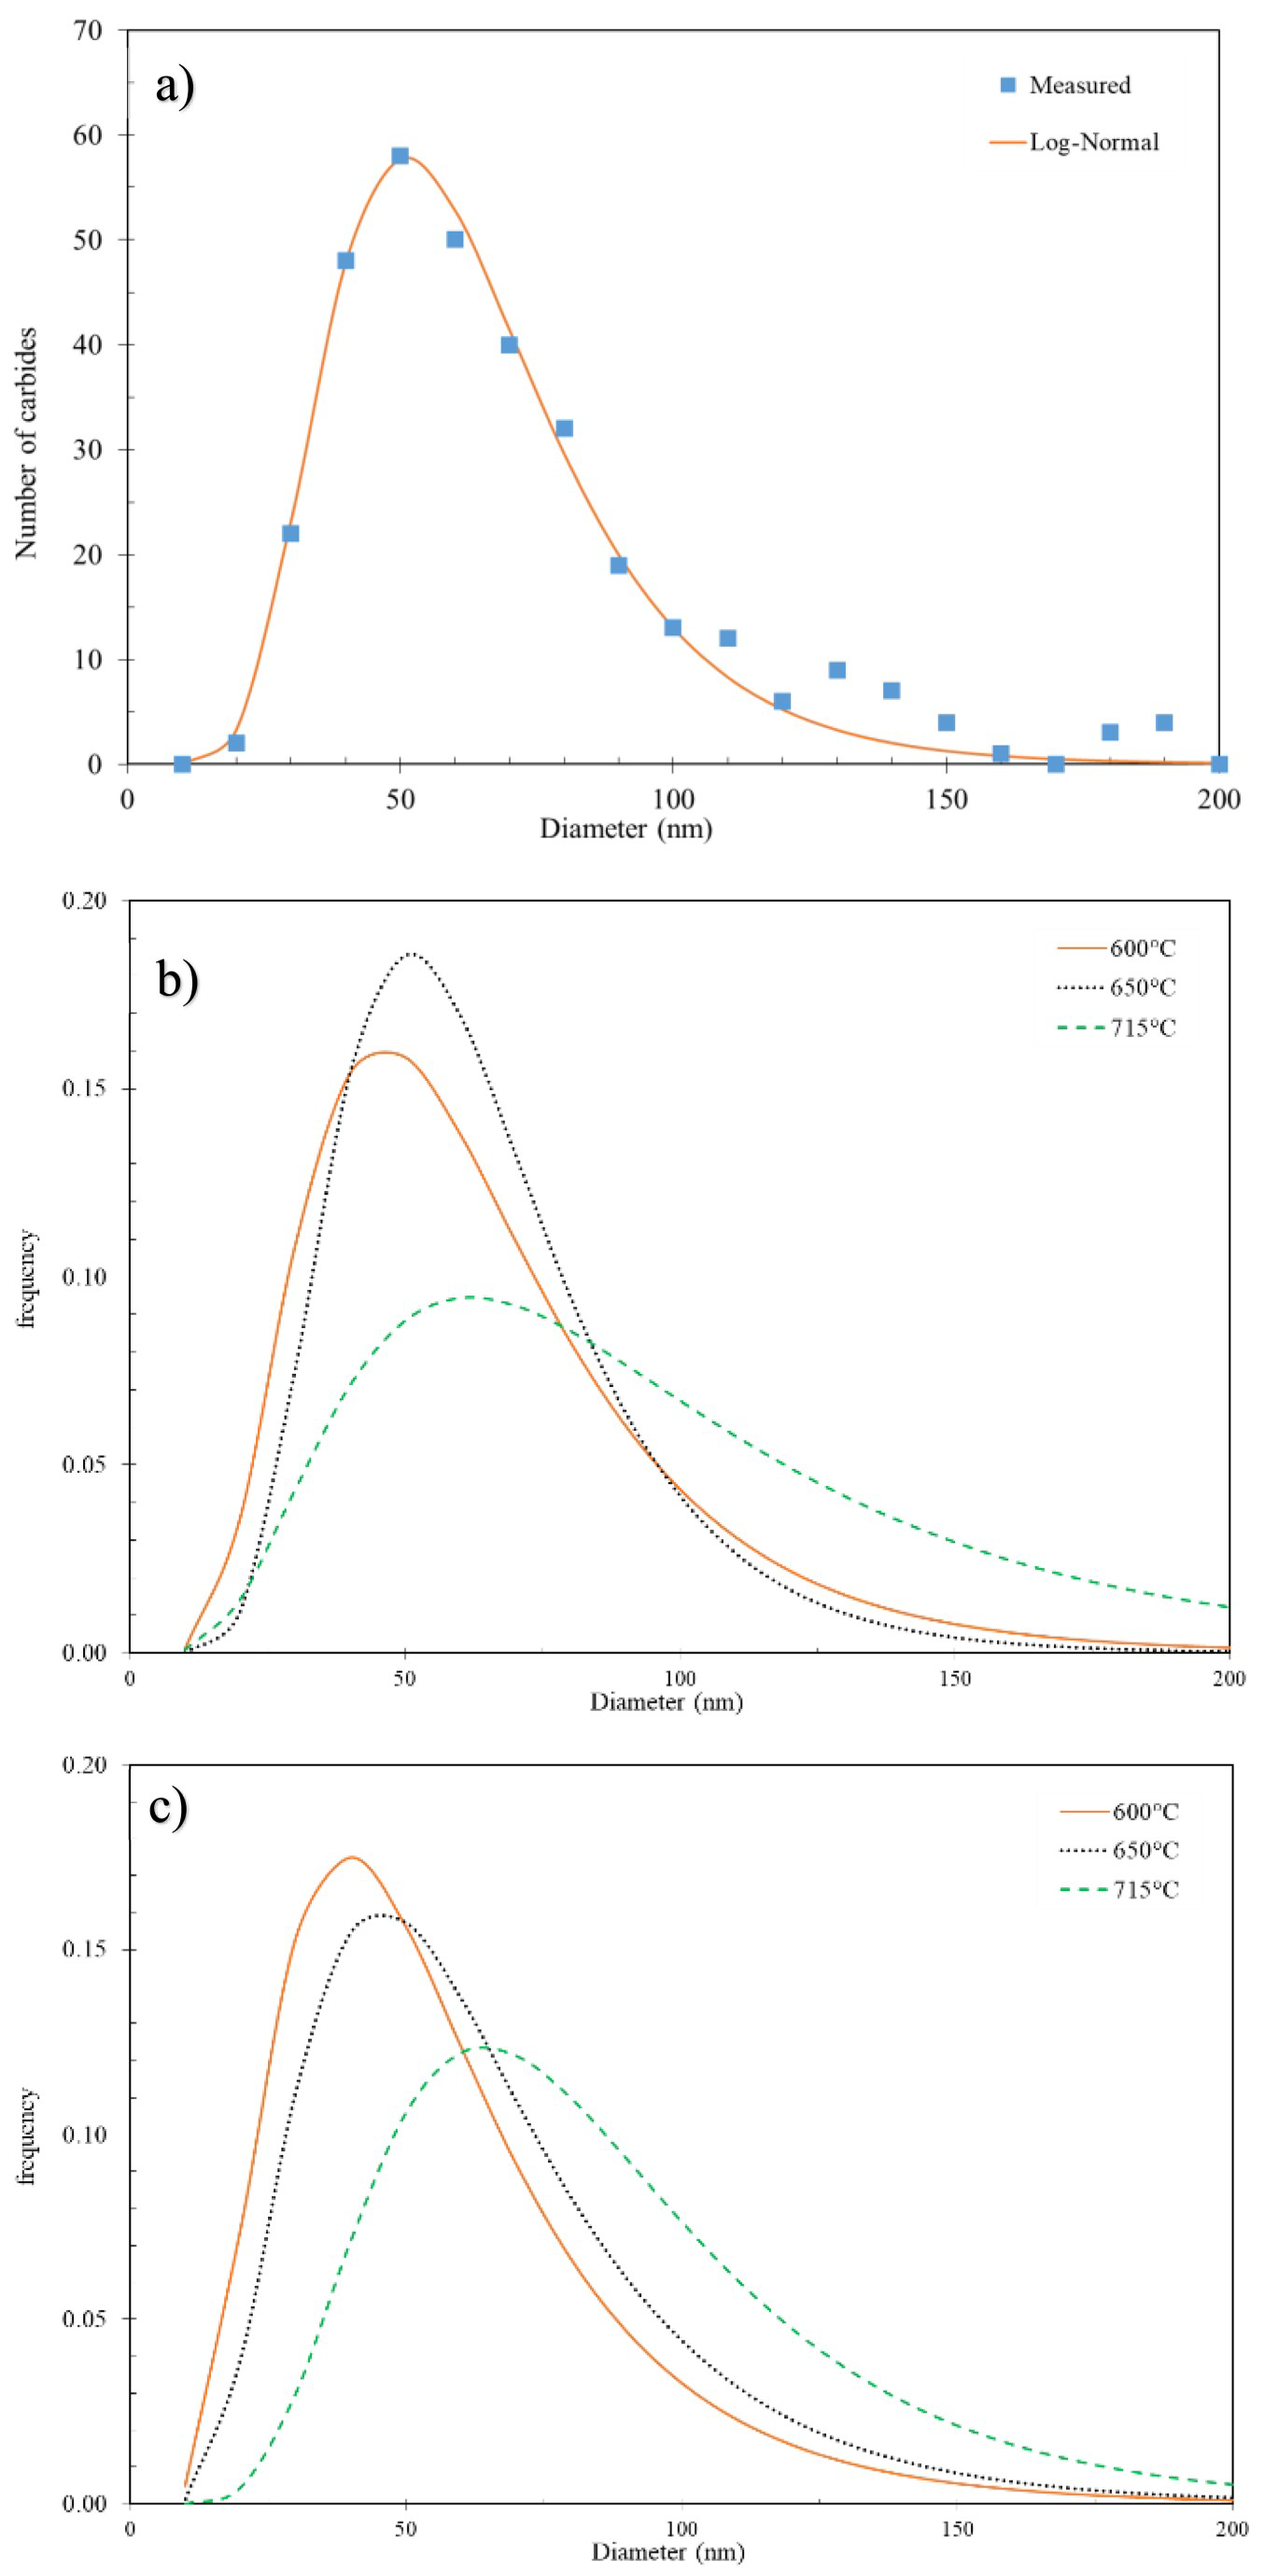
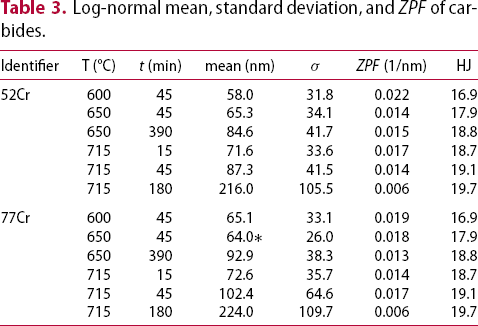
Log-normal mean, standard deviation, and ZPF of carbides.
Thermodynamics of carbide stability and composition
Thermodynamic stability calculations were conducted using Thermo-Calc software (TCFE10 database). Using the nominal composition values (Table 1), the mole fraction of the different carbide phases stable as a function of temperature for the 52Cr and 77Cr steels are shown in Figure 12(a and b), respectively. Both MC and M3C are stable over the tempering temperature range of 550–715°C. The stability of M7C3 extends to ≈ 500°C for the 52Cr steel and to ≈ 600°C for the 77Cr steel. The stability temperature range for M23C6 is from 492 to 666°C for the 52Cr steel and from 482 to 690°C for the 77Cr steel. This implies that the higher bulk Cr content can be a factor promoting the nucleation of M23C6. For both 52Cr and 77Cr steels, the mole fraction of M3C is significantly larger than that for M23C6.
Calculated mole fraction of phases as a function of temperature in (a) 52Cr and (b) 77Cr steels.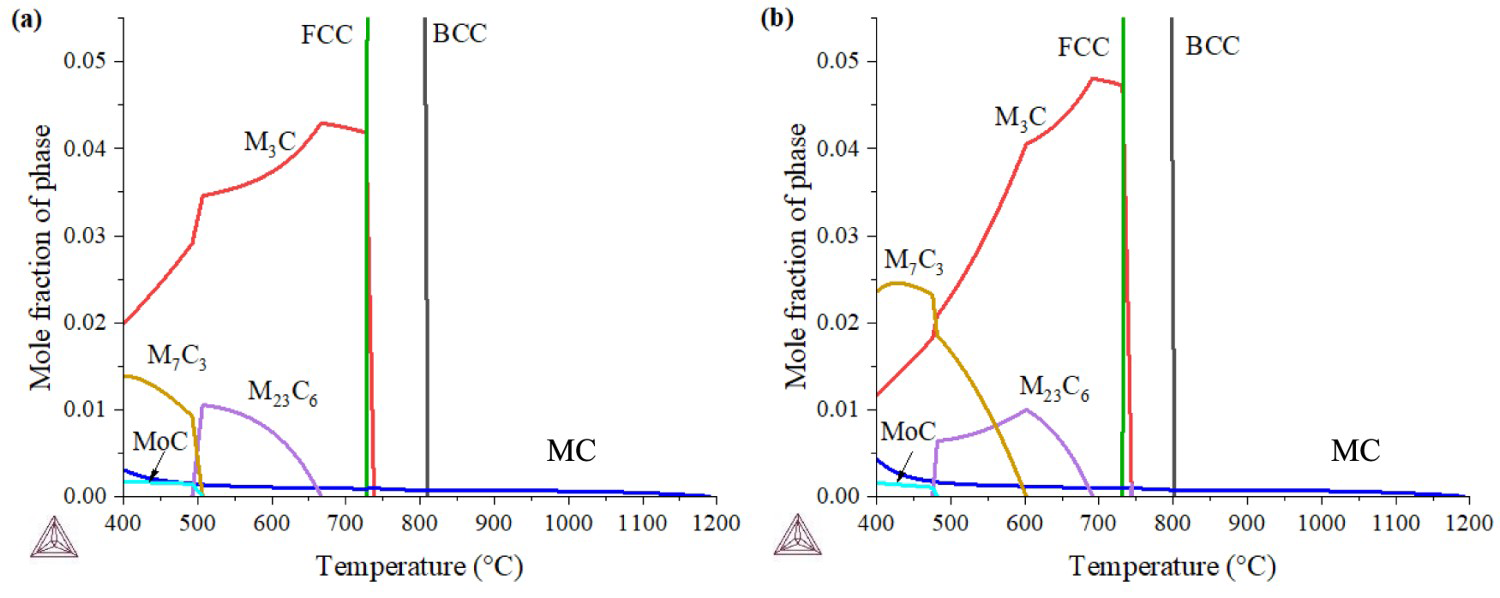
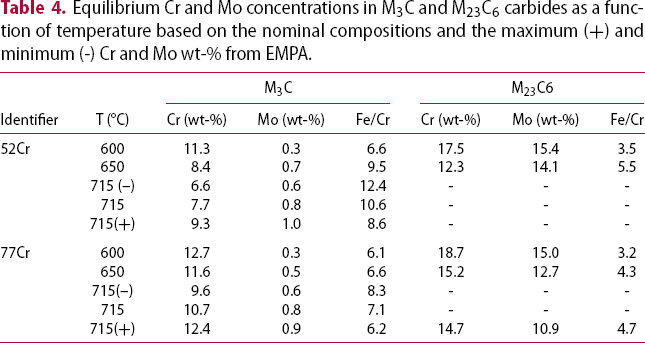
Equilibrium Cr and Mo concentrations in M3C and M23C6 carbides as a function of temperature based on the nominal compositions and the maximum (+) and minimum (-) Cr and Mo wt-% from EMPA.
Discussion
Effect of tempering temperature and time on microhardness
The reduction in hardness with increasing HJ observed in Figure 3 can be related to the evolution of carbide population during tempering. This was reflected by the ferrite lath size (grain size) measurements. Specifically, the average lath widths (W
1) of the tempered 77Cr steel were estimated using a line intercept method on the SEM micrographs [15]. The W
1 values at conditions of 600, 650, and 715°C (45 min) correspond to 329 ± 69 nm, 335 ± 89 nm, and 638.7 ± 90 nm, respectively. Lath coarsening is strongly influenced by the Zener boundary pinning imposed by the size and volume fraction of carbides present. Figure 13 plots the measured hardness as a function of ZPF tabulated in Table 3. As the ZPF decreases (i.e. an increase in carbide size), the hardness decreases. Both 52Cr and 77Cr steels exhibit similar behaviour.
Micro-hardness vs ZPF value for the 52Cr and 77Cr steels tempered at the conditions listed in Table 3.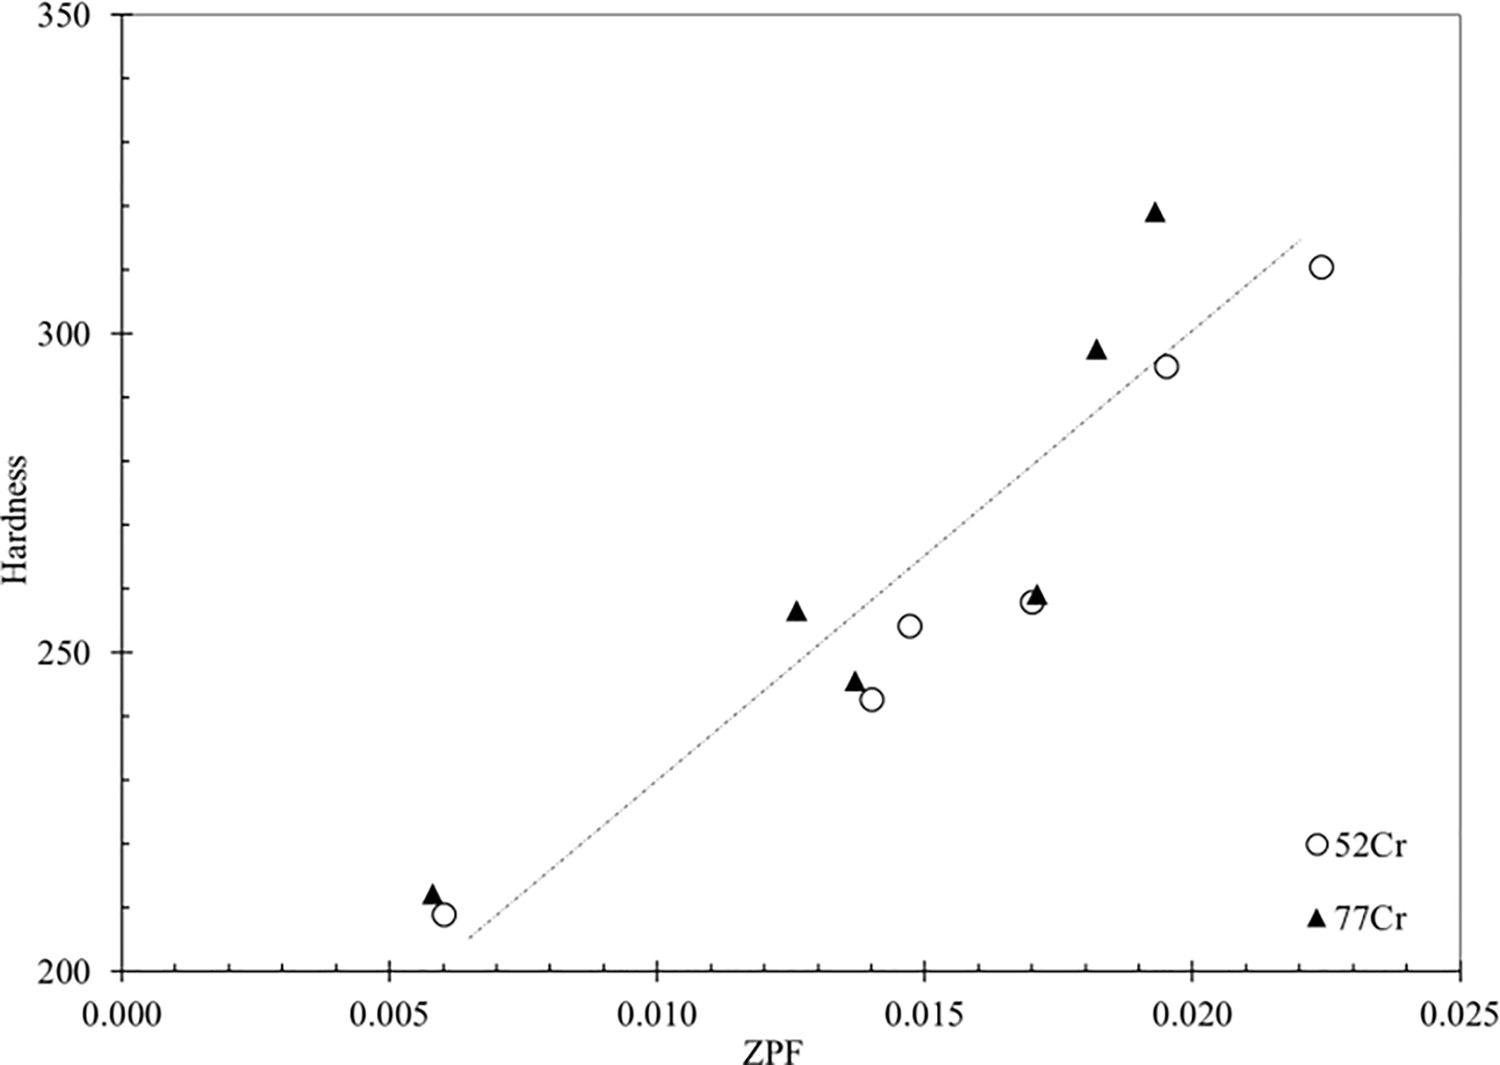
Effect of tempering temperature and time on carbide composition
Figure 14 plots the fitted log-normal distributions for both wt-% Cr and the Fe/Cr ratio in the 77Cr steel tempered at 600, 650, and 715°C (45 min). Included in each graph are lines indicating the equilibrium wt-% Cr and/or the Fe/Cr ratio (Table 4) under each condition. At 715°C, a range of equilibrium values is shown based on thermodynamic calculations from the maximum (+) and minimum (-) compositions of Cr and Mo measured by EMPA (Table 2). The equilibrium/measured data for the 52Cr steel is similar to the data for the 77Cr steel presented in Figure 14.
Measured wt-% Cr and Fe/Cr ratio for the Fe-based carbides of the 77Cr samples after tempering at (a) and (b) 600°C for 45 min, (c) and (d) 650°C for 45 min, and (e) and (f) 715°C for 45 min.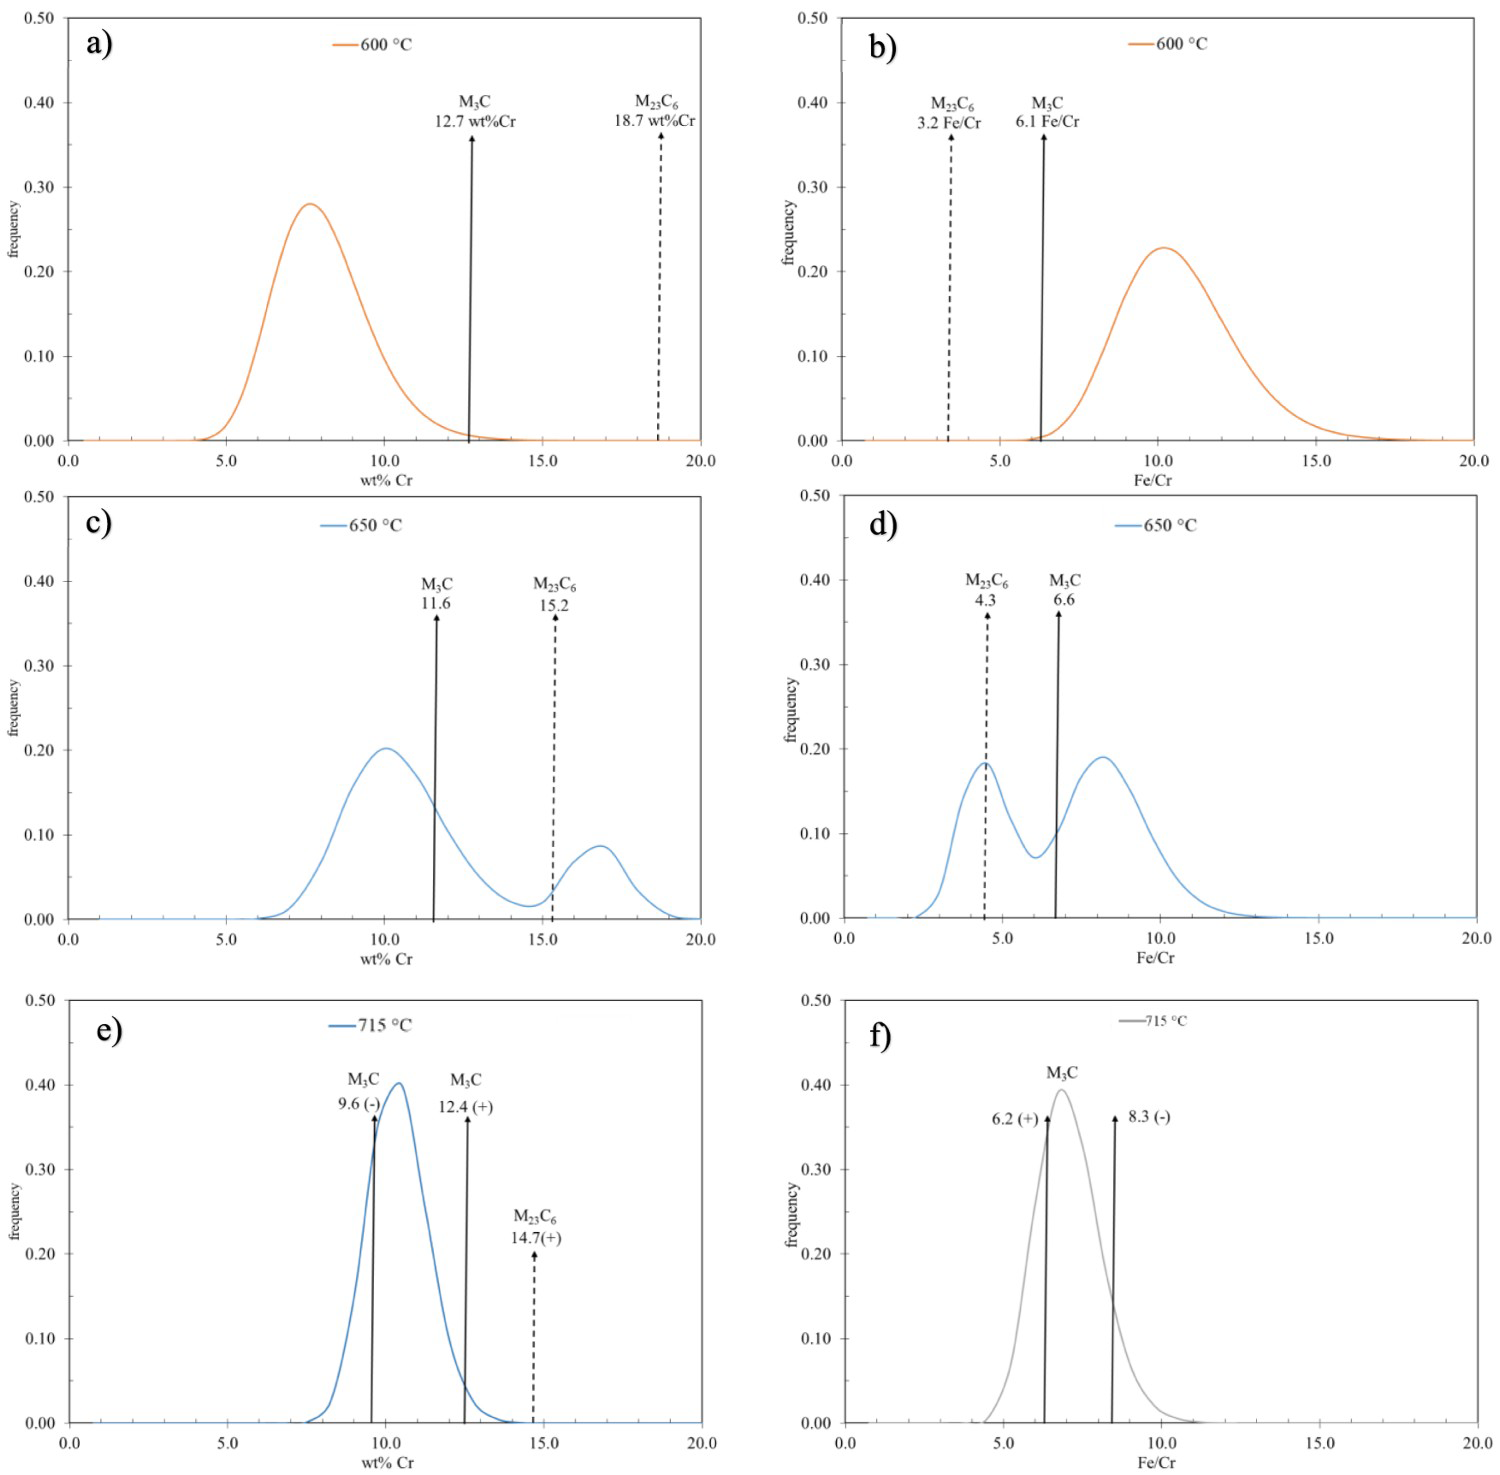
At 600°C, the equilibrium wt-% Cr and Fe/Cr ratio values are quite different from the measured values. This indicates that after tempering at 600°C for 45 min, the system is relatively far from equilibrium conditions. Conversely, after tempering at 715°C for 45 min, the measured values are relatively close to the equilibrium values indicating that the system is approaching equilibrium.
At 650°C, the equilibrium composition and ratio are relatively close to the measured values for both the M3C and M23C6 carbides although not as close as the values at 715°C. The effect of the three conditions, i.e. (i) non-equilibrium, (ii) approaching equilibrium for both M3C and M23C6, and (iii) equilibrium, on carbide coarsening will be considered.
Effect of tempering temperature and time on carbide coarsening
Over the experimental tempering temperature range, the size of the MC carbides remains relatively constant (Figure 10). The effect of these MC carbides on ferrite lath coarsening is not known as the volume fraction is relatively low (Figure 12).
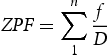
The Fe-based carbides coarsen slightly with an increase in tempering temperature from 600 to 650°C and then increase significantly in size at 715°C (Figure 11). To understand these observations, carbide size, as a function of tempering temperature and time, was calculated using the following equation [20]:
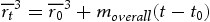
 and
and
 are the mean particle radii of carbides at time
 and
and
 , respectively;
 is the coarsening rate of carbide during the ripening process.
 in a generalised multicomponent alloy system is calculated as follows [20]:
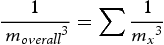
 represents the coarsening rate from element
 , which mainly depends on diffusivity and the equilibrium solute concentrations of the solute. Assuming equilibrium partitioning of the alloying element between the carbide and ferrite,
 can be expressed as follows [24]:
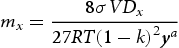
 is the molar volume of M3C and M23C6 in
 -Fe with values of 0.78 ×
 m3/mol [24] and 0.79 ×
 m3 mol−1 [25], respectively. The surface energy σ for M3C can be calculated from σ = 1.0720–0.7161·10−3·T (J m−2) [25], while σ for M23C6 is predicted from Thermo-Calc (≈ 0.11–0.12). It is worth noting that the calculated σ for M23C6 lies in the lower bound of the literature data (σ between 0.1 J m−2 and 0.2 J m−2) [26]. This is a reasonable estimation considering the fact that M23C6 forms primarily on the lath boundaries rather than inside the matrix [14], resulting in a lower interfacial energy contribution than if M23C6 had formed inside matrix [26]. The partition coefficient (k) for each element and is calculated as follows [23]:

 in the carbide and ferrite at equilibrium, respectively. Dx
is the diffusion coefficient of element
in the carbide and ferrite at equilibrium, respectively. Dx
is the diffusion coefficient of element
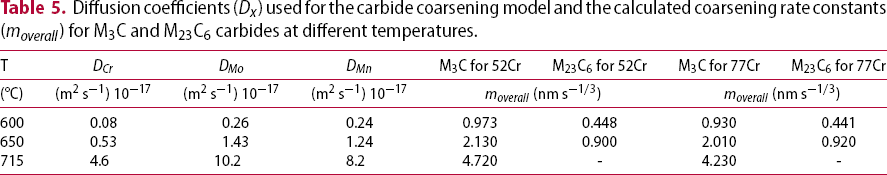
 at a specific temperature. The values of Dx
and moverall
for both M3C and M23C6 (where applicable) at 600, 650, and 715°C are shown in Table 5. Coarsening rates of these carbides increased as tempering temperature increased and M3C coarsened much faster than M23C6 carbides. Furthermore, Cr has the lowest diffusivity among all the elements in the steels, indicating that the coarsening rates of both carbides are likely controlled by the diffusion of Cr.
at a specific temperature. The values of Dx
and moverall
for both M3C and M23C6 (where applicable) at 600, 650, and 715°C are shown in Table 5. Coarsening rates of these carbides increased as tempering temperature increased and M3C coarsened much faster than M23C6 carbides. Furthermore, Cr has the lowest diffusivity among all the elements in the steels, indicating that the coarsening rates of both carbides are likely controlled by the diffusion of Cr.
Diffusion coefficients (Dx ) used for the carbide coarsening model and the calculated coarsening rate constants (moverall ) for M3C and M23C6 carbides at different temperatures.
The above theoretical calculations assumed spherical shaped carbide particles [27], whereas the Fe-based carbides in the tempered P110 steels, especially M23C6, were typically elongated. A spherical equivalent diameter was calculated to comply with the assumption, which introduced bias into the analysis. To account for the difference in coarsening rate constant between the spherical and elongated carbides, a shape factor,
 (aspect ratio), can be introduced to Equation (4) [20]. Remarkably, this will only result in a smaller coarsening rate constant
 and, thus, a decrease in predicted M23C6 size.
Figure 15 compares the predicted (solid line) with the log-normal mean carbide size for the 77Cr steel tempered at 600, 650, and 715°C. For both 600 and 650°C, the coarsening of both M3C and M23C6 carbide was considered. The trends observed for 77Cr are similar to those for the 52Cr steel.
Measured vs predicted carbide size in the 77Cr steel during tempering at (a) 600°C, (b) 650°C, and (c) 715°C.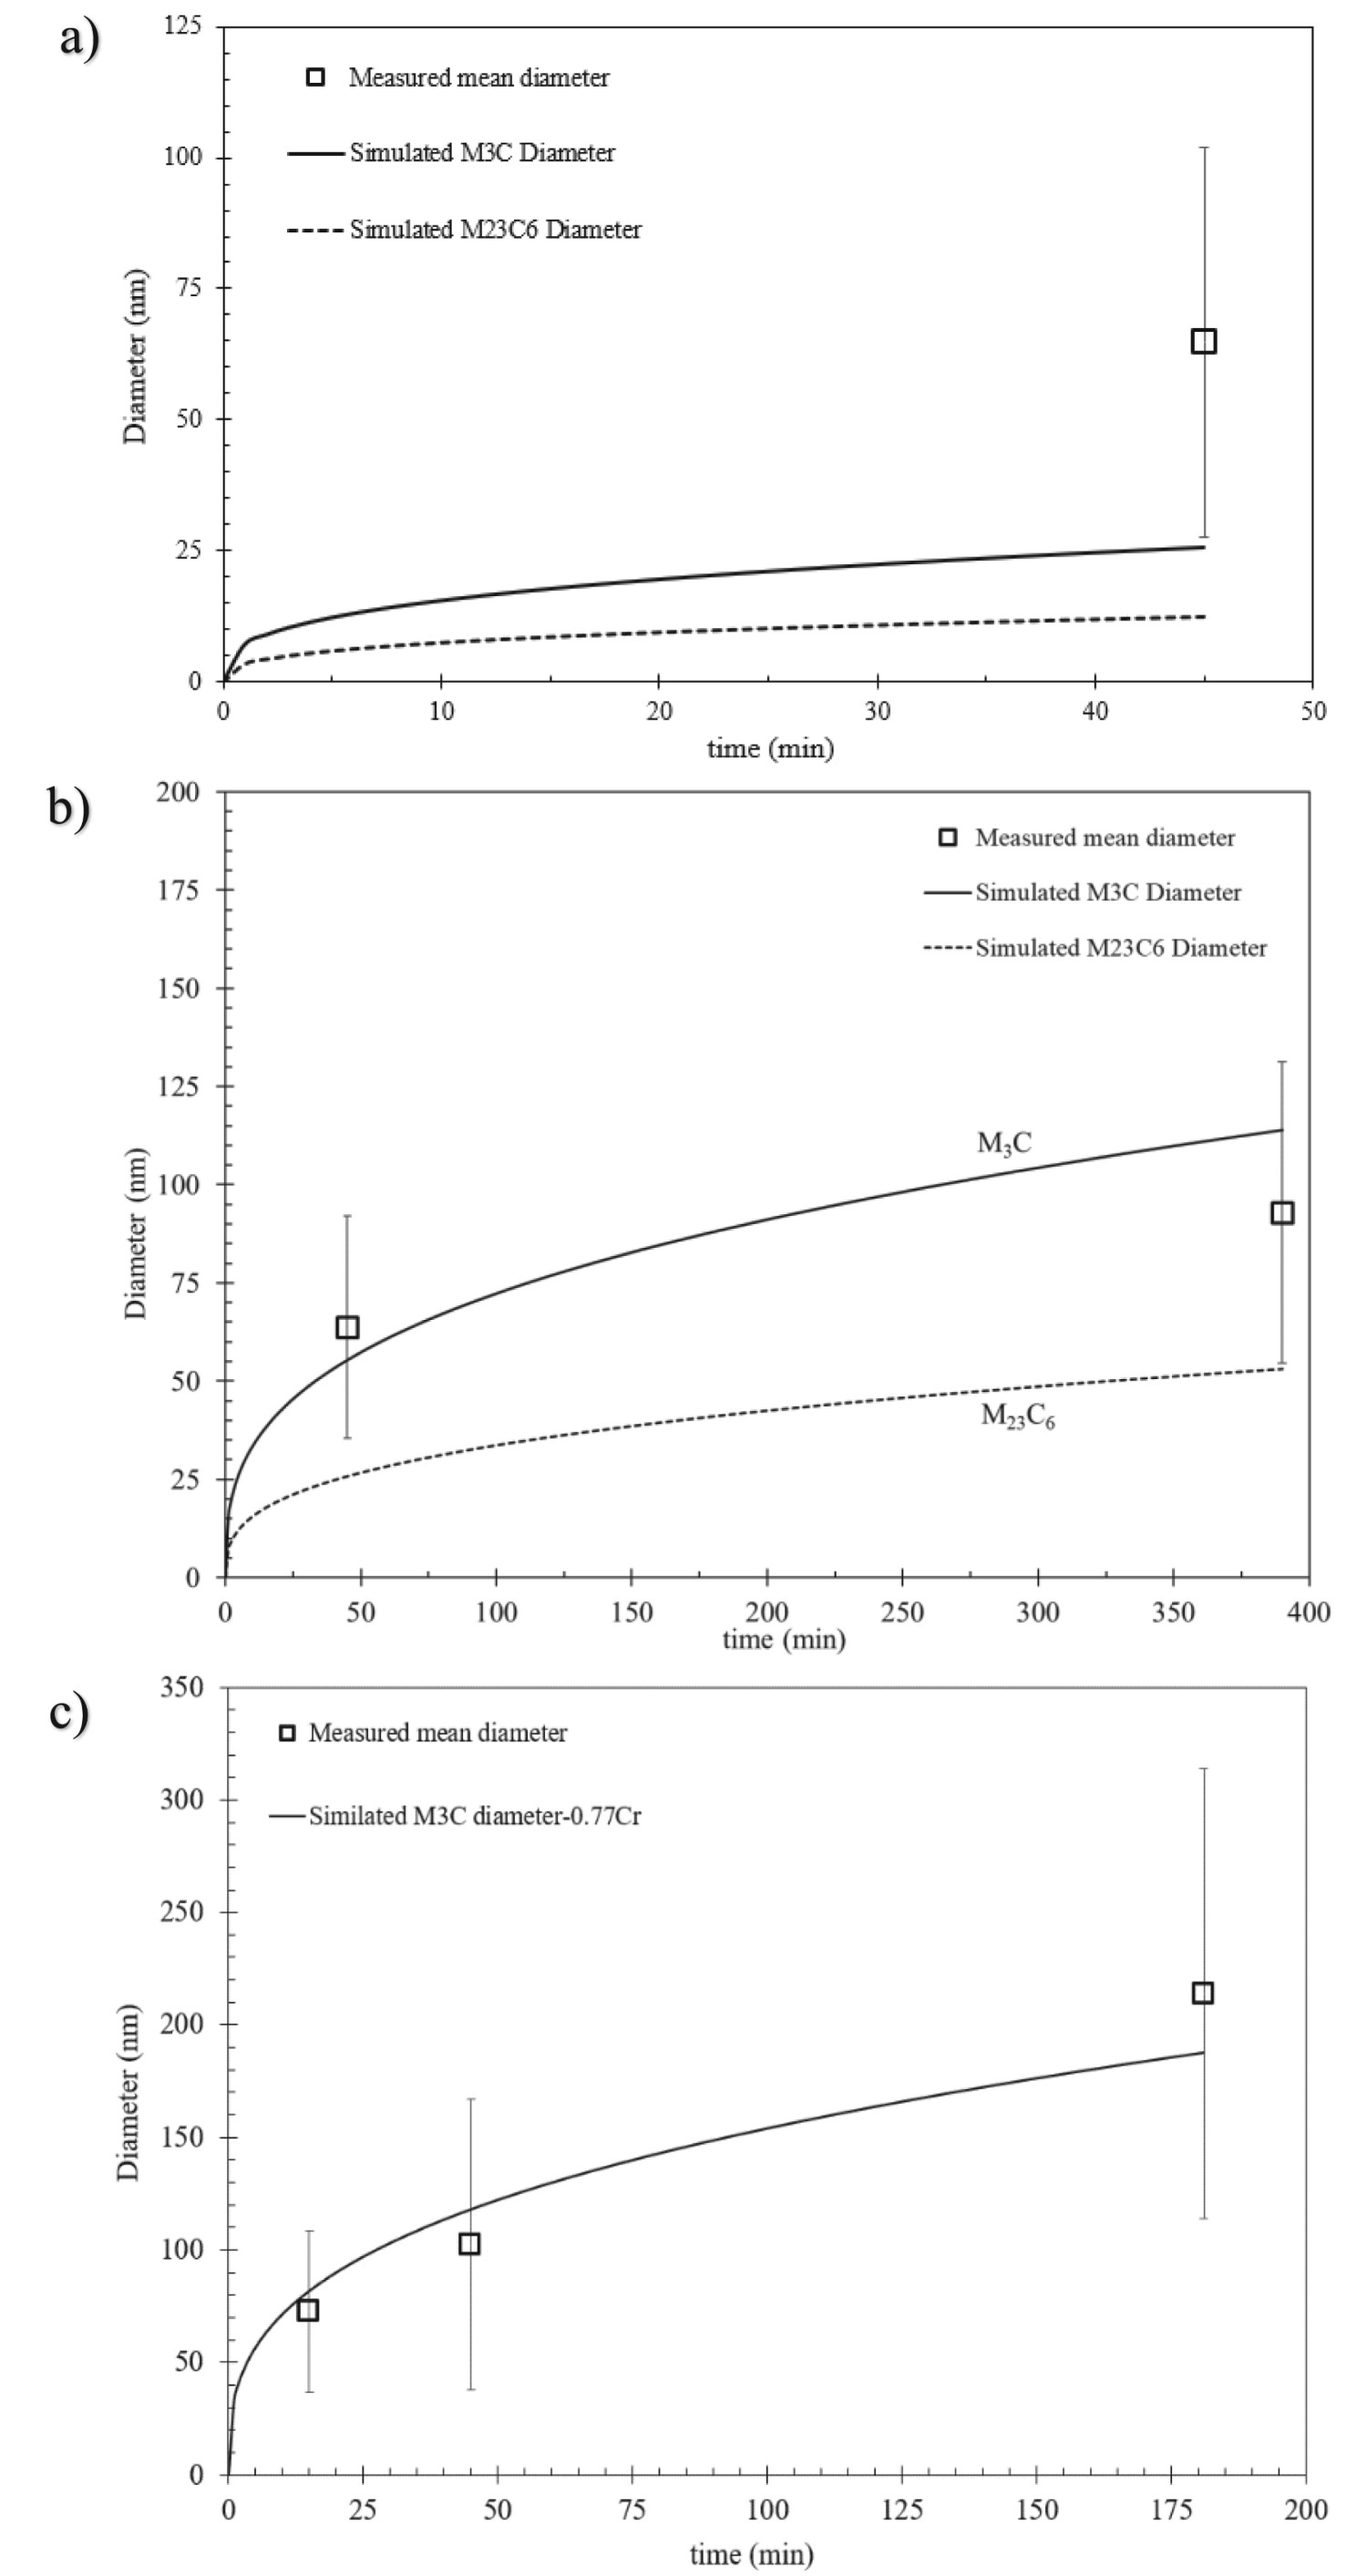
Figure 15(a) (600°C) shows that the measured size is significantly larger than the predicted values for either M3C or M23C6. As shown in Figure 13(a), the carbide composition at 600°C is far from the equilibrium value. The application of an equilibrium coarsening equation to this non-equilibrium carbide composition does not appear to be valid.
At 650°C, the predicted carbide size (particularly at 390 min) is approximately equidistant between the predicted M3C coarsening and the predicted M23C6 coarsening (Figure 15(b)). This would indicate that the overall carbide size distribution at 650°C is influenced by the slower coarsening rate of M23C6. The two co-precipitating carbide phases are competing for the slow diffusing Cr atoms during tempering at temperatures ≈≤ 650°C, which delays the carbides in reaching equilibrium. This delay is further illustrated by the predominance of needle/elongated shaped carbides after tempering at 650°C for 45 min (Figure 16(a)), which is a typical carbide morphology during early-stage tempering [13,28]. Figure 16(b) presents the measured aspect ratio vs equivalent diameter of carbides in 77Cr steel after tempering at 650°C for 45 min. The carbides with an equivalent diameter between 20 and 70 µm have average aspect ratios higher than 2.46, indicative of an elongated shape. These elongated carbides correspond to the inter-lath carbides that were previously observed via FESEM (Figure 6(b)).
(a) STEM-BF image illustrating the shape of carbides in the 77Cr steel after tempering at 650°C for 45 min; (b) measured aspect ratio vs equivalent carbide diameter for the 77Cr steel tempered at 650°C for 45 min.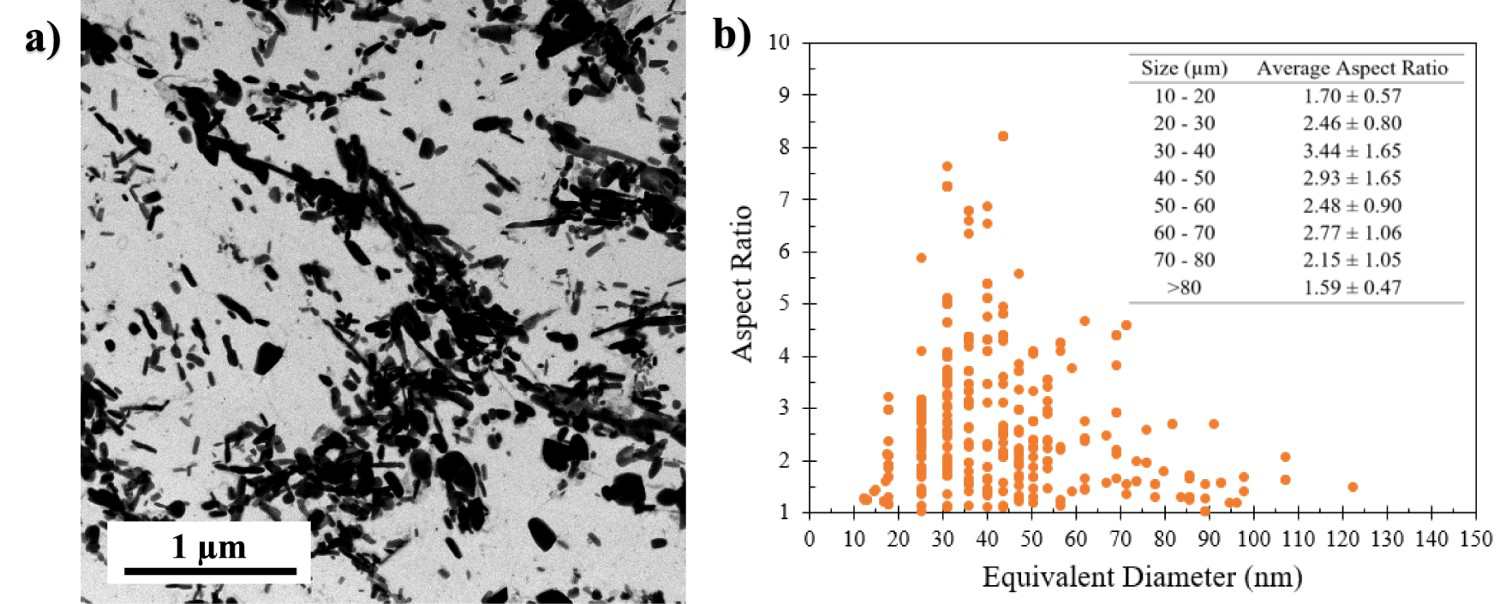
At 715°C, the mean carbide size (primarily M3C) is reasonably well predicted by the coarsening model (Figure 15(c)). This indicates that the dissolution of M23C6 carbides and higher elemental diffusivity enabled M3C to rapidly reach equilibrium conditions, allowing for subsequent coarsening. Quantitatively, the Fe-based carbides in both 52Cr and 77Cr steels exceeded a mean size of 70 nm after tempering at 715°C for only 15 min (Table 3), pointing toward a microstructure that is more prone to HE. Furthermore, the change in the rate of hardness vs HJ that occurs between 650 and 715°C can be attributed to the presence of M23C6 which reduces carbide coarsening and restricts grain growth and, therefore, reduces the rate of hardness decrease with increasing HJ.
Conclusions
The effects of tempering conditions and Cr content on carbides that formed in Cr–Mo alloy P110 casing steels were studied. The following conclusions can be drawn from this investigation:
An increase in Cr content from 0.52 to 0.77 wt-% had a minimal effect on hardness evolution during tempering. MC carbides were encountered in the matrix, while Fe-based carbides, including M3C and M23C6, were mostly found at PAG boundaries and lath boundaries. The sizes of the fine MC carbides (<20 nm) for both steels studied, with 0.52 wt-% Cr and 0.77 wt-% Cr, were relatively unaffected by tempering temperature and time. At tempering temperatures ≤650°C, the presence of M23C6 reduced the amount of the coarsening of the Fe-based carbides, thereby reducing the change in hardness with tempering associated with ferrite lath growth. At tempering temperatures > 650°C, the dissolution of M23C6 and higher elemental diffusivity accelerated the coarsening of Fe-based carbides. For both steels containing either 0.52 wt-% Cr or 0.77 wt-% Cr, the mean carbide size exceeded a value of 70 nm after tempering at 715°C for only 15 min.
Footnotes
Disclosure statement
No potential conflict of interest was reported by the author(s).