
Abstract
A fully electrical–magnetic–thermal coupled model is proposed to investigate the heating mechanism of induction cladding. The simulation results reveal that the coating and the thin layer close to the substrate surface were heated layer by layer. Furthermore, the non-uniform electromagnetic field generated an uneven temperature distribution, which had a larger impact in the longitudinal direction than in the cross section. The maximum relative errors between the simulated and measured temperatures indiacate that the numerical calculation fit the experimental results well. The impact of the non-uniform temperature distribution on the coating properties was experimentally studied. The specimen in the middle position had a more complicated phase composition, lower porosity, and higher microhardness than those at the two ends.
Introduction
Induction cladding can fabricate coatings with a metallurgical bond between the coating and substrate, and fewer pores. It has been applied to fabricate coatings to improve the wear resistance and corrosion resistance of various metal components [1]. Compared with laser cladding and arc welding, induction cladding possesses the advantages of producing large-area and thick coatings at a lower cost and with a considerably higher efficiency [2].
Many studies in the area on induction cladding have been conducted to investigate the coating material synthesis [3,4], cladding process [5], coating microstructure, and performance. Owing to its unique heating principle, induction cladding is particularly suitable for fabricating coatings on the rod-shaped workpieces. In our previous works, we have fabricated Ni-based and Fe-based [6] coatings on the cylindrical-shaped substrates using a stepwise induction cladding process from an experimental perspective. The results showed that the induction-clad coatings exhibited better anti-corrosive and tribological performances. The Ni-based alloy coating prepared by a stepwise induction cladding technique can improve the immersion corrosion property of gray cast iron substrate in high-temperature concentrated sulfuric acid [7]. In addition, the induction-clad Ni-based alloy coating present lower friction coefficient and wear loss than the gray cast iron under dry sliding condition [8]. However, few investigations have been conducted with respect to the numerical simulation of the induction cladding process.
Induction heating has been widely applied in heat treatment owing to its short processing time and high efficiency. Thus, numerous simulation studies regarding the induction heating process of a single material have been conducted. Tong [9] investigated the induction hardening and subsequent tempering processes using numerical modelling. The mechanism of tempering relaxation was studied based on the simulation and corresponding experimental results. To reduce the impact of the edge effect of the electromagnetic field, an induction heating process with the flux concentrators and parameter optimisation was conducted using simulated by an axisymmetric finite element simulation using COMSOL software [10]. Gao et al. [11] developed a spot-induction hardening device using a magnetic concentrator. They built an electromagnetic and temperature-coupled model with a time-dependent boundary to predict the dimensions of the hardening area and depth. The influences of the mechanical, metallurgical, and thermal properties on the surface residual stress during induction hardening were investigated by numerical simulation [12]. The relationship between the surface temperature and the inductor current and number of turns per unit length of the inductor was mathematically studied in case using an electrical–magnetic–thermal coupled model in the case of self-consistent boundary value problem [13].
In recent years, induction heating has been employed to produce alloyed [14] and metal matrix composite coatings [2,15] to improve the surface performance of components. Induction cladding is a complex physical and metallurgical process because the temperature depends on the electromagnetic and thermal properties of the coating and substrate materials. The temperature profile is a complicated function of the current density, frequency, material characteristics, inductor design, and coupled interactions between multiple physical fields [16]. In addition, owing to limited experiments, the complicated electromagnetic field and temperature profile within the coating and substrate are difficult to measure directly. Furthermore, the clad coating has a unique microstructure and phase composition generated by non-equilibrium solidification, which in turn has a strong effect on the coating performance. Therefore, research on numerical simulation models that can accurately describe the induction cladding process will provide a clear picture and deep understanding of the induction-clad coating formation mechanism, help to optimise the process parameters, and consequently improve the coating quality. However, compared with the induction heat treatment, there are a small number of studies on the coating fabrication process using induction cladding. Liu [17] investigated the temperature field distribution in an induction cladding process by fabricating a Ni-based coating on a cylindrical rod. The deviation between the numerical calculation and the experiments was less than ±25°C, verifying the reliability of the numerical model. Sun [18] modelled an alloyed layer coated on a steel plate using induction cladding and investigated the relationship between the process parameters and the melting area. The melting process of a vertically placed tin cladding was studied numerically and experimentally. The results suggest that the melting process included droplet leakage, swelling deformation, and cladding breakage. The degree of swelling deformation depends on the cladding thickness, while the height of breakage is mainly determined by the heating power and melting time [19].
The aim of this work is to numerically analyse and experimentally study the induction cladding of coatings on a cylindrical medium carbon steel substrate. To obtain an accurate process simulation, all relevant mechanisms must be considered, requiring the coupling of electromagnetic phenomena and heat transfer. Therefore, the circulated cooling water in the hollow inductor coil and the shielding gas of pure argon gas were considered in the simulation domain. In addition, the impacts of non-uniform induced electromagnetic field on the temperature distribution, microstructure and property were investigated. Cobalt-based alloy coatings are widely used in gas turbines, valves, and internal combustion engines [20], because of their excellent physical and chemical properties and mechanical performance under high-temperature conditions [21]. Thus, in order to improve the surface performance, induction cladding was employed to fabricate a Co-based alloy coating on the metal component. The electromagnetic field and temperature profile were calculated using the finite element analysis (FEA) software COMSOL5.2, and the numerical model was calibrated through the experiments. The impacts of the non-uniform temperature distribution were experimentally investigated under the same process parameters as those used in the simulation.
Experimental procedures
Materials and experimental setup
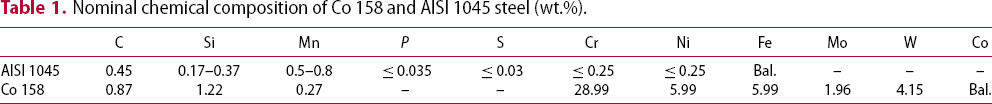
The coating and substrate materials were commercial self-fluxing Co 158 alloy powder (developed by the Shenyang Rare Metal Institute, China) and AISI 1045 steel, respectively. The substrate was a cylindrical rod with a diameter of 20 mm and the height of 100 mm. The chemical compositions of the materials are listed in Table 1. Figure 1 shows the experimental setup, which is composed of a power supply (maximum current of 150 A; maximum frequency of 40 kHz), cooling system, and rotary platform. The substrate was placed at the centre of the rotary platform, and the Co-based alloy powder filled the gap between the tube of the graphite crucible and the substrate. A copper inductor with circulated cooling water was employed to provide the electromagnetic field; it was laid outside the graphite crucible. Two infrared thermometers were used to monitor the temperature profiles on the top surface of the substrate and the outside surface of the graphite crucible, respectively. The testing ranges of the two infrared thermometers (Keller, Germany) were 250–2000°C (PA 30FA2) and 500–2500°C (PA 30FA2), respectively. The emissivity was set as 0.8 for the graphite crucible and 0.4 for the substrate. Pure argon was used as a shielding gas to prevent oxidation of the coating during the induction heating. The nozzle of the shielding gas was located at the top of the gap between the substrate and the graphite crucible. The optimised process parameters are listed in Table 2, based on the numerous experimental studies.
Schematic of the experimental device. Nominal chemical composition of Co 158 and AISI 1045 steel (wt.%). Experimental parameters.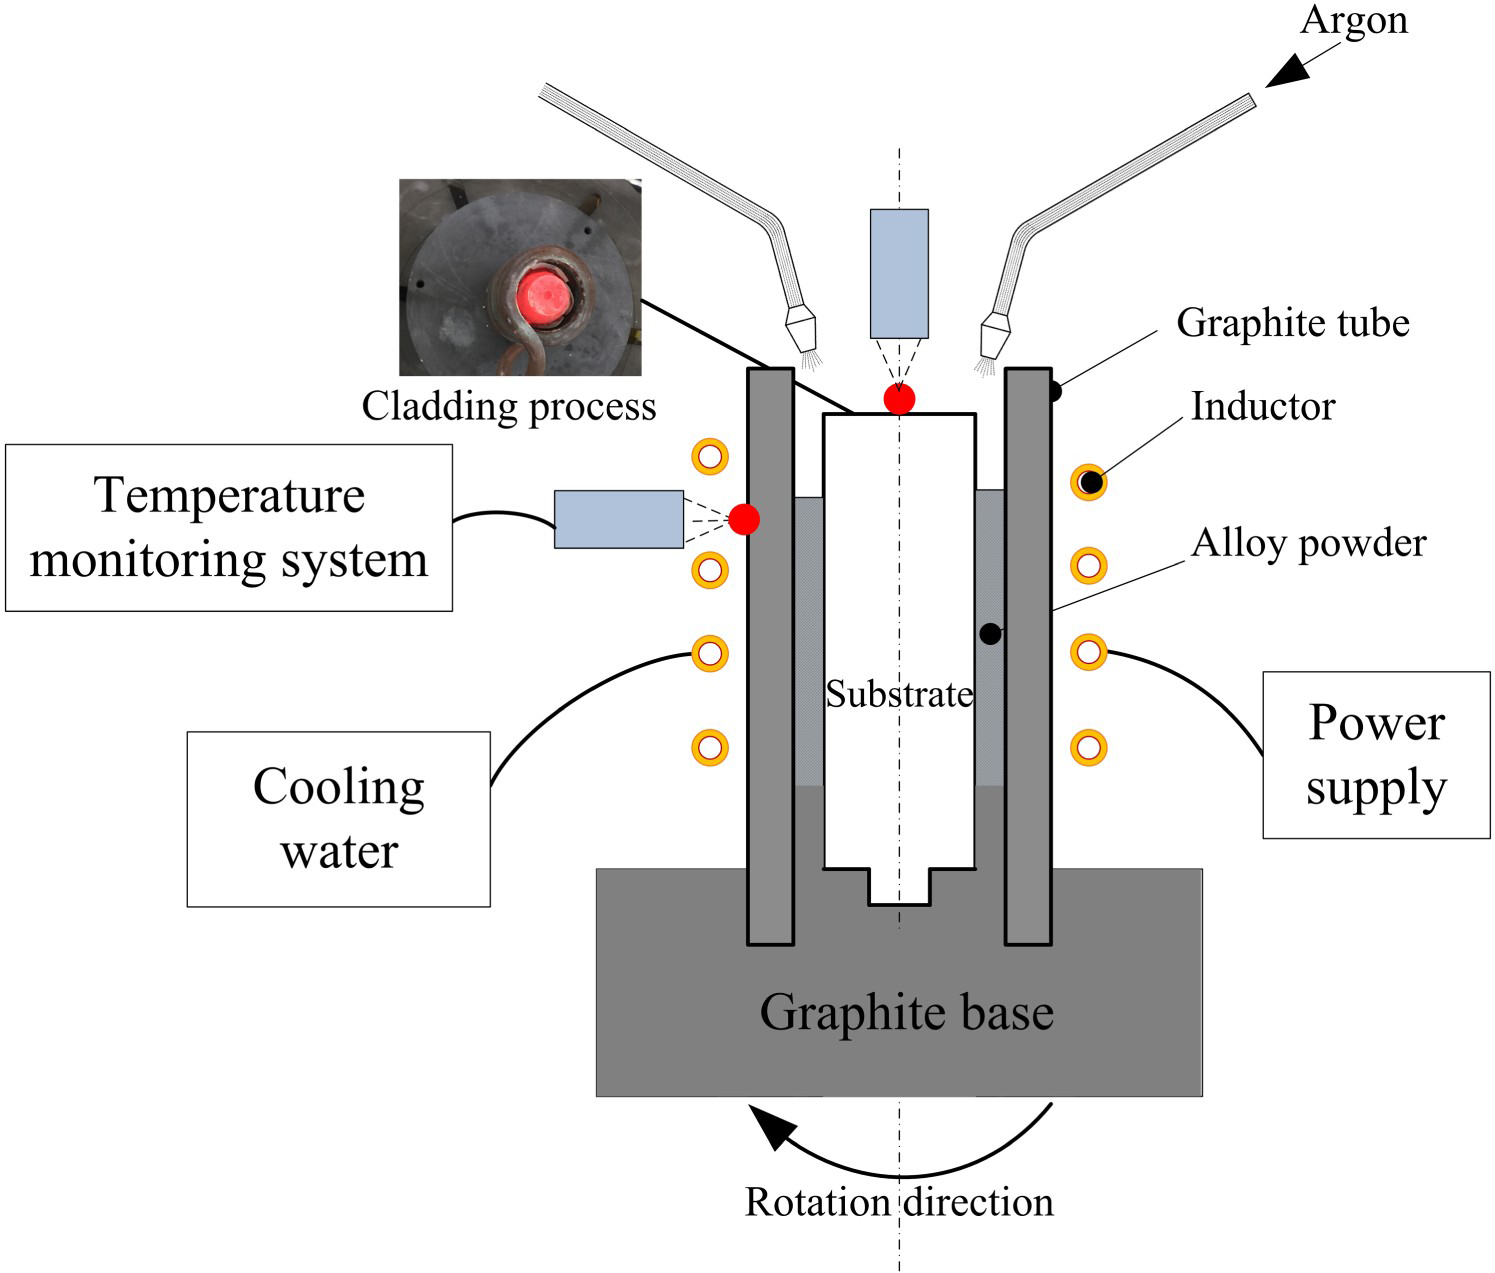
Coating characterisation
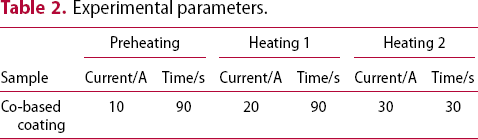
The magnetic flux density within the inductor coil is distributed non-uniformly along the axial direction, which in turn generates a non-uniform eddy current and thus an uneven temperature field within the coating and the thin layer of the substrate. To analyse the effect of the temperature profile on the coating properties, a detailed sample-cutting approach was used, as shown in Figure 2. The dimension of characterization samples is roughly 10 × Schematic of sample-cutting approach.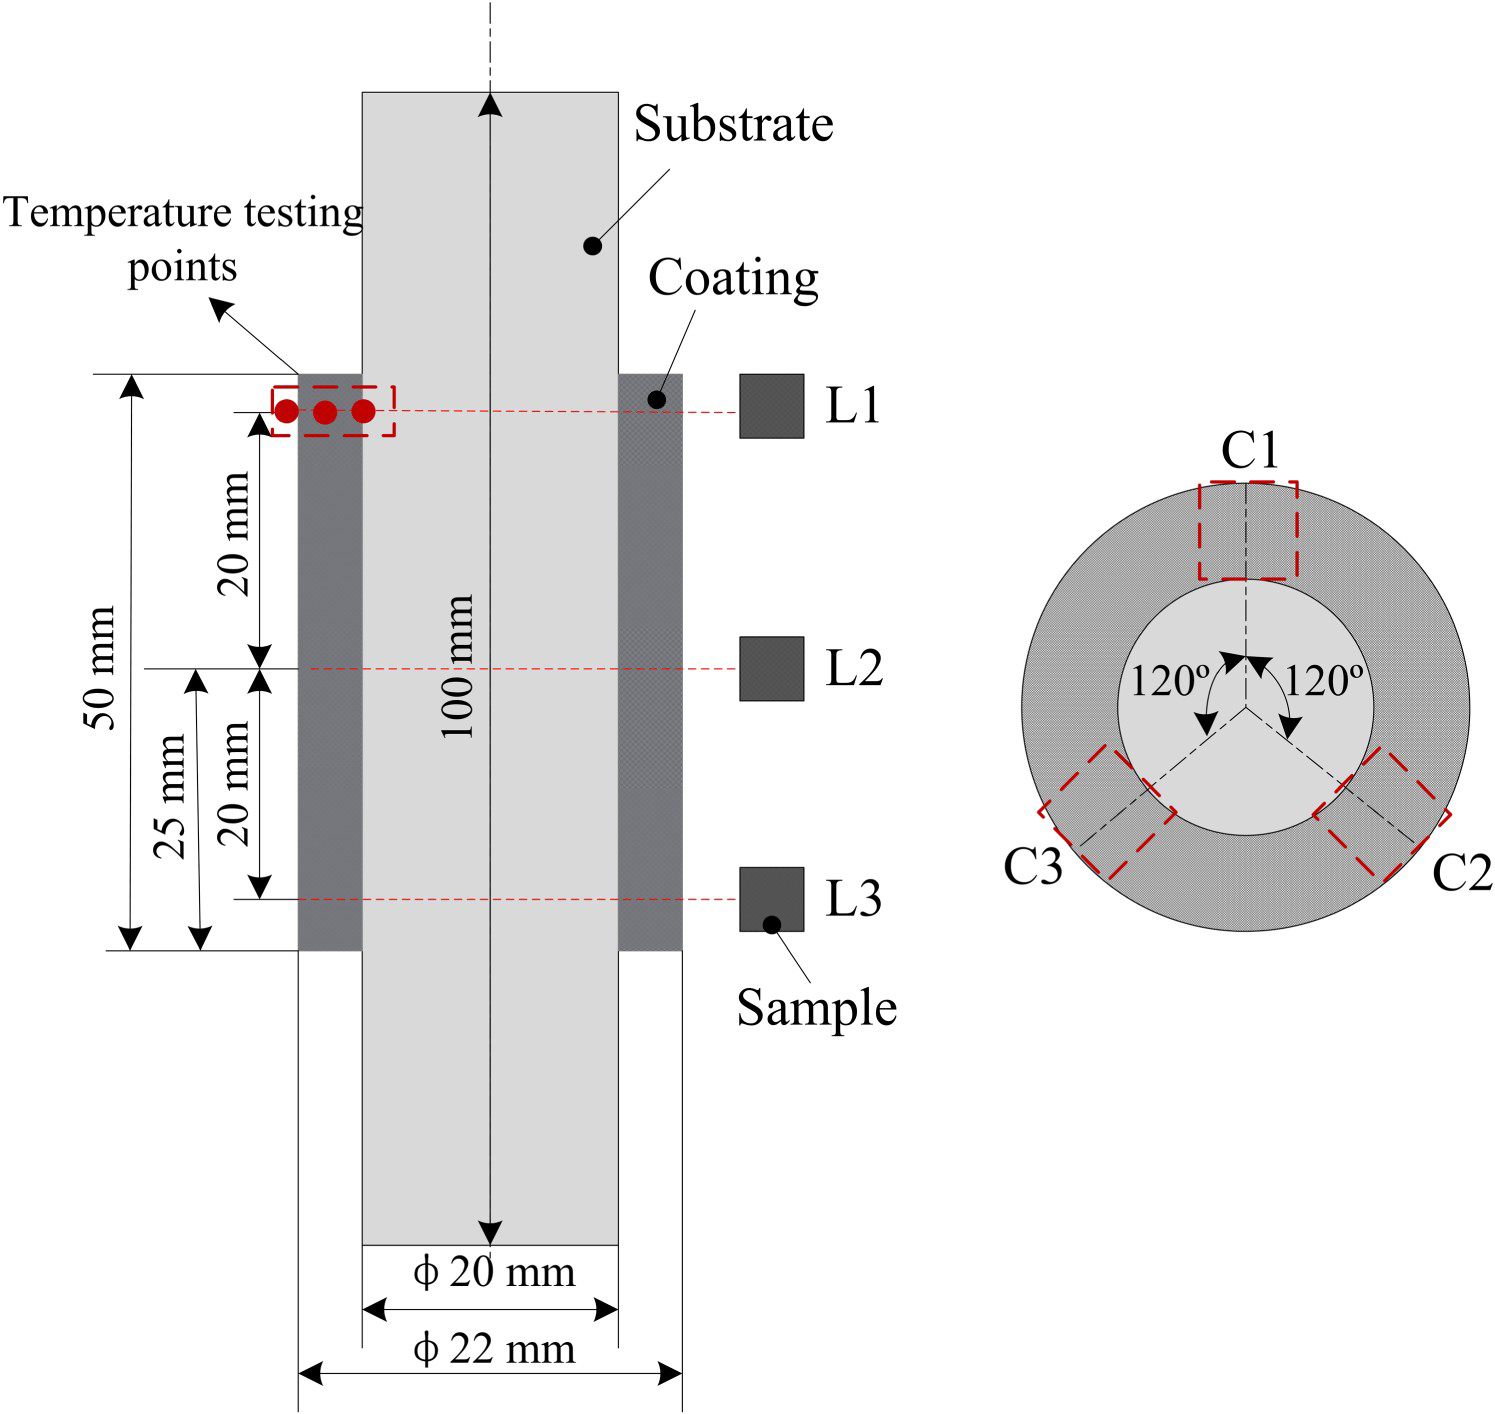
Numerical model of induction cladding
To investigate the electromagnetic field and temperature profile during the induction cladding process, a 2D axisymmetric model was employed to conduct the calculation using the FEA software COMSOL5.2. The following assumptions were made:
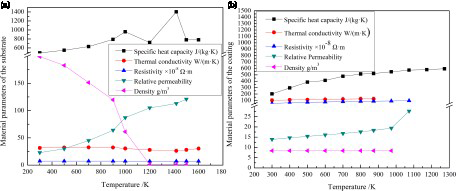
For a rotationally symmetric geometry, a 2D model can achieve the required computational accuracy. The inductor was simplified to several single-turn coils with an equivalent length of the real inductor. The temperature-dependent material parameters of the Co-based alloy powder and AISI 1045 steel were obtained using JMatPro software and from the literature, as shown in Figure 3. For the Co-based alloy powder, some material properties were replaced by those of the corresponding bulk material. Material parameters of the (a) substrate and (b) coating.
To accurately simulate the real experimental process, the calculation geometry consisted of a substrate, coating, graphite crucible, rotary graphite base, and copper water-cooled coil. The 2D geometric model and the boundary are shown in Figure 4.
2D geometric model and boundary.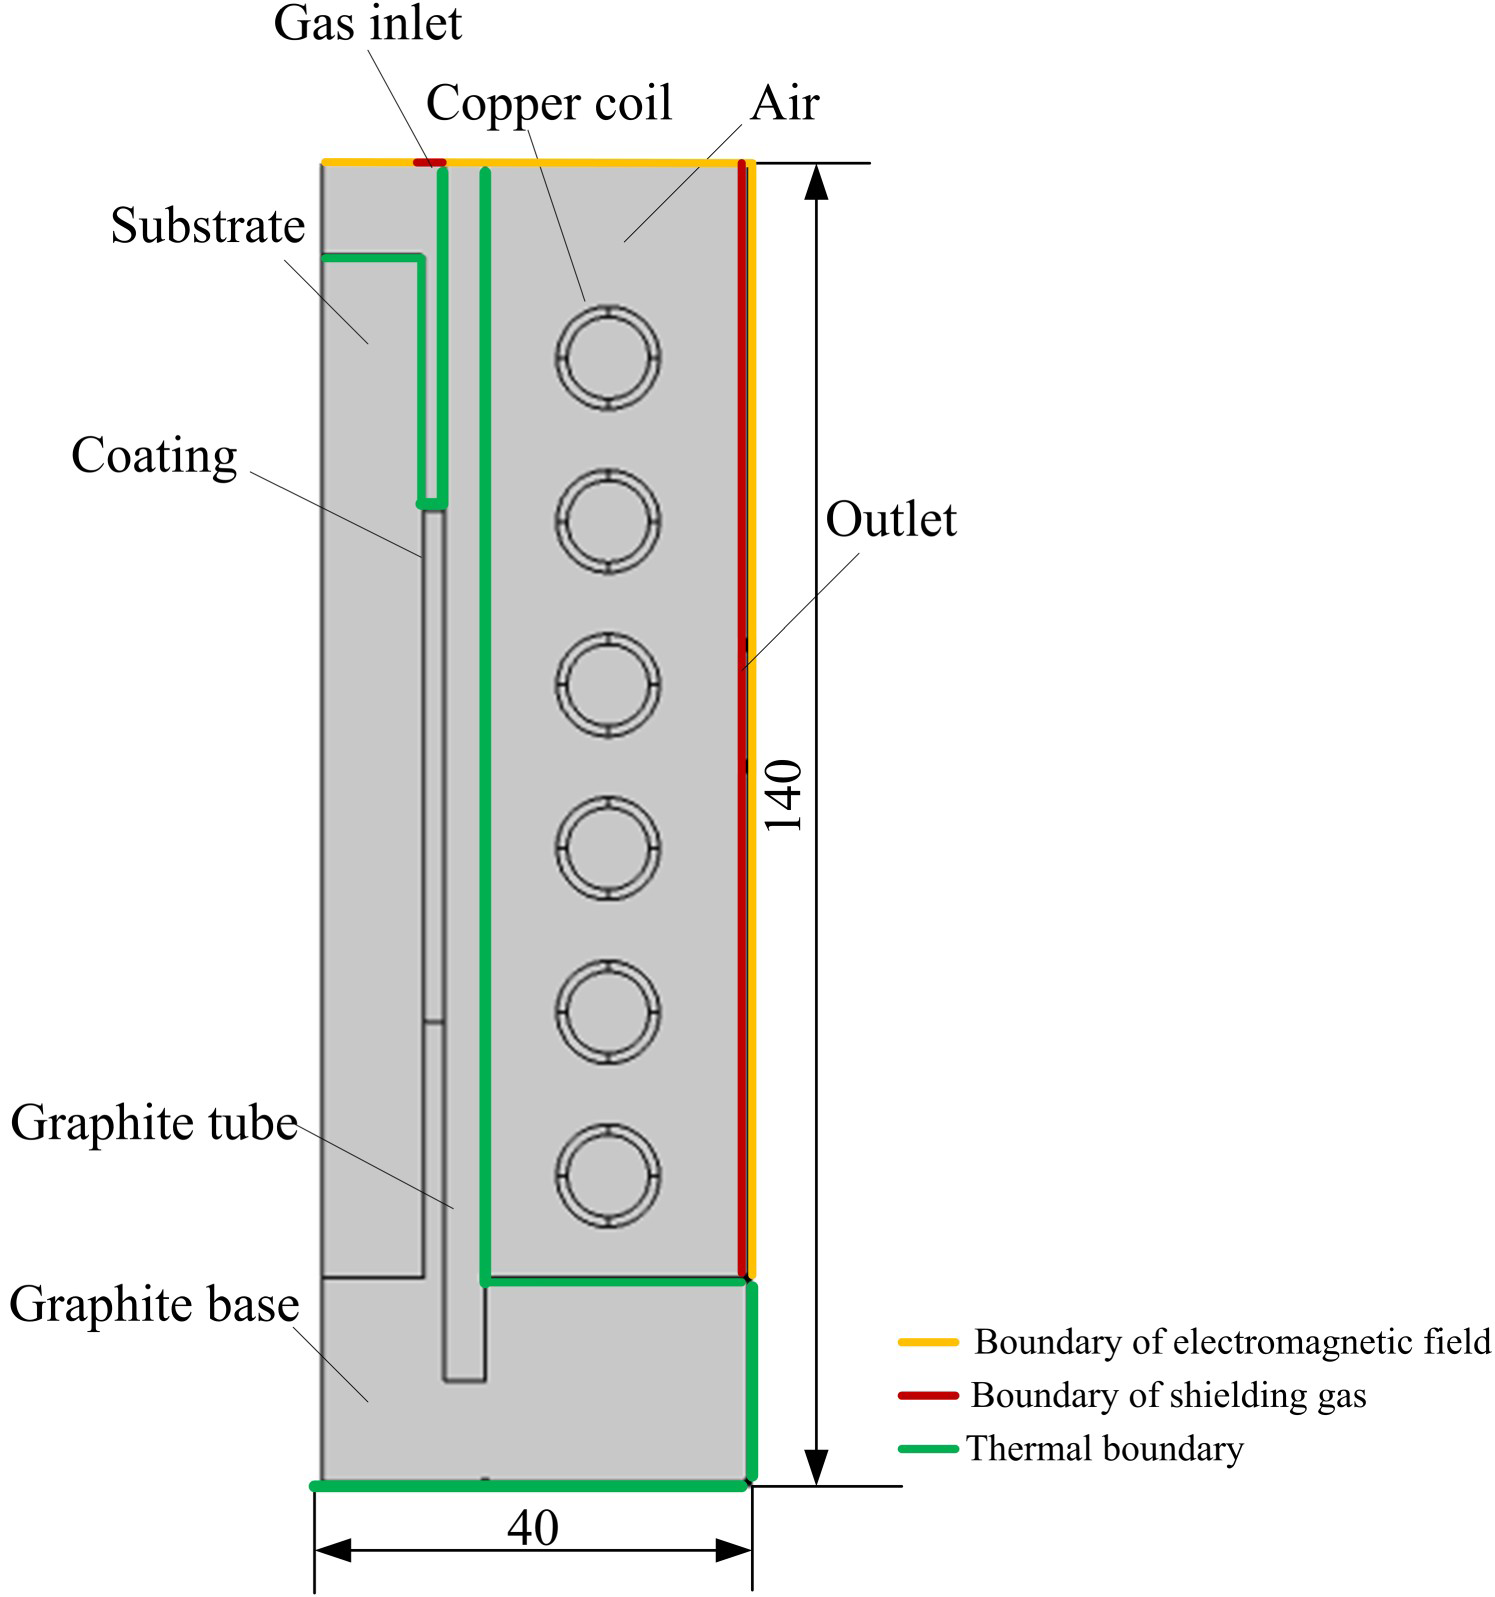
The electromagnetic and thermal fields are weakly coupled. The following governing equations can be used to calculate the induced electromagnetic fields and temperature distribution in the conductor body.
Governing equations
The momentum equation was employed to describe the calculation domain involving the flowing shielding gas.
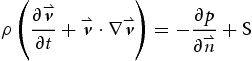
 is the density,
  is the velocity vector, p is the pressure,
  is the normal direction of the boundary surface, t is time, and S is the gravity source.
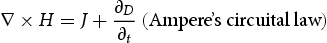
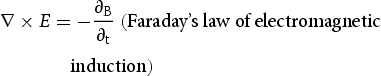
Maxwell's equations were used to analyse the electromagnetic field in the calculation domain.


 is the volume charge density.
The inductor coil is stationary in this case; thus, the displacement current density  can be neglected [23].
The electromagnetic governing equations are supplemented by the magnetic potential equations.
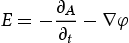

The electromagnetic distribution in the workpiece during induction heating can be described as follows:
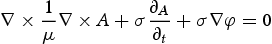
 is the electric scalar potential,
  is the magnetic permeability, and
  is the electrical conductivity.
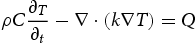
According to the Fourier's law, the non-linear transient heat conduction can be expressed as follows:
Based on Joule's law, the Joule heat source was determined by the following expression:

Initial and boundary conditions and meshes
The initial condition at time t = 0 is given as
The boundary conditions for radiation and convection can be defined as follows:
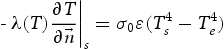
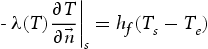
 is the temperature gradient,
  is the Stefan–Boltzmann constant
  , and
, and  is the thermal emissivity (0.68) [24].
The heat convection between the circulated cooling water and coil was considered in the calculation domain. The temperature on the outside wall of the inductor coil is constantly close to the ambient temperature; thus, the heat flow there was set to zero. The heat loss in each single-turn coil is expressed as follows:
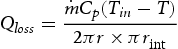
 is the cooling water flow rate, 50 L/h;
  is the heat capacity of the cooling water;
  is the inlet temperature of the cooling water, 12°C; and
  and
and  are the inner and outer radii of the coil, respectively.
The gas phase of pure argon flowed into the calculation domain at a constant velocity of 30 L/min, and the diameter of the gas inlet was 10 mm. In addition, the gas pressure at the outlet boundary was zero [25].
The magnetic vector potential was A = 0 along the boundary.
Owing to the skin effect from the alternating electromagnetic field, the induced eddy current is mostly concentrated within the coating and a thin layer of the workpiece surface, namely the skin depth. The current penetration depth δ can be determined by the following expression:
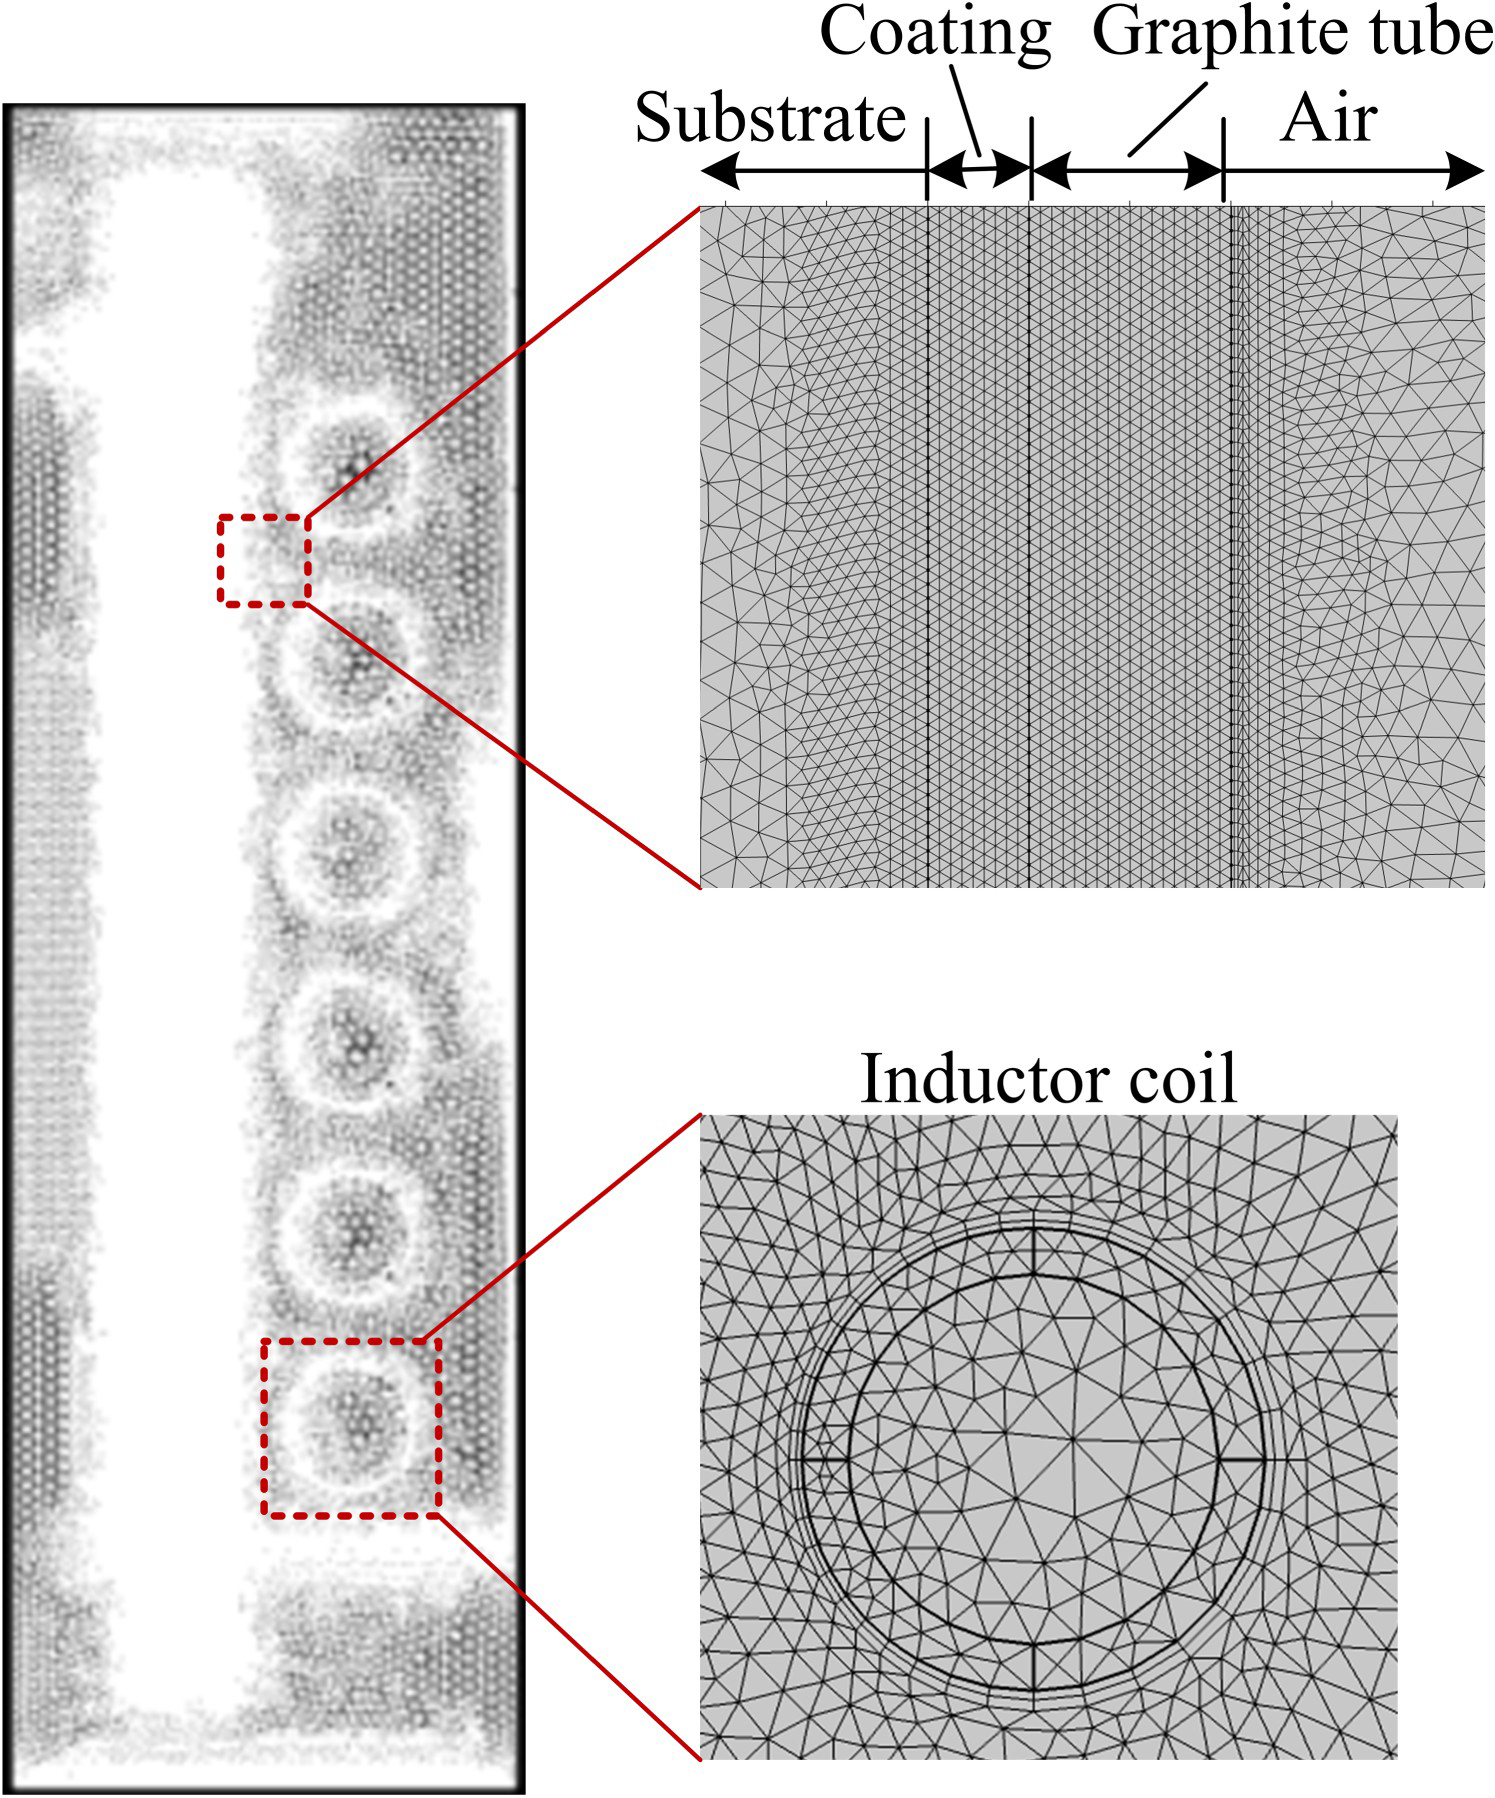
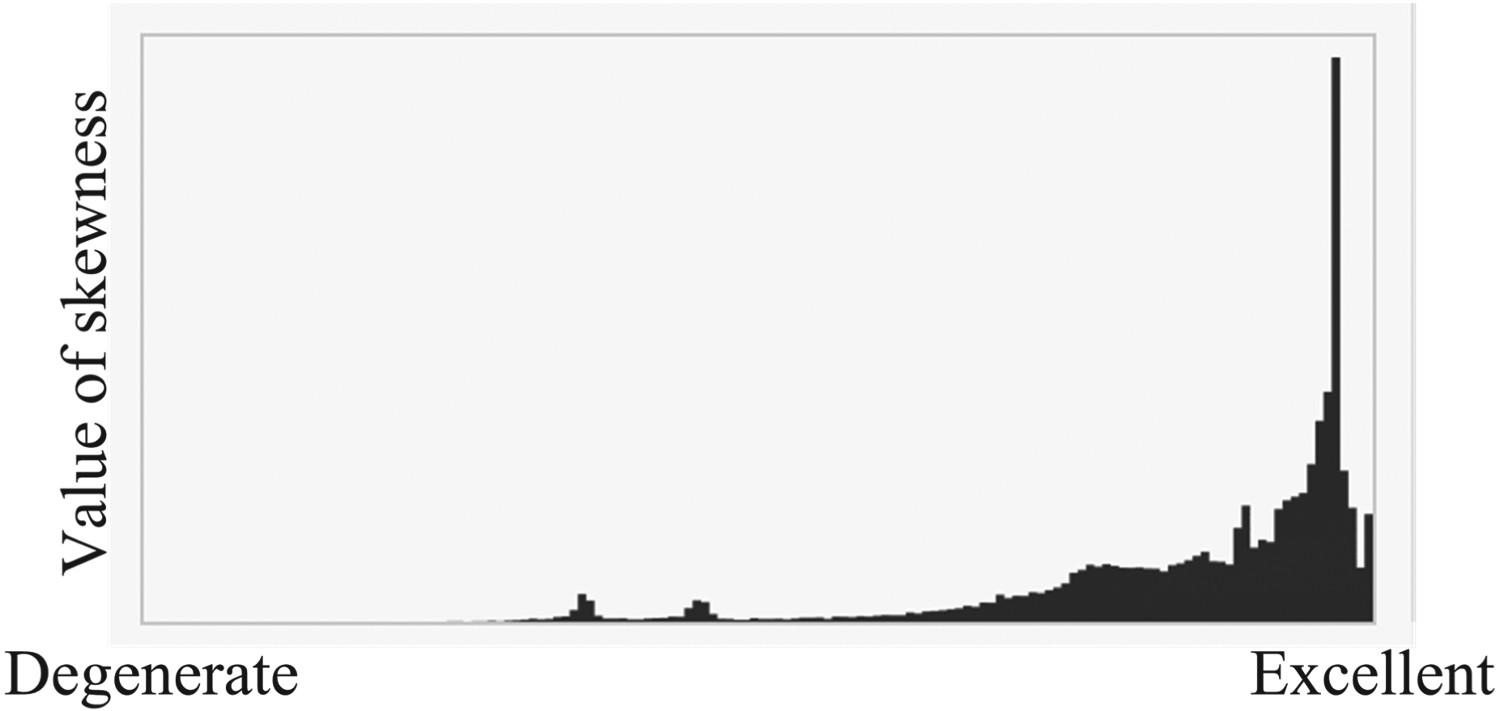
Entire model with an unstructured grid and the enlarged views. Element quality histogram.
 H/m is the magnetic constant, and f is the frequency of the electromagnetic field (Hz). Therefore, the mesh size should be sufficiently fine to guarantee calculation accuracy. An unstructured grid was used to mesh the model, as shown in Figure 5. The size of the surface mesh in the graphite tube and coating ranged from 0.279 to 8.33 × 10⁻⁴ mm, and that in the graphite base, substrate, inductor coil, and air varied from 1.17 to 0.0167 mm. To balance computational efficiency and computational accuracy, automatic mesh refinement (AMR) was performed. The statistical results of the element quality are plotted in a histogram, as shown in Figure 6. It is noted that most of the bars fall to the right side of the scale, indicating that the element quality in the meshed model met the quality measure of skewness.
Numerical results
The electromagnetic field, temperature distribution, and gas flow velocity are shown in Figure 7. As can be seen, the magnetic flux and current density around the inductor coil were considerably higher than those in other parts in the calculation domain. However, because of the circulated cooling water in the coil, the temperature of the inductor coil was close to room temperature. In contrast, owing to the skin effect of the eddy current and Joule heating effect, the temperature within the coating and the thin layer of the substrate were beyond the melting point of the coating and substrate materials. Thus, metallurgical bonding between the coating and the substrate can be produced using induction cladding.
Electromagnetic, temperature, and gas flow fields at t = 210 s: J is the current density, Φ is the magnetic flux, T is the temperature, and v is the velocity of the sheilding gas.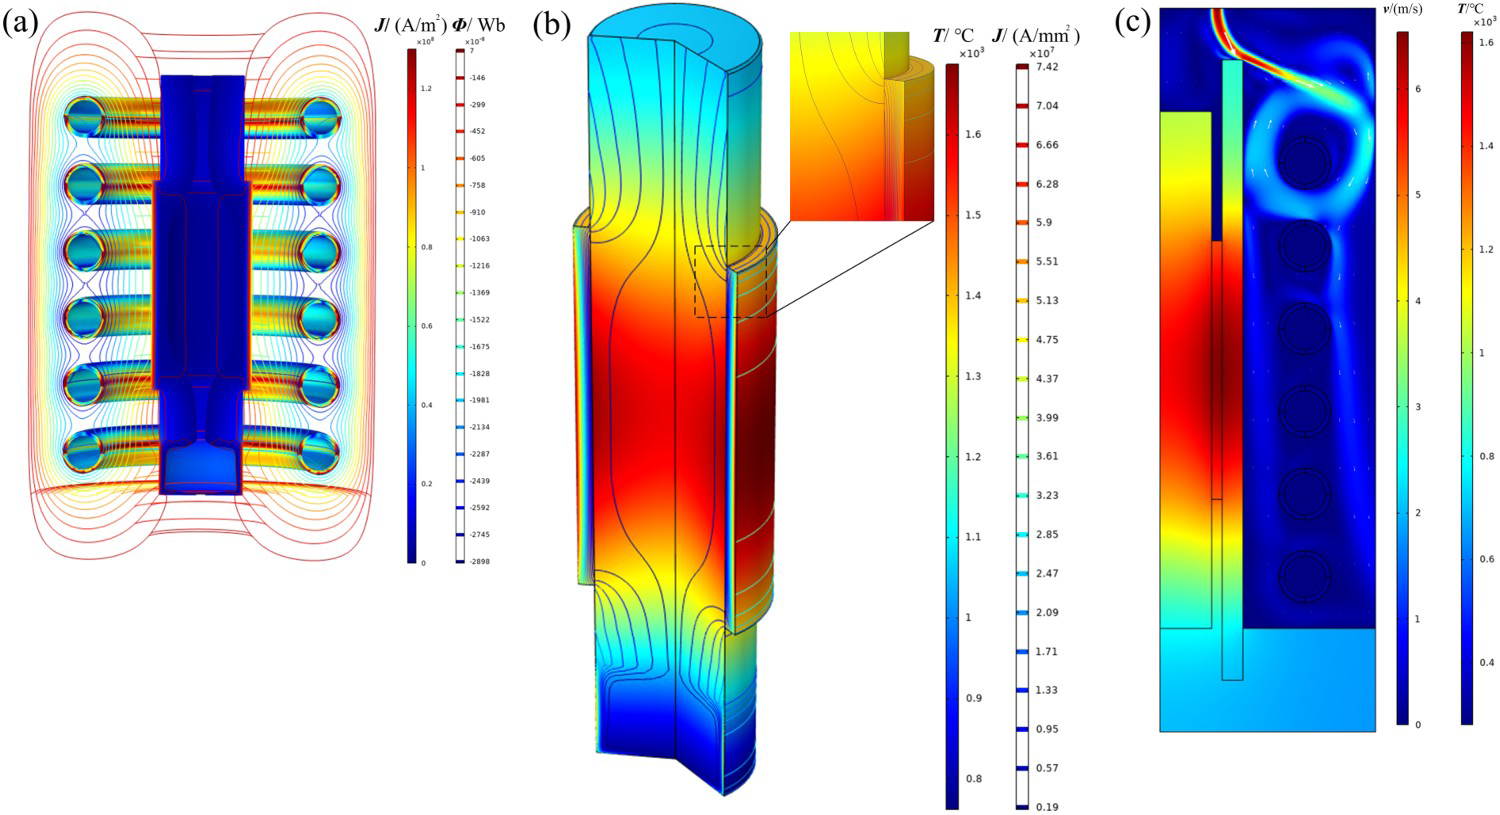
It can be found that the electromagnetic properties of the substrate and coating are noticeably different (Figure 3). The Curie point of the coating was below 200°C, while that of the substrate was approximately 768°C. The electrical resistivity of the coating was 100 times larger than that of the substrate. In contrast, the relative permeability of the substrate was 10 times higher than that of the coating. Compared to the induction heating of a single material, the electromagnetic field distribution during induction cladding presents a unique characteristic. The current density evolution at different depths of the coating and substrate is shown in Figure 8. In the induction cladding process, the induced eddy current was concentrated within the coating and the thin layer close to the substrate surface. Within the coating, the eddy current declined exponentially from the outside surface to the interface between the coating and substrate. The rate of decline depends on the electrical resistivity and relative permeability of the coating material and the induction frequency [26]. For the substrate, as the induction cladding process proceeded, the surface temperature of the substrate was beyond the Curie point; therefore, demagnetisation occurred in the substrate. The maximum current density in the substrate appeared at the boundary between the demagnetised and magnetised layers. The boundary moved towards the substrate interior as the heating time increased.
Current density evolution in the cross section of the coating at L2.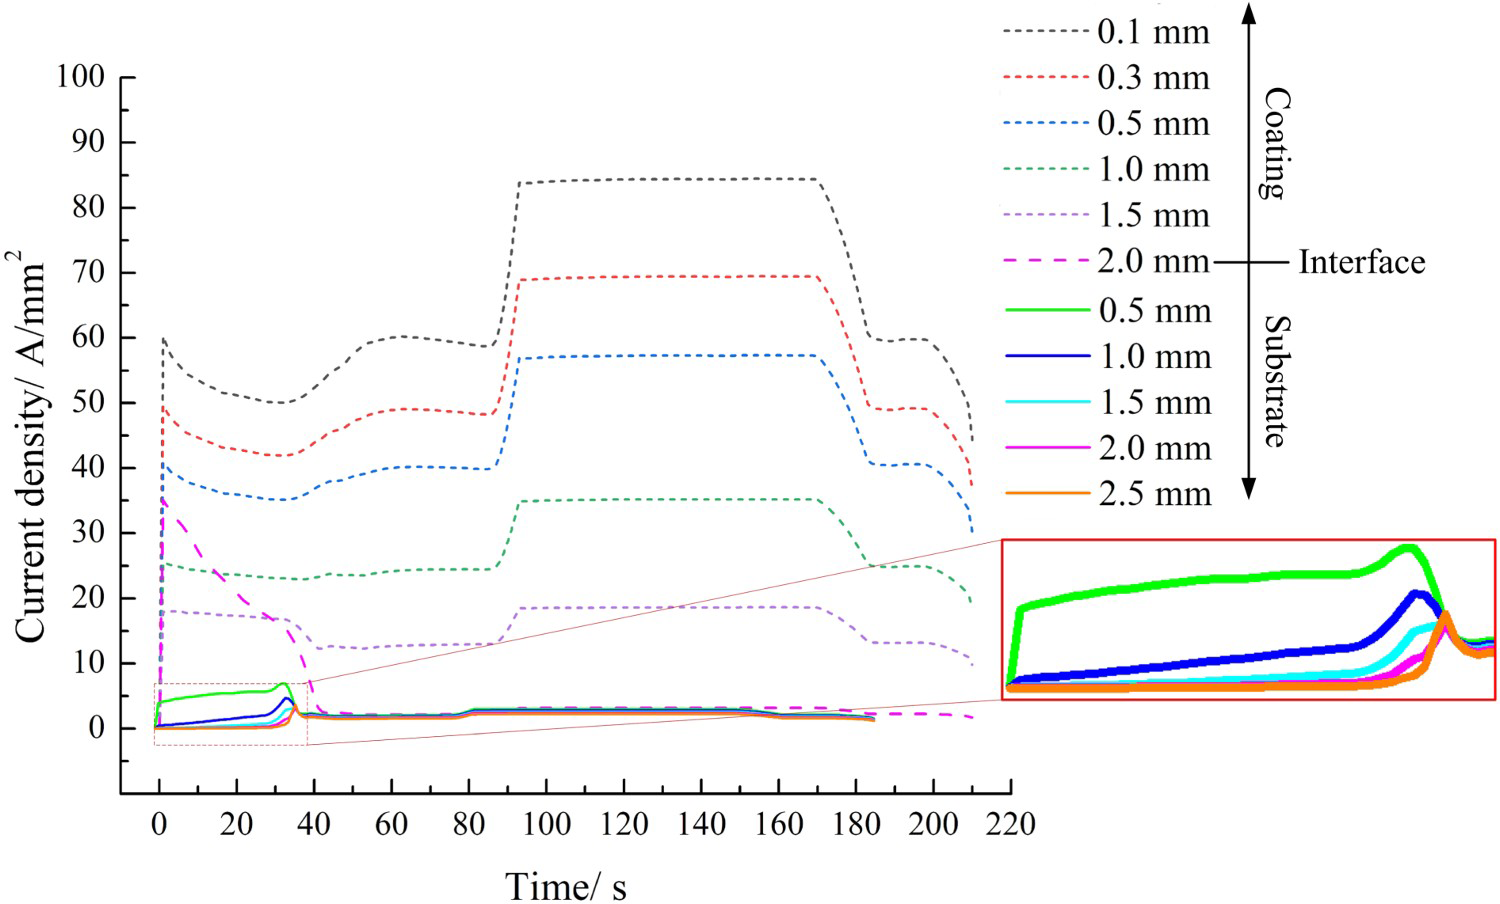
The skin depth varied in the coating and substrate as shown in Figure 9. The skin depth of the coating was less than the coating thickness; therefore, there was a temperature difference between the surface and interior of the coating. In an extremely short period of time, the temperature on the substrate surface exceeded the Curie point; subsequently, the substrate was heated layer by layer. Owing to heat conduction, the lower temperature at the interior of the coating can be compensated by the heating from the substrate surface. However, owing to the edge effect, the skin depth at the two ends of the substrate was thinner than that at the middle, resulting in a non-uniform distribution of eddy current in the substrate surface along the longitudinal direction.
Skin depth δ profile.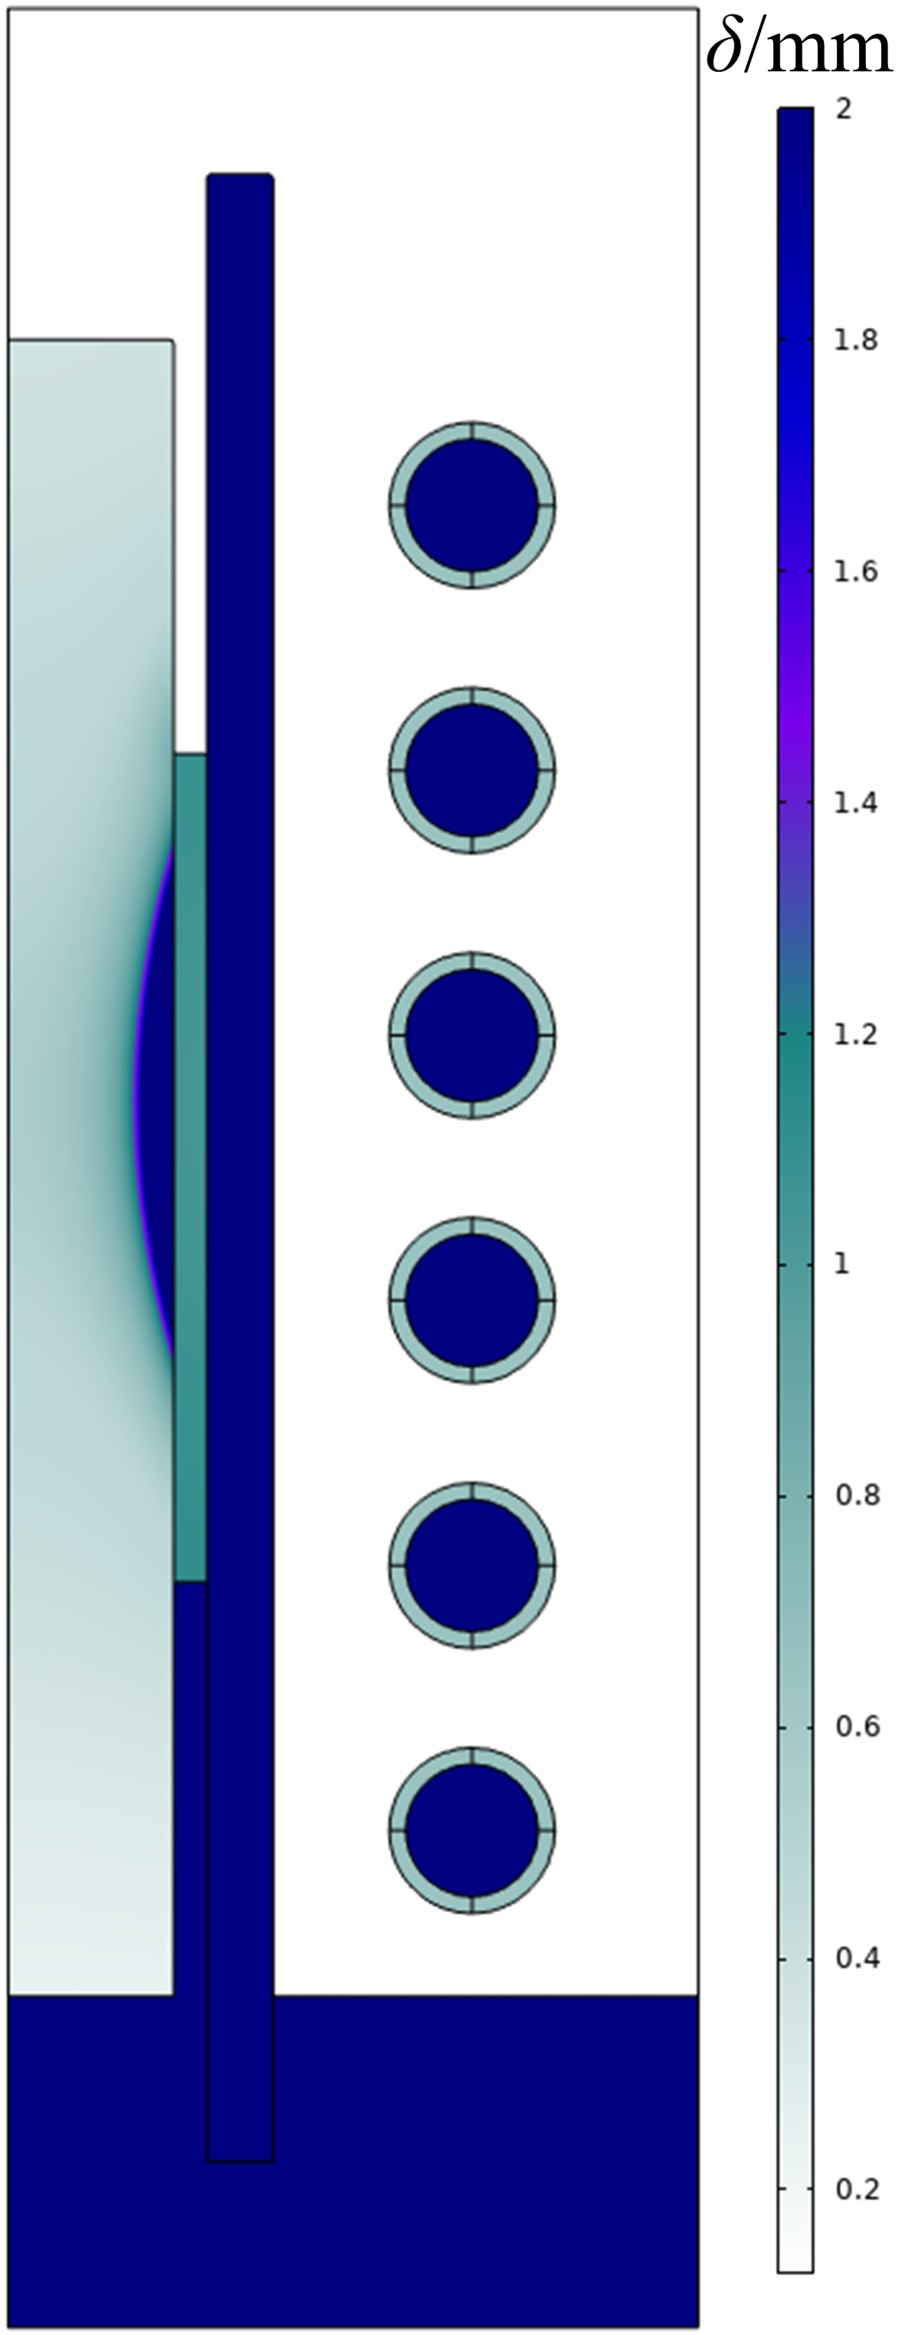
The maximum temperatures at different positions of the coating are shown in Figure 10. As can be observed, all the temperatures exceeded the melting point of the self-fluxing Co-based alloy powder (1100–1200°C) and AISI 1045 steel (approximately 1490°C). Moreover, the temperature throughout L2 was higher than those of L1 and L3. The non-uniform distribution of the electromagnetic field had a larger impact in the longitudinal direction than in the cross section. Additionally, to observe the temperature distribution along the coating thickness, three simulated points were selected, which were on the surface of the coating, in the middle of the coating, and at the interface between the coating and substrate (see Figure 2). The temperature variation between the coating surface and the interface at L2 was 2°C, while those at L1 and L3 were 4°C and 12°C, respectively. The relatively thinner skin depth and sparser magnetic induction line at the two ends of the induction coil resulted in an uneven temperature distribution, which also had an impact on the composition and properties of the coating.
Maximum temperature of the coating at various positions.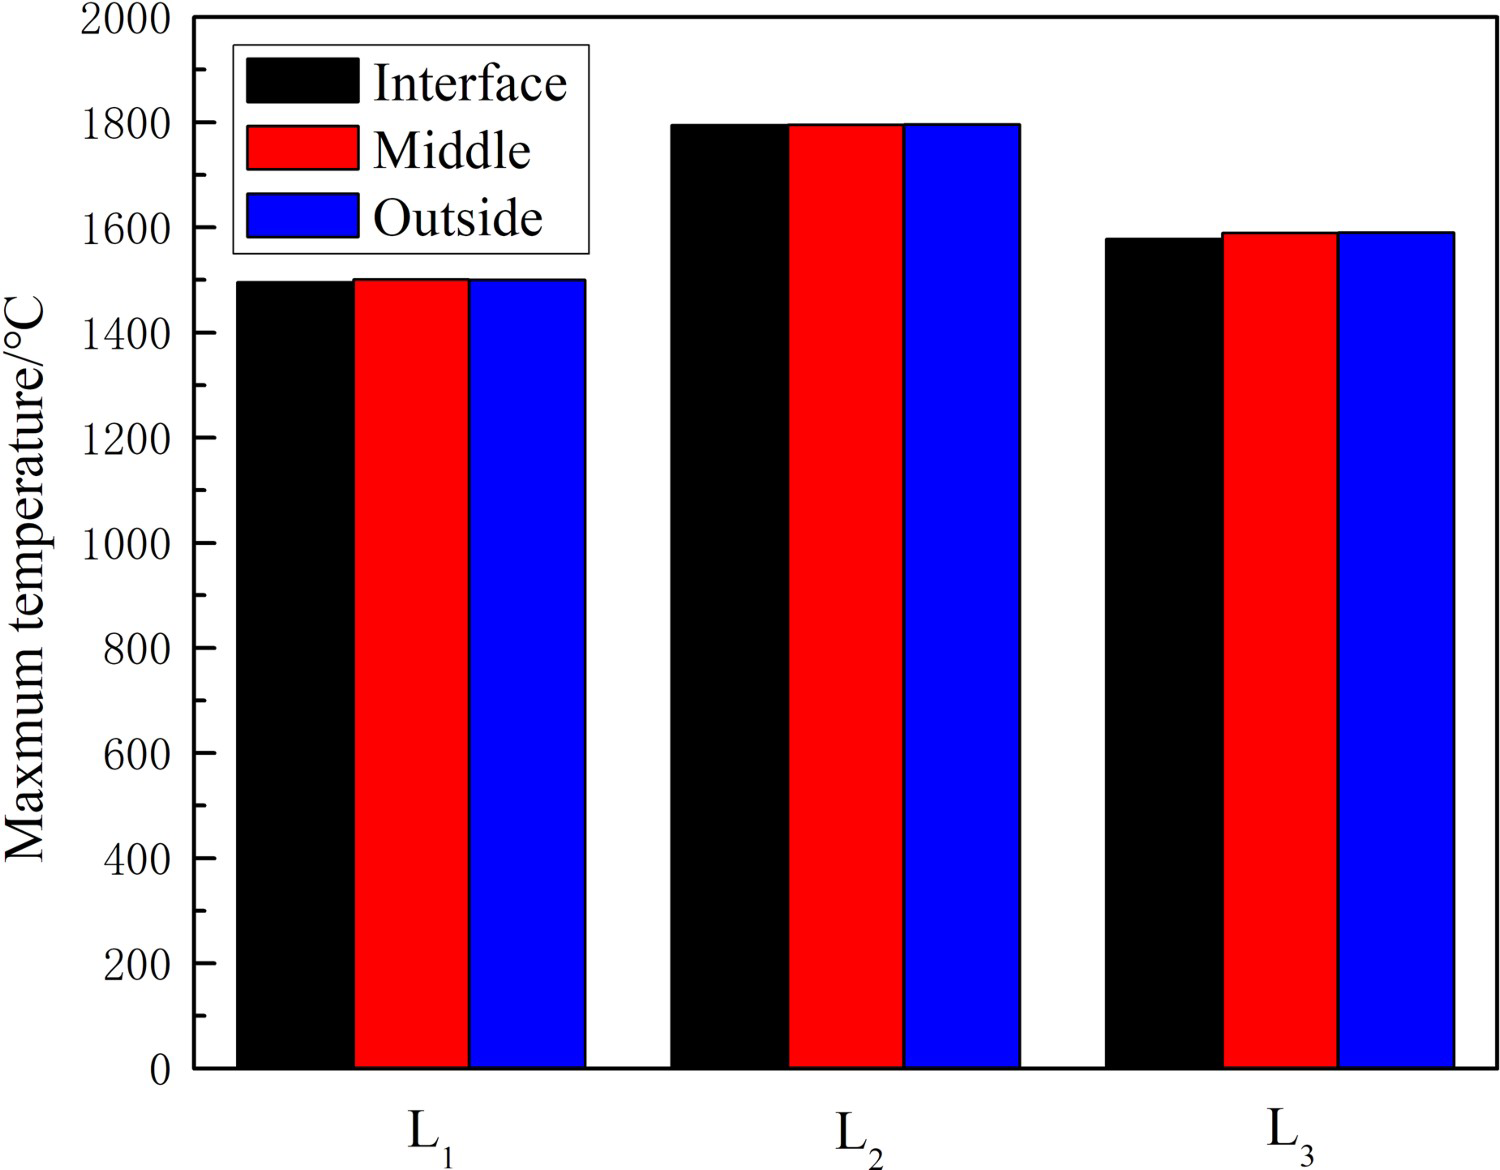
Two infrared thermometers were used to record the temperatures of the substrate and the graphite tube. The calculated and measured temperature curves are shown in Figure 11. It can be seen that the calculated temperature of the graphite tube was slightly higher than the measured result. During the induction cladding process, the testing point was rotating with the graphite tube, while it was a fixed point in the numerical simulation. In addition, the measured heating rate was slower than that of the numerically simulated one. The reason is that in the real experimental context, the electromagnetic field required a short time to be built in the workpiece; in contrast, the electric current was directly input into the calculation model. For the graphite tube, the maximum relative error between the calculated and tested results was approximately 8.36%; this is less than 10%, which is acceptable in mechanical engineering. Because of the nearly stationary temperature testing point on the top surface of the substrate, the simulated result was close to the measured one, and the maximum relative error was approximately 3.85%. Based on the errors given above, it can be found that the simulated results are in reasonable agreement with the experimental results, indicating that the simulation model is reliable as well.
Experimental and simulated time–temperature curves.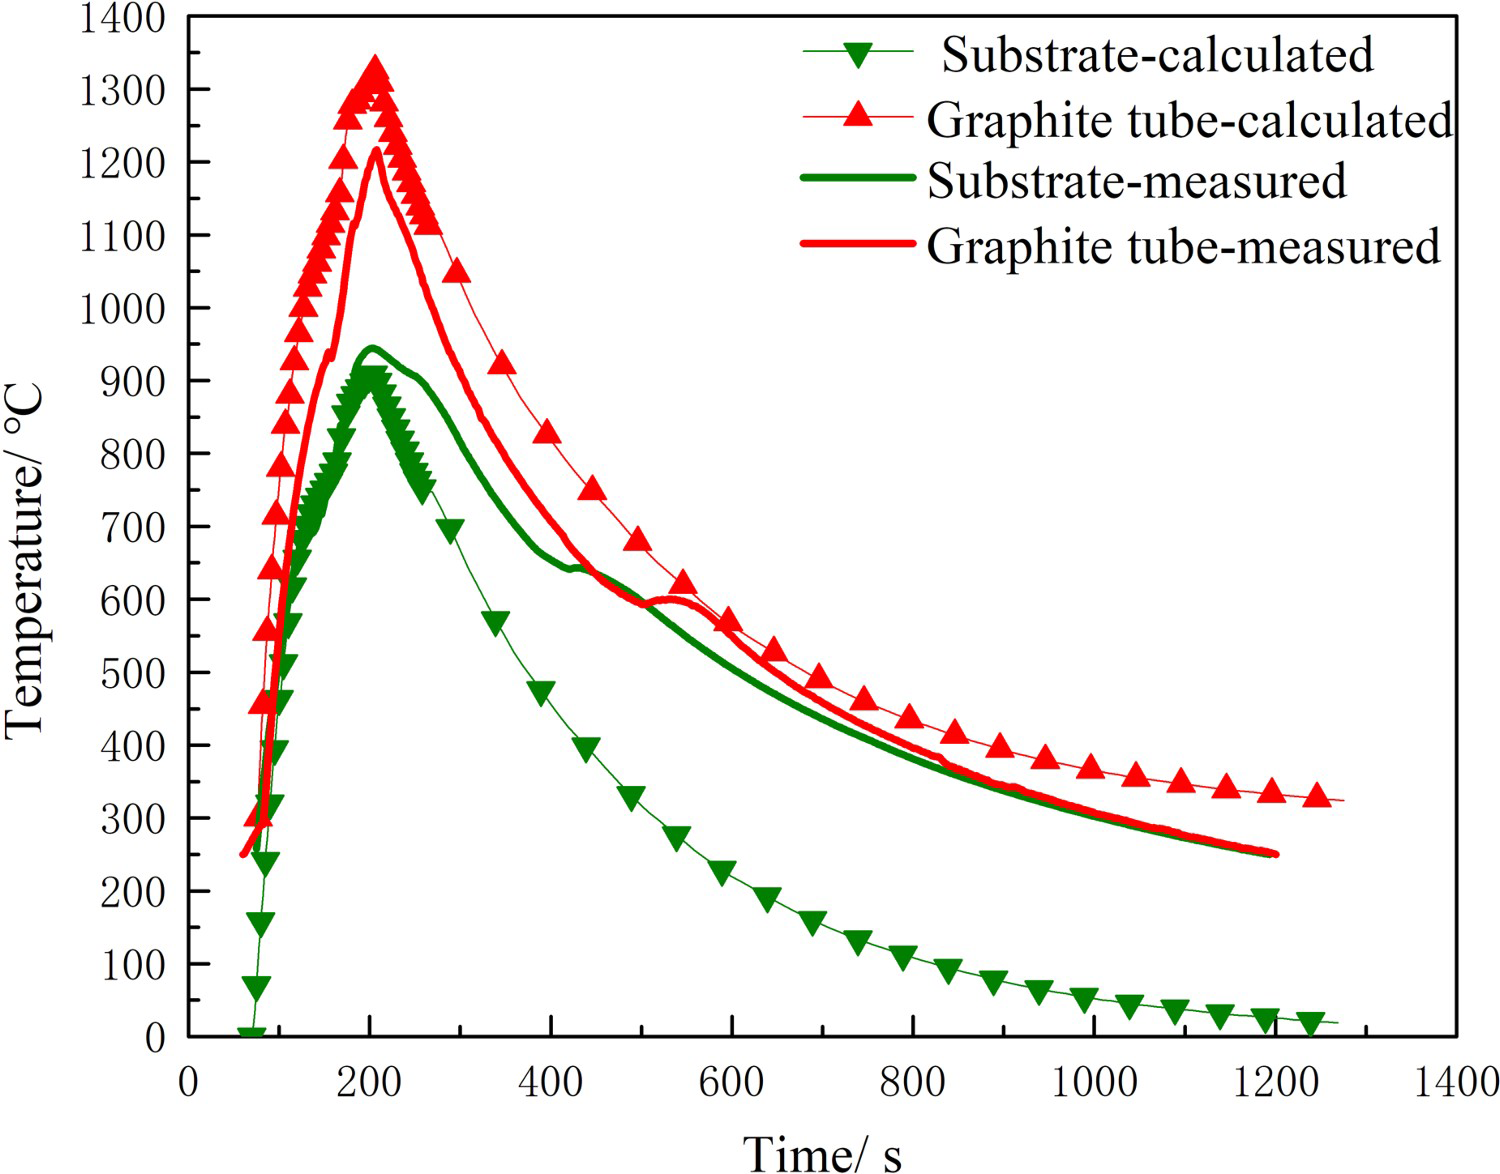
Experimental results
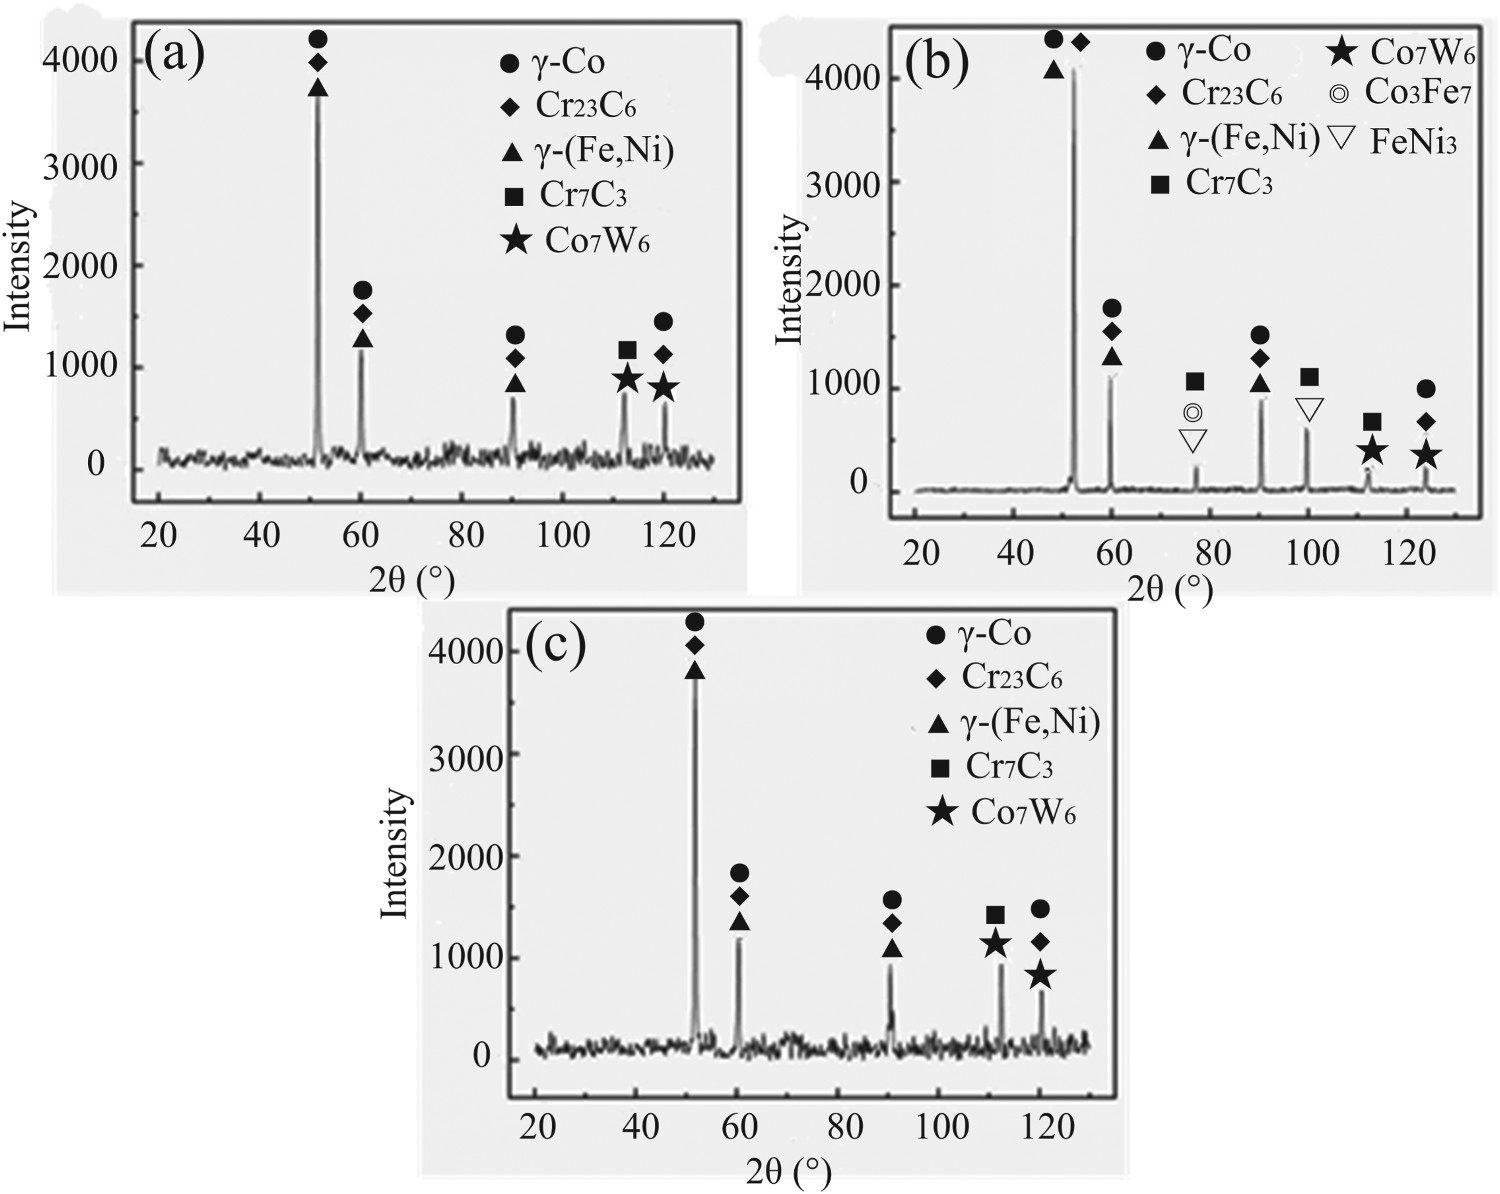
Elemental diffusion at the interface was detected by EDS line scanning, as shown in Figure 12. It should be noted that the primary elemental compositions of the coating and substrate appear to have mutually diffused at the interface between the coating and substrate. Iron atoms diffused from the substrate into the coating, while cobalt and chromium atoms diffused from the coating to the substrate. Furthermore, the contents of Co, Fe, and Cr changed abruptly at the interface. During induction cladding, the high temperature at the interface promotes elemental migration and consequently produces metallurgical bonding between the substrate and coating. The phase composition of the coating is shown in Figure 13. It can be observed that the coatings at L1, L2, and L3 all consisted of γ-Co, Cr23C6, Cr7C3, γ-(Fe, Ni), and Co7W6, while the intermetallic compounds Co3Fe7 and FeNi3 only occurred in the coating at L2. This is mainly attributed to the high Joule heating in the middle region of the workpiece.
Line scanning results at the interface in: (a) L1, (b) L2, and (c) L3. XRD patterns of coating surface in: (a) L1, (b) L2, and (c) L3.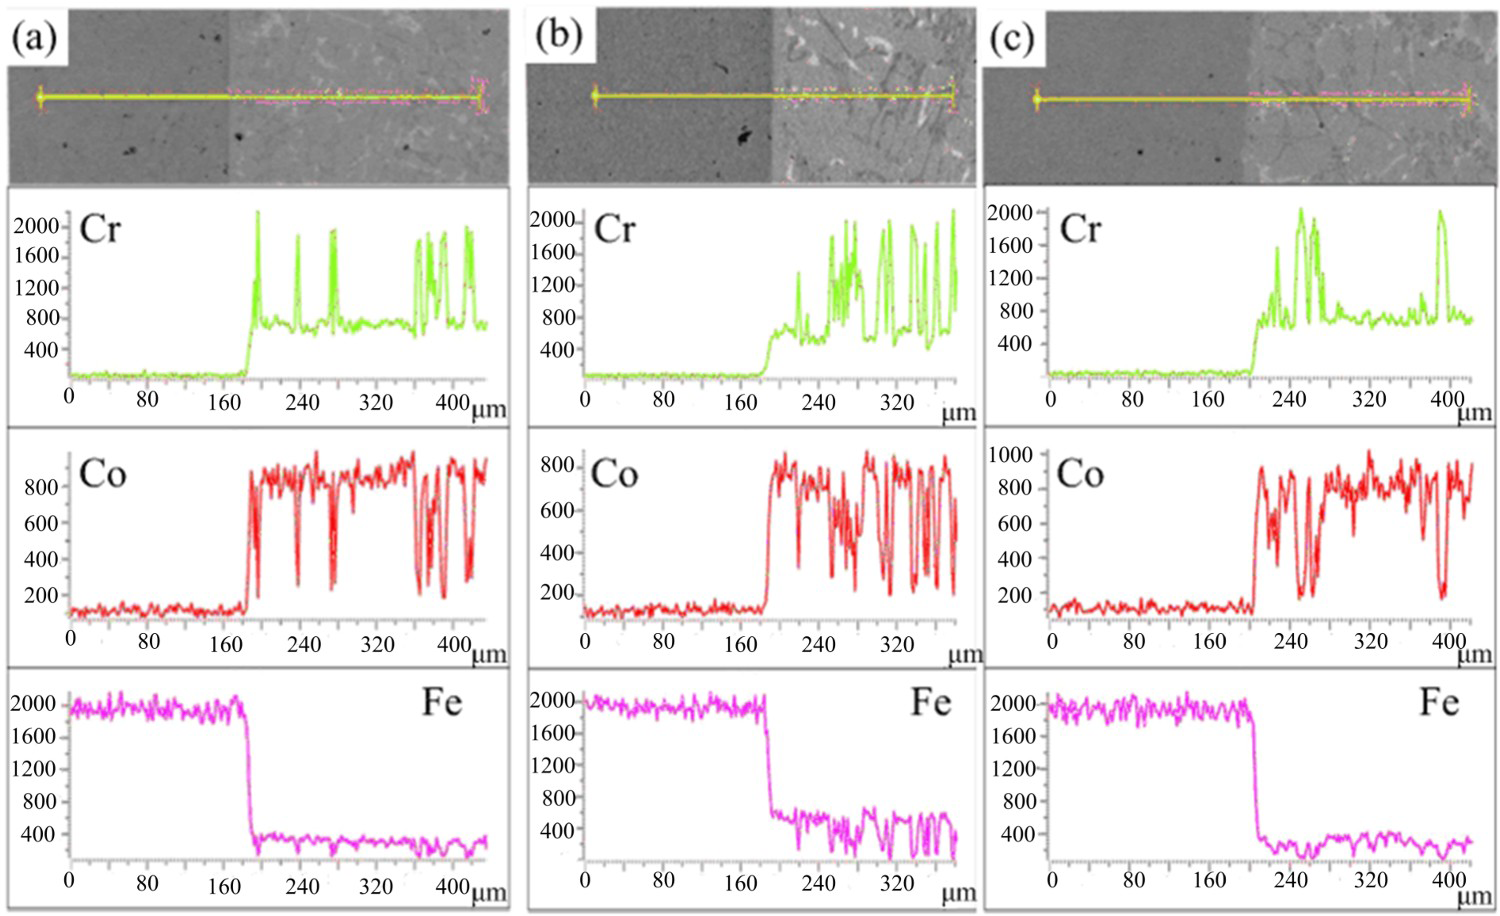
The distribution of elements present in the coating at L2 was observed by EDS mapping, as shown in Figure 14. It can be observed that the coating consisted of dark grey block-shaped and white feather-like dendrites within the light grey matrix. The EDS mapping results and EDS analysis of the selected areas I, II, and III confirm that the main components of the coating were Co, Cr, Fe, Ni, C, and W. These results also reveal that the dark grey area was rich in Cr, C, and W, while W was mostly concentrated in the white features, such as dendrites.
SEM image of a selected area in the coating at L2 and the corresponding EDS analysis results.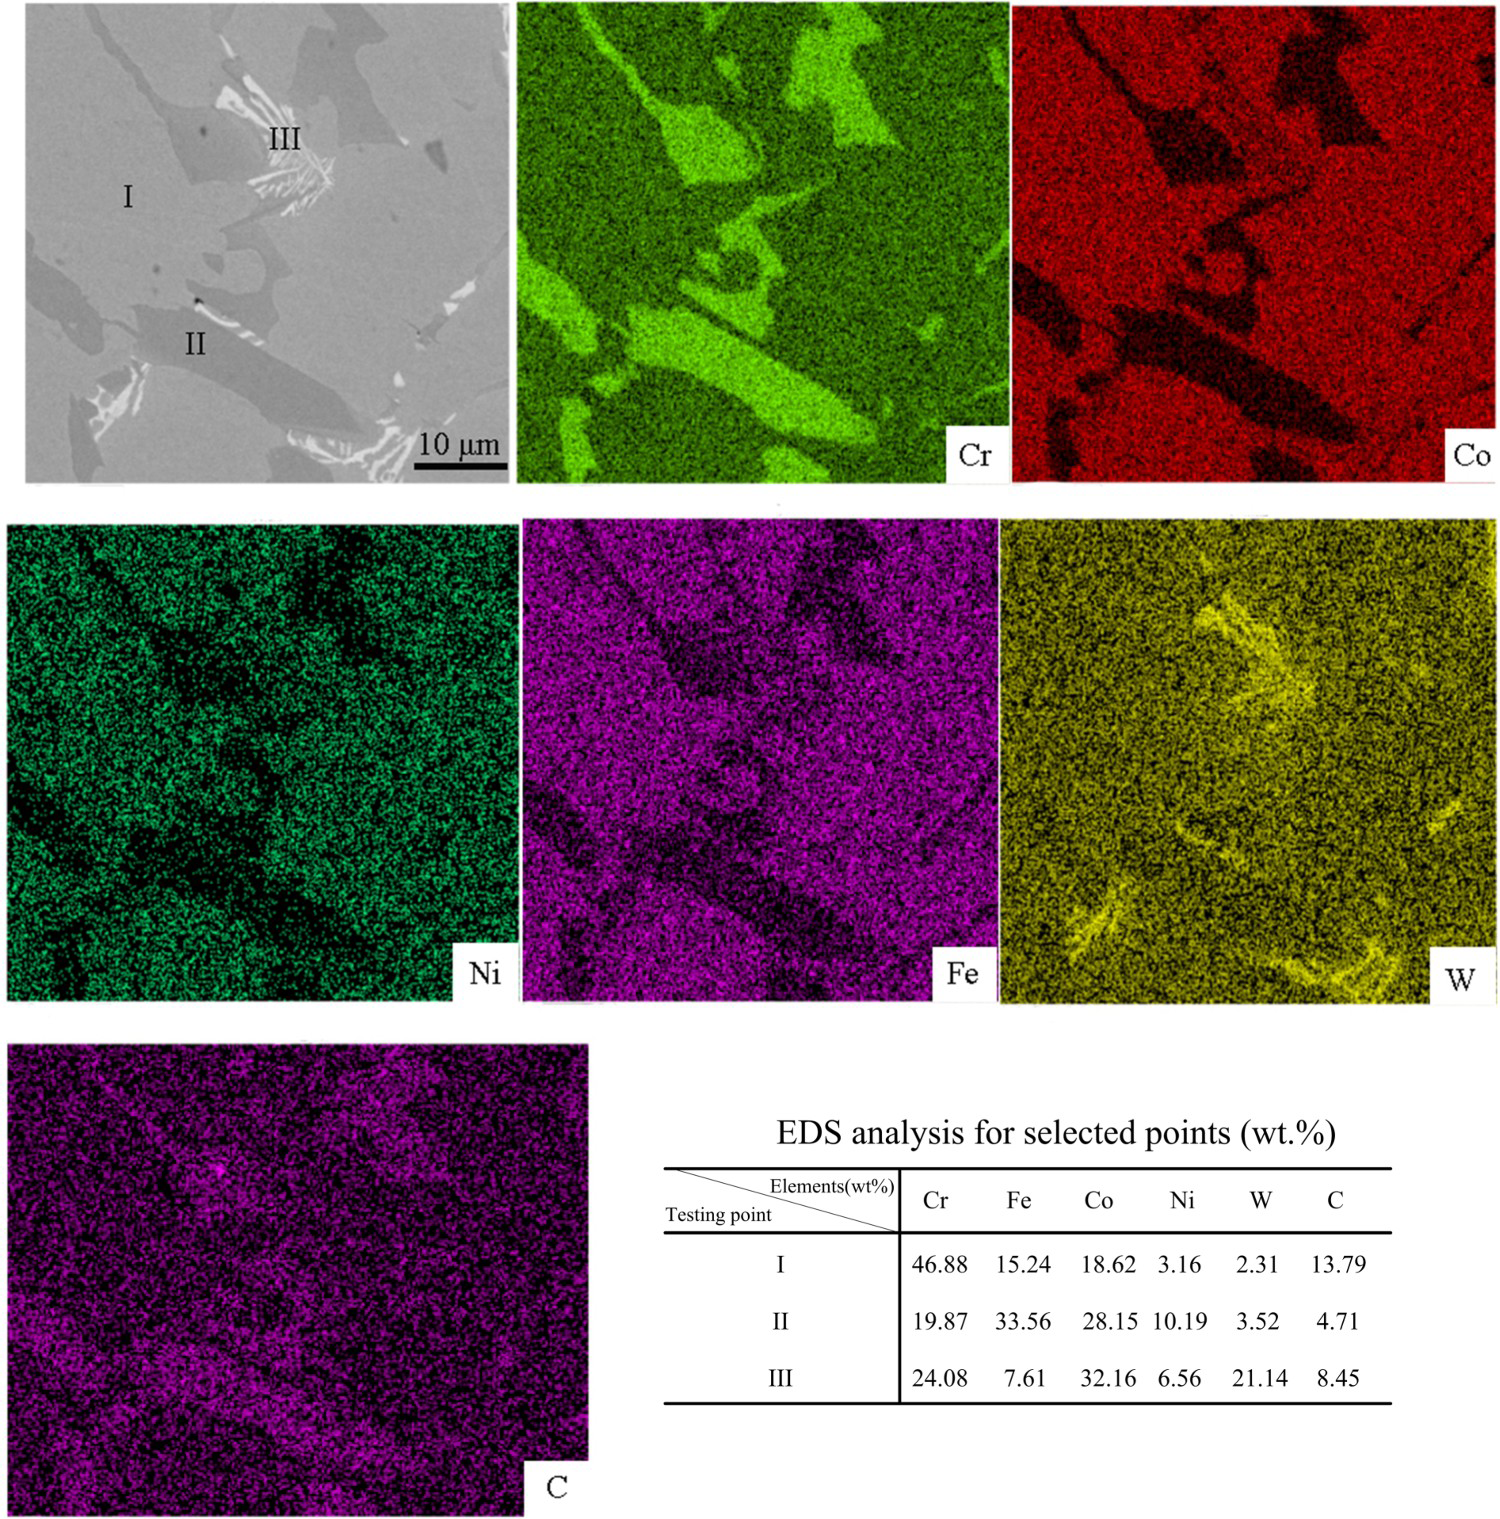
The porosity of the induction-clad coating was approximately similar to that of coatings produced by wire and arc additive manufacturing (WAAM) [27] and the overlap fraction in laser cladding [28]. The porosities of the Co-based coating obtained at various positions are shown in Figure 15. The highest value of porosity in the coating occurred at L3, followed by that at L1, and the coating at L2 had the lowest porosity. The high heating temperature and small temperature difference between the surface and interior of the coating at L2 ensured sufficient melting and provided special condition for the gas bubbles to escape [22], which helped to reduce the porosity. In contrast, the temperature difference in the coating at L3 was relatively large, resulting in higher porosity.
Porosity of the Co-based coating at various locations.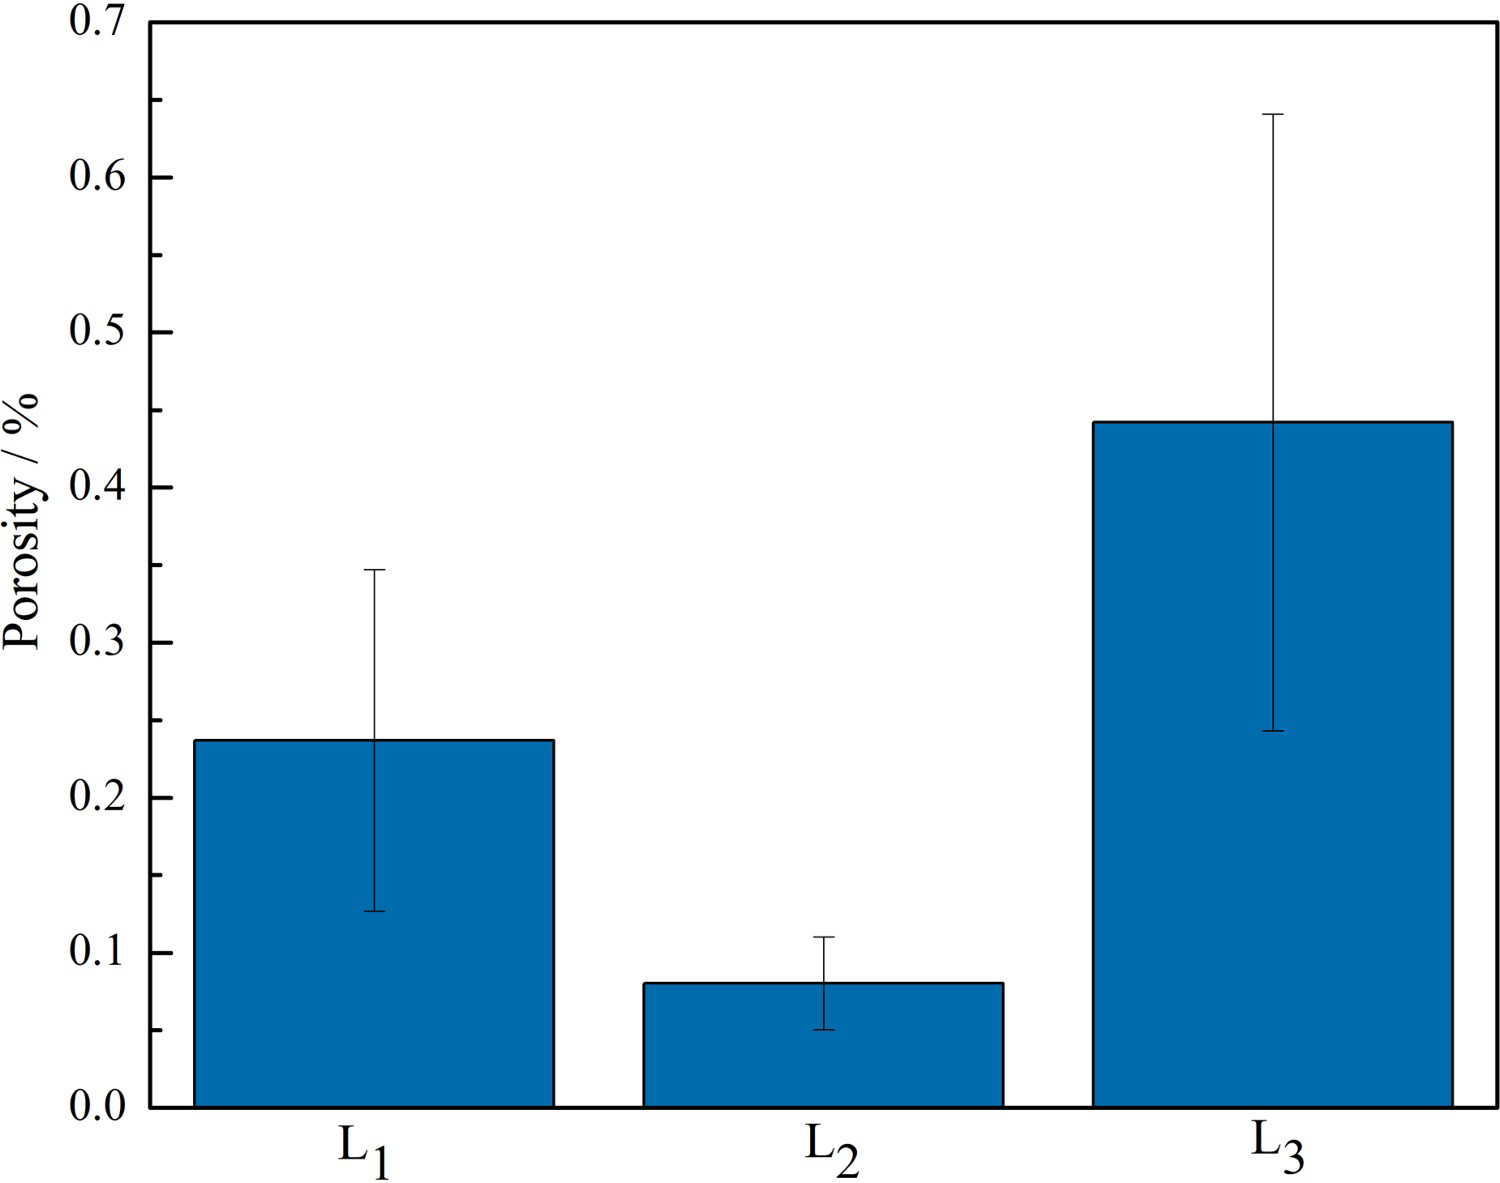
The microhardness profile of the cross section is plotted in Figure 16. Compared to the microhardness of the substrate (approximately 220 HV0.2), the microhardness of the coating at various positions was substantially increased by two to three times, which is primarily attributed to the synthesis of hard phases. It can also be observed that the hardness of the cross section fluctuated constantly from the interface to the top surface. The hardness value is closely related to the phase type and distribution [29], and thus these fluctuations in the hardness of the cross section were due to the uneven distribution of the soft and hard phases. Among these locations, the coating at L2 had the maximum hardness, which was mainly attributed to its relatively dense microstructure and complicated phase composition.
Microhardness profile of Co-based sample.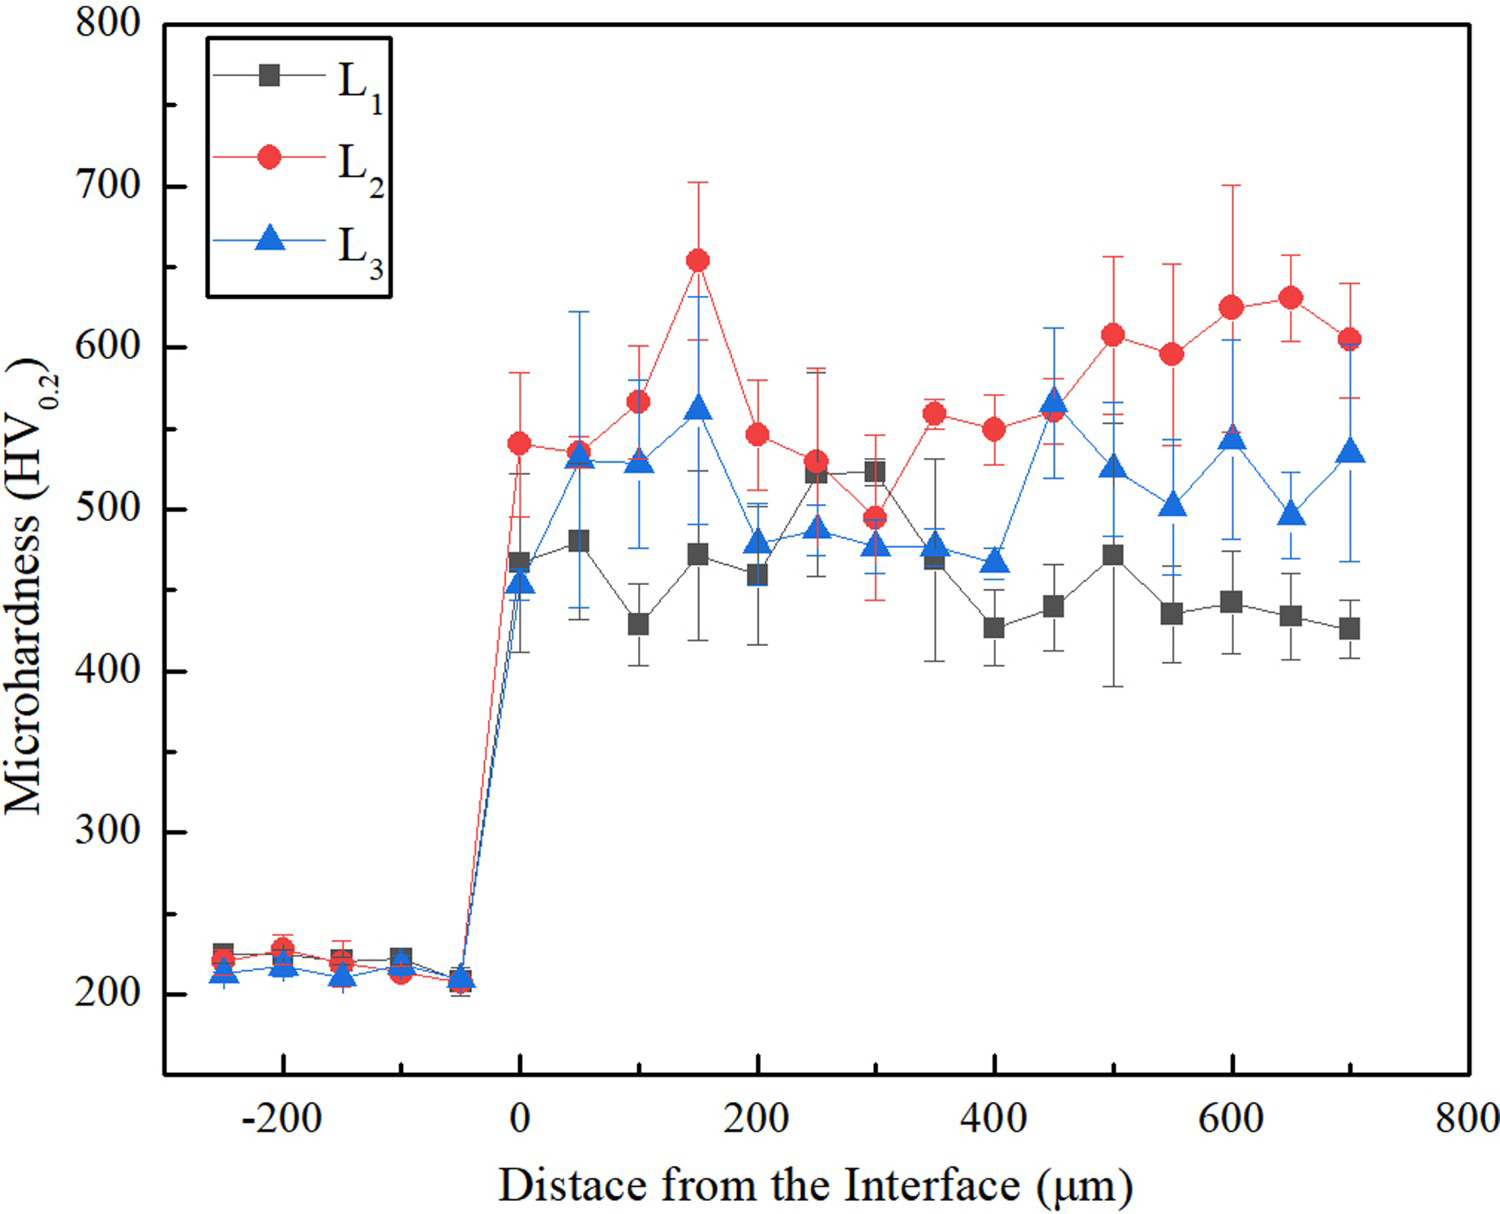
Conclusions
A fully electrical–magnetic–thermal coupled model was proposed to investigate the electromagnetic field and temperature distribution. To simulate the real experimental process, the circulated cooling water in the inductor coil and the flowing shielding gas were considered in the calculation domain. The numerical simulation results of the electromagnetic field and temperature profile suggested that the induced eddy current and skin effect generated Joule heating, which was concentrated in the coating and a thin layer on the substrate surface; this was the main heating source during the induction cladding process. The evolution of the current density revealed that the coating and substrate surface were heated layer by layer. In addition, the non-uniform electromagnetic field resulted in an uneven temperature distribution, which had a larger impact in the longitudinal direction than in the cross section. The temperature measured by an infrared thermometer was used to validate the proposed model. The maximum relative error between the simulation and experiment on the top of the substrate was 3.85%, while that on the outside surface of the graphite tube was 8.36%, indicating that the numerical calculation was in good agreement with the experimental results. Owing to the relatively high temperature and small temperature difference between the coating surface and interface in the middle of the workpiece, the specimen in the middle of the coil had a more complicated phase composition, lower porosity, and higher microhardness than those of the specimens at the two ends.
Footnotes
Acknowledgements
Experimental assistance by Hongfei YU (China North Engine Res Inst Tianjin, Peoples R China) is gratefully acknowledged.
Disclosure statement
No potential conflict of interest was reported by the author(s).
Correction Statement
This article has been republished with minor changes. These changes do not impact the academic content of the article.