
Abstract
The hot ductility of V containing high Al, TWIP steels was determined at a 1000°C, when no dynamic recrystallisation occurred, and precipitation was too coarse to influence ductility. A change in grain size from ∼1250 to 500 µm caused the reduction of the area to increase by ∼25%, intimating that the improvement in ductility on adding boron is due to its segregation to the boundaries causing grain refinement on solidification. Fine VC precipitation was mainly responsible for deteriorating ductility. In these steels, the ductility of un-recrystallised austenite decreases gradually with increasing temperature from 700°C to 1000°C and this in combination with fine precipitation can markedly change the shape of the hot ductility curve from ductility decreasing to increasing with temperature.
Introduction
Recent work [1] has shown that the reduction of area (RA) values from the hot tensile testing have to be treated with caution when assessing the susceptibility of the strand to cracking when straightened during continuous casting. This arises because dynamic recrystallisation (DRX), which improves ductility and often occurs on tensile testing, does not occur on straightening; the as-cast grain size being too coarse and the strains too small.
The hot ductility curve for low C steels on cooling down from the austenite is often of the type shown in Figure 1, there being a low and high temperature region (regions 1 and 3, respectively) of high ductility separated by a region of low ductility (region 2). The good ductility, region 1, is due to ferrite formation and that in region 3 to DRX.
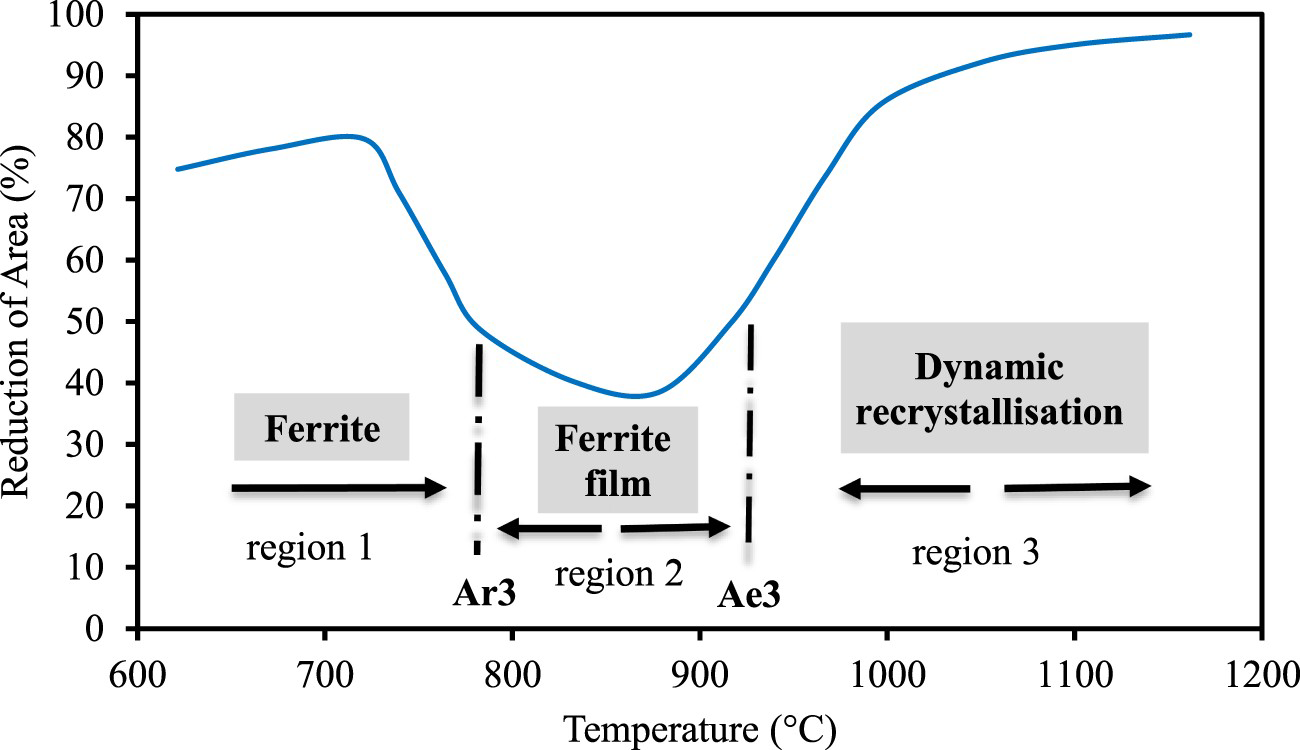
The region of low ductility in Figure 1, region 2 has been ascribed to the presence of a thin film of deformation-induced ferrite at the austenite grain boundaries which because it is softer than the austenite it surrounds, causes on deformation, strain concentration in the ferrite [2]. The film often covers the whole temperature range from the Ae3 to the Ar3. The MnS inclusions situated at the boundaries, in the soft ferrite films, cause voiding and these voids link up to give ductile intergranular failure. Precipitates both at the boundaries and within the matrix then further exasperate the problem [2]. It has been shown that the film of ferrite is responsible for reducing the RA values by ∼10% [3,4]. Although it is a small percentage, it can still have an impact on transverse cracking occurrence, as the RA value requirement for freedom from cracking on straightening is relatively low >35–40% [3,5].
However, DRX does not occur in the base of the trough in these low C steels, Figure 1, and therefore if the RA value is 35–40% at the base, it can be taken that the steel will not show cracking during straightening at higher temperatures when the steel is fully austenitic, and the ferrite film is no longer there. Even if DRX occurs in the tensile test inflating the ductility, the absence of the ferrite film will enhance ductility sufficiently to avoid cracking on straightening [1].
Nevertheless, for austenitic steels, it is difficult from the tensile test to separate the ductility due to DRX, from that occurring in the un-recrystallised austenite, the latter being what is important for preventing cracks from forming during the straightening operation [1]. This problem has been found particularly so for the austenitic high Al, high Mn, TWIP steels where the ductility of un-recrystallised austenite actually decreases with increasing test temperature and may be well below the benchmark requirement of 35–40% to avoid cracking in the straightening operation temperature range, 700–1000°C [1]. For un-recrystallised austenite, the ductility is mainly dependent on the grain size and the size, volume fraction and location, either at the grain matrix or the boundaries, of any precipitation and the RA value will depend on how these variables influence grain boundary sliding (GBS) and recovery. For these high Mn TWIP steels grain boundary sliding is slightly more dominant than recovery for the temperature range 700–1000°C so the ductility of un-recrystallised austenite decreases with increasing temperature [1]. The RA value at 700°C is often less than 40%, so that the ductility may not meet the requirements for avoiding cracking on straightening.
Refining the grain size affects crack growth in many ways. It encourages DRX by reducing the critical strain required. However, importantly for the straightening operation, it reduces the crack aspect ratio, which controls crack propagation at the crack tip. It also makes it more difficult in propagating the smaller cracks formed by GBS in propagating through triple points. Finally, the increase in specific grain boundary area (for a given volume of precipitate) reduces the precipitate density on the grain boundaries making it more difficult for cracks to interlink [2].
A recent paper [6] has examined the hot ductility of high Al, high Mn, 0.6%C, TWIP steels with V additions in the range 0.05–0.7%, and although there was some evidence for grain size having an influence on ductility, the hot ductility appeared to be mainly dictated by the amount and size of the VC particles that were precipitated during the hot ductility tests.
When precipitation occurs, it is very difficult to separate the influence on hot ductility of grain size from that of precipitation, particularly because coarsening the grain size, which leads to a deterioration in ductility, is often associated with coarsening of the precipitates, which lead to an improvement in ductility [2].
Salas-Reyes et al. [7] and Mejía et al. [8,9] have also examined similar high Al, Mn TWIP steels having a variety of microalloying additions including V [7] and used two different cooling rates after casting, which gave a wide variation in the as-cast grain size. The grain size of the steel with no microalloying additions after cooling in a metallic mould at a rate of ∼60°C/min was ∼0.5 mm, whereas the grain size was coarser, ∼2 mm, when cooled at the slower rate of ∼1 °C/min in a sand mould. However, there was little difference in hot ductility behaviour for test temperatures >900°C for the two casting techniques, Figure 2, but for the temperature range 700–800 °C the finer grain-sized metallic casts gave a ∼20% improvement in the RA value. This suggests that grain size may be important, but again, the changes in ductility are small so that the likely normal experimental scatter (± 5% RA) makes interpretation difficult (Figure 2).
Hot ductility curves for a high Al, TWIP steel cooled at two different rates the metallic casting (MM) giving a grain size of ∼0.5 mm and the slower cooled sand mould (SM), ∼2 mm [7].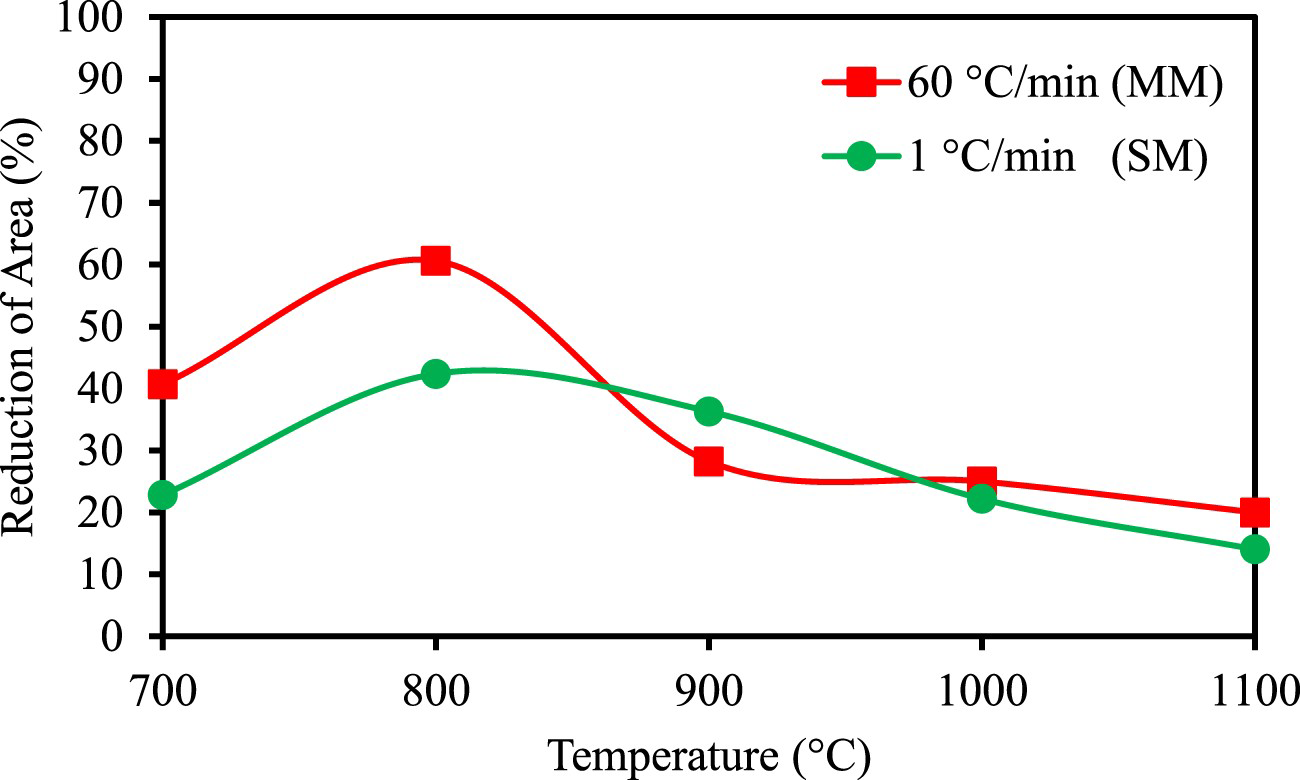
Kang et al. [6] also found that a B addition to these steels gave a 10–15% improvement in RA value, and this was again ascribed to segregation of B strengthening the boundaries rather than grain size even though there was a refinement in grain size on adding B (∼700–500 µm). This was because segregation of B to the boundaries had been positively identified, and that strengthening the boundaries, as in creep [10,11], was the more widely accepted explanation.
However, a closer examination of Kang et al. results [6] establishes a clearer relationship between the influence of precipitation and grain size on the hot ductility of un-recrystallised austenite. It also helps to explain the shape of the hot ductility curves in these high Al, TWIP steels and these two aspects form the basis of this paper.
Experimental and results
The full experimental conditions and results can be found in Ref [6]. The steels were produced as experimental 50 kg vacuum melt ingots, which after removing the shrinkage cavity at the top, had dimensions 170 × 220 × 100 mm. The tensile specimens were 120 mm long and 10 mm in diameter and machined from the as-cast ingots in the direction of casting.
A Gleeble machine was used to carry out the tensile tests. The samples were initially heated at a rate of 150°C/min to 1250°C, where they were held for 3 min. They were then cooled at a rate of 60°C/min to test temperatures in the range 700–1100°C. On reaching the test temperature, they were held for 30 s before straining to failure using a strain rate of 3 × 10⁻³ s−1. The temperature profile is shown in Figure 3.
Schematic diagram for processing of the tensile specimens.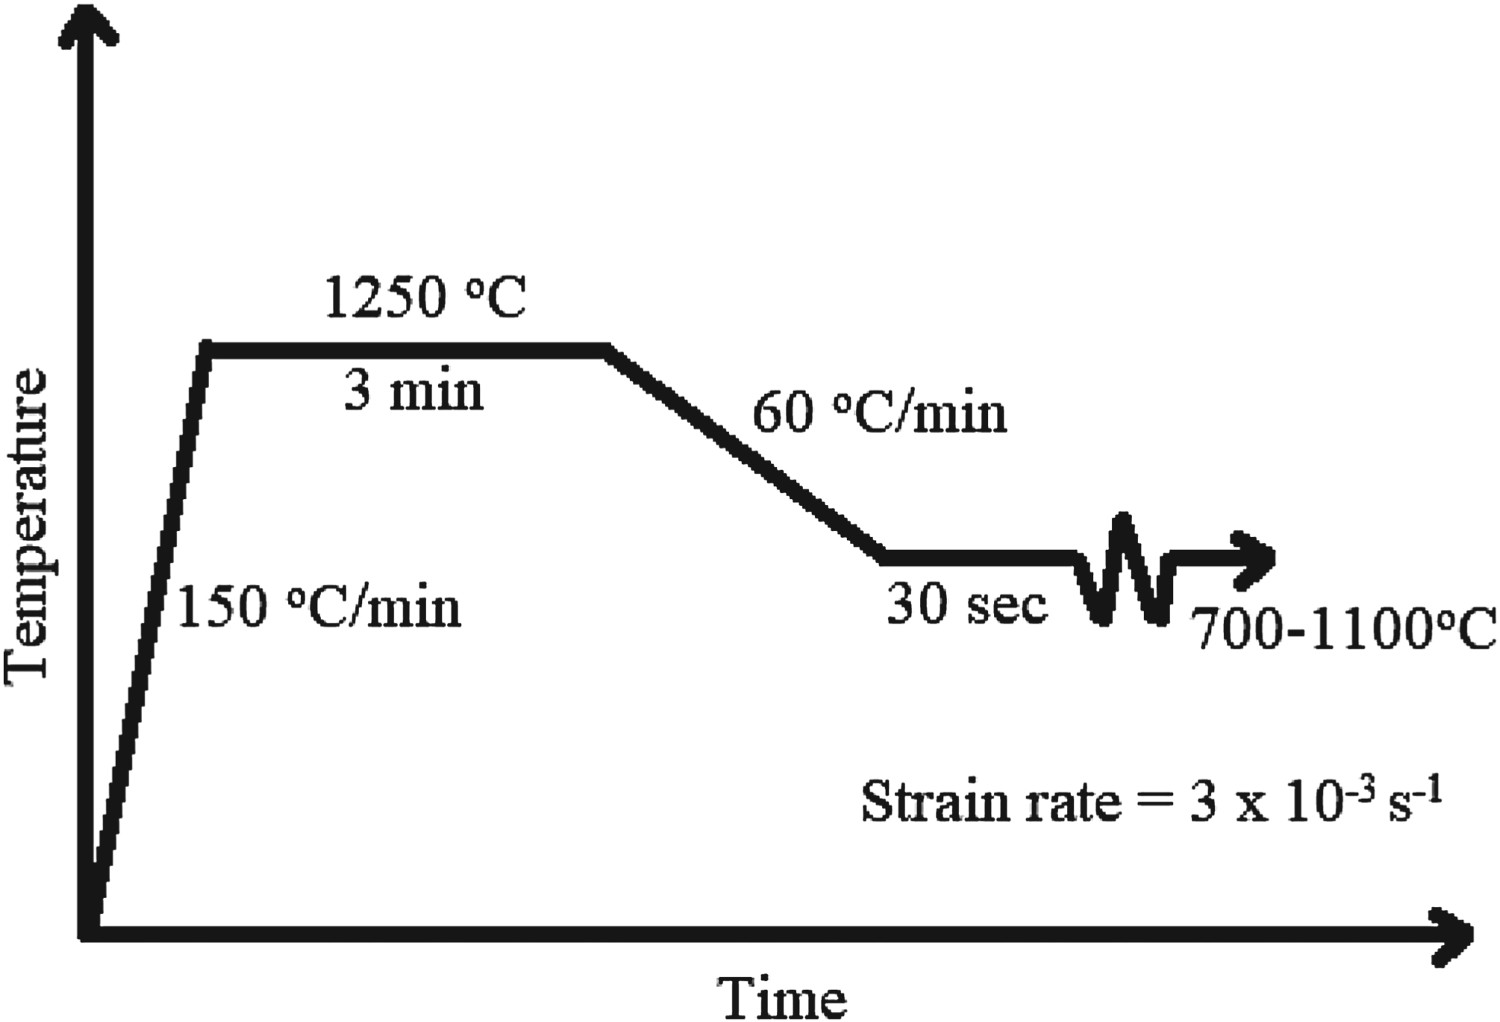
Composition of TWIP steels (wt-%) having variation in V and N contents but otherwise similar compositions [6].
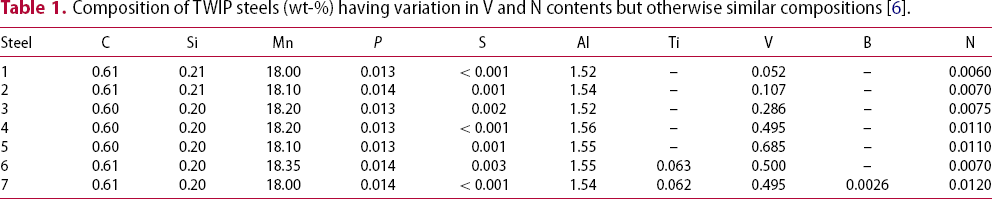
The steels all have a high Al addition (1.5%Al) and the V varied from 0.05% to 0.7%. Two of the steels, 6 and 7, have a Ti addition of ∼0.06%, and one of these steels, steel 7, has a B addition, a necessary requirement to prevent cracking. The high Al content in the steel encourages the AlN to precipitate out at the grain boundaries. However, the precipitation of AlN is sluggish [11], and it needs MnS inclusions as a nucleate to encourage its precipitation [5]. The steels all had very low S content (≤0.003%S) so as to limit the MnS inclusions, the favoured site for AlN precipitation and hence encourage precipitation of AlN in the matrix rather than at the boundaries where it causes the ductility to markedly deteriorate [1,6]. Also, B preferentially segregates to MnS inclusions rather than the grain boundaries [12], and so by reducing the S content, most of the MnS inclusions are removed, and the B is allowed to segregate un-impedingly to the boundaries and improve ductility.
The influence of chemical composition on hot ductility
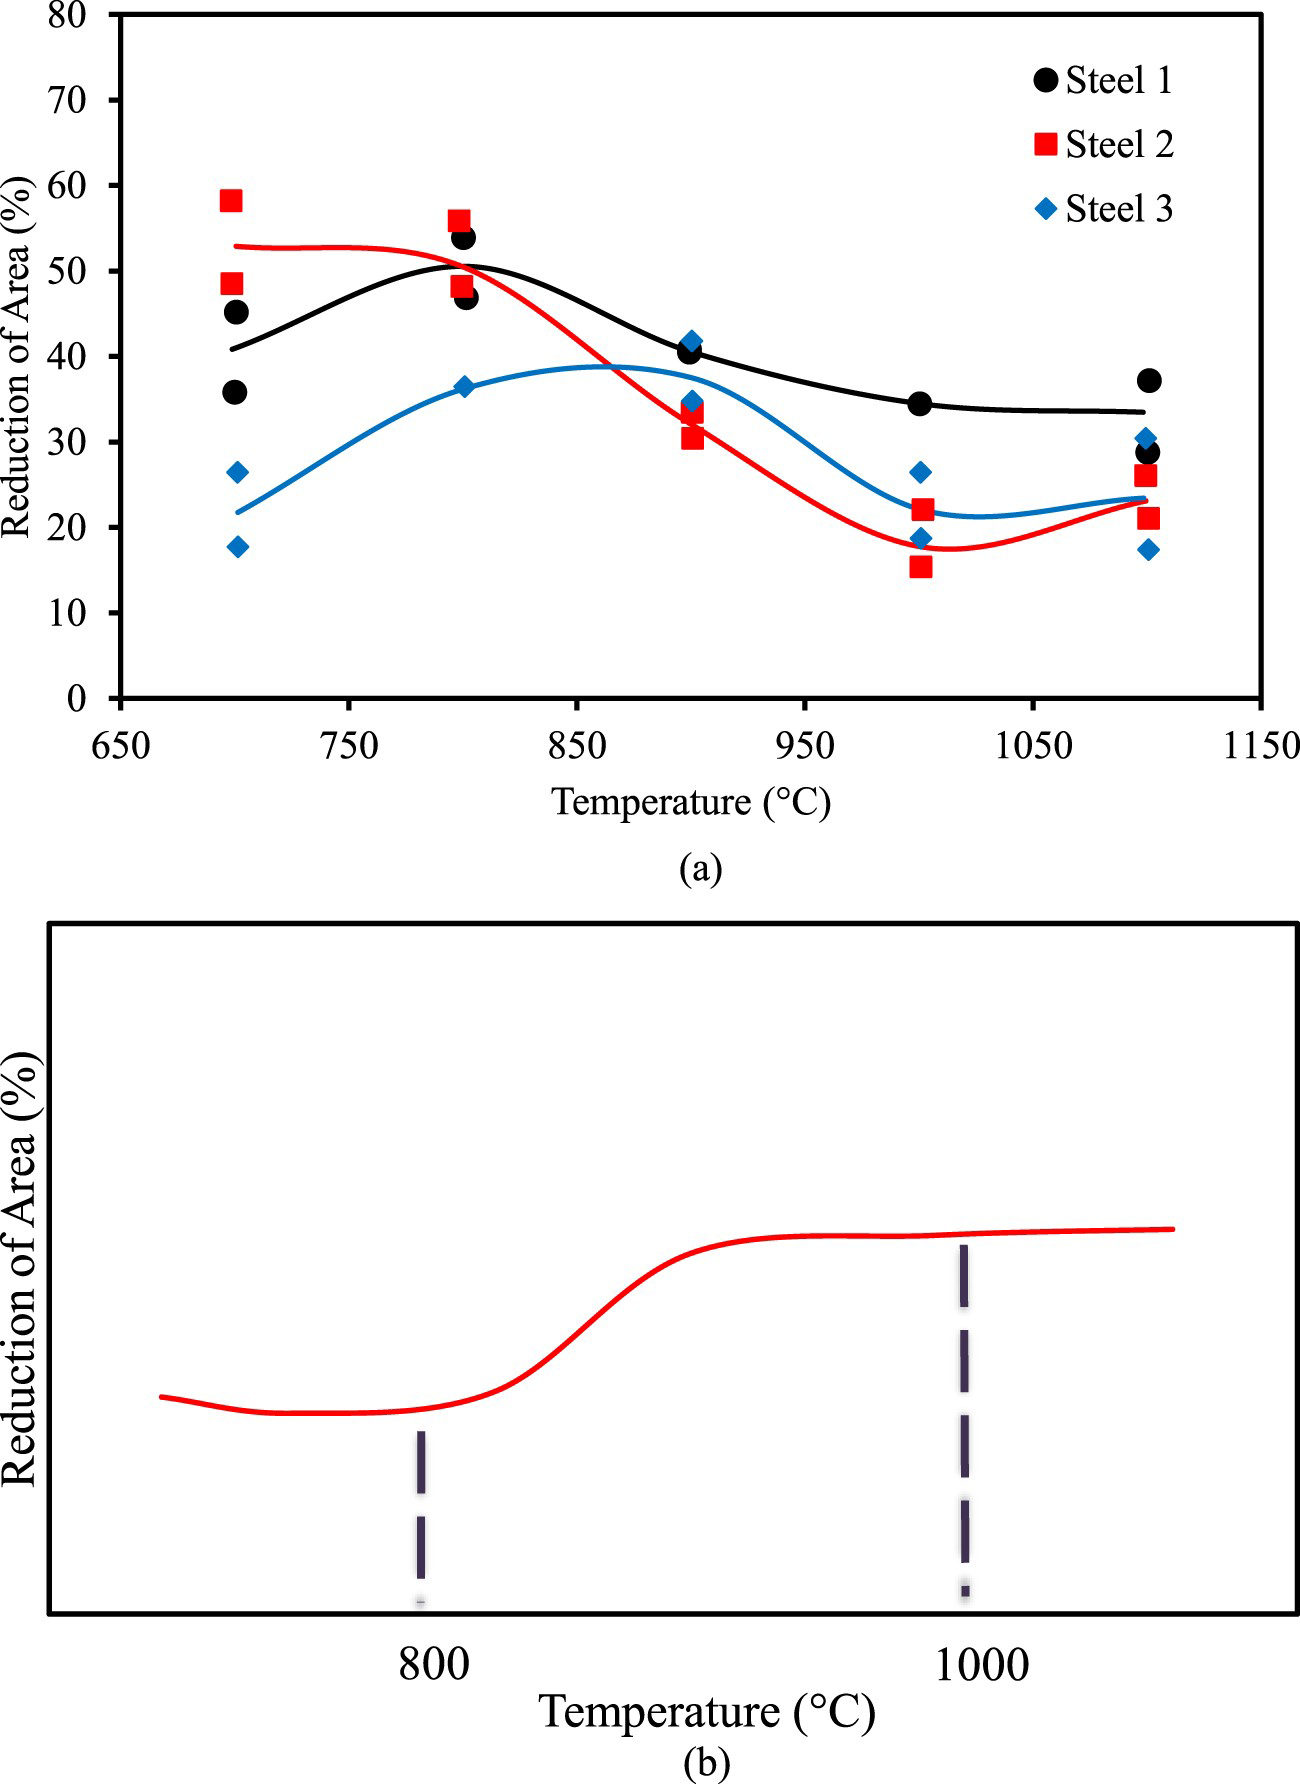
The hot ductility curves are given for the V containing steels TWIP steels, 1–5, in Figure 4(a), and those for steels 4–7 are shown in Figure 4(b). The shapes of the curves given in Figure 4(a) are very complex. They can essentially be split into two very different types of curves, one in which the RA decreases with temperature for test temperatures ≥800°C, Figure 5(a) and one in which the RA increases with test temperature for test temperatures ≥800°C, Figure 5(b). Steels 1–3, Table 1, fit into the Figure 4(a) category, and steels 4–7 follow a different path with the ductility on cooling decreasing with the decrease in temperature at test temperatures in the range 1000–1800°C, Figure 4(b) and Figure 5(b).
Hot ductility curves for high Al TWIP steels (a) having V contents of 0.05–0.7%, steels 1–5, (b) only the high V containing (0.5–0.7%V) steels; the Ti free, steels 4 and 5 and Ti containing, steels 6 and 7, all of which had similarly shaped curves [6]. All steels, 1–7, had low S contents <0.003%. Shape of hot ductility curve for (a) steels 1–3, with RA decreasing with test temperatures in excess of 800°C, (b) for steels, 4, 5, 6, 7, ductility increasing with temperatures in excess of 800°C for the temperature range 800–1000°C.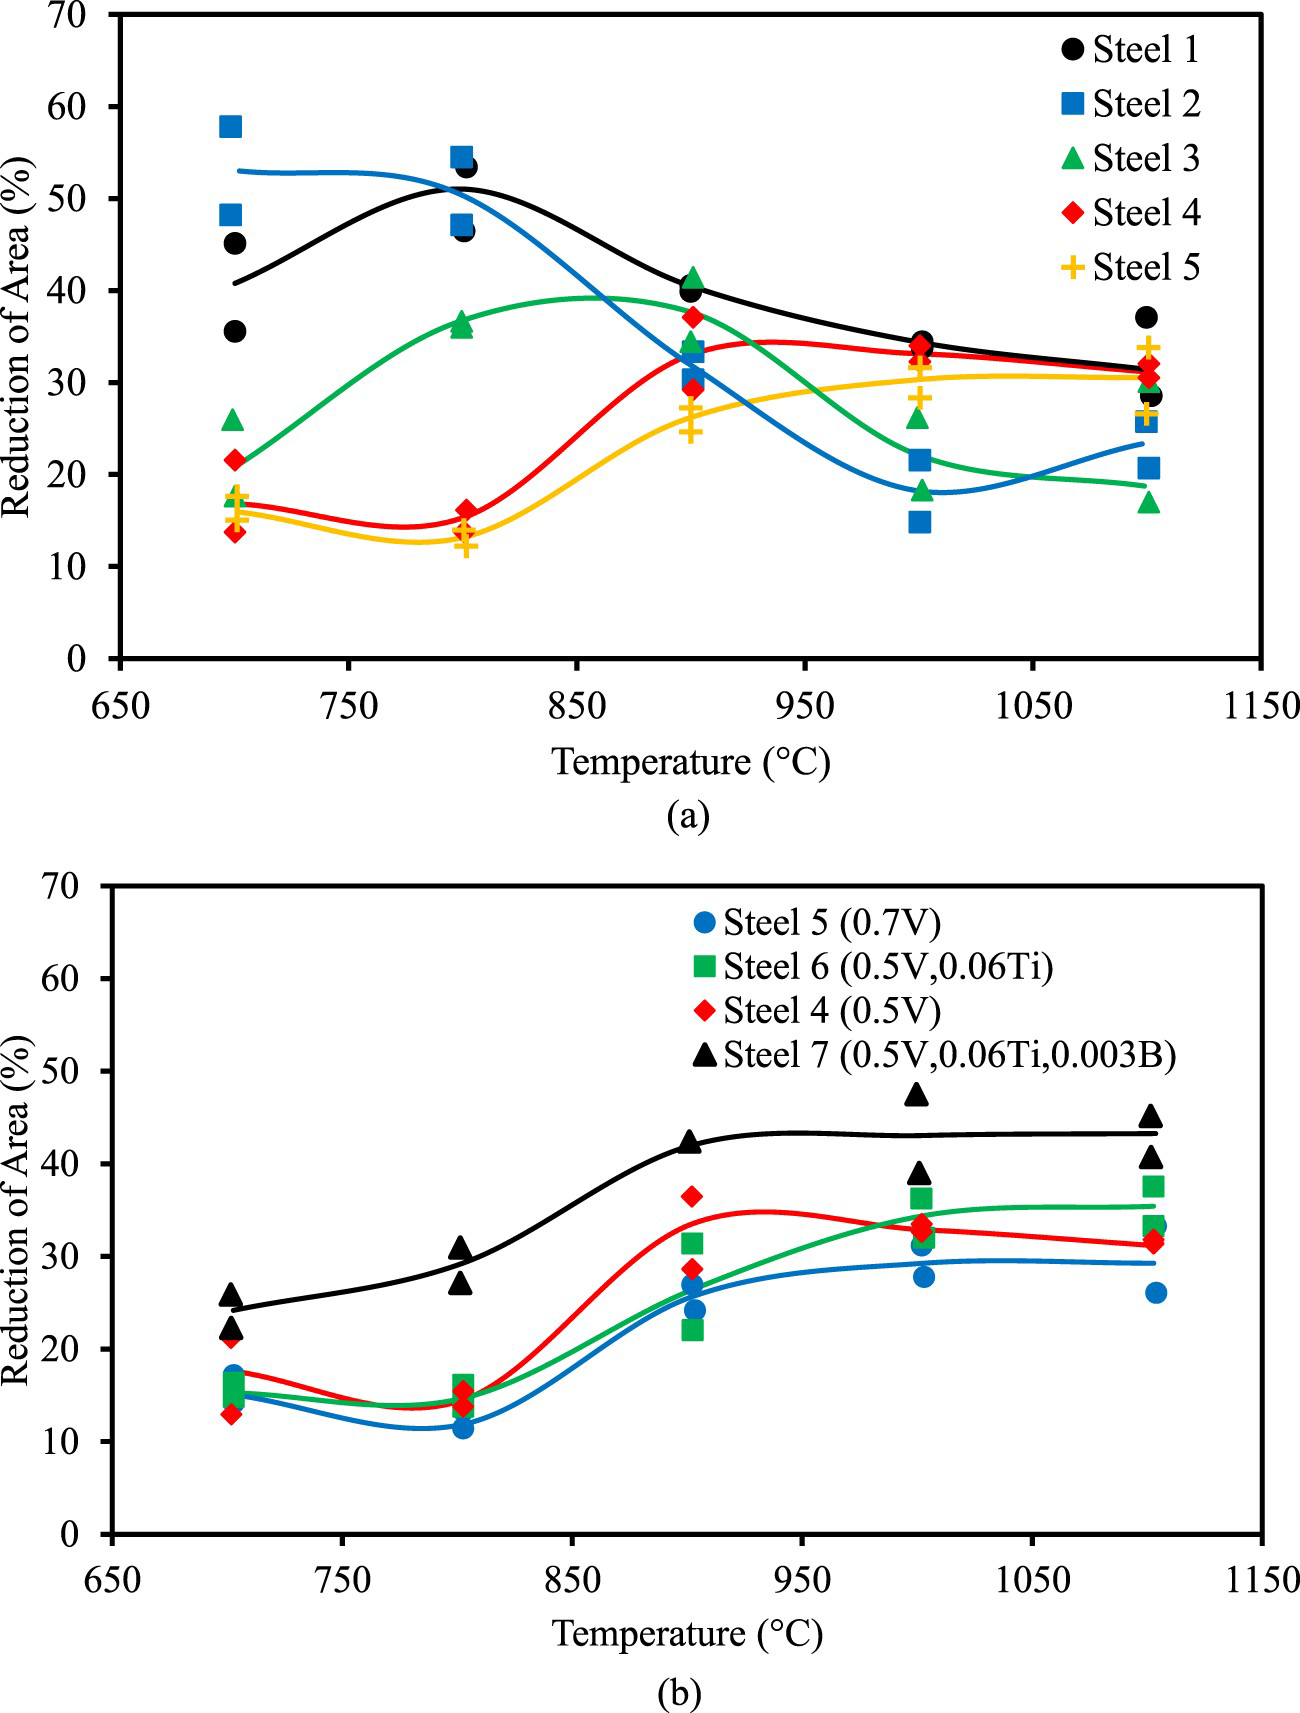
Influence of austenite grain size on hot ductility
To interpret the shape of these hot ductility curves, it is necessary to separate the influence on the hot ductility of grain size from that of precipitation.
As-cast grain size for the V containing steels 1–7 and the RA value at 1000°C.
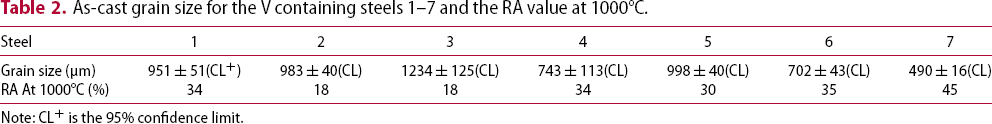
Note: CL+ is the 95% confidence limit.
Previous work [14] had established a curve of precipitate size against RA for low C, C-Mn-Al-Ti and C-Mn-Nb-Al steels, Figure 6 shows that when the precipitate size exceeds 30 nm there is little further change in ductility.
Influence of particle size on the RA for Ti containing steels, tensile tested 950–1000°C [14].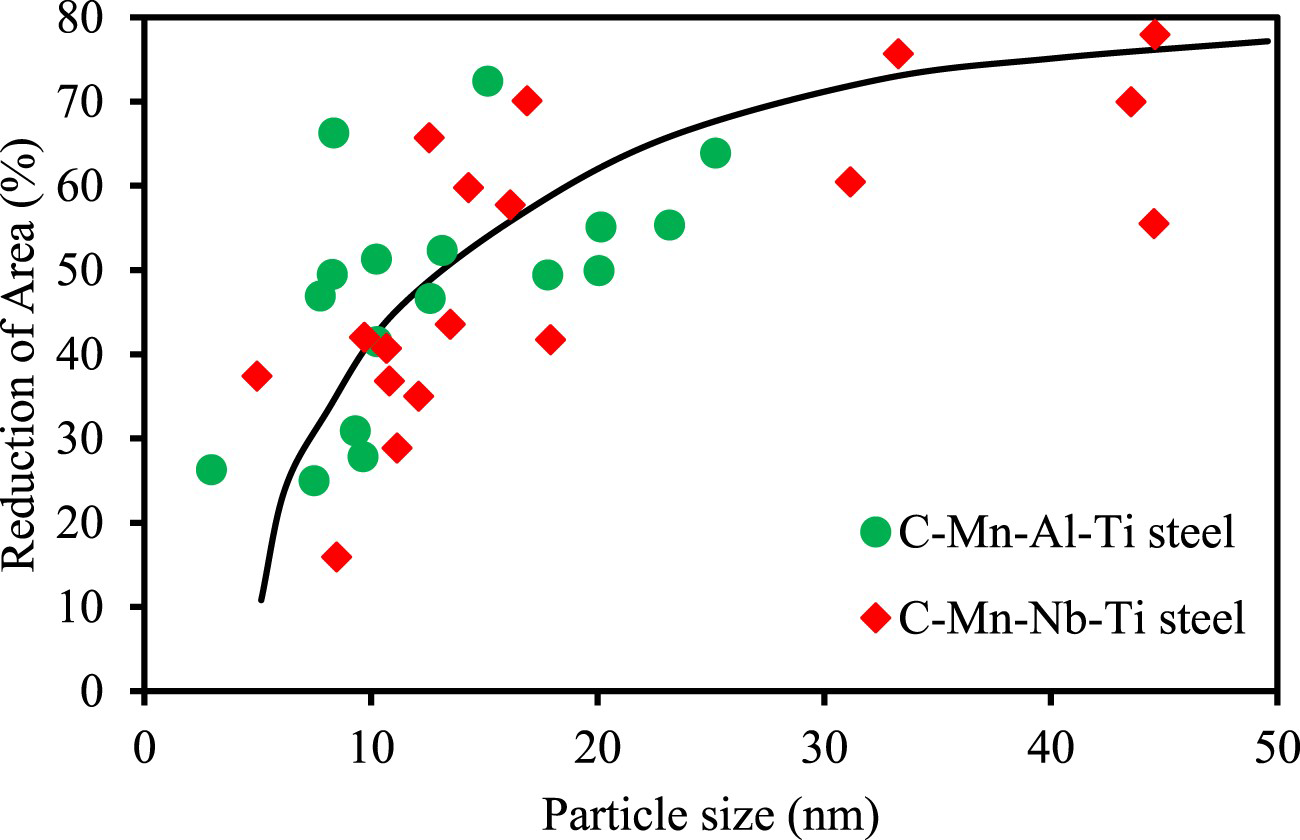
It has also been found that when the precipitate size is greater than 15 nm in Nb containing coarse-grained C-Mn-Al steels, cracking does not occur on straightening [15]. Although there may be further changes in ductility with coarsening in excess of 30 nm these are likely to be relatively small (<10% RA) (Figure 6). Hence, to examine the influence of grain size on RA in these austenitic TWIP steel, a test temperature has to be chosen in which the precipitation size of the VC is either ≥30 nm, Figure 6 or precipitation of VC is absent, that is, conditions which will not influence the hot ductility significantly.
No VC precipitation was found to be present throughout the temperature range of interest for the straightening operation, 800–1000°C for either, steel 1 or 2, (0.05 and 0.1%V, respectively), Table 1 and Figure 7(a,b).
Steel 2 (0.1%V), in which no fine VC precipitates were extracted at either (a) 800°C or 1000°C and the same applied to Steel 1 (0.05%V) [6]. The coarse particles in the figures are iron oxides.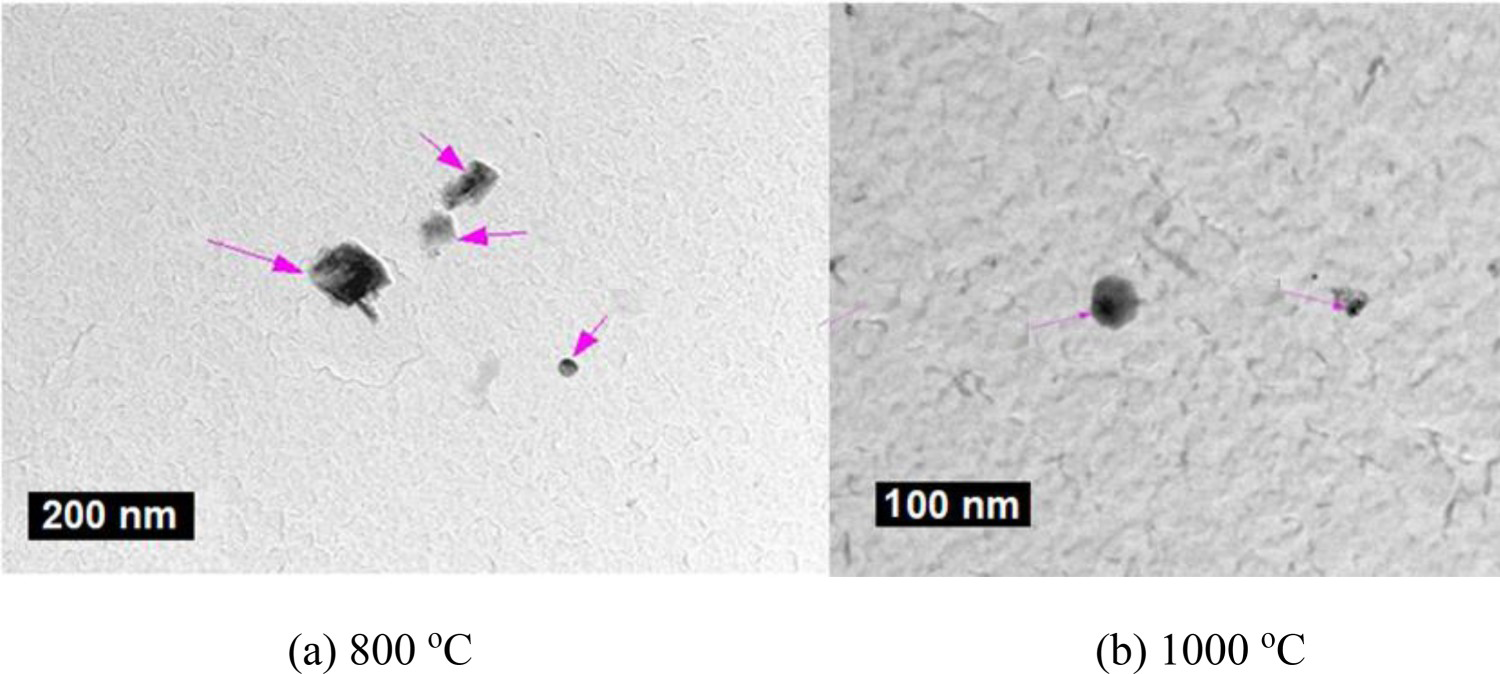
Fine precipitation of VC (<15 nm) only started to appear when the V level increased to 0.3%, and then only at 800°C, Figure 8(a,b). However, for steels, 3–7 in Table 1 which shows VC precipitation at 1000°C, the precipitate size of the VC at 1000°C was ≥30 nm this being so even at 900 °C, as shown in Figure 8(c) [6].
(a) Steel 3 tested at 800°C, (b) Steel 5 tested at 800°C and (c) Steel 7 tested at 900°C [6].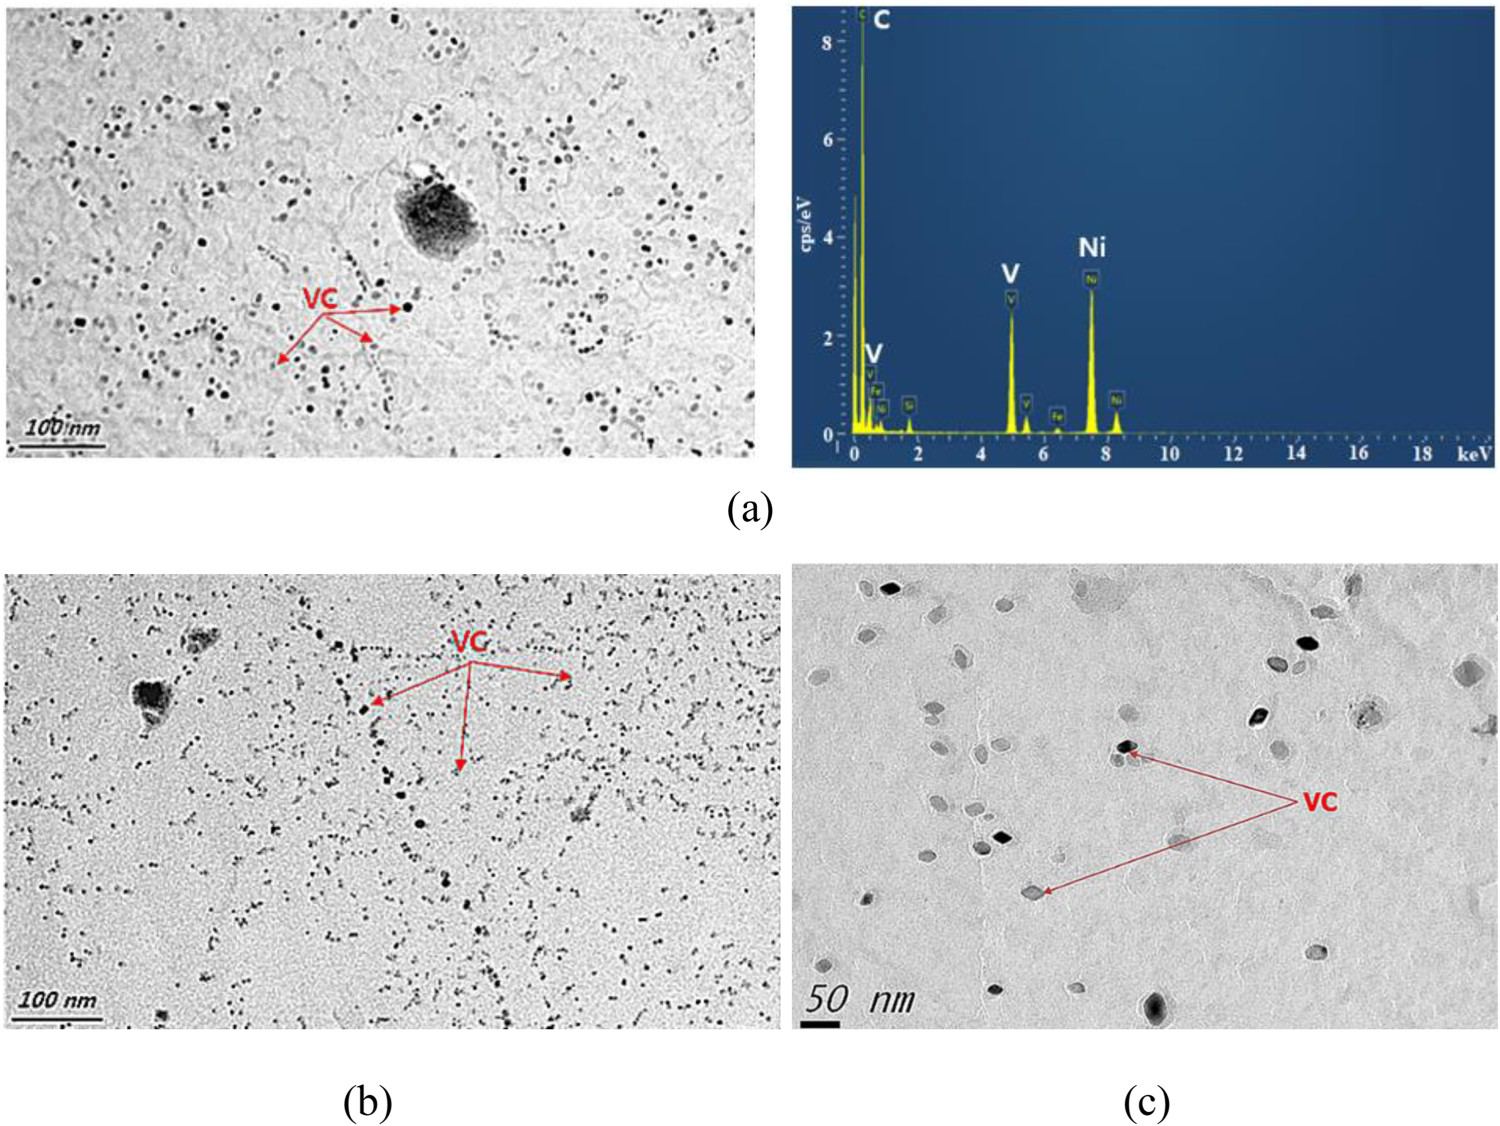
Moreover, at 1000°C, no DRX took place in any of the steels. Hence, at this test temperature of 1000°C, either the precipitates are too coarse to influence hot ductility significantly or there are no VC precipitates, as Steels 1 and 2. This test temperature then presents itself as an ideal temperature for isolating the influence on hot ductility of grain size. The grain size measurements are given in Table 2, and the RA values at 1000°C against grain size are plotted in Figure 9. Included in this figure is the austenite grain size of two steels of similar composition having no V and their RA values at 1000°C [16]. This indicates that grain sizes in excess of 300 µm, which were regarded as having no further influence on hot ductility [17] can still have an important influence. A change in grain size from 500 to 1250 µm, the range of grain size present in these V containing steels, 1–7, causes a ∼25% decrease in the RA value (Figure 9).
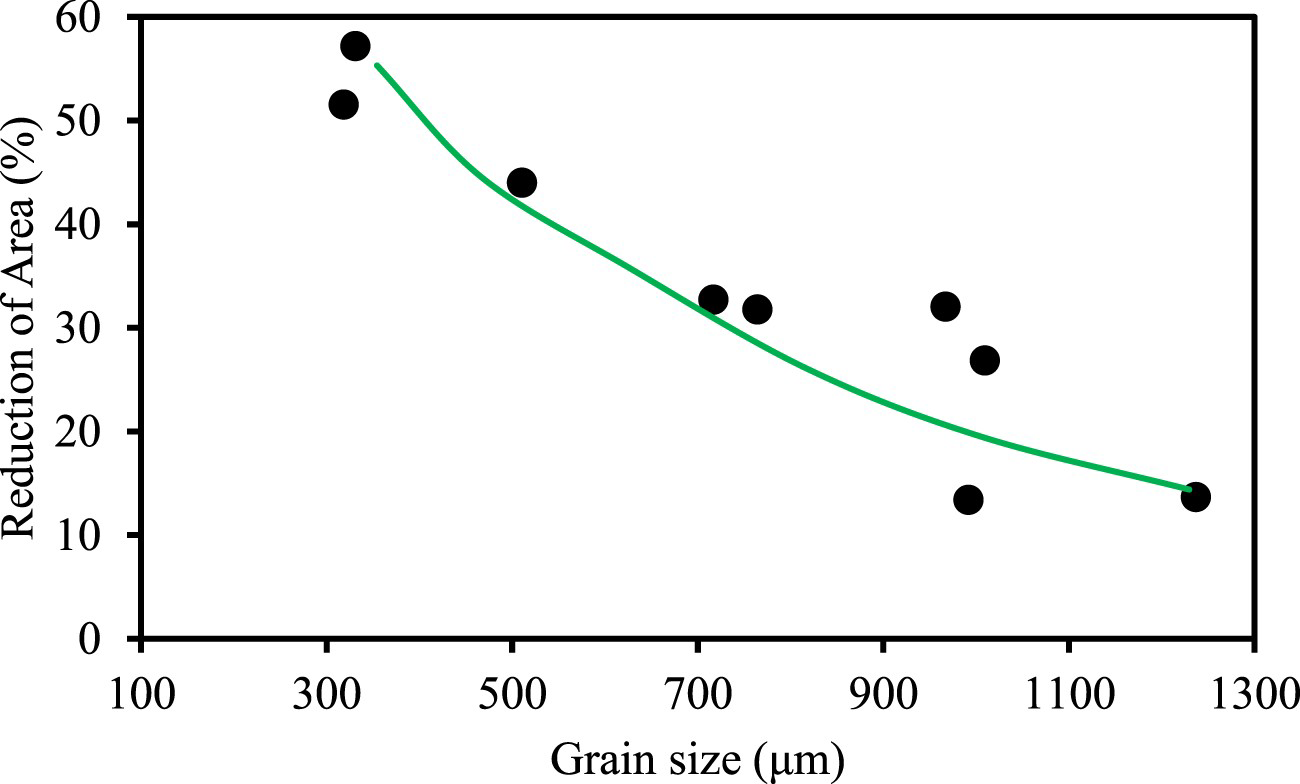
Previous work on low C steels [17] had shown a similar curve of grain size and RA value and the results for the high C, TWIP steels can be seen to fit well onto this curve (Figure 10). In this previous work, the RA value at the base of the trough, (which corresponds to the minimum RA when DRX does not take place) was taken as the appropriate RA value to use for each grain size measurement.
Influence of grain size on RA% value for low C steels showing a ductility trough. The RA value was taken at the temperature corresponding to the minimum ductility on the hot ductility curve, that is, at the base of the trough and hence corresponds to that for the un-recrystallised condition. D0 is the un-recrystallised grain size before deformation [5,17]. The black circle points are for the present grain size measurements on the high C, TWIP steels.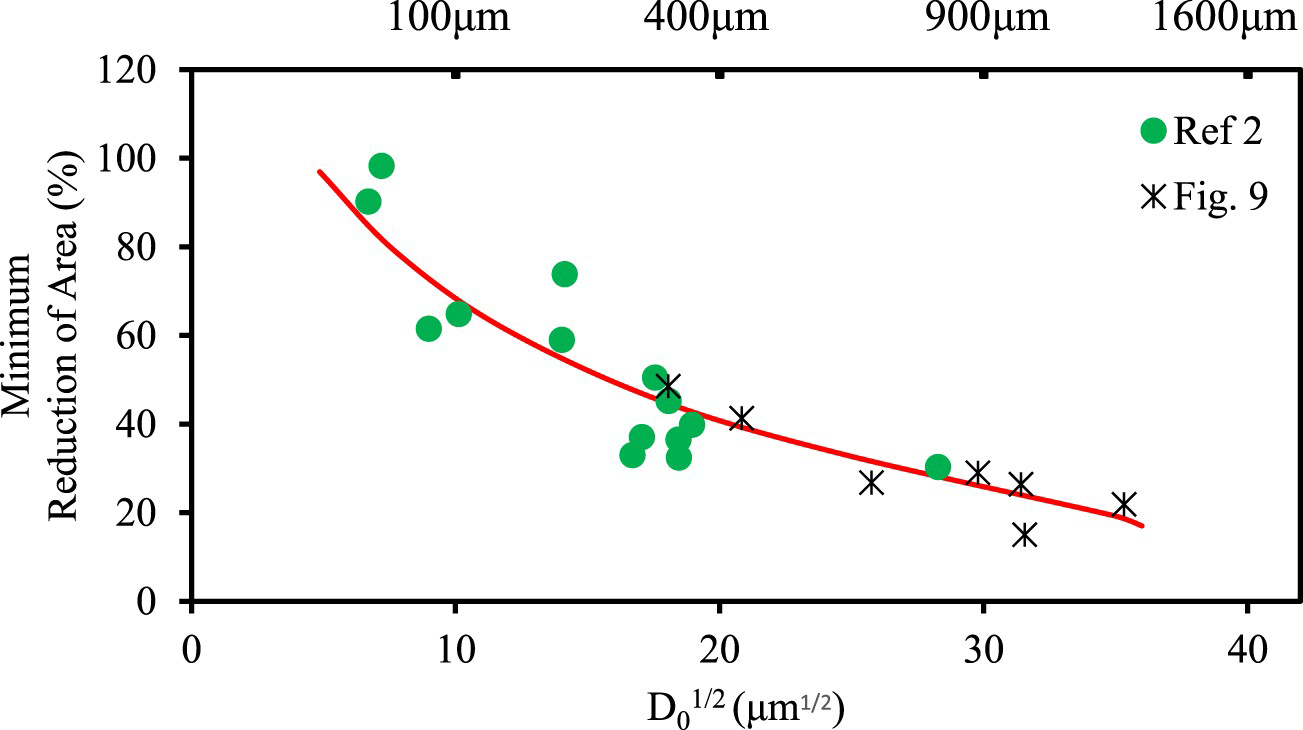
The curve of %RA against V content (Figure 11) shows that V or VC is not responsible for these grain size changes. It is also interesting that the ductility at this test temperature 1000°C is very low ∼28%RA and would lead to the likelihood of cracking on straightening. Although the N levels were higher at the higher V levels in these steels, it is unlikely that this could account for the deterioration in ductility that has been observed, which is credited to VC precipitation.
Influence of V on the RA value. Figures adjacent to points are the grain size in µm.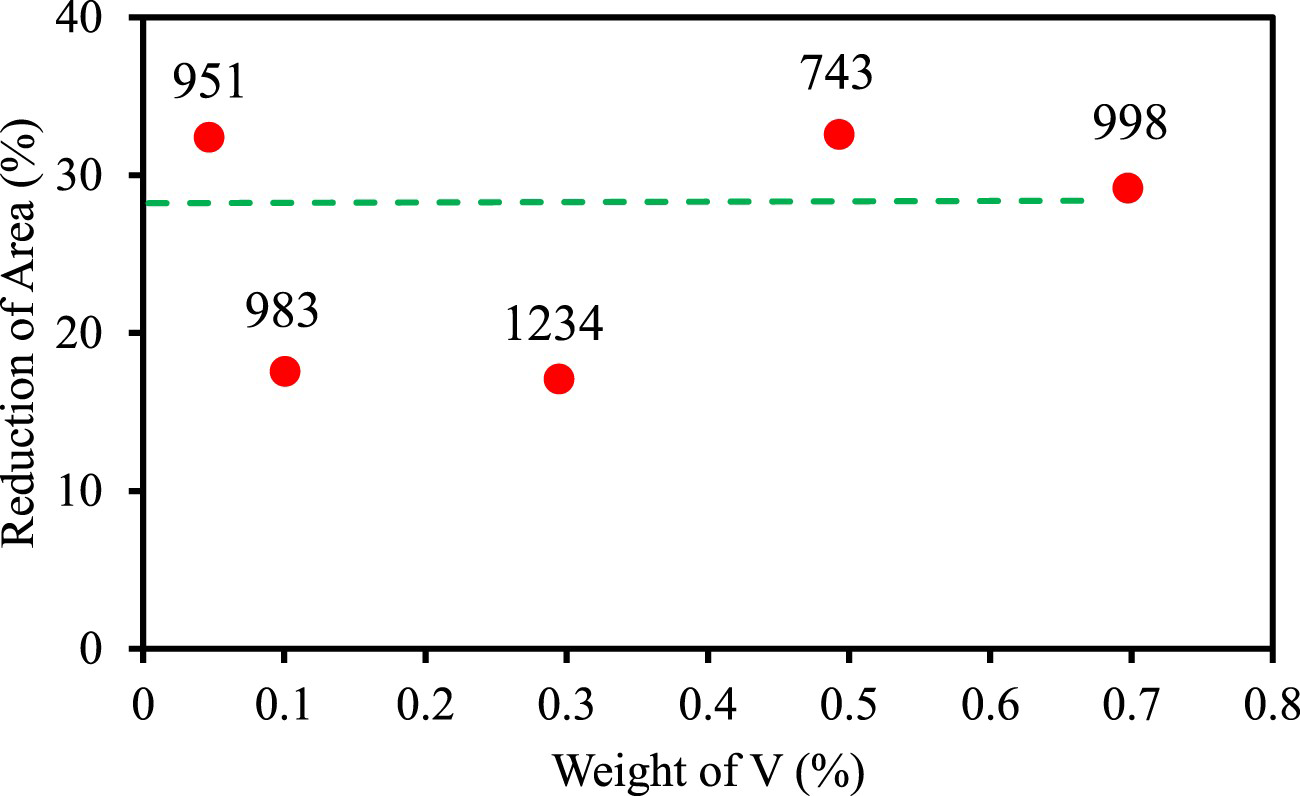
Little difference was noted in the hot ductility curves, Figure 4(b) for the 0.5%V with and without Ti, suggesting that Ti was also not having a significant influence on the hot ductility [6].
B, in contrast, gave a significant improvement in ductility throughout the straightening temperature range, and this can be accounted for by its finer grain size Figure 4(b) and Table 2. A change in grain size from 702 µm, steel 6 (B-free) to 490 µm, steel 7 (B containing), corresponds to ∼10% improvement in the RA value according to Figure 9, which is the same improvement shown in the hot ductility curves on adding boron, Figure 4(b). Thus, although it has been shown that B segregates to the boundaries in these steels, it probably improves ductility by the segregation causing grain refinement on solidification by solute drag rather than by strengthening the boundaries.
Recent work by Salas-Reyes et al. [19] has also shown that for these high Mn high Al steels, B improves ductility by being able to segregate to the austenite grain boundaries and refine the grain size and structure on solidification. The very highly alloyed TWIP steel examined had the base composition 0.09%C, 27%Mn, 3%Al, 0.85%Ni, 1.75%Cr, 0.3%Mo, 0.03%Ti and 0.012%N. Two additional steels were made with the same base composition but having 0.018%B and 0.047%B. The solidification start temperature was the same for all steels independent of the composition at 1376°C. However, the solidification end temperature decreased as the B level increased, being 1313°C for B-free, 1280°C for 0.018%B and 1190°C for 0.047%B containing steels. This reduction in solidification end temperature was accompanied by a refinement in the dendritic grain size [19].
Thus, a boron addition improves the hot ductility of these high Al TWIP steels by (1) segregating to the austenite grain boundaries and (2) in consequence refining the grain size most probably by solute drag.
Explanation for the shape of the hot ductility curves
The shape of the hot ductility curves is complex and can change from one in which the ductility decreases with an increase in test temperature, Figure 5(a), to one in which ductility increases with test temperature, Figure 5(b). This behaviour in these TWIP steels can be explained by examining the type of precipitation and the influence of the test temperature on GBS.
Generally, it has been found that when austenitic steels are tested in the temperature range 700–1000°C at the low strain rate used in the tensile test, 10−3 s−1 to 10−4 s−1, (the strain rate of the straightening operation when thick slab casting), provided there is no DRX, the RA value is approximately constant. The degree of grain boundary sliding is balanced by that of recovery as the temperature increases. However, in contrast, for these V containing 18%Mn, austenitic TWIP low S steels, ductility is found to very slowly deteriorate with an increase in temperature in the temperature range 700–1000°C. This is due to GBS being slightly more dominant than a recovery with increasing test temperature. On average, this decrease has been shown [1] to be ∼10%RA for high Mn TWIP steels having a variety of microalloying additions but more specifically for V containing steels, 15%, Figure 4(b) [1].
The ThermoCalc software programme is very useful here in helping to interpret the precipitate behaviour and the predictions are shown for steels 1 and 2 in Figure 12 (the rest of the predictions for steels 3–7 can be found in reference [6]).
ThermoCalc predictions for V containing steels, 1 and 2, showing VC does not precipitate out above 890°C [6].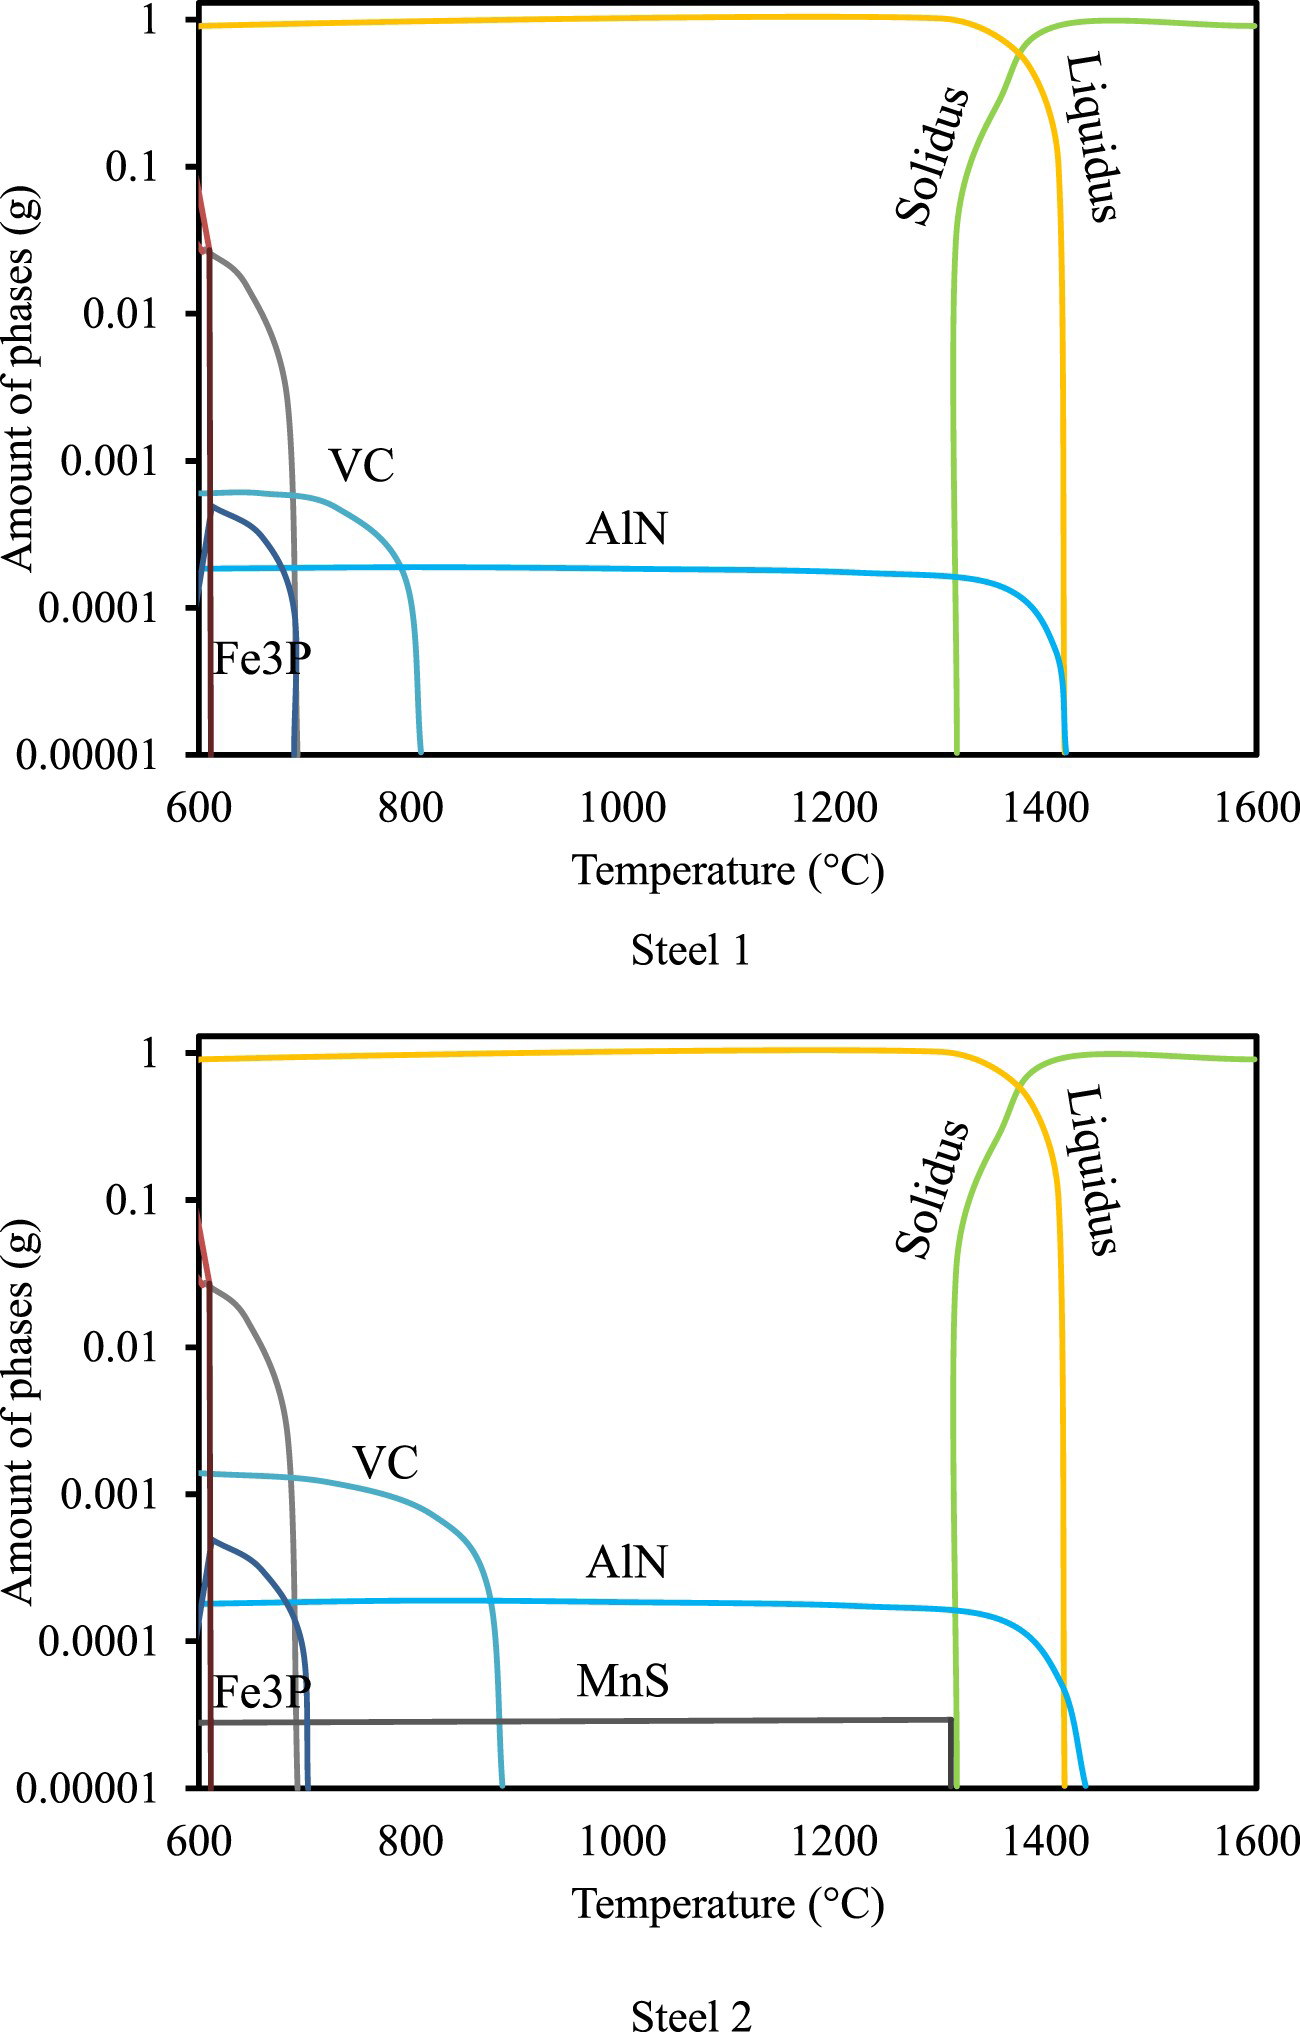
Of the precipitates present, AlN is always the first to precipitate out on solidification, but importantly, the precipitate that forms in the straightening temperature range 700–1000°C is VC. The ThermoCalc Software programme calculates that VC first starts precipitating at higher and higher temperatures as the V level increases, being 810°C for the 0.05%V and 890°C for 0.11% vanadium-containing steel, Figure 12, up to as high as ∼1100°C for the 0.7%V containing steel Figure 12 [6]. The ThermoCalc calculations combined with TEM (transmission electron microscope) work can then be used to explain the hot ductility behaviour and the shape of the curves. This with the model shown in Figure 13, can be used to interpret most of the hot ductility curves in Figure 4(a) and consists of two separate curves meeting up at 900°C, one with the hot ductility improving with increasing test temperature (green curve Figure 13) and the other with the hot ductility deteriorating with temperature (red curve). The red curve is for the steels 1 and 2, 0.05 and 0.10%V, respectively, and the green curve for steels 4–7 (0.5–0.7%V). The blue-dashed curve represents the change-over from one type of curve to another at the 0.3%V level.
Model to interpret the shape of the V containing hot ductility curves steels 1–7.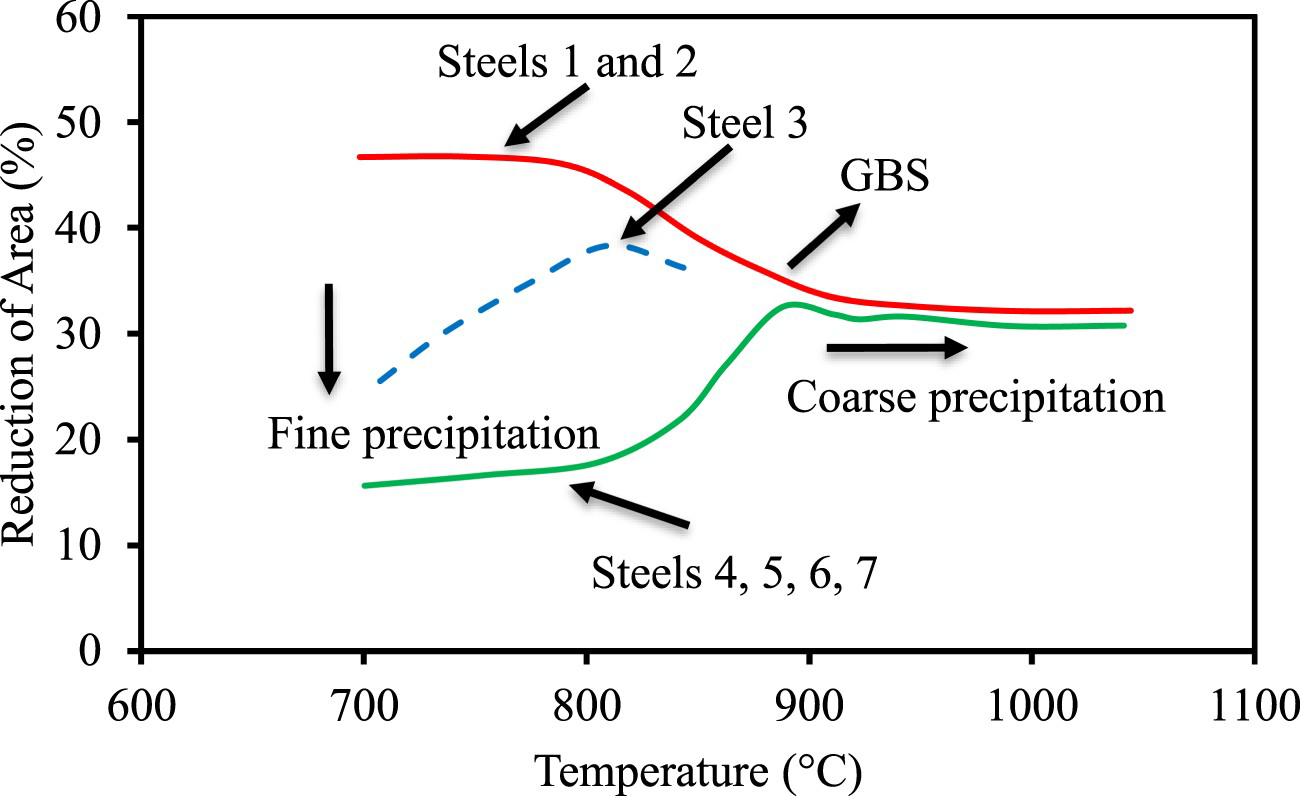
For steels 1 (0.05%V) and 2 (0.11%V), no precipitation of VC was found throughout the straightening temperature range 700–1100°C (Figure 7) in accord with the high RA values of 45–55% at test temperatures of 700 and 800°C, Figure 5(a) and Figure 13. This indicates that precipitation could only take place below the straightening temperature range. Originally it was suggested that the poor ductility of steel 2 in the higher temperature range >900°C might be due to VC precipitation [6] but the present more extensive examination has found that no VC is present. This absence of VC precipitation is also suggested by the ThermoCalc software programme, which shows that precipitation in the 0.11%V containing steel has to be below 900°C before any precipitation can take place. It is, therefore, no surprise that there is no VC present in this steel under the non-equilibrium conditions applying, that is, cooling at 60 °C/min, which would be expected to delay precipitation to even lower temperatures. Even under ThermoCalc equilibrium conditions, no precipitation would have been expected to take place above 900°C for these two steels. Fine precipitation of VC will occur at lower temperatures than 800°C but will not be of concern, as the straightening temperature range is at higher temperatures.
With steels 1 and 2, ductility is good at test temperatures of 700–800°C as there is no precipitation. As the test temperature increases ductility deteriorates very slowly due to grain boundary sliding slightly outpacing recovery (Figure 5(a) and Figure 13). This continues up to a 1000°C.
On increasing the V level to 0.3%, fine precipitation (4–8 nm) of VC starts to appear at 700–800°C, and the RA value in this temperature range deteriorates significantly decreasing from ∼50% (no precipitation) to 34%, Figure 5(a) and Figure 8(a). It has been shown that when the precipitation size is < 15 nm, Figure 6 and Figure 8(a), ductility is seriously impaired [1]. However, on cooling at temperatures higher than ∼900°C, the precipitates are too coarse ( ≥ 30 nm) to significantly influence ductility, but the RA value does not return to the former high value at 700–800°C of 45–55% RA achieving only ∼35%, Figure 5(a) because GBS is greater at these higher temperatures than at 700°C, (red curve in Figure 13). Ductility in the temperature range 700–800°C deteriorates more and more as the volume fraction of fine VC precipitates increases, steels 3–7, Figure 4(b) and the green curve in Figure 13. However, at higher temperatures, 900–1000°C the precipitation is too coarse to significantly influence the hot ductility but as mentioned the ductility does not return to its high values at 700–800°C, because it is further down, the red curve in Figure 13 and GBS is greater.
Because of the greater volume fraction of VC precipitated by the 0.5% and 0.7%V, further reductions in the RA values to 15% and 12%, respectively, occur in the temperature range 700–800 °C (Figure 8(b)). However, for test temperatures ≥900°C, the precipitates have grown to a size ≥30 nm, so that they no longer have much influence on ductility.
To understand the hot ductility curves, there are three important points that have to be taken into account, and the model interpreting their shapes are shown in Figure 13.
The RA value when there is no DRX, decreases gradually with increase in temperature for these high Mn TWIP steels (∼10% from 700 to 1100°C) [1]. For V containing high Mn TWIP steels, the fine (< 10 nm) dynamically precipitated VC precipitates, which seriously impair the ductility, are only present in the temperature range 700–900°C. At temperatures higher than ∼900°C, precipitation is too coarse, so will only have a small influence in further deteriorating the ductility. Increasing the V level will cause the VC to start precipitating out at higher and higher temperatures but again at ∼900°C it will be too coarse to influence ductility significantly [1].
Thus, for the temperature range 700–800°C, the RA value continually falls with increasing V content for steels 1–7 as more and more fine precipitation takes place (Figure 13).
At 900°C the precipitates are sufficiently coarse not to influence ductility anymore so the two curves join up together, Figure 13. The ductility recovers to higher RA values for the steels 4–7 but not so for steels 1–3; the ductility continuing to very gradually fall with an increase in test temperature.
Finally, as noted in the previous paper [1], if DRX occurs, this results in a bulge in the curve, as seen in the red curve in Figure 14, indicating ductility is much better than it really is for the straightening operation.
The shape of the curve when DRX occurs.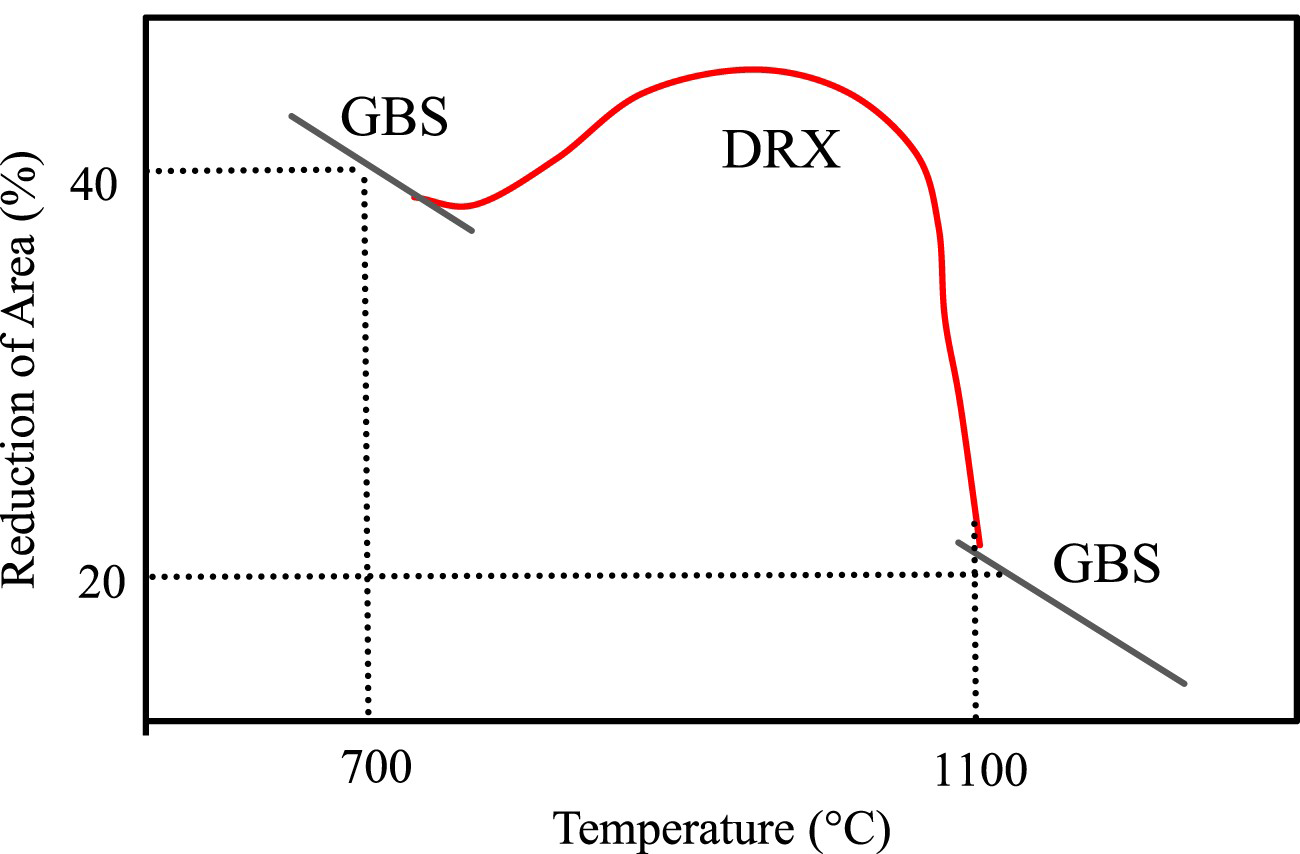
Conclusions
A change in grain size from 450 to 1250 µm results in a ∼25% decrease in the RA value for un-recrystallised austenite. The analysis of the results suggests that B improves the ductility in these steels not by strengthening the grain boundary region but by segregating to the boundaries during solidification and probably exerting a drag on them, preventing grain growth, resulting in a finer grain size on solidification. Because in these steels, the ductility of un-recrystallised austenite decreases gradually with increase in temperature in the range 700–1000°C, precipitation can markedly change the shape of the hot ductility curve from the one in which ductility decreases with increase in temperature to vice versa.
Footnotes
Disclosure statement
No potential conflict of interest was reported by the author(s).